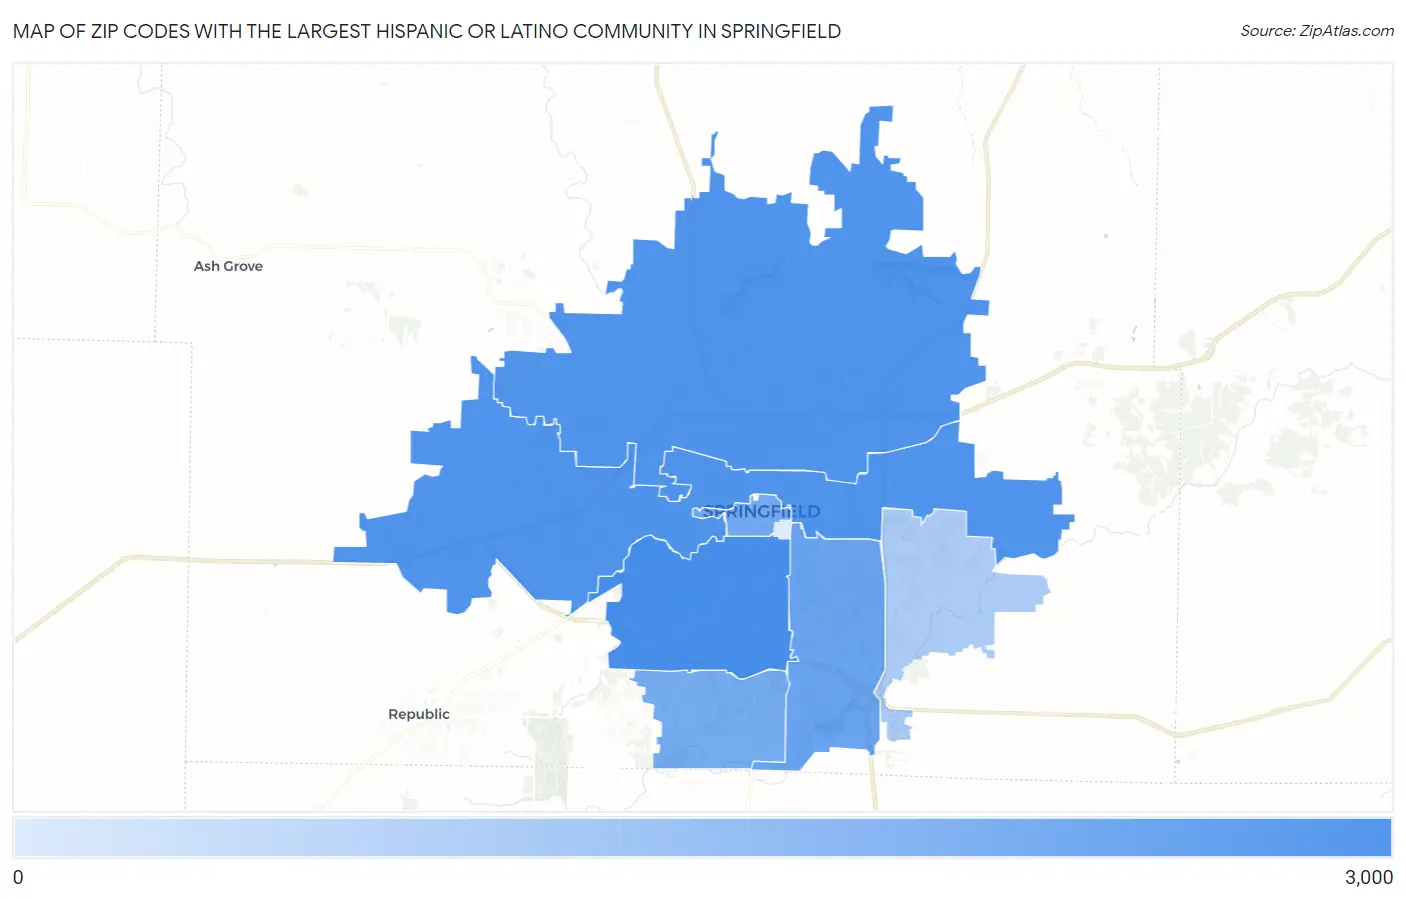
Zip Codes with the Largest Hispanic or Latino Community in Springfield, MO
RELATED REPORTS & OPTIONS
Hispanic or Latino
Springfield
Compare Zip Codes
Map of Zip Codes with the Largest Hispanic or Latino Community in Springfield
76
2,718
Zip Codes with the Largest Hispanic or Latino Community in Springfield, MO
| Zip Code | Hispanic or Latino | vs State | vs National | |
| 1. | 65807 | 2,718 | 280,078(0.97%)#18 | 61,755,866(0.00%)#4,842 |
| 2. | 65803 | 2,210 | 280,078(0.79%)#28 | 61,755,866(0.00%)#5,473 |
| 3. | 65802 | 2,197 | 280,078(0.78%)#29 | 61,755,866(0.00%)#5,501 |
| 4. | 65804 | 1,210 | 280,078(0.43%)#72 | 61,755,866(0.00%)#7,501 |
| 5. | 65806 | 962 | 280,078(0.34%)#93 | 61,755,866(0.00%)#8,344 |
| 6. | 65810 | 929 | 280,078(0.33%)#95 | 61,755,866(0.00%)#8,481 |
| 7. | 65809 | 253 | 280,078(0.09%)#224 | 61,755,866(0.00%)#13,244 |
| 8. | 65897 | 76 | 280,078(0.03%)#356 | 61,755,866(0.00%)#17,901 |
1
Common Questions
What are the Top 5 Zip Codes with the Largest Hispanic or Latino Community in Springfield, MO?
Top 5 Zip Codes with the Largest Hispanic or Latino Community in Springfield, MO are:
What zip code has the Largest Hispanic or Latino Community in Springfield, MO?
65807 has the Largest Hispanic or Latino Community in Springfield, MO with 2,718.
What is the Total Hispanic or Latino Population in Springfield, MO?
Total Hispanic or Latino Population in Springfield is 7,758.
What is the Total Hispanic or Latino Population in Missouri?
Total Hispanic or Latino Population in Missouri is 280,078.
What is the Total Hispanic or Latino Population in the United States?
Total Hispanic or Latino Population in the United States is 61,755,866.