Zip Codes with the Highest Percentage of Immigrants from Central America in Springfield, MO

RELATED REPORTS & OPTIONS

Central America
Population
Families and Households
Female Fertility
Female Fertility (Unmarried)
Race (Community Size)
Race (Percentage)
Ancestry (Community Size)
AfricanAmericanApacheArabArmenianAustrianBangladeshiBelgianBhutaneseBlackfeetBrazilianBritishBulgarianBurmeseCanadianCelticCentral AmericanCherokeeChickasawChippewaChoctawColombianCosta RicanCreekCroatianCubanCzechCzechoslovakianDanishDominicanDutchEastern EuropeanEcuadorianEgyptianEnglishEthiopianEuropeanFinnishFrenchFrench CanadianGermanGhanaianGreekGuamanian / ChamorroGuatemalanHungarianIndian (Asian)IrishIroquoisItalianJamaicanJapaneseKoreanLatvianLebaneseLithuanianLuxembourgerMexicanNative HawaiianNavajoNew ZealanderNicaraguanNigerianNorthern EuropeanNorwegianOsageOttawaPakistaniPanamanianPennsylvania GermanPeruvianPolishPortuguesePotawatomiPuerto RicanRomanianRussianSalvadoranSamoanScandinavianScotch-IrishScottishSerbianSiouxSlavicSlovakSouth AfricanSouth AmericanSpaniardSpanishSri LankanSubsaharan AfricanSwedishSwissSyrianThaiUkrainianWelshYugoslavian
Ancestry (Percentage)
AfricanAmericanApacheArabArmenianAustrianBangladeshiBelgianBhutaneseBlackfeetBrazilianBritishBulgarianBurmeseCanadianCelticCentral AmericanCherokeeChickasawChippewaChoctawColombianCosta RicanCreekCroatianCubanCzechCzechoslovakianDanishDominicanDutchEastern EuropeanEcuadorianEgyptianEnglishEthiopianEuropeanFinnishFrenchFrench CanadianGermanGhanaianGreekGuamanian / ChamorroGuatemalanHungarianIndian (Asian)IrishIroquoisItalianJamaicanJapaneseKoreanLatvianLebaneseLithuanianLuxembourgerMexicanNative HawaiianNavajoNew ZealanderNicaraguanNigerianNorthern EuropeanNorwegianOsageOttawaPakistaniPanamanianPennsylvania GermanPeruvianPolishPortuguesePotawatomiPuerto RicanRomanianRussianSalvadoranSamoanScandinavianScotch-IrishScottishSerbianSiouxSlavicSlovakSouth AfricanSouth AmericanSpaniardSpanishSri LankanSubsaharan AfricanSwedishSwissSyrianThaiUkrainianWelshYugoslavian
Immigrant Origin (Total)
Immigrant Origin (Percentage)
Income
Income (Families)
Income (Households)
Poverty
Poverty (Families)
Unemployment
Employment Occupations
Employment Industries
Employer Class
Commute Time
Commute Means
School Enrollment
Education by Degree Field
Occupancy
Finances
Physical Characteristics
Springfield
Compare Zip Codes
Comparison Subject

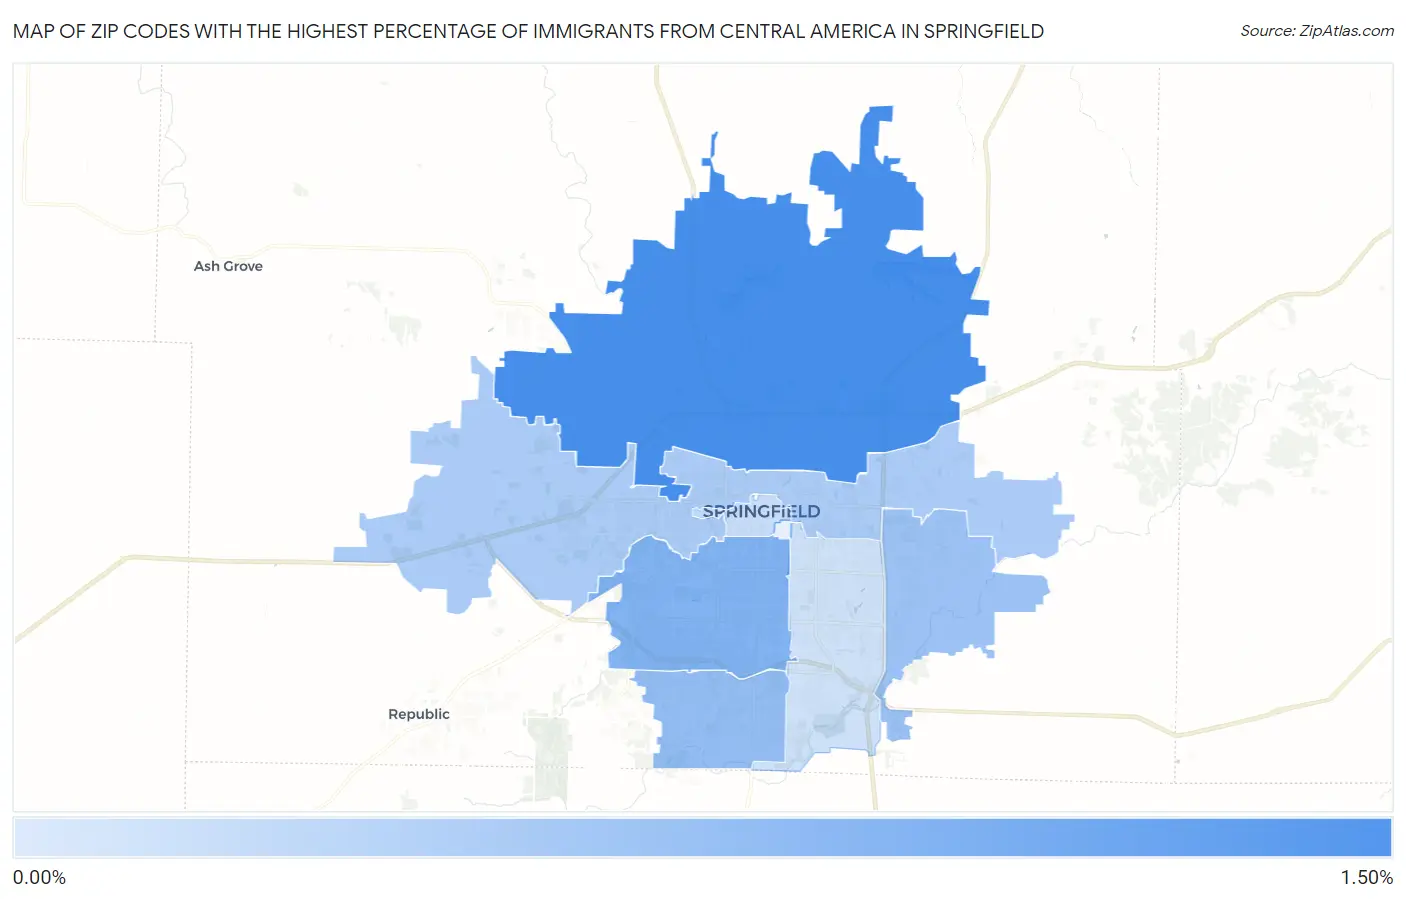
Map of Zip Codes with the Highest Percentage of Immigrants from Central America in Springfield

0.00%
1.50%
Zip Codes with the Highest Percentage of Immigrants from Central America in Springfield Map

Zip Codes with the Highest Percentage of Immigrants from Central America in Springfield, MO

Zip Code Central America vs State vs National
1.658031.04%0.93%(+0.116)#-14.37%(-3.33)#0
2.658070.64%0.93%(-0.286)#04.37%(-3.73)#1
3.658100.51%0.93%(-0.416)#14.37%(-3.86)#2
4.658090.47%0.93%(-0.462)#24.37%(-3.90)#3
5.658020.35%0.93%(-0.577)#34.37%(-4.02)#4
6.658060.15%0.93%(-0.780)#44.37%(-4.22)#5
7.658040.095%0.93%(-0.834)#54.37%(-4.28)#6

Common Questions

What are the Top 5 Zip Codes with the Highest Percentage of Immigrants from Central America in Springfield, MO?
Top 5 Zip Codes with the Highest Percentage of Immigrants from Central America in Springfield, MO are:
#1
1.04%
#2
0.64%
#3
0.51%
#4
0.47%
#5
0.35%
What zip code has the Highest Percentage of Immigrants from Central America in Springfield, MO?
65803 has the Highest Percentage of Immigrants from Central America in Springfield, MO with 1.04%.
What is the Percentage of Immigrants from Central America in Springfield, MO?
Percentage of Immigrants from Central America in Springfield is 0.45%.
What is the Percentage of Immigrants from Central America in Missouri?
Percentage of Immigrants from Central America in Missouri is 0.93%.
What is the Percentage of Immigrants from Central America in the United States?
Percentage of Immigrants from Central America in the United States is 4.37%.