Zip Codes with the Highest Percentage of Population Employed in Accommodation & Food Services in Springfield, MO
RELATED REPORTS & OPTIONS
Accommodation & Food Services
Springfield
Compare Zip Codes
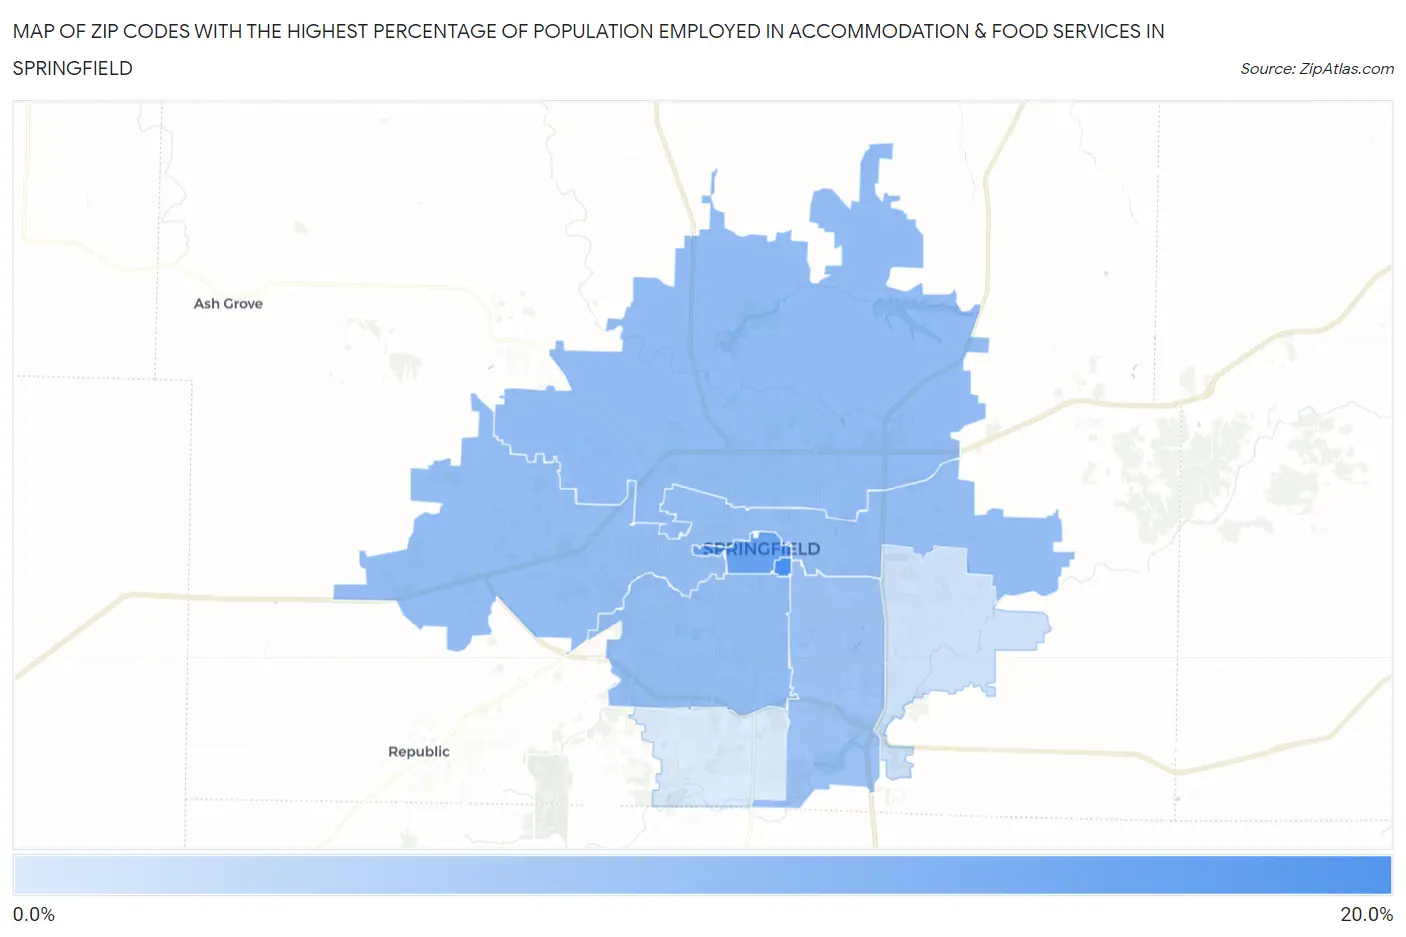
Map of Zip Codes with the Highest Percentage of Population Employed in Accommodation & Food Services in Springfield
3.2%
16.3%
Zip Codes with the Highest Percentage of Population Employed in Accommodation & Food Services in Springfield, MO
| Zip Code | % Employed | vs State | vs National | |
| 1. | 65897 | 16.3% | 6.6%(+9.73)#44 | 6.9%(+9.43)#1,385 |
| 2. | 65806 | 13.3% | 6.6%(+6.72)#71 | 6.9%(+6.41)#2,228 |
| 3. | 65803 | 9.6% | 6.6%(+3.02)#142 | 6.9%(+2.71)#5,083 |
| 4. | 65807 | 9.5% | 6.6%(+2.93)#152 | 6.9%(+2.62)#5,209 |
| 5. | 65802 | 9.4% | 6.6%(+2.81)#154 | 6.9%(+2.50)#5,373 |
| 6. | 65804 | 8.8% | 6.6%(+2.20)#182 | 6.9%(+1.89)#6,335 |
| 7. | 65809 | 4.3% | 6.6%(-2.31)#532 | 6.9%(-2.62)#19,320 |
| 8. | 65810 | 3.2% | 6.6%(-3.41)#634 | 6.9%(-3.72)#22,809 |
1
Common Questions
What are the Top 5 Zip Codes with the Highest Percentage of Population Employed in Accommodation & Food Services in Springfield, MO?
Top 5 Zip Codes with the Highest Percentage of Population Employed in Accommodation & Food Services in Springfield, MO are:
What zip code has the Highest Percentage of Population Employed in Accommodation & Food Services in Springfield, MO?
65897 has the Highest Percentage of Population Employed in Accommodation & Food Services in Springfield, MO with 16.3%.
What is the Percentage of Population Employed in Accommodation & Food Services in Springfield, MO?
Percentage of Population Employed in Accommodation & Food Services in Springfield is 10.6%.
What is the Percentage of Population Employed in Accommodation & Food Services in Missouri?
Percentage of Population Employed in Accommodation & Food Services in Missouri is 6.6%.
What is the Percentage of Population Employed in Accommodation & Food Services in the United States?
Percentage of Population Employed in Accommodation & Food Services in the United States is 6.9%.