Branson, MO Map & Demographics
Branson Map
Branson Overview
$30,706
PER CAPITA INCOME
$64,343
AVG FAMILY INCOME
$49,790
AVG HOUSEHOLD INCOME
23.5%
WAGE / INCOME GAP [ % ]
76.5¢/ $1
WAGE / INCOME GAP [ $ ]
0.46
INEQUALITY / GINI INDEX
12,651
TOTAL POPULATION
5,383
MALE POPULATION
7,268
FEMALE POPULATION
74.06
MALES / 100 FEMALES
135.02
FEMALES / 100 MALES
41.2
MEDIAN AGE
3.0
AVG FAMILY SIZE
2.2
AVG HOUSEHOLD SIZE
6,117
LABOR FORCE [ PEOPLE ]
57.5%
PERCENT IN LABOR FORCE
4.0%
UNEMPLOYMENT RATE
Branson Zip Codes
Branson Area Codes
Income in Branson
Income Overview in Branson
Per Capita Income in Branson is $30,706, while median incomes of families and households are $64,343 and $49,790 respectively.
| Characteristic | Number | Measure |
| Per Capita Income | 12,651 | $30,706 |
| Median Family Income | 2,945 | $64,343 |
| Mean Family Income | 2,945 | $84,648 |
| Median Household Income | 5,593 | $49,790 |
| Mean Household Income | 5,593 | $65,931 |
| Income Deficit | 2,945 | $0 |
| Wage / Income Gap (%) | 12,651 | 23.53% |
| Wage / Income Gap ($) | 12,651 | 76.47¢ per $1 |
| Gini / Inequality Index | 12,651 | 0.46 |
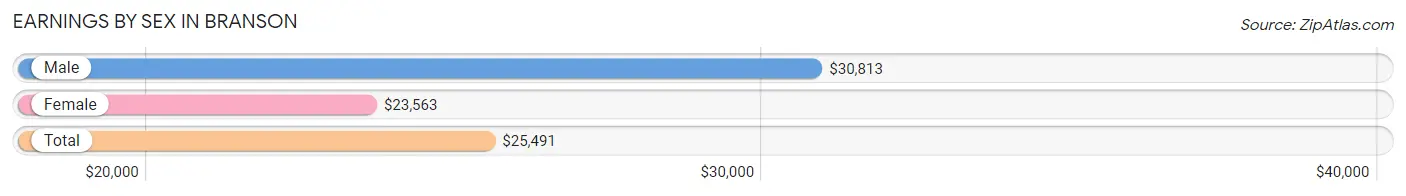
Earnings by Sex in Branson
Average Earnings in Branson are $25,491, $30,813 for men and $23,563 for women, a difference of 23.5%.
| Sex | Number | Average Earnings |
| Male | 3,313 (49.5%) | $30,813 |
| Female | 3,378 (50.5%) | $23,563 |
| Total | 6,691 (100.0%) | $25,491 |
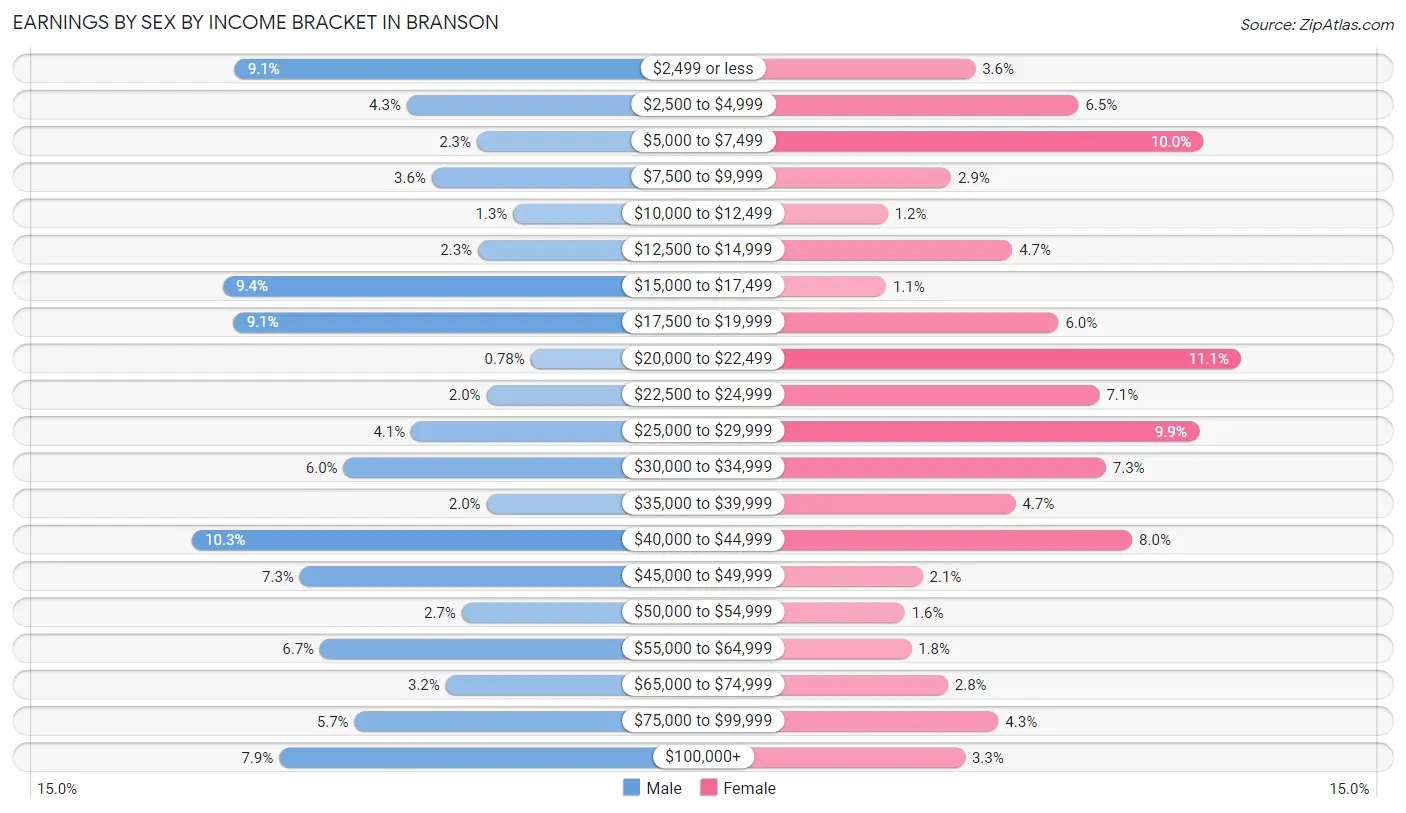
Earnings by Sex by Income Bracket in Branson
The most common earnings brackets in Branson are $40,000 to $44,999 for men (341 | 10.3%) and $20,000 to $22,499 for women (374 | 11.1%).
| Income | Male | Female |
| $2,499 or less | 301 (9.1%) | 122 (3.6%) |
| $2,500 to $4,999 | 141 (4.3%) | 220 (6.5%) |
| $5,000 to $7,499 | 76 (2.3%) | 338 (10.0%) |
| $7,500 to $9,999 | 118 (3.6%) | 99 (2.9%) |
| $10,000 to $12,499 | 42 (1.3%) | 39 (1.1%) |
| $12,500 to $14,999 | 75 (2.3%) | 157 (4.6%) |
| $15,000 to $17,499 | 312 (9.4%) | 37 (1.1%) |
| $17,500 to $19,999 | 302 (9.1%) | 201 (5.9%) |
| $20,000 to $22,499 | 26 (0.8%) | 374 (11.1%) |
| $22,500 to $24,999 | 67 (2.0%) | 240 (7.1%) |
| $25,000 to $29,999 | 137 (4.1%) | 334 (9.9%) |
| $30,000 to $34,999 | 200 (6.0%) | 246 (7.3%) |
| $35,000 to $39,999 | 67 (2.0%) | 160 (4.7%) |
| $40,000 to $44,999 | 341 (10.3%) | 271 (8.0%) |
| $45,000 to $49,999 | 241 (7.3%) | 72 (2.1%) |
| $50,000 to $54,999 | 90 (2.7%) | 55 (1.6%) |
| $55,000 to $64,999 | 222 (6.7%) | 61 (1.8%) |
| $65,000 to $74,999 | 105 (3.2%) | 96 (2.8%) |
| $75,000 to $99,999 | 190 (5.7%) | 144 (4.3%) |
| $100,000+ | 260 (7.9%) | 112 (3.3%) |
| Total | 3,313 (100.0%) | 3,378 (100.0%) |
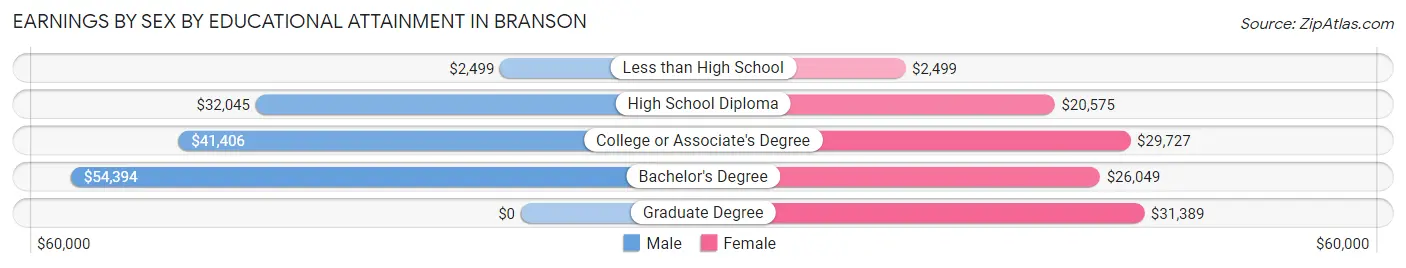
Earnings by Sex by Educational Attainment in Branson
Average earnings in Branson are $40,938 for men and $24,476 for women, a difference of 40.2%. Men with an educational attainment of bachelor's degree enjoy the highest average annual earnings of $54,394, while those with less than high school education earn the least with $2,499. Women with an educational attainment of graduate degree earn the most with the average annual earnings of $31,389, while those with less than high school education have the smallest earnings of $2,499.
| Educational Attainment | Male Income | Female Income |
| Less than High School | $2,499 | $2,499 |
| High School Diploma | $32,045 | $20,575 |
| College or Associate's Degree | $41,406 | $29,727 |
| Bachelor's Degree | $54,394 | $26,049 |
| Graduate Degree | - | - |
| Total | $40,938 | $24,476 |
Family Income in Branson
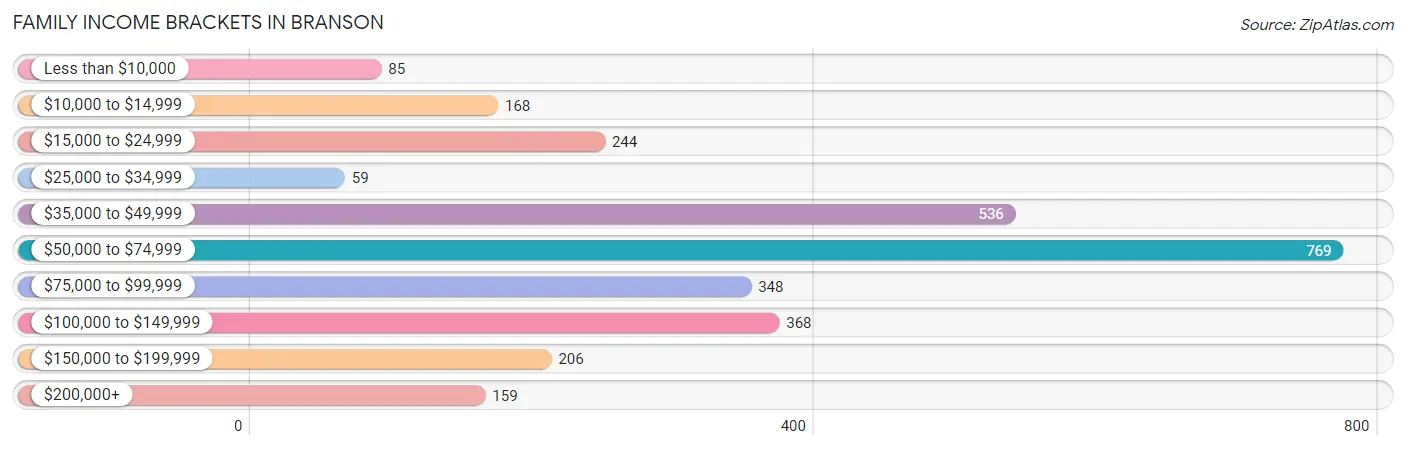
Family Income Brackets in Branson
According to the Branson family income data, there are 769 families falling into the $50,000 to $74,999 income range, which is the most common income bracket and makes up 26.1% of all families. Conversely, the $25,000 to $34,999 income bracket is the least frequent group with only 59 families (2.0%) belonging to this category.
| Income Bracket | # Families | % Families |
| Less than $10,000 | 85 | 2.9% |
| $10,000 to $14,999 | 168 | 5.7% |
| $15,000 to $24,999 | 244 | 8.3% |
| $25,000 to $34,999 | 59 | 2.0% |
| $35,000 to $49,999 | 536 | 18.2% |
| $50,000 to $74,999 | 769 | 26.1% |
| $75,000 to $99,999 | 348 | 11.8% |
| $100,000 to $149,999 | 368 | 12.5% |
| $150,000 to $199,999 | 206 | 7.0% |
| $200,000+ | 159 | 5.4% |
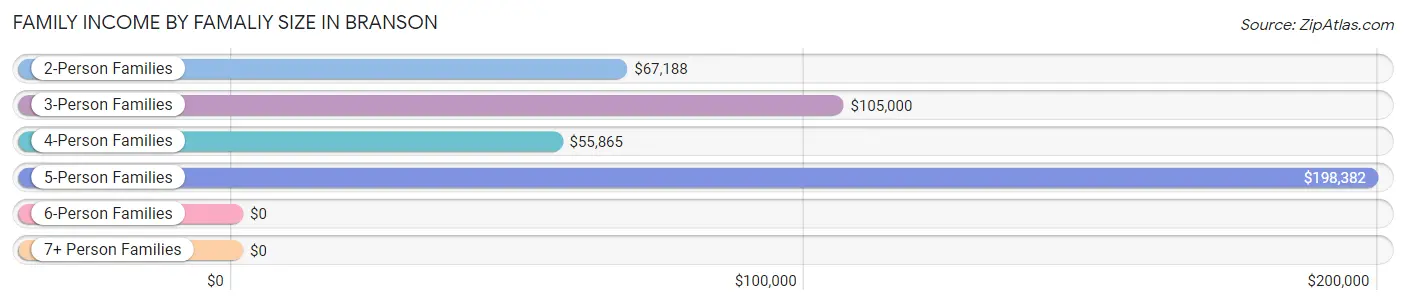
Family Income by Famaliy Size in Branson
5-person families (36 | 1.2%) account for the highest median family income in Branson with $198,382 per family, while 5-person families (36 | 1.2%) have the highest median income of $39,676 per family member.
| Income Bracket | # Families | Median Income |
| 2-Person Families | 1,933 (65.6%) | $67,188 |
| 3-Person Families | 436 (14.8%) | $105,000 |
| 4-Person Families | 423 (14.4%) | $55,865 |
| 5-Person Families | 36 (1.2%) | $198,382 |
| 6-Person Families | 106 (3.6%) | $0 |
| 7+ Person Families | 11 (0.4%) | $0 |
| Total | 2,945 (100.0%) | $64,343 |
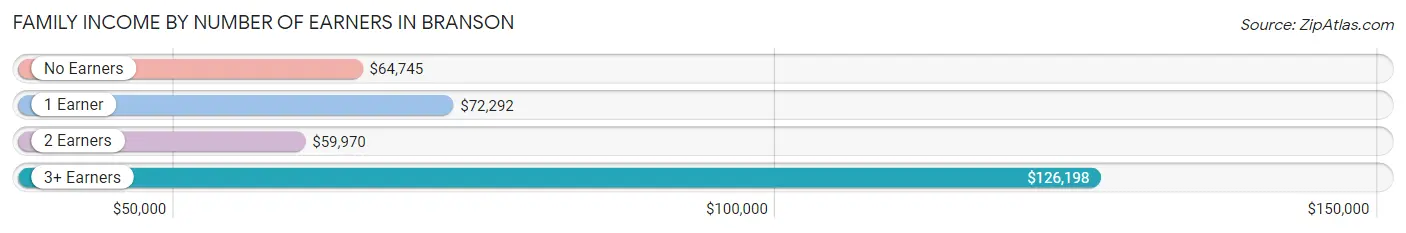
Family Income by Number of Earners in Branson
The median family income in Branson is $64,343, with families comprising 3+ earners (149) having the highest median family income of $126,198, while families with 2 earners (1,305) have the lowest median family income of $59,970, accounting for 5.1% and 44.3% of families, respectively.
| Number of Earners | # Families | Median Income |
| No Earners | 656 (22.3%) | $64,745 |
| 1 Earner | 835 (28.3%) | $72,292 |
| 2 Earners | 1,305 (44.3%) | $59,970 |
| 3+ Earners | 149 (5.1%) | $126,198 |
| Total | 2,945 (100.0%) | $64,343 |
Household Income in Branson
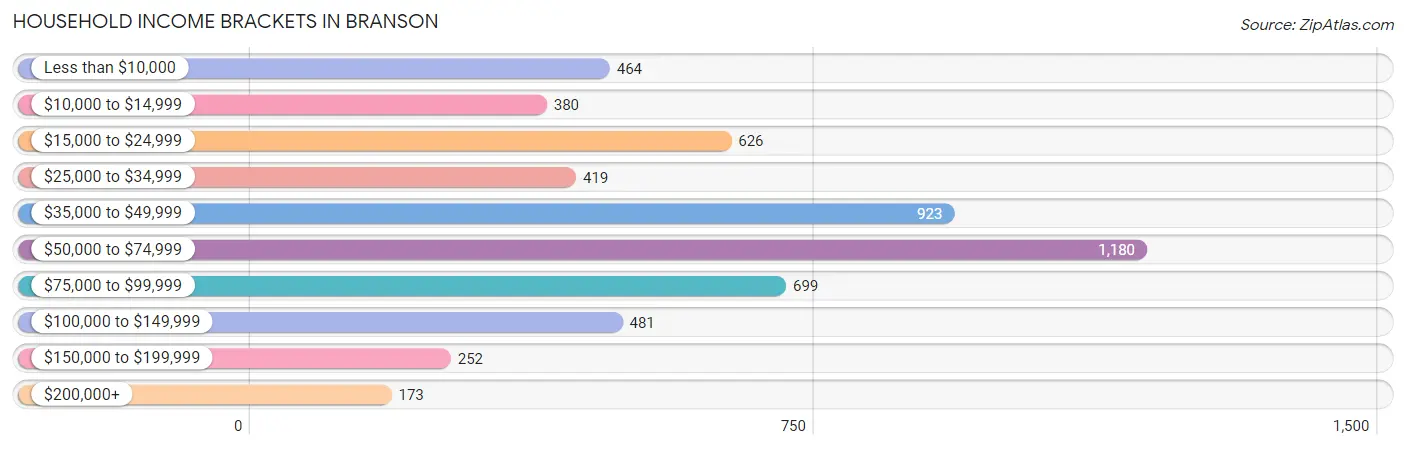
Household Income Brackets in Branson
With 1,180 households falling in the category, the $50,000 to $74,999 income range is the most frequent in Branson, accounting for 21.1% of all households. In contrast, only 173 households (3.1%) fall into the $200,000+ income bracket, making it the least populous group.
| Income Bracket | # Households | % Households |
| Less than $10,000 | 464 | 8.3% |
| $10,000 to $14,999 | 380 | 6.8% |
| $15,000 to $24,999 | 626 | 11.2% |
| $25,000 to $34,999 | 419 | 7.5% |
| $35,000 to $49,999 | 923 | 16.5% |
| $50,000 to $74,999 | 1,180 | 21.1% |
| $75,000 to $99,999 | 699 | 12.5% |
| $100,000 to $149,999 | 481 | 8.6% |
| $150,000 to $199,999 | 252 | 4.5% |
| $200,000+ | 173 | 3.1% |
Household Income by Householder Age in Branson
The median household income in Branson is $49,790, with the highest median household income of $65,736 found in the 15 to 24 years age bracket for the primary householder. A total of 327 households (5.9%) fall into this category. Meanwhile, the 65+ years age bracket for the primary householder has the lowest median household income of $42,865, with 2,020 households (36.1%) in this group.
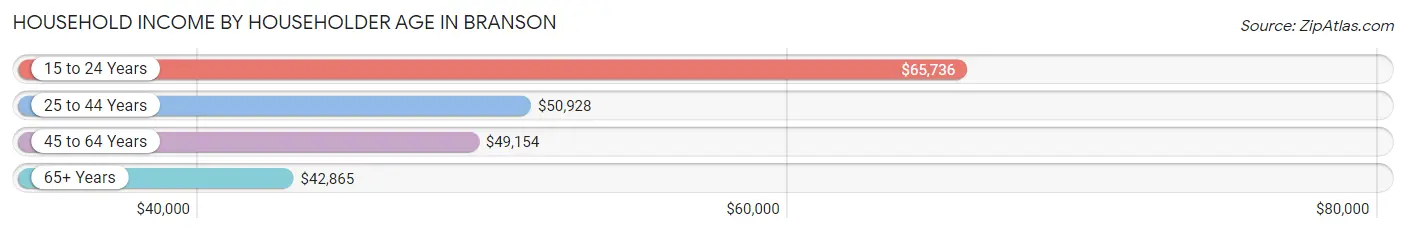
| Income Bracket | # Households | Median Income |
| 15 to 24 Years | 327 (5.9%) | $65,736 |
| 25 to 44 Years | 1,599 (28.6%) | $50,928 |
| 45 to 64 Years | 1,647 (29.4%) | $49,154 |
| 65+ Years | 2,020 (36.1%) | $42,865 |
| Total | 5,593 (100.0%) | $49,790 |
Poverty in Branson
Income Below Poverty by Sex and Age in Branson
With 19.2% poverty level for males and 32.4% for females among the residents of Branson, 6 to 11 year old males and 12 to 14 year old females are the most vulnerable to poverty, with 109 males (41.1%) and 186 females (78.1%) in their respective age groups living below the poverty level.
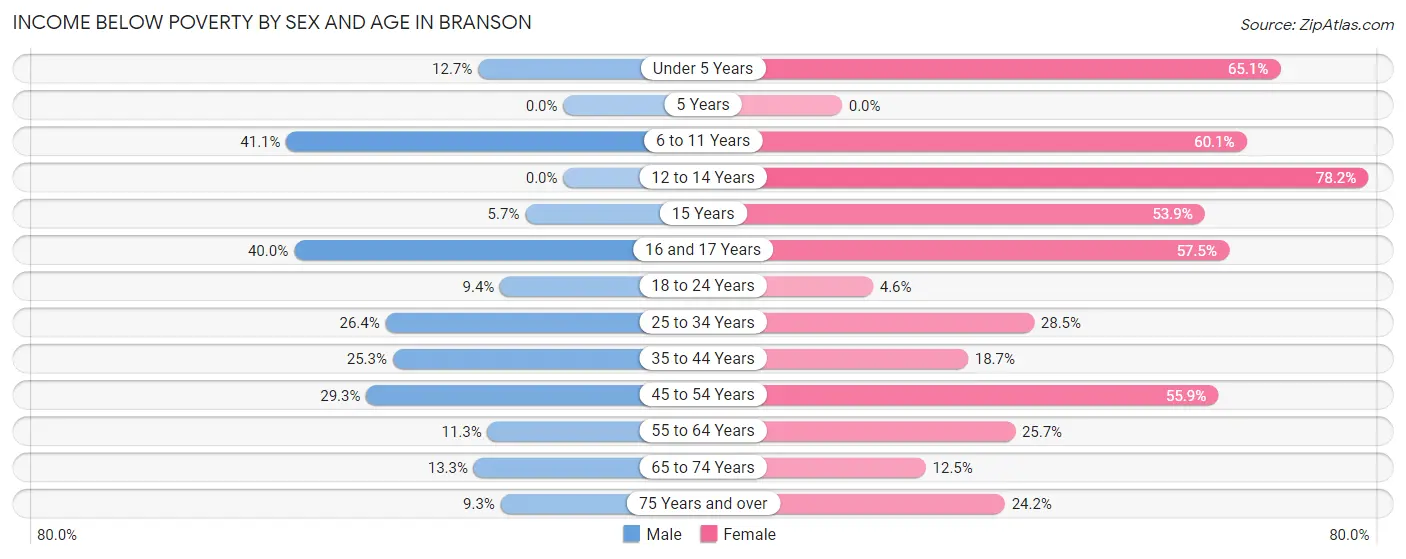
| Age Bracket | Male | Female |
| Under 5 Years | 29 (12.7%) | 410 (65.1%) |
| 5 Years | 0 (0.0%) | 0 (0.0%) |
| 6 to 11 Years | 109 (41.1%) | 188 (60.1%) |
| 12 to 14 Years | 0 (0.0%) | 186 (78.1%) |
| 15 Years | 3 (5.7%) | 14 (53.8%) |
| 16 and 17 Years | 100 (40.0%) | 81 (57.5%) |
| 18 to 24 Years | 51 (9.4%) | 28 (4.6%) |
| 25 to 34 Years | 240 (26.4%) | 259 (28.5%) |
| 35 to 44 Years | 175 (25.3%) | 119 (18.7%) |
| 45 to 54 Years | 91 (29.3%) | 472 (55.9%) |
| 55 to 64 Years | 75 (11.3%) | 255 (25.7%) |
| 65 to 74 Years | 102 (13.3%) | 115 (12.4%) |
| 75 Years and over | 46 (9.3%) | 201 (24.2%) |
| Total | 1,021 (19.2%) | 2,328 (32.4%) |
Income Above Poverty by Sex and Age in Branson
According to the poverty statistics in Branson, males aged 5 years and females aged 5 years are the age groups that are most secure financially, with 100.0% of males and 100.0% of females in these age groups living above the poverty line.
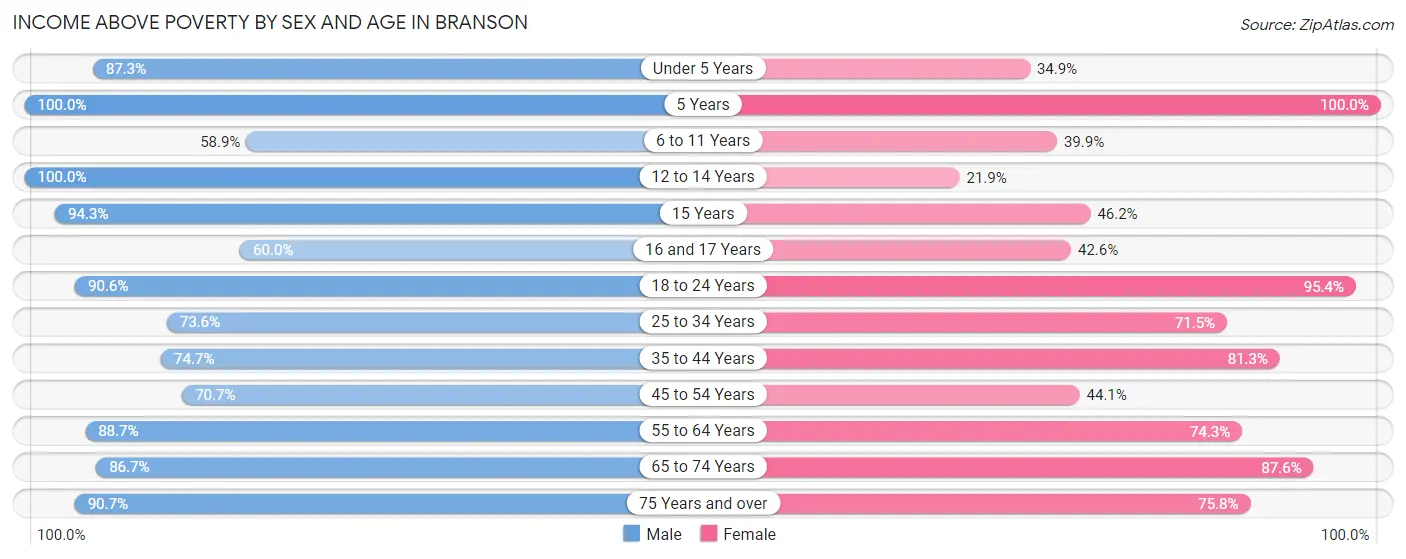
| Age Bracket | Male | Female |
| Under 5 Years | 200 (87.3%) | 220 (34.9%) |
| 5 Years | 44 (100.0%) | 94 (100.0%) |
| 6 to 11 Years | 156 (58.9%) | 125 (39.9%) |
| 12 to 14 Years | 83 (100.0%) | 52 (21.8%) |
| 15 Years | 50 (94.3%) | 12 (46.2%) |
| 16 and 17 Years | 150 (60.0%) | 60 (42.5%) |
| 18 to 24 Years | 493 (90.6%) | 581 (95.4%) |
| 25 to 34 Years | 669 (73.6%) | 649 (71.5%) |
| 35 to 44 Years | 516 (74.7%) | 517 (81.3%) |
| 45 to 54 Years | 220 (70.7%) | 373 (44.1%) |
| 55 to 64 Years | 591 (88.7%) | 737 (74.3%) |
| 65 to 74 Years | 665 (86.7%) | 809 (87.5%) |
| 75 Years and over | 448 (90.7%) | 630 (75.8%) |
| Total | 4,285 (80.8%) | 4,859 (67.6%) |
Income Below Poverty Among Married-Couple Families in Branson
The poverty statistics for married-couple families in Branson show that 15.9% or 399 of the total 2,513 families live below the poverty line. Families with 3 or 4 children have the highest poverty rate of 93.8%, comprising of 106 families. On the other hand, families with 5 or more children have the lowest poverty rate of 0.0%, which includes 0 families.
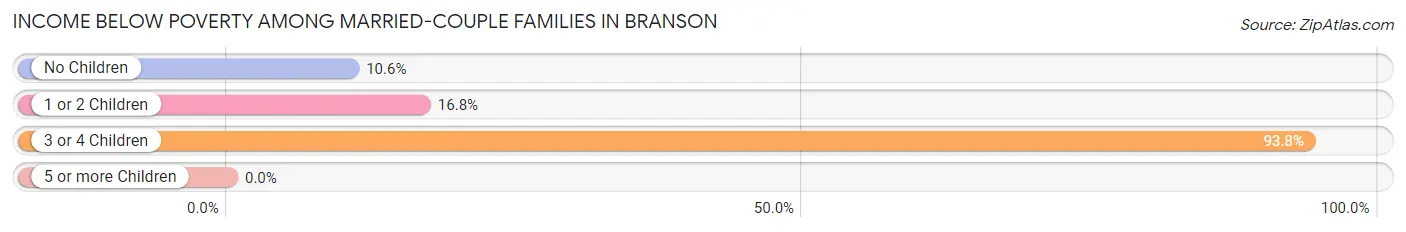
| Children | Above Poverty | Below Poverty |
| No Children | 1,551 (89.4%) | 183 (10.5%) |
| 1 or 2 Children | 545 (83.2%) | 110 (16.8%) |
| 3 or 4 Children | 7 (6.2%) | 106 (93.8%) |
| 5 or more Children | 11 (100.0%) | 0 (0.0%) |
| Total | 2,114 (84.1%) | 399 (15.9%) |
Income Below Poverty Among Single-Parent Households in Branson
According to the poverty data in Branson, 11.4% or 13 single-father households and 49.7% or 158 single-mother households are living below the poverty line. Among single-father households, those with no children have the highest poverty rate, with 13 households (20.3%) experiencing poverty. Likewise, among single-mother households, those with 3 or 4 children have the highest poverty rate, with 4 households (100.0%) falling below the poverty line.
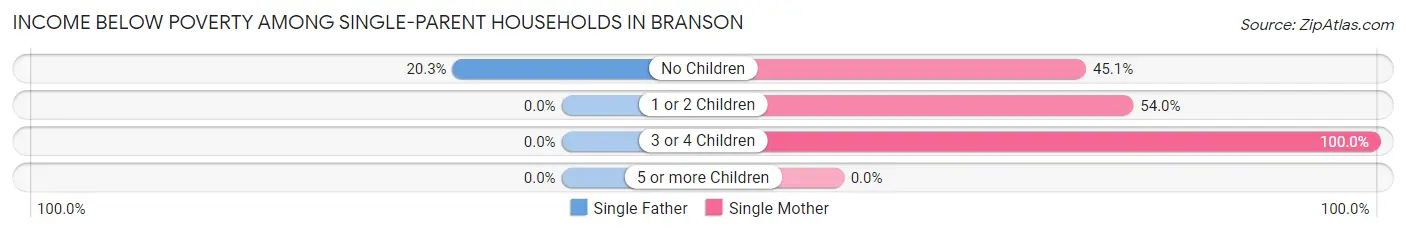
| Children | Single Father | Single Mother |
| No Children | 13 (20.3%) | 79 (45.1%) |
| 1 or 2 Children | 0 (0.0%) | 75 (54.0%) |
| 3 or 4 Children | 0 (0.0%) | 4 (100.0%) |
| 5 or more Children | 0 (0.0%) | 0 (0.0%) |
| Total | 13 (11.4%) | 158 (49.7%) |
Income Below Poverty Among Married-Couple vs Single-Parent Households in Branson
The poverty data for Branson shows that 399 of the married-couple family households (15.9%) and 171 of the single-parent households (39.6%) are living below the poverty level. Within the married-couple family households, those with 3 or 4 children have the highest poverty rate, with 106 households (93.8%) falling below the poverty line. Among the single-parent households, those with 3 or 4 children have the highest poverty rate, with 4 household (100.0%) living below poverty.
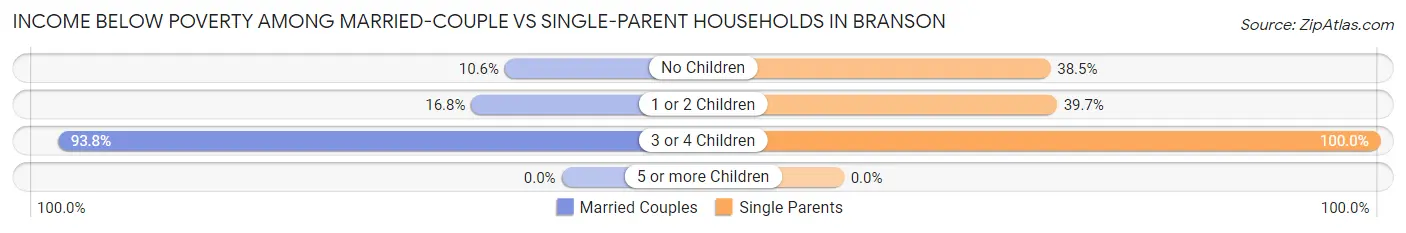
| Children | Married-Couple Families | Single-Parent Households |
| No Children | 183 (10.5%) | 92 (38.5%) |
| 1 or 2 Children | 110 (16.8%) | 75 (39.7%) |
| 3 or 4 Children | 106 (93.8%) | 4 (100.0%) |
| 5 or more Children | 0 (0.0%) | 0 (0.0%) |
| Total | 399 (15.9%) | 171 (39.6%) |
Race in Branson
The most populous races in Branson are White / Caucasian (10,915 | 86.3%), Hispanic or Latino (1,078 | 8.5%), and Black / African American (745 | 5.9%).
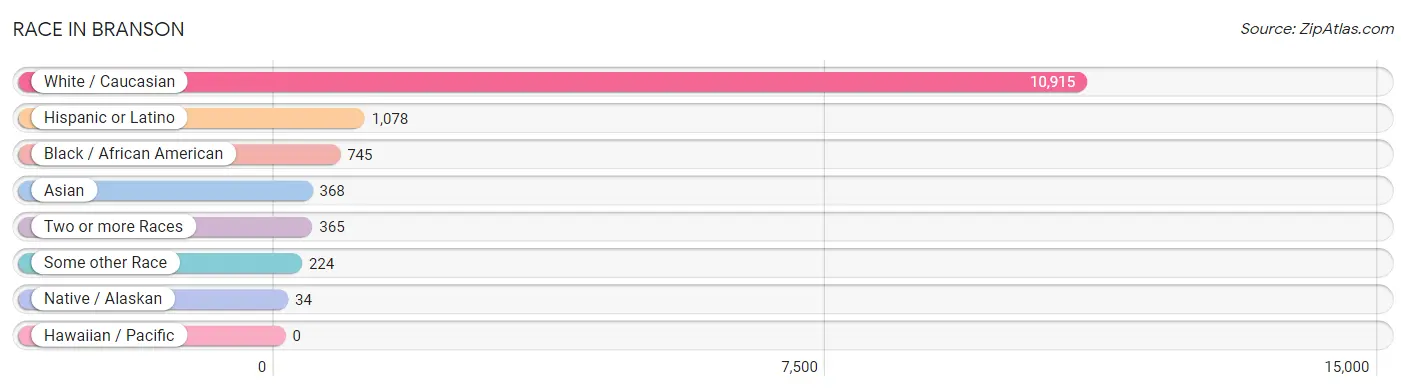
| Race | # Population | % Population |
| Asian | 368 | 2.9% |
| Black / African American | 745 | 5.9% |
| Hawaiian / Pacific | 0 | 0.0% |
| Hispanic or Latino | 1,078 | 8.5% |
| Native / Alaskan | 34 | 0.3% |
| White / Caucasian | 10,915 | 86.3% |
| Two or more Races | 365 | 2.9% |
| Some other Race | 224 | 1.8% |
| Total | 12,651 | 100.0% |
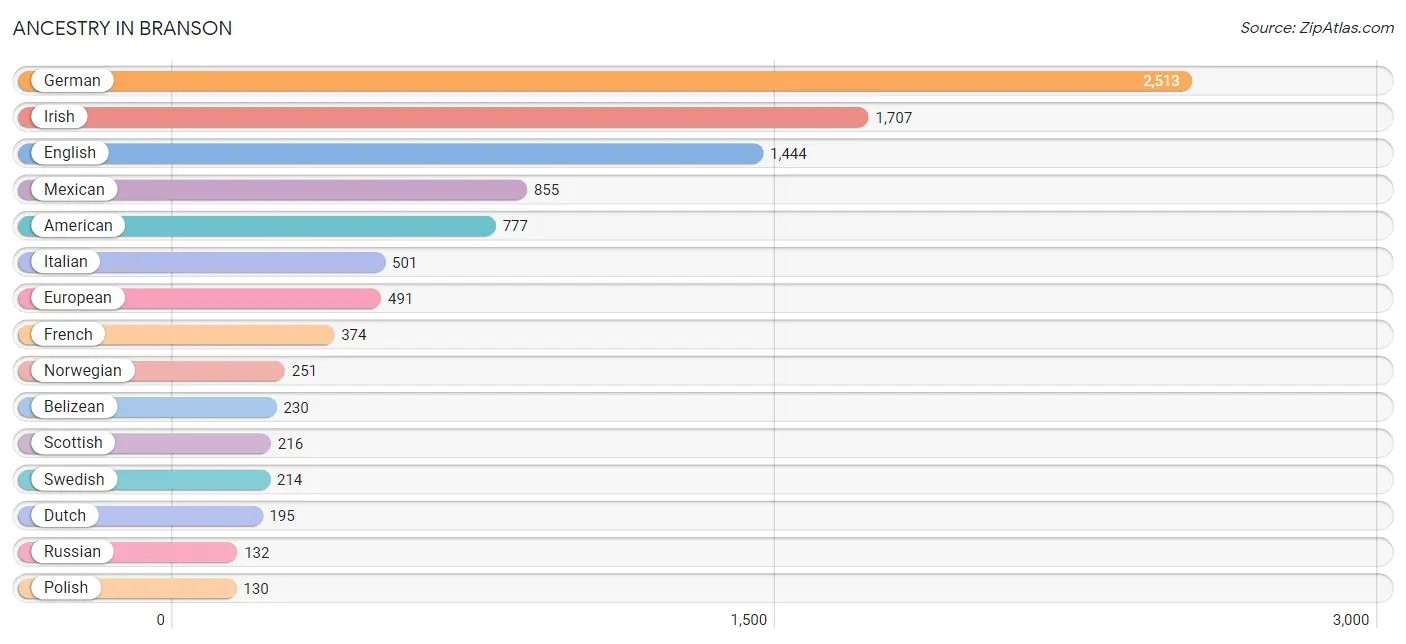
Ancestry in Branson
The most populous ancestries reported in Branson are German (2,513 | 19.9%), Irish (1,707 | 13.5%), English (1,444 | 11.4%), Mexican (855 | 6.8%), and American (777 | 6.1%), together accounting for 57.7% of all Branson residents.
| Ancestry | # Population | % Population |
| African | 74 | 0.6% |
| American | 777 | 6.1% |
| Belgian | 22 | 0.2% |
| Belizean | 230 | 1.8% |
| Bhutanese | 11 | 0.1% |
| British | 124 | 1.0% |
| Burmese | 4 | 0.0% |
| Celtic | 5 | 0.0% |
| Central American | 3 | 0.0% |
| Central American Indian | 10 | 0.1% |
| Cherokee | 21 | 0.2% |
| Colombian | 4 | 0.0% |
| Czech | 8 | 0.1% |
| Czechoslovakian | 13 | 0.1% |
| Danish | 35 | 0.3% |
| Dutch | 195 | 1.5% |
| English | 1,444 | 11.4% |
| European | 491 | 3.9% |
| French | 374 | 3.0% |
| French Canadian | 23 | 0.2% |
| German | 2,513 | 19.9% |
| Indian (Asian) | 98 | 0.8% |
| Iranian | 1 | 0.0% |
| Irish | 1,707 | 13.5% |
| Italian | 501 | 4.0% |
| Jamaican | 103 | 0.8% |
| Korean | 65 | 0.5% |
| Mexican | 855 | 6.8% |
| Northern European | 23 | 0.2% |
| Norwegian | 251 | 2.0% |
| Pakistani | 112 | 0.9% |
| Polish | 130 | 1.0% |
| Portuguese | 63 | 0.5% |
| Puerto Rican | 96 | 0.8% |
| Romanian | 118 | 0.9% |
| Russian | 132 | 1.0% |
| Salvadoran | 3 | 0.0% |
| Scandinavian | 83 | 0.7% |
| Scotch-Irish | 39 | 0.3% |
| Scottish | 216 | 1.7% |
| South American | 4 | 0.0% |
| Spaniard | 106 | 0.8% |
| Spanish | 14 | 0.1% |
| Sri Lankan | 10 | 0.1% |
| Subsaharan African | 74 | 0.6% |
| Swedish | 214 | 1.7% |
| Swiss | 5 | 0.0% |
| Thai | 114 | 0.9% |
| Ukrainian | 26 | 0.2% |
| Welsh | 80 | 0.6% | View All 50 Rows |
Immigrants in Branson
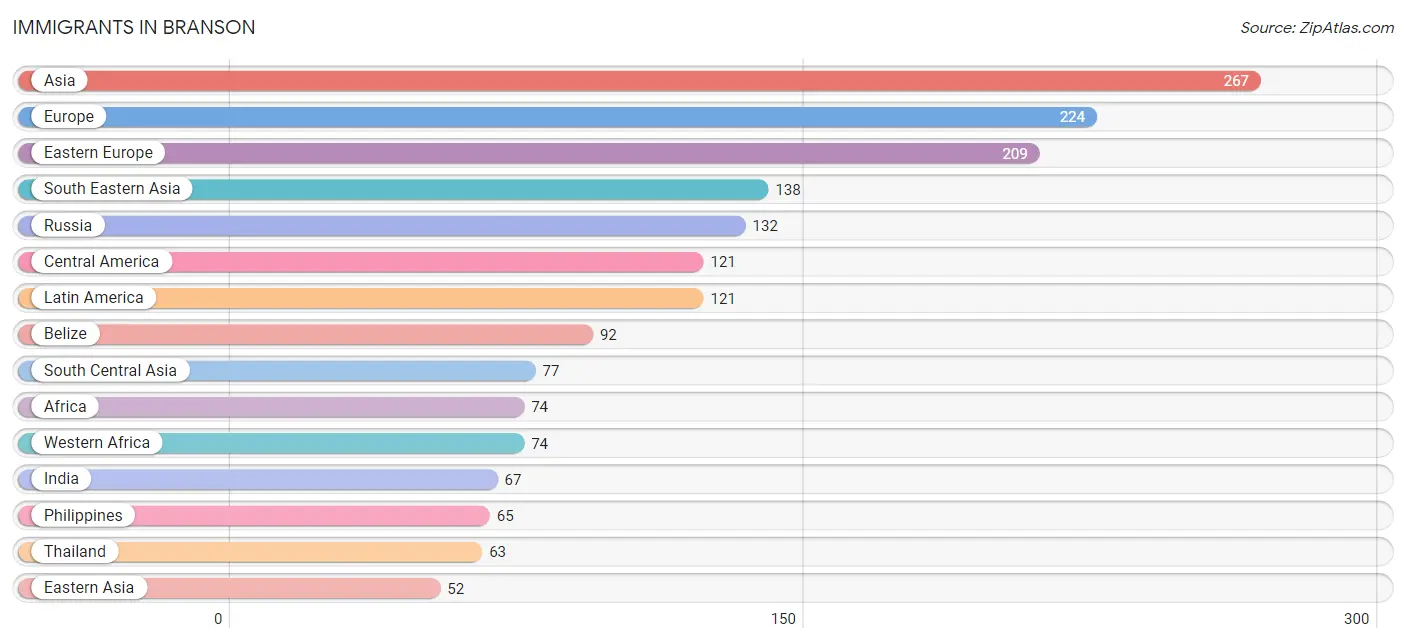
The most numerous immigrant groups reported in Branson came from Asia (267 | 2.1%), Europe (224 | 1.8%), Eastern Europe (209 | 1.7%), South Eastern Asia (138 | 1.1%), and Russia (132 | 1.0%), together accounting for 7.7% of all Branson residents.
| Immigration Origin | # Population | % Population |
| Africa | 74 | 0.6% |
| Asia | 267 | 2.1% |
| Belize | 92 | 0.7% |
| Central America | 121 | 1.0% |
| China | 48 | 0.4% |
| Denmark | 7 | 0.1% |
| Eastern Asia | 52 | 0.4% |
| Eastern Europe | 209 | 1.7% |
| El Salvador | 3 | 0.0% |
| Europe | 224 | 1.8% |
| Germany | 8 | 0.1% |
| India | 67 | 0.5% |
| Kazakhstan | 10 | 0.1% |
| Korea | 4 | 0.0% |
| Latin America | 121 | 1.0% |
| Mexico | 26 | 0.2% |
| Northern Europe | 7 | 0.1% |
| Philippines | 65 | 0.5% |
| Poland | 39 | 0.3% |
| Romania | 12 | 0.1% |
| Russia | 132 | 1.0% |
| South Central Asia | 77 | 0.6% |
| South Eastern Asia | 138 | 1.1% |
| Thailand | 63 | 0.5% |
| Ukraine | 26 | 0.2% |
| Vietnam | 10 | 0.1% |
| Western Africa | 74 | 0.6% |
| Western Europe | 8 | 0.1% | View All 28 Rows |
Sex and Age in Branson
Sex and Age in Branson
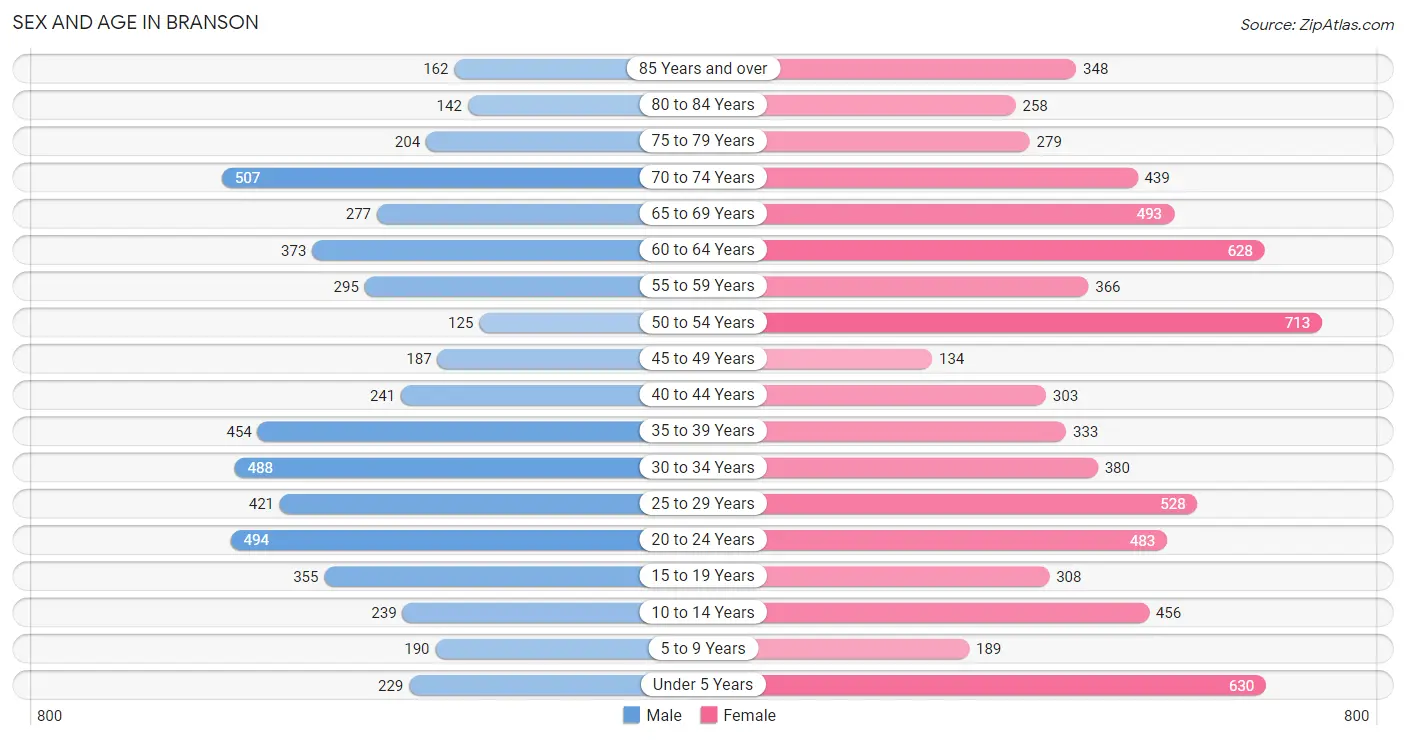
The most populous age groups in Branson are 70 to 74 Years (507 | 9.4%) for men and 50 to 54 Years (713 | 9.8%) for women.
| Age Bracket | Male | Female |
| Under 5 Years | 229 (4.3%) | 630 (8.7%) |
| 5 to 9 Years | 190 (3.5%) | 189 (2.6%) |
| 10 to 14 Years | 239 (4.4%) | 456 (6.3%) |
| 15 to 19 Years | 355 (6.6%) | 308 (4.2%) |
| 20 to 24 Years | 494 (9.2%) | 483 (6.7%) |
| 25 to 29 Years | 421 (7.8%) | 528 (7.3%) |
| 30 to 34 Years | 488 (9.1%) | 380 (5.2%) |
| 35 to 39 Years | 454 (8.4%) | 333 (4.6%) |
| 40 to 44 Years | 241 (4.5%) | 303 (4.2%) |
| 45 to 49 Years | 187 (3.5%) | 134 (1.8%) |
| 50 to 54 Years | 125 (2.3%) | 713 (9.8%) |
| 55 to 59 Years | 295 (5.5%) | 366 (5.0%) |
| 60 to 64 Years | 373 (6.9%) | 628 (8.6%) |
| 65 to 69 Years | 277 (5.1%) | 493 (6.8%) |
| 70 to 74 Years | 507 (9.4%) | 439 (6.0%) |
| 75 to 79 Years | 204 (3.8%) | 279 (3.8%) |
| 80 to 84 Years | 142 (2.6%) | 258 (3.5%) |
| 85 Years and over | 162 (3.0%) | 348 (4.8%) |
| Total | 5,383 (100.0%) | 7,268 (100.0%) |
Families and Households in Branson
Median Family Size in Branson
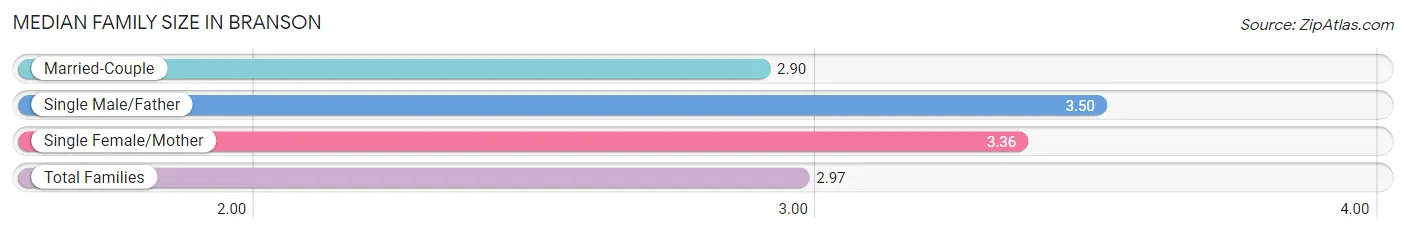
The median family size in Branson is 2.97 persons per family, with single male/father families (114 | 3.9%) accounting for the largest median family size of 3.5 persons per family. On the other hand, married-couple families (2,513 | 85.3%) represent the smallest median family size with 2.90 persons per family.
| Family Type | # Families | Family Size |
| Married-Couple | 2,513 (85.3%) | 2.90 |
| Single Male/Father | 114 (3.9%) | 3.50 |
| Single Female/Mother | 318 (10.8%) | 3.36 |
| Total Families | 2,945 (100.0%) | 2.97 |
Median Household Size in Branson
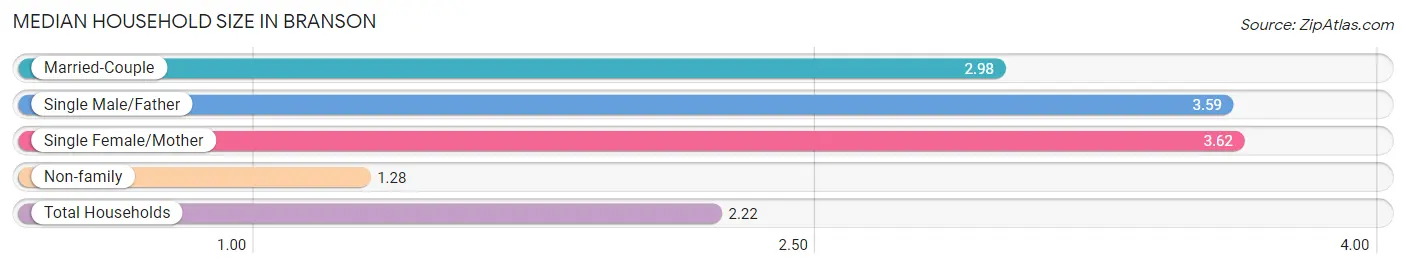
The median household size in Branson is 2.22 persons per household, with single female/mother households (318 | 5.7%) accounting for the largest median household size of 3.62 persons per household. non-family households (2,648 | 47.3%) represent the smallest median household size with 1.28 persons per household.
| Household Type | # Households | Household Size |
| Married-Couple | 2,513 (44.9%) | 2.98 |
| Single Male/Father | 114 (2.0%) | 3.59 |
| Single Female/Mother | 318 (5.7%) | 3.62 |
| Non-family | 2,648 (47.3%) | 1.28 |
| Total Households | 5,593 (100.0%) | 2.22 |
Household Size by Marriage Status in Branson
Out of a total of 5,593 households in Branson, 2,945 (52.7%) are family households, while 2,648 (47.3%) are nonfamily households. The most numerous type of family households are 2-person households, comprising 1,783, and the most common type of nonfamily households are 1-person households, comprising 2,206.
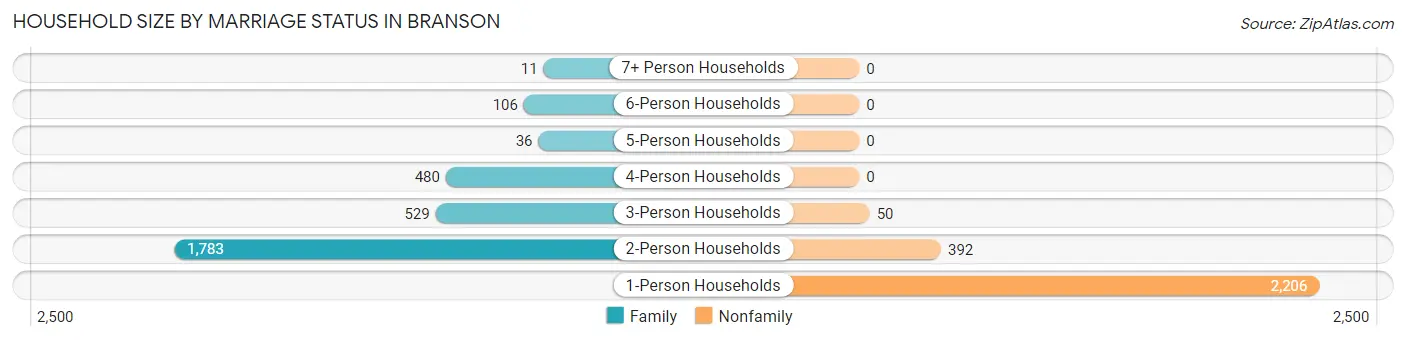
| Household Size | Family Households | Nonfamily Households |
| 1-Person Households | - | 2,206 (39.4%) |
| 2-Person Households | 1,783 (31.9%) | 392 (7.0%) |
| 3-Person Households | 529 (9.5%) | 50 (0.9%) |
| 4-Person Households | 480 (8.6%) | 0 (0.0%) |
| 5-Person Households | 36 (0.6%) | 0 (0.0%) |
| 6-Person Households | 106 (1.9%) | 0 (0.0%) |
| 7+ Person Households | 11 (0.2%) | 0 (0.0%) |
| Total | 2,945 (52.7%) | 2,648 (47.3%) |
Female Fertility in Branson
Fertility by Age in Branson
Average fertility rate in Branson is 99.0 births per 1,000 women. Women in the age bracket of 20 to 34 years have the highest fertility rate with 170.0 births per 1,000 women. Women in the age bracket of 20 to 34 years acount for 93.3% of all women with births.
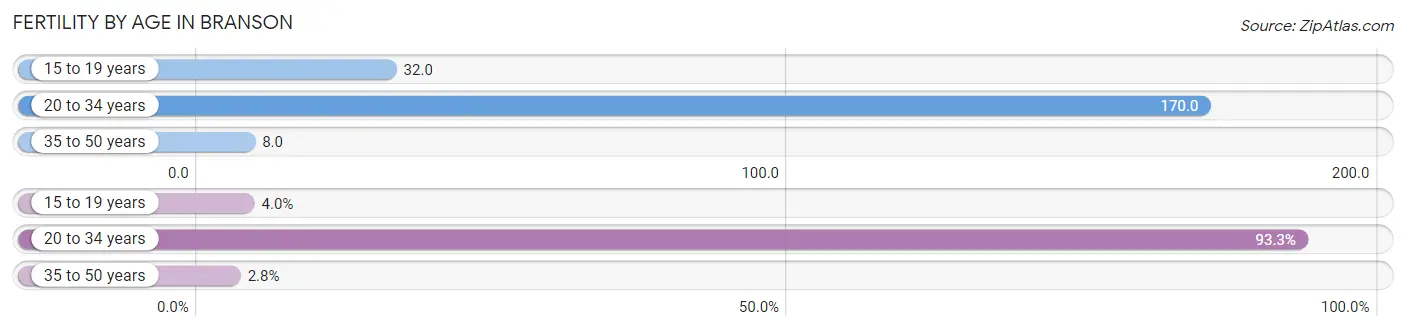
| Age Bracket | Women with Births | Births / 1,000 Women |
| 15 to 19 years | 10 (4.0%) | 32.0 |
| 20 to 34 years | 236 (93.3%) | 170.0 |
| 35 to 50 years | 7 (2.8%) | 8.0 |
| Total | 253 (100.0%) | 99.0 |
Fertility by Age by Marriage Status in Branson
87.0% of women with births (253) in Branson are married. The highest percentage of unmarried women with births falls into 15 to 19 years age bracket with 100.0% of them unmarried at the time of birth, while the lowest percentage of unmarried women with births belong to 20 to 34 years age bracket with 6.8% of them unmarried.
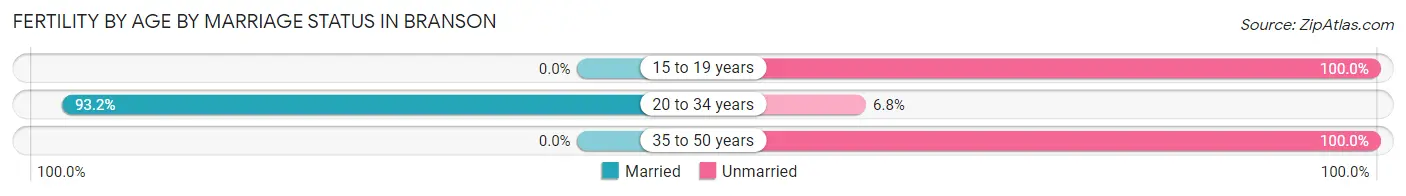
| Age Bracket | Married | Unmarried |
| 15 to 19 years | 0 (0.0%) | 10 (100.0%) |
| 20 to 34 years | 220 (93.2%) | 16 (6.8%) |
| 35 to 50 years | 0 (0.0%) | 7 (100.0%) |
| Total | 220 (87.0%) | 33 (13.0%) |
Fertility by Education in Branson
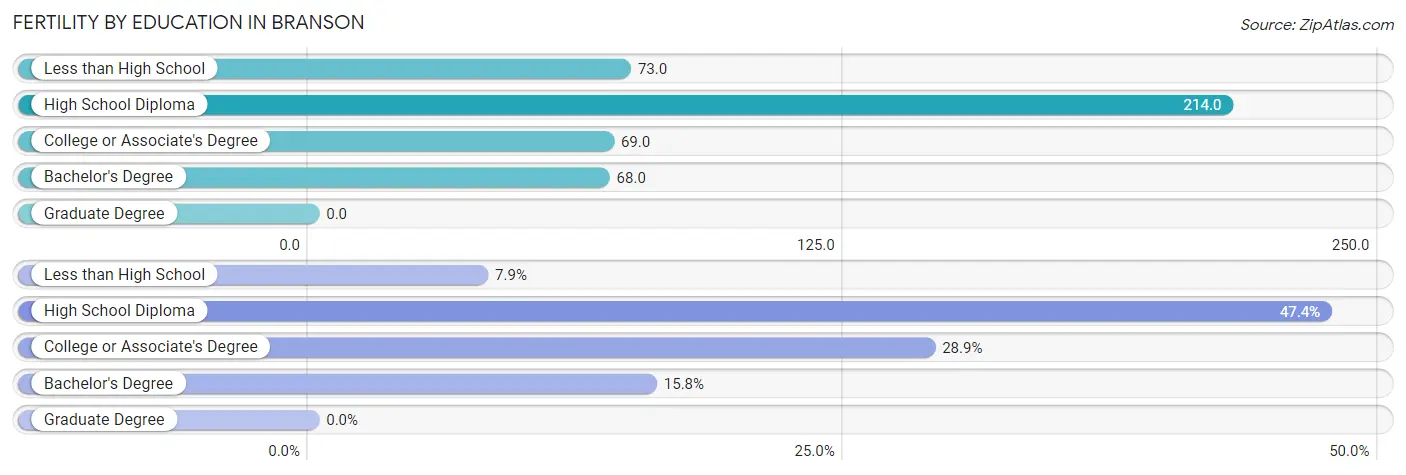
| Educational Attainment | Women with Births | Births / 1,000 Women |
| Less than High School | 20 (7.9%) | 73.0 |
| High School Diploma | 120 (47.4%) | 214.0 |
| College or Associate's Degree | 73 (28.8%) | 69.0 |
| Bachelor's Degree | 40 (15.8%) | 68.0 |
| Graduate Degree | 0 (0.0%) | 0.0 |
| Total | 253 (100.0%) | 99.0 |
Fertility by Education by Marriage Status in Branson
13.0% of women with births in Branson are unmarried. Women with the educational attainment of high school diploma are most likely to be married with 100.0% of them married at childbirth, while women with the educational attainment of less than high school are least likely to be married with 100.0% of them unmarried at childbirth.
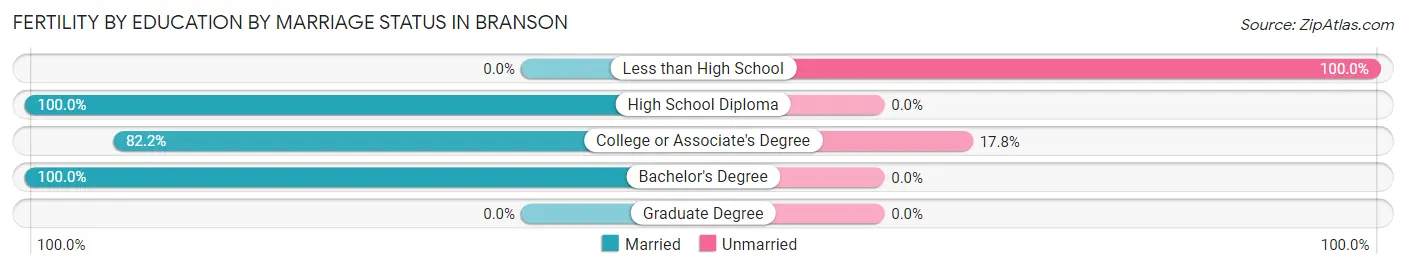
| Educational Attainment | Married | Unmarried |
| Less than High School | 0 (0.0%) | 20 (100.0%) |
| High School Diploma | 120 (100.0%) | 0 (0.0%) |
| College or Associate's Degree | 60 (82.2%) | 13 (17.8%) |
| Bachelor's Degree | 40 (100.0%) | 0 (0.0%) |
| Graduate Degree | 0 (0.0%) | 0 (0.0%) |
| Total | 220 (87.0%) | 33 (13.0%) |
Employment Characteristics in Branson
Employment by Class of Employer in Branson
Among the 5,670 employed individuals in Branson, private company employees (3,906 | 68.9%), self-employed (incorporated) (526 | 9.3%), and self-employed (not incorporated) (401 | 7.1%) make up the most common classes of employment.
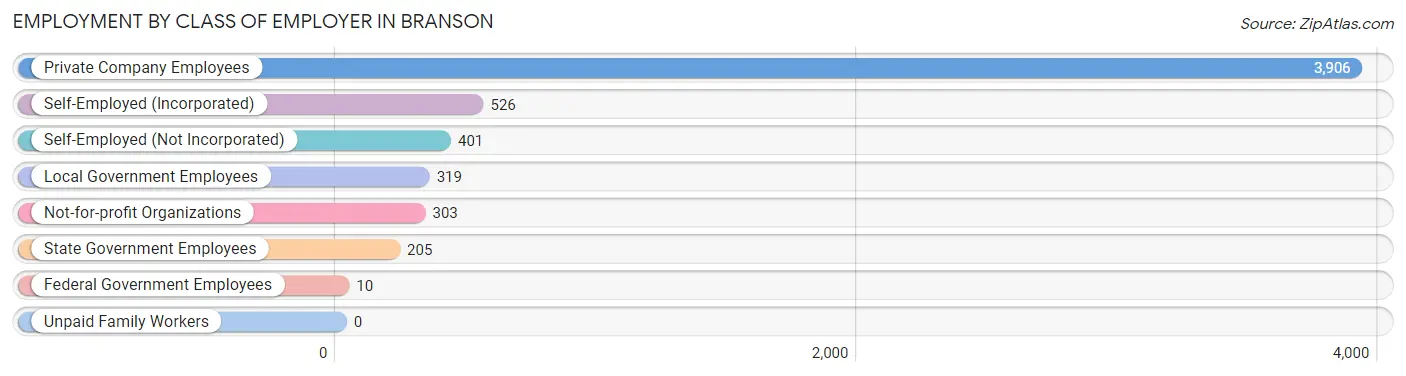
| Employer Class | # Employees | % Employees |
| Private Company Employees | 3,906 | 68.9% |
| Self-Employed (Incorporated) | 526 | 9.3% |
| Self-Employed (Not Incorporated) | 401 | 7.1% |
| Not-for-profit Organizations | 303 | 5.3% |
| Local Government Employees | 319 | 5.6% |
| State Government Employees | 205 | 3.6% |
| Federal Government Employees | 10 | 0.2% |
| Unpaid Family Workers | 0 | 0.0% |
| Total | 5,670 | 100.0% |
Employment Status by Age in Branson
According to the labor force statistics for Branson, out of the total population over 16 years of age (10,639), 57.5% or 6,117 individuals are in the labor force, with 4.0% or 245 of them unemployed. The age group with the highest labor force participation rate is 25 to 29 years, with 92.8% or 881 individuals in the labor force. Within the labor force, the 55 to 59 years age range has the highest percentage of unemployed individuals, with 12.6% or 63 of them being unemployed.
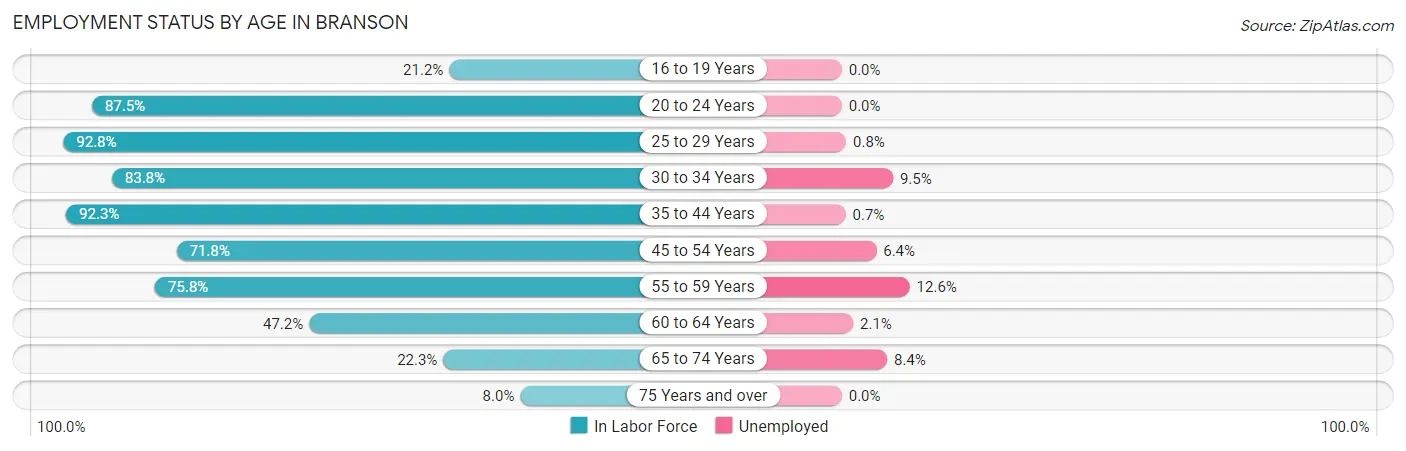
| Age Bracket | In Labor Force | Unemployed |
| 16 to 19 Years | 124 (21.2%) | 0 (0.0%) |
| 20 to 24 Years | 855 (87.5%) | 0 (0.0%) |
| 25 to 29 Years | 881 (92.8%) | 7 (0.8%) |
| 30 to 34 Years | 727 (83.8%) | 69 (9.5%) |
| 35 to 44 Years | 1,229 (92.3%) | 9 (0.7%) |
| 45 to 54 Years | 832 (71.8%) | 53 (6.4%) |
| 55 to 59 Years | 501 (75.8%) | 63 (12.6%) |
| 60 to 64 Years | 472 (47.2%) | 10 (2.1%) |
| 65 to 74 Years | 383 (22.3%) | 32 (8.4%) |
| 75 Years and over | 111 (8.0%) | 0 (0.0%) |
| Total | 6,117 (57.5%) | 245 (4.0%) |
Employment Status by Educational Attainment in Branson
According to labor force statistics for Branson, 77.8% of individuals (4,644) out of the total population between 25 and 64 years of age (5,969) are in the labor force, with 4.6% or 214 of them being unemployed. The group with the highest labor force participation rate are those with the educational attainment of bachelor's degree or higher, with 84.7% or 1,471 individuals in the labor force. Within the labor force, individuals with high school diploma education have the highest percentage of unemployment, with 7.1% or 103 of them being unemployed.
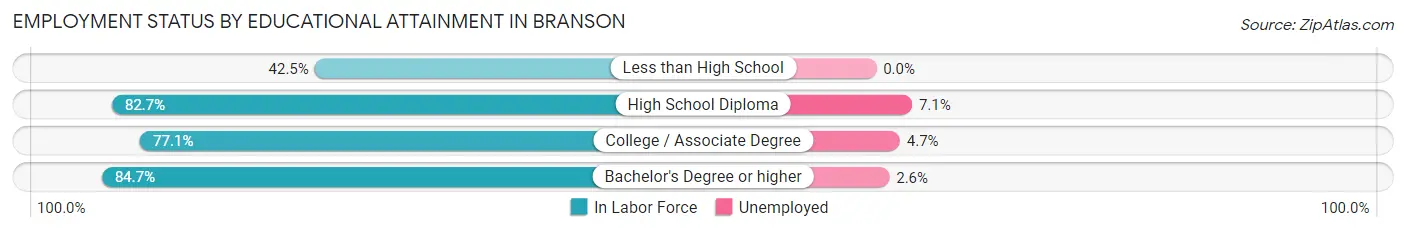
| Educational Attainment | In Labor Force | Unemployed |
| Less than High School | 237 (42.5%) | 0 (0.0%) |
| High School Diploma | 1,452 (82.7%) | 125 (7.1%) |
| College / Associate Degree | 1,480 (77.1%) | 90 (4.7%) |
| Bachelor's Degree or higher | 1,471 (84.7%) | 45 (2.6%) |
| Total | 4,644 (77.8%) | 275 (4.6%) |
Employment Occupations by Sex in Branson
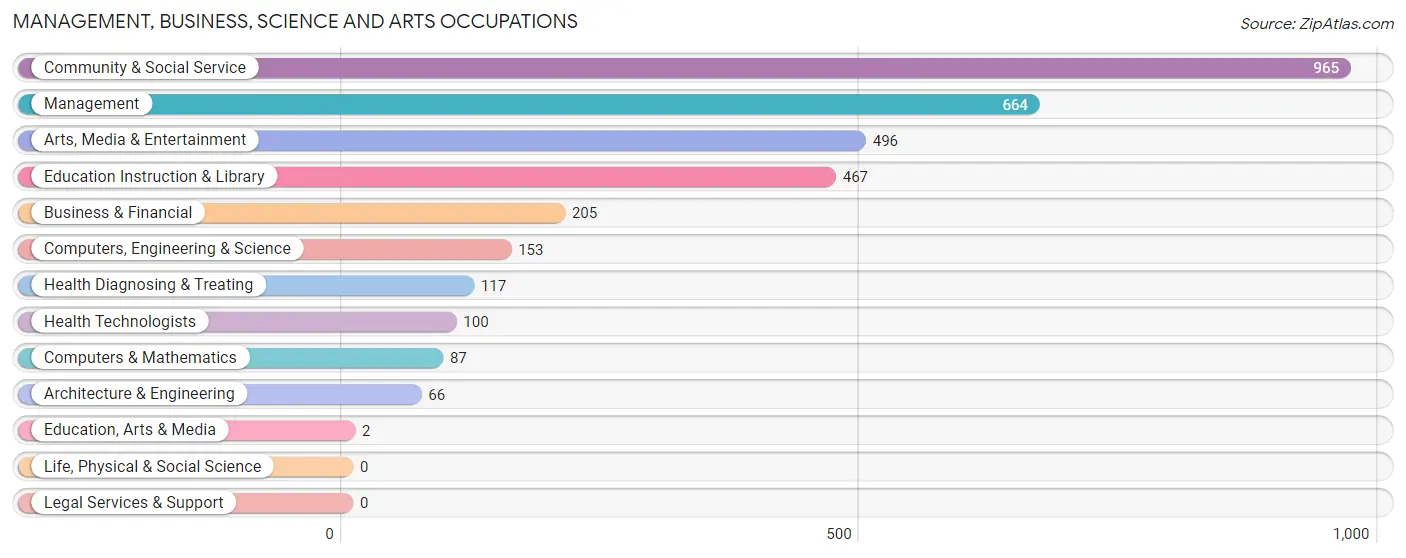
Management, Business, Science and Arts Occupations
The most common Management, Business, Science and Arts occupations in Branson are Community & Social Service (965 | 16.5%), Management (664 | 11.3%), Arts, Media & Entertainment (496 | 8.5%), Education Instruction & Library (467 | 8.0%), and Business & Financial (205 | 3.5%).
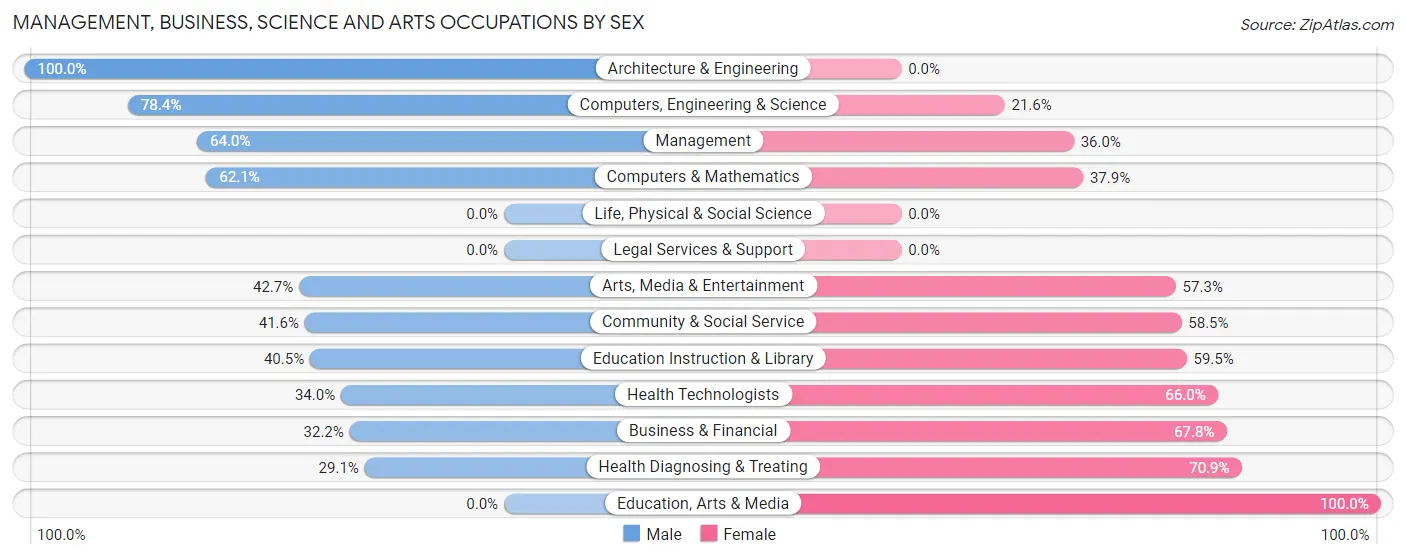
Management, Business, Science and Arts Occupations by Sex
Within the Management, Business, Science and Arts occupations in Branson, the most male-oriented occupations are Architecture & Engineering (100.0%), Computers, Engineering & Science (78.4%), and Management (64.0%), while the most female-oriented occupations are Education, Arts & Media (100.0%), Health Diagnosing & Treating (70.9%), and Business & Financial (67.8%).
| Occupation | Male | Female |
| Management | 425 (64.0%) | 239 (36.0%) |
| Business & Financial | 66 (32.2%) | 139 (67.8%) |
| Computers, Engineering & Science | 120 (78.4%) | 33 (21.6%) |
| Computers & Mathematics | 54 (62.1%) | 33 (37.9%) |
| Architecture & Engineering | 66 (100.0%) | 0 (0.0%) |
| Life, Physical & Social Science | 0 (0.0%) | 0 (0.0%) |
| Community & Social Service | 401 (41.5%) | 564 (58.5%) |
| Education, Arts & Media | 0 (0.0%) | 2 (100.0%) |
| Legal Services & Support | 0 (0.0%) | 0 (0.0%) |
| Education Instruction & Library | 189 (40.5%) | 278 (59.5%) |
| Arts, Media & Entertainment | 212 (42.7%) | 284 (57.3%) |
| Health Diagnosing & Treating | 34 (29.1%) | 83 (70.9%) |
| Health Technologists | 34 (34.0%) | 66 (66.0%) |
| Total (Category) | 1,046 (49.7%) | 1,058 (50.3%) |
| Total (Overall) | 2,929 (50.0%) | 2,932 (50.0%) |
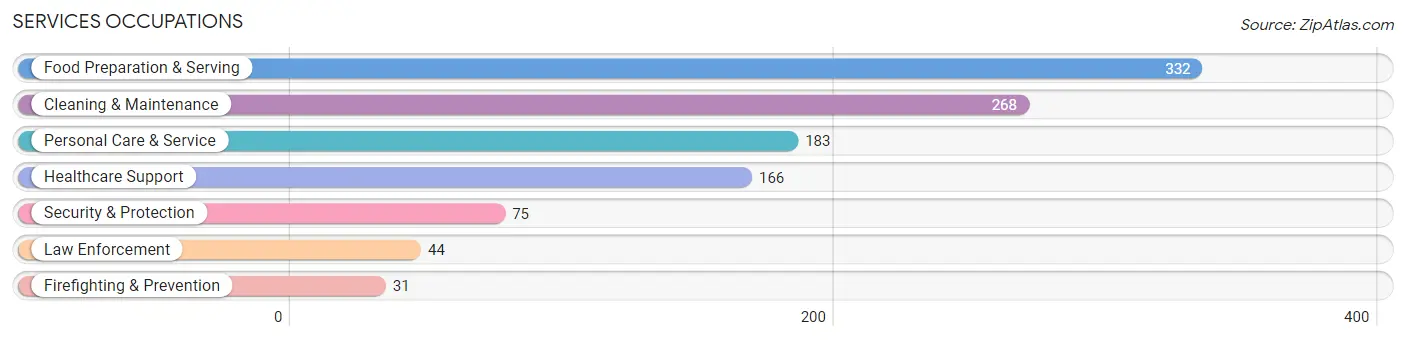
Services Occupations
The most common Services occupations in Branson are Food Preparation & Serving (332 | 5.7%), Cleaning & Maintenance (268 | 4.6%), Personal Care & Service (183 | 3.1%), Healthcare Support (166 | 2.8%), and Security & Protection (75 | 1.3%).
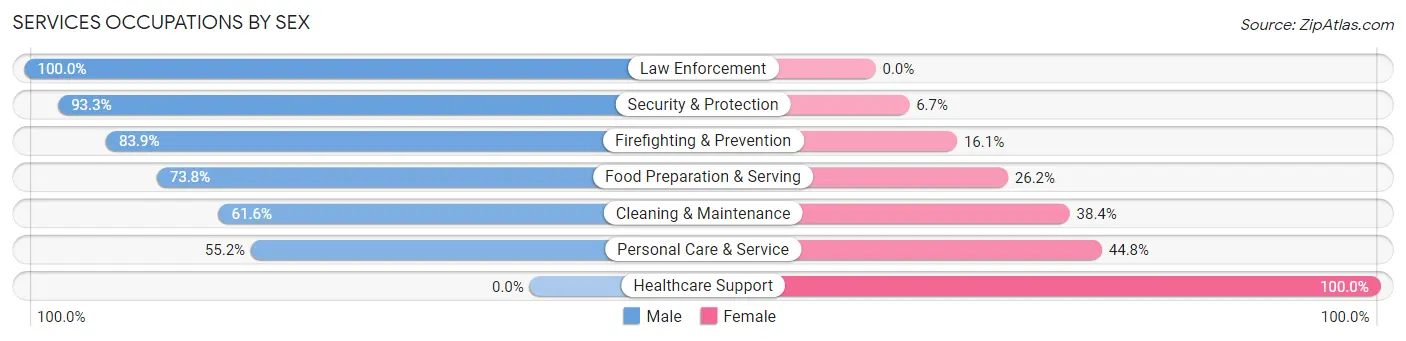
Services Occupations by Sex
Within the Services occupations in Branson, the most male-oriented occupations are Law Enforcement (100.0%), Security & Protection (93.3%), and Firefighting & Prevention (83.9%), while the most female-oriented occupations are Healthcare Support (100.0%), Personal Care & Service (44.8%), and Cleaning & Maintenance (38.4%).
| Occupation | Male | Female |
| Healthcare Support | 0 (0.0%) | 166 (100.0%) |
| Security & Protection | 70 (93.3%) | 5 (6.7%) |
| Firefighting & Prevention | 26 (83.9%) | 5 (16.1%) |
| Law Enforcement | 44 (100.0%) | 0 (0.0%) |
| Food Preparation & Serving | 245 (73.8%) | 87 (26.2%) |
| Cleaning & Maintenance | 165 (61.6%) | 103 (38.4%) |
| Personal Care & Service | 101 (55.2%) | 82 (44.8%) |
| Total (Category) | 581 (56.7%) | 443 (43.3%) |
| Total (Overall) | 2,929 (50.0%) | 2,932 (50.0%) |
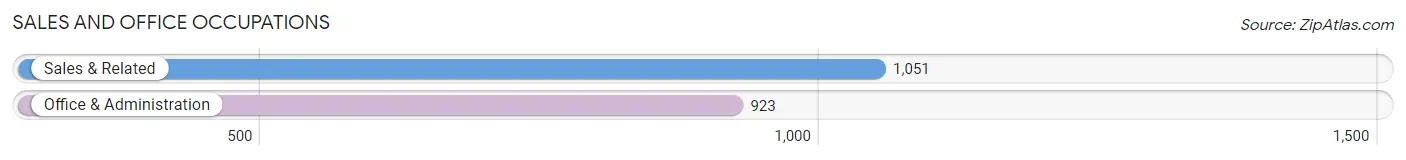
Sales and Office Occupations
The most common Sales and Office occupations in Branson are Sales & Related (1,051 | 17.9%), and Office & Administration (923 | 15.8%).
Sales and Office Occupations by Sex
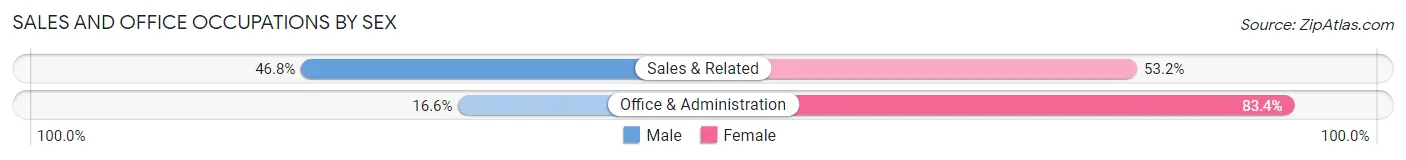
| Occupation | Male | Female |
| Sales & Related | 492 (46.8%) | 559 (53.2%) |
| Office & Administration | 153 (16.6%) | 770 (83.4%) |
| Total (Category) | 645 (32.7%) | 1,329 (67.3%) |
| Total (Overall) | 2,929 (50.0%) | 2,932 (50.0%) |
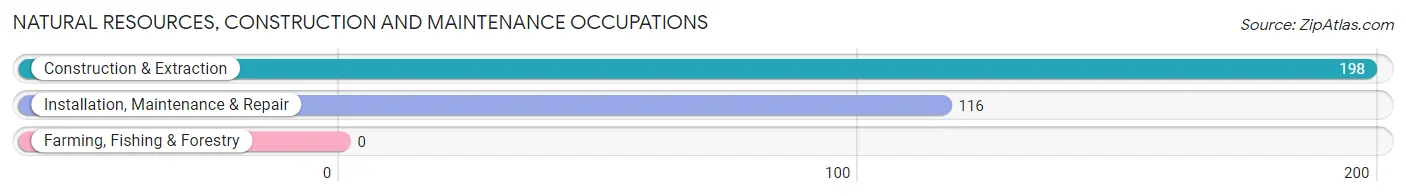
Natural Resources, Construction and Maintenance Occupations
The most common Natural Resources, Construction and Maintenance occupations in Branson are Construction & Extraction (198 | 3.4%), and Installation, Maintenance & Repair (116 | 2.0%).
Natural Resources, Construction and Maintenance Occupations by Sex
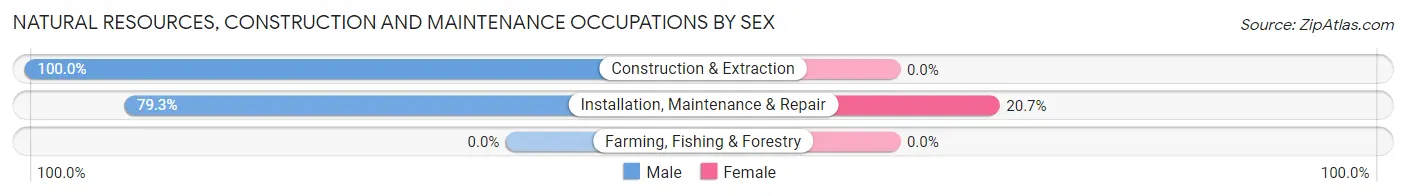
| Occupation | Male | Female |
| Farming, Fishing & Forestry | 0 (0.0%) | 0 (0.0%) |
| Construction & Extraction | 198 (100.0%) | 0 (0.0%) |
| Installation, Maintenance & Repair | 92 (79.3%) | 24 (20.7%) |
| Total (Category) | 290 (92.4%) | 24 (7.6%) |
| Total (Overall) | 2,929 (50.0%) | 2,932 (50.0%) |
Production, Transportation and Moving Occupations
The most common Production, Transportation and Moving occupations in Branson are Production (173 | 2.9%), Material Moving (160 | 2.7%), and Transportation (112 | 1.9%).
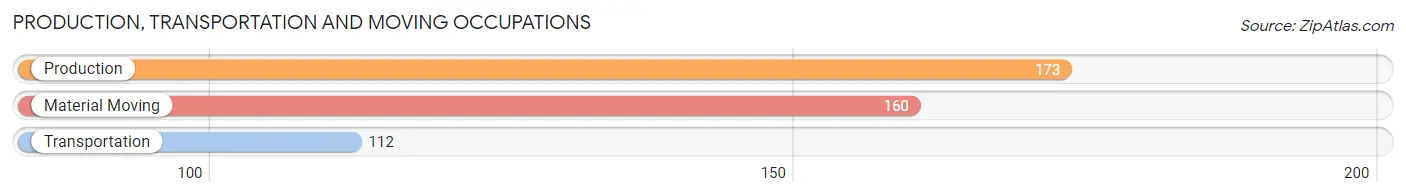
Production, Transportation and Moving Occupations by Sex
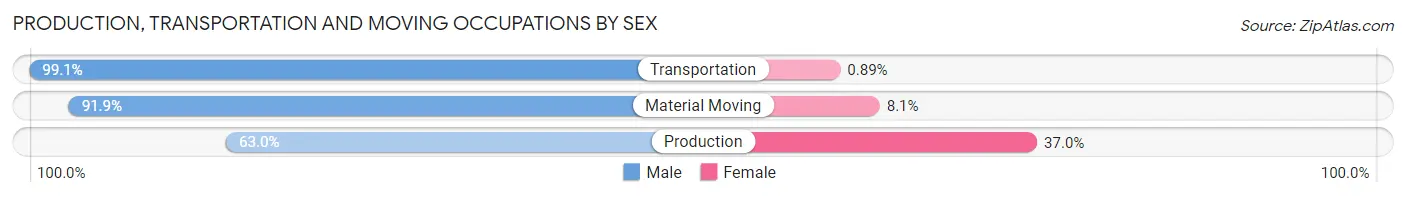
| Occupation | Male | Female |
| Production | 109 (63.0%) | 64 (37.0%) |
| Transportation | 111 (99.1%) | 1 (0.9%) |
| Material Moving | 147 (91.9%) | 13 (8.1%) |
| Total (Category) | 367 (82.5%) | 78 (17.5%) |
| Total (Overall) | 2,929 (50.0%) | 2,932 (50.0%) |
Employment Industries by Sex in Branson
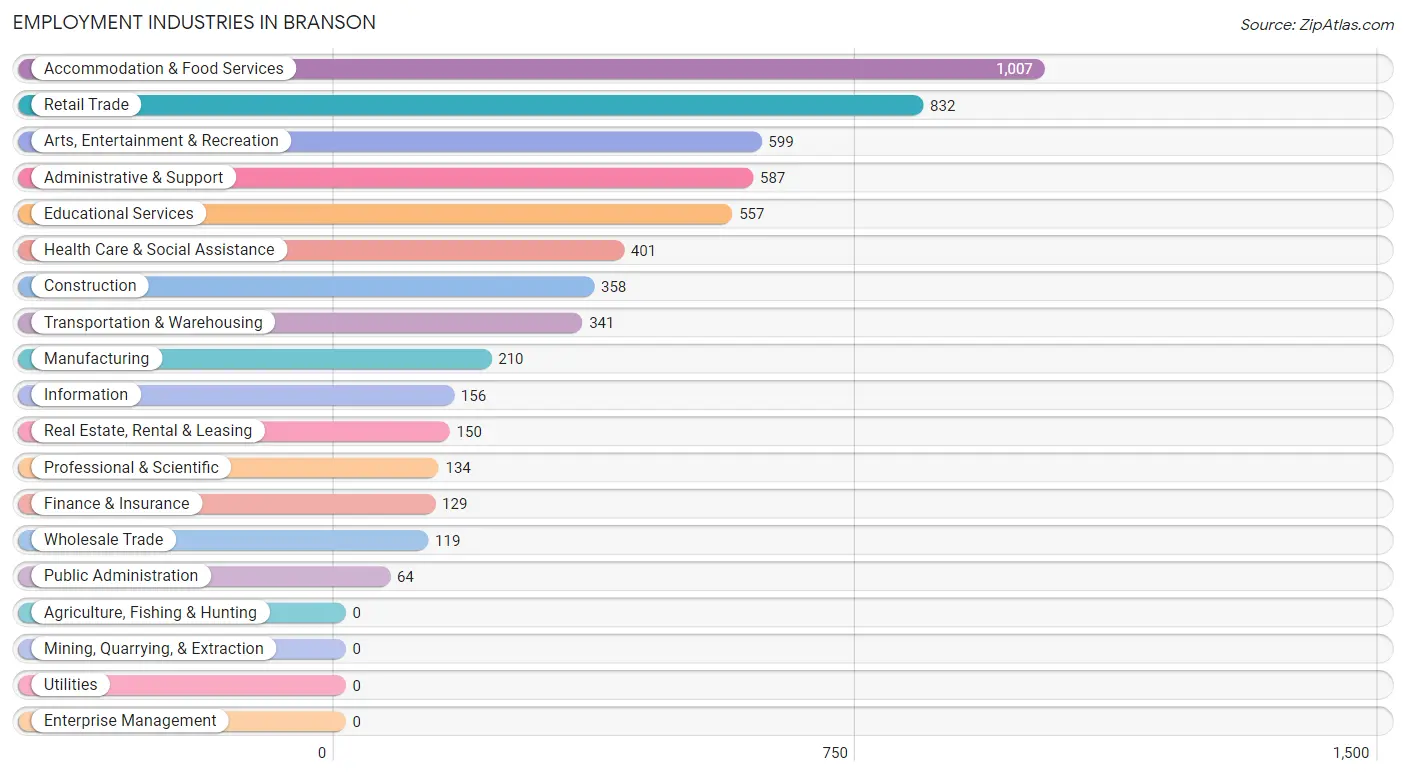
Employment Industries in Branson
The major employment industries in Branson include Accommodation & Food Services (1,007 | 17.2%), Retail Trade (832 | 14.2%), Arts, Entertainment & Recreation (599 | 10.2%), Administrative & Support (587 | 10.0%), and Educational Services (557 | 9.5%).
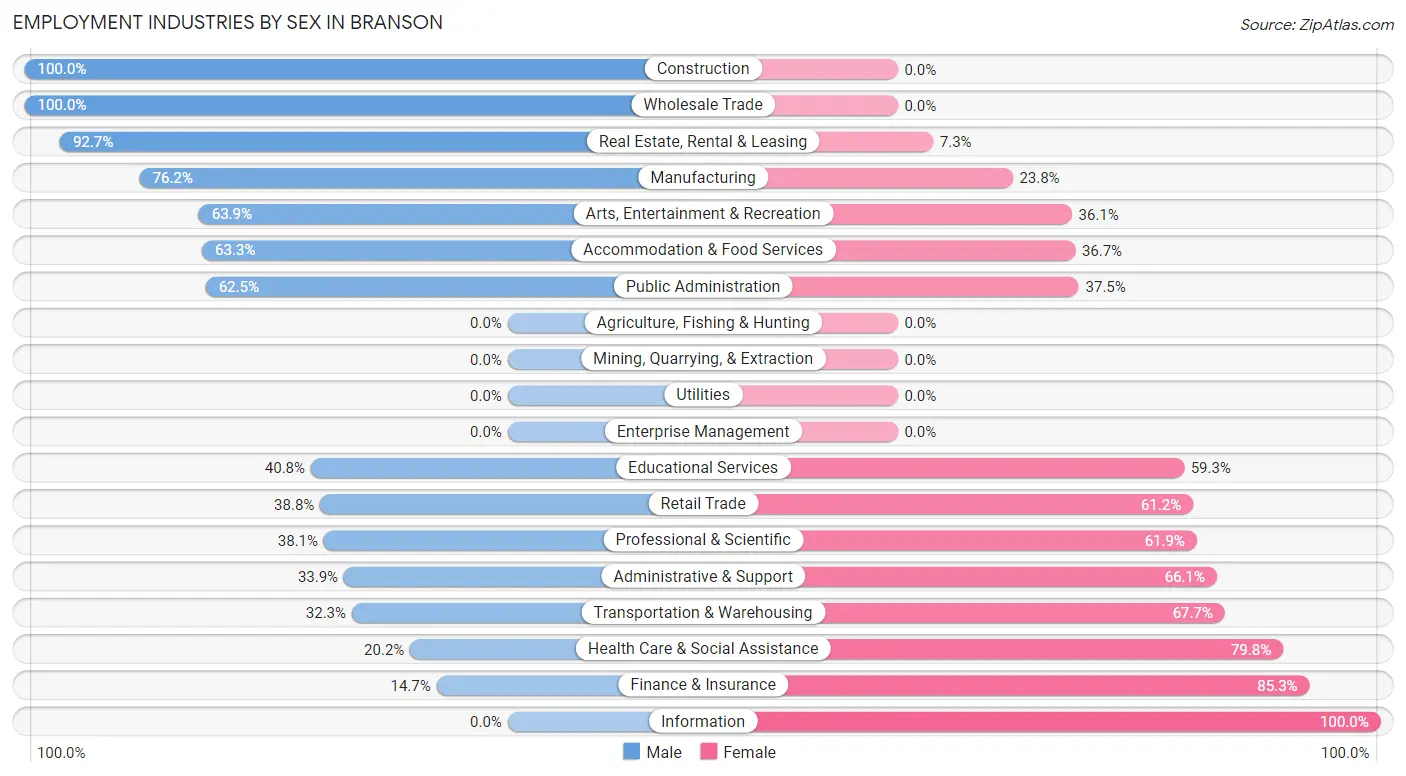
Employment Industries by Sex in Branson
The Branson industries that see more men than women are Construction (100.0%), Wholesale Trade (100.0%), and Real Estate, Rental & Leasing (92.7%), whereas the industries that tend to have a higher number of women are Information (100.0%), Finance & Insurance (85.3%), and Health Care & Social Assistance (79.8%).
| Industry | Male | Female |
| Agriculture, Fishing & Hunting | 0 (0.0%) | 0 (0.0%) |
| Mining, Quarrying, & Extraction | 0 (0.0%) | 0 (0.0%) |
| Construction | 358 (100.0%) | 0 (0.0%) |
| Manufacturing | 160 (76.2%) | 50 (23.8%) |
| Wholesale Trade | 119 (100.0%) | 0 (0.0%) |
| Retail Trade | 323 (38.8%) | 509 (61.2%) |
| Transportation & Warehousing | 110 (32.3%) | 231 (67.7%) |
| Utilities | 0 (0.0%) | 0 (0.0%) |
| Information | 0 (0.0%) | 156 (100.0%) |
| Finance & Insurance | 19 (14.7%) | 110 (85.3%) |
| Real Estate, Rental & Leasing | 139 (92.7%) | 11 (7.3%) |
| Professional & Scientific | 51 (38.1%) | 83 (61.9%) |
| Enterprise Management | 0 (0.0%) | 0 (0.0%) |
| Administrative & Support | 199 (33.9%) | 388 (66.1%) |
| Educational Services | 227 (40.7%) | 330 (59.3%) |
| Health Care & Social Assistance | 81 (20.2%) | 320 (79.8%) |
| Arts, Entertainment & Recreation | 383 (63.9%) | 216 (36.1%) |
| Accommodation & Food Services | 637 (63.3%) | 370 (36.7%) |
| Public Administration | 40 (62.5%) | 24 (37.5%) |
| Total | 2,929 (50.0%) | 2,932 (50.0%) |
Education in Branson
School Enrollment in Branson
The most common levels of schooling among the 1,919 students in Branson are middle school (620 | 32.3%), high school (525 | 27.4%), and college / undergraduate (321 | 16.7%).
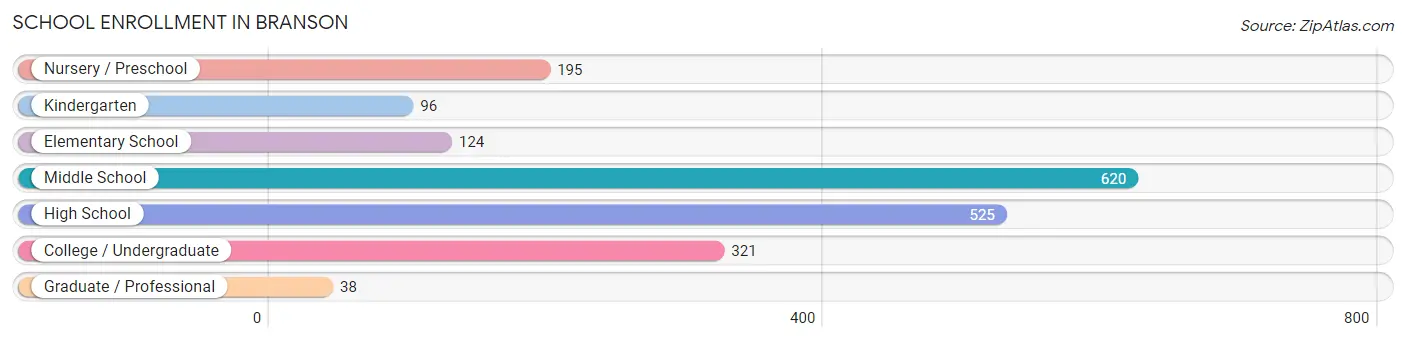
| School Level | # Students | % Students |
| Nursery / Preschool | 195 | 10.2% |
| Kindergarten | 96 | 5.0% |
| Elementary School | 124 | 6.5% |
| Middle School | 620 | 32.3% |
| High School | 525 | 27.4% |
| College / Undergraduate | 321 | 16.7% |
| Graduate / Professional | 38 | 2.0% |
| Total | 1,919 | 100.0% |
School Enrollment by Age by Funding Source in Branson
Out of a total of 1,919 students who are enrolled in schools in Branson, 186 (9.7%) attend a private institution, while the remaining 1,733 (90.3%) are enrolled in public schools. The age group of 20 to 24 year olds has the highest likelihood of being enrolled in private schools, with 88 (60.3% in the age bracket) enrolled. Conversely, the age group of 25 to 34 year olds has the lowest likelihood of being enrolled in a private school, with 9 (100.0% in the age bracket) attending a public institution.
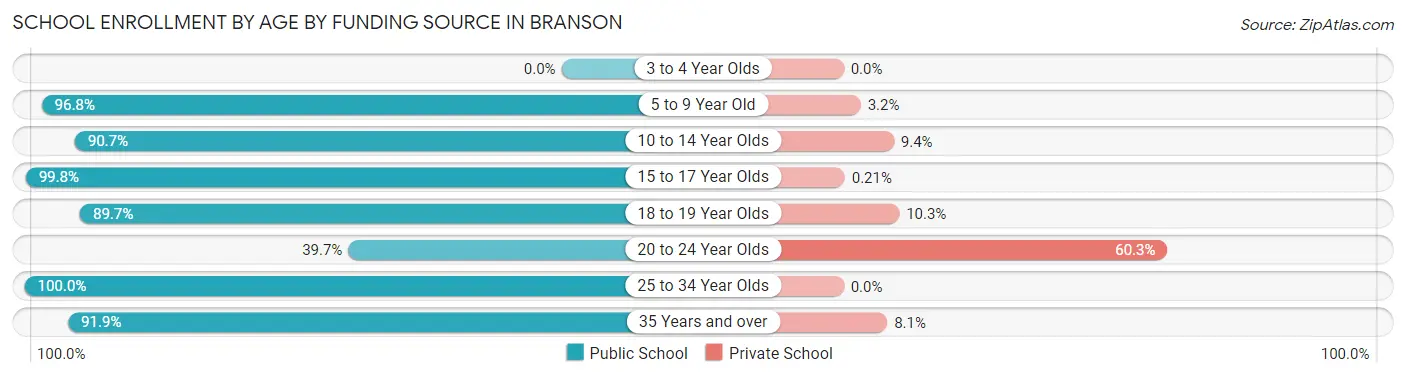
| Age Bracket | Public School | Private School |
| 3 to 4 Year Olds | 0 (0.0%) | 0 (0.0%) |
| 5 to 9 Year Old | 367 (96.8%) | 12 (3.2%) |
| 10 to 14 Year Olds | 630 (90.6%) | 65 (9.3%) |
| 15 to 17 Year Olds | 470 (99.8%) | 1 (0.2%) |
| 18 to 19 Year Olds | 130 (89.7%) | 15 (10.3%) |
| 20 to 24 Year Olds | 58 (39.7%) | 88 (60.3%) |
| 25 to 34 Year Olds | 9 (100.0%) | 0 (0.0%) |
| 35 Years and over | 68 (91.9%) | 6 (8.1%) |
| Total | 1,733 (90.3%) | 186 (9.7%) |
Educational Attainment by Field of Study in Branson
Business (620 | 23.2%), science & technology (518 | 19.4%), education (513 | 19.2%), social sciences (218 | 8.2%), and visual & performing arts (197 | 7.4%) are the most common fields of study among 2,672 individuals in Branson who have obtained a bachelor's degree or higher.
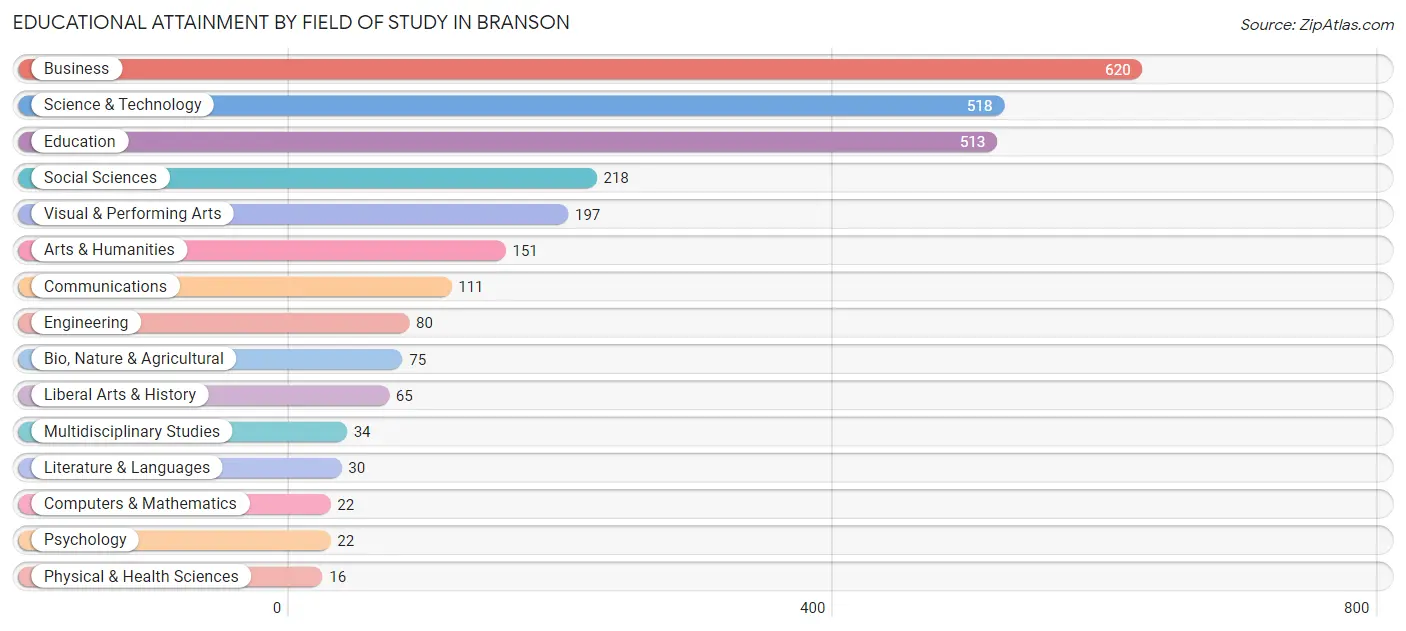
| Field of Study | # Graduates | % Graduates |
| Computers & Mathematics | 22 | 0.8% |
| Bio, Nature & Agricultural | 75 | 2.8% |
| Physical & Health Sciences | 16 | 0.6% |
| Psychology | 22 | 0.8% |
| Social Sciences | 218 | 8.2% |
| Engineering | 80 | 3.0% |
| Multidisciplinary Studies | 34 | 1.3% |
| Science & Technology | 518 | 19.4% |
| Business | 620 | 23.2% |
| Education | 513 | 19.2% |
| Literature & Languages | 30 | 1.1% |
| Liberal Arts & History | 65 | 2.4% |
| Visual & Performing Arts | 197 | 7.4% |
| Communications | 111 | 4.2% |
| Arts & Humanities | 151 | 5.7% |
| Total | 2,672 | 100.0% |
Transportation & Commute in Branson
Vehicle Availability by Sex in Branson
The most prevalent vehicle ownership categories in Branson are males with 2 vehicles (1,495, accounting for 51.2%) and females with 2 vehicles (950, making up 54.4%).
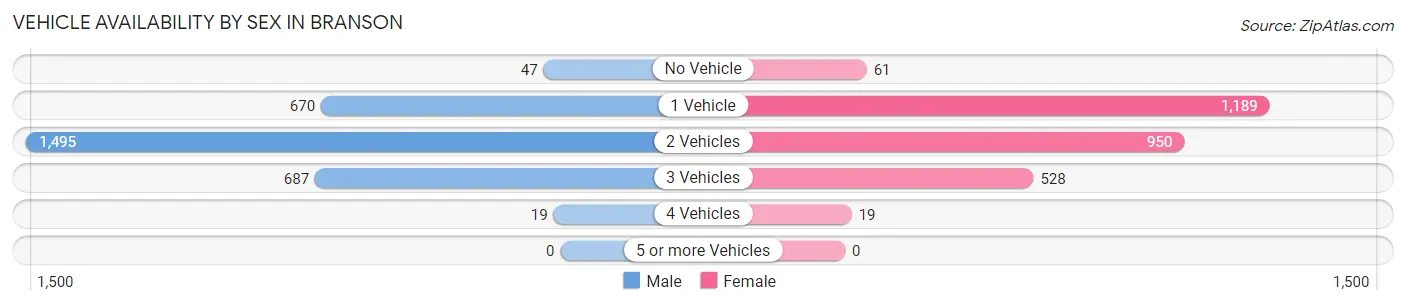
| Vehicles Available | Male | Female |
| No Vehicle | 47 (1.6%) | 61 (2.2%) |
| 1 Vehicle | 670 (23.0%) | 1,189 (43.3%) |
| 2 Vehicles | 1,495 (51.2%) | 950 (34.6%) |
| 3 Vehicles | 687 (23.5%) | 528 (19.2%) |
| 4 Vehicles | 19 (0.6%) | 19 (0.7%) |
| 5 or more Vehicles | 0 (0.0%) | 0 (0.0%) |
| Total | 2,918 (100.0%) | 2,747 (100.0%) |
Commute Time in Branson
The most frequently occuring commute durations in Branson are 15 to 19 minutes (1,266 commuters, 25.7%), 10 to 14 minutes (1,196 commuters, 24.3%), and 20 to 24 minutes (831 commuters, 16.9%).
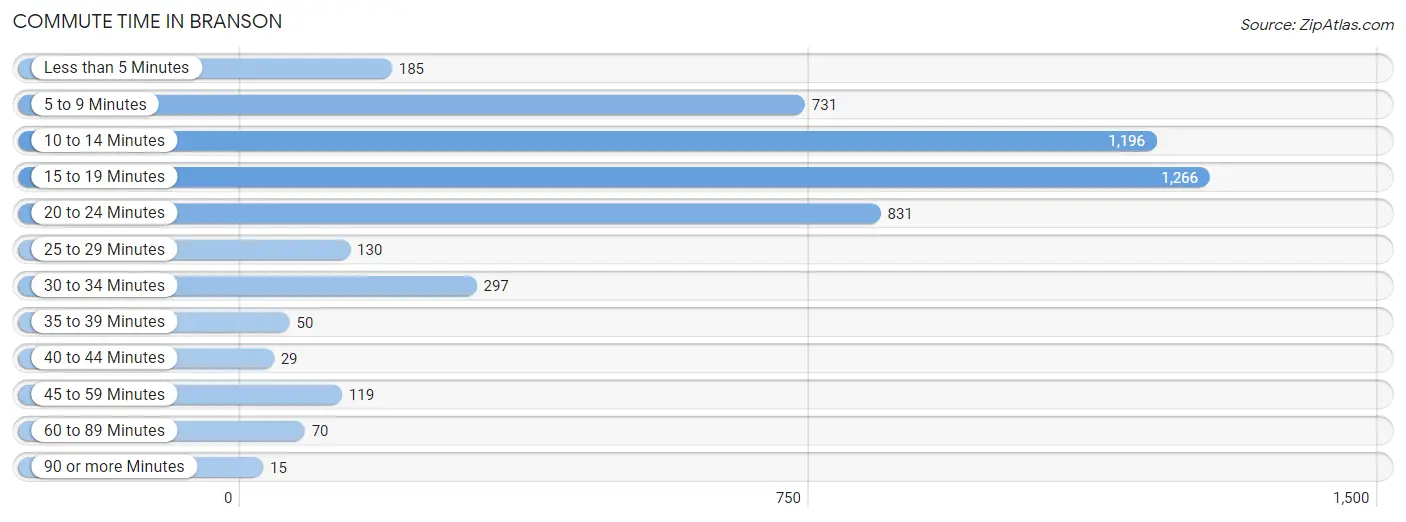
| Commute Time | # Commuters | % Commuters |
| Less than 5 Minutes | 185 | 3.8% |
| 5 to 9 Minutes | 731 | 14.9% |
| 10 to 14 Minutes | 1,196 | 24.3% |
| 15 to 19 Minutes | 1,266 | 25.7% |
| 20 to 24 Minutes | 831 | 16.9% |
| 25 to 29 Minutes | 130 | 2.6% |
| 30 to 34 Minutes | 297 | 6.0% |
| 35 to 39 Minutes | 50 | 1.0% |
| 40 to 44 Minutes | 29 | 0.6% |
| 45 to 59 Minutes | 119 | 2.4% |
| 60 to 89 Minutes | 70 | 1.4% |
| 90 or more Minutes | 15 | 0.3% |
Commute Time by Sex in Branson
The most common commute times in Branson are 15 to 19 minutes (626 commuters, 26.4%) for males and 10 to 14 minutes (743 commuters, 29.2%) for females.
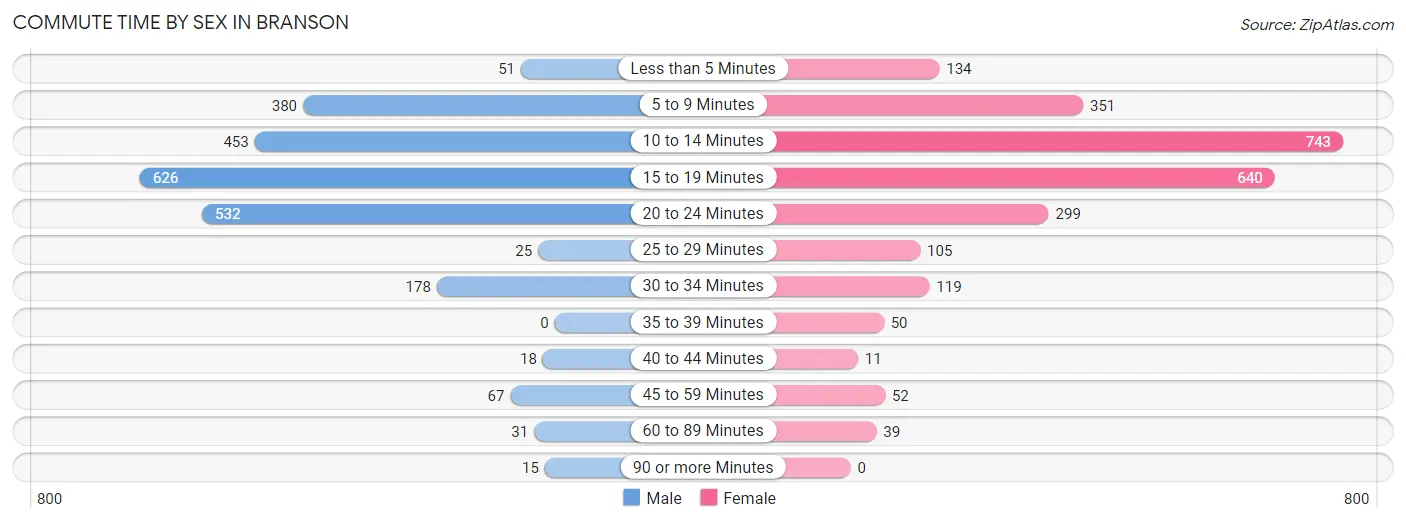
| Commute Time | Male | Female |
| Less than 5 Minutes | 51 (2.1%) | 134 (5.3%) |
| 5 to 9 Minutes | 380 (16.0%) | 351 (13.8%) |
| 10 to 14 Minutes | 453 (19.1%) | 743 (29.2%) |
| 15 to 19 Minutes | 626 (26.4%) | 640 (25.2%) |
| 20 to 24 Minutes | 532 (22.4%) | 299 (11.8%) |
| 25 to 29 Minutes | 25 (1.1%) | 105 (4.1%) |
| 30 to 34 Minutes | 178 (7.5%) | 119 (4.7%) |
| 35 to 39 Minutes | 0 (0.0%) | 50 (2.0%) |
| 40 to 44 Minutes | 18 (0.8%) | 11 (0.4%) |
| 45 to 59 Minutes | 67 (2.8%) | 52 (2.0%) |
| 60 to 89 Minutes | 31 (1.3%) | 39 (1.5%) |
| 90 or more Minutes | 15 (0.6%) | 0 (0.0%) |
Time of Departure to Work by Sex in Branson
The most frequent times of departure to work in Branson are 7:00 AM to 7:29 AM (446, 18.8%) for males and 12:00 PM to 3:59 PM (458, 18.0%) for females.
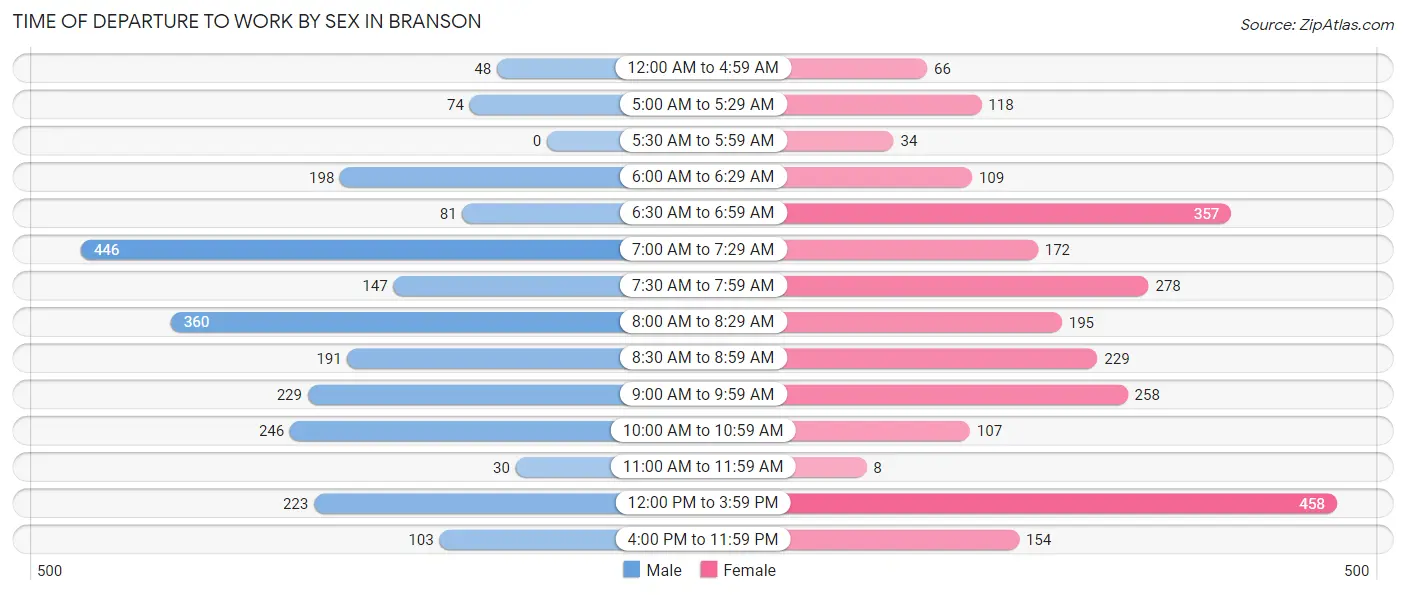
| Time of Departure | Male | Female |
| 12:00 AM to 4:59 AM | 48 (2.0%) | 66 (2.6%) |
| 5:00 AM to 5:29 AM | 74 (3.1%) | 118 (4.6%) |
| 5:30 AM to 5:59 AM | 0 (0.0%) | 34 (1.3%) |
| 6:00 AM to 6:29 AM | 198 (8.3%) | 109 (4.3%) |
| 6:30 AM to 6:59 AM | 81 (3.4%) | 357 (14.0%) |
| 7:00 AM to 7:29 AM | 446 (18.8%) | 172 (6.8%) |
| 7:30 AM to 7:59 AM | 147 (6.2%) | 278 (10.9%) |
| 8:00 AM to 8:29 AM | 360 (15.1%) | 195 (7.7%) |
| 8:30 AM to 8:59 AM | 191 (8.0%) | 229 (9.0%) |
| 9:00 AM to 9:59 AM | 229 (9.6%) | 258 (10.2%) |
| 10:00 AM to 10:59 AM | 246 (10.3%) | 107 (4.2%) |
| 11:00 AM to 11:59 AM | 30 (1.3%) | 8 (0.3%) |
| 12:00 PM to 3:59 PM | 223 (9.4%) | 458 (18.0%) |
| 4:00 PM to 11:59 PM | 103 (4.3%) | 154 (6.1%) |
| Total | 2,376 (100.0%) | 2,543 (100.0%) |
Housing Occupancy in Branson
Occupancy by Ownership in Branson
Of the total 5,593 dwellings in Branson, owner-occupied units account for 2,521 (45.1%), while renter-occupied units make up 3,072 (54.9%).
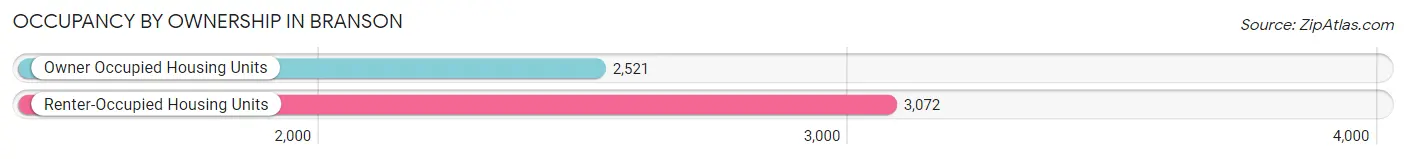
| Occupancy | # Housing Units | % Housing Units |
| Owner Occupied Housing Units | 2,521 | 45.1% |
| Renter-Occupied Housing Units | 3,072 | 54.9% |
| Total Occupied Housing Units | 5,593 | 100.0% |
Occupancy by Household Size in Branson
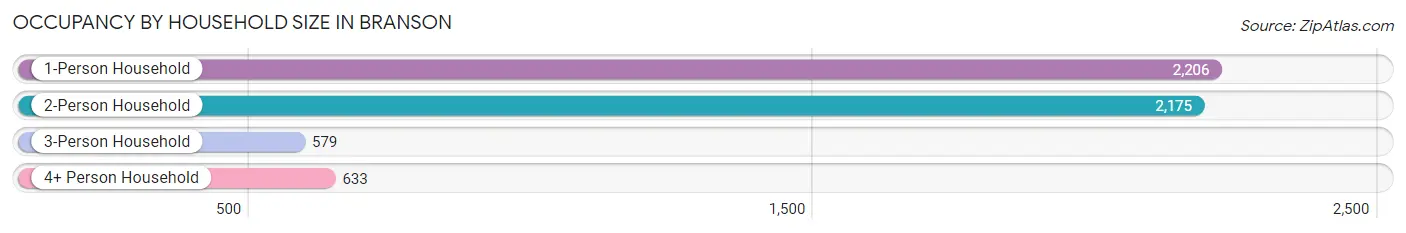
| Household Size | # Housing Units | % Housing Units |
| 1-Person Household | 2,206 | 39.4% |
| 2-Person Household | 2,175 | 38.9% |
| 3-Person Household | 579 | 10.3% |
| 4+ Person Household | 633 | 11.3% |
| Total Housing Units | 5,593 | 100.0% |
Occupancy by Ownership by Household Size in Branson
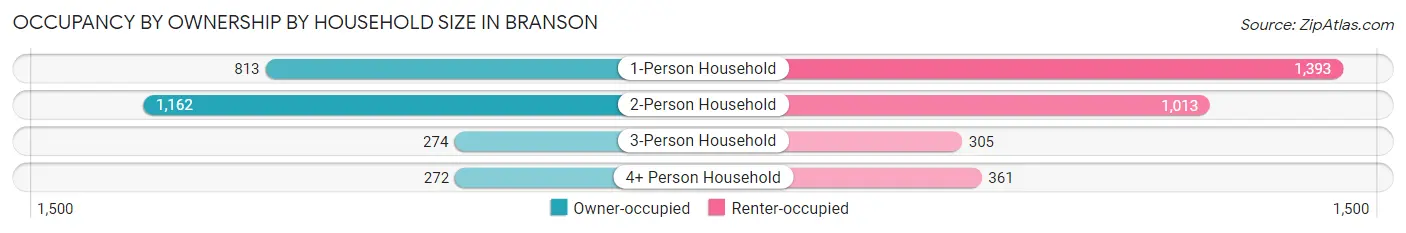
| Household Size | Owner-occupied | Renter-occupied |
| 1-Person Household | 813 (36.8%) | 1,393 (63.1%) |
| 2-Person Household | 1,162 (53.4%) | 1,013 (46.6%) |
| 3-Person Household | 274 (47.3%) | 305 (52.7%) |
| 4+ Person Household | 272 (43.0%) | 361 (57.0%) |
| Total Housing Units | 2,521 (45.1%) | 3,072 (54.9%) |
Occupancy by Educational Attainment in Branson
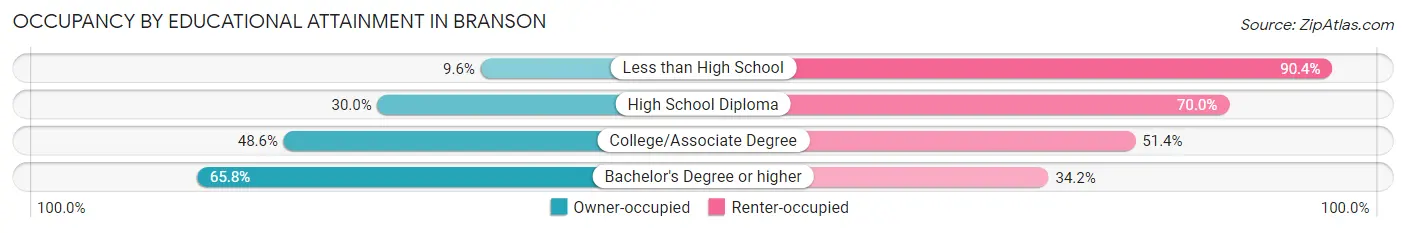
| Household Size | Owner-occupied | Renter-occupied |
| Less than High School | 50 (9.6%) | 472 (90.4%) |
| High School Diploma | 411 (30.0%) | 958 (70.0%) |
| College/Associate Degree | 1,064 (48.6%) | 1,125 (51.4%) |
| Bachelor's Degree or higher | 996 (65.8%) | 517 (34.2%) |
Occupancy by Age of Householder in Branson
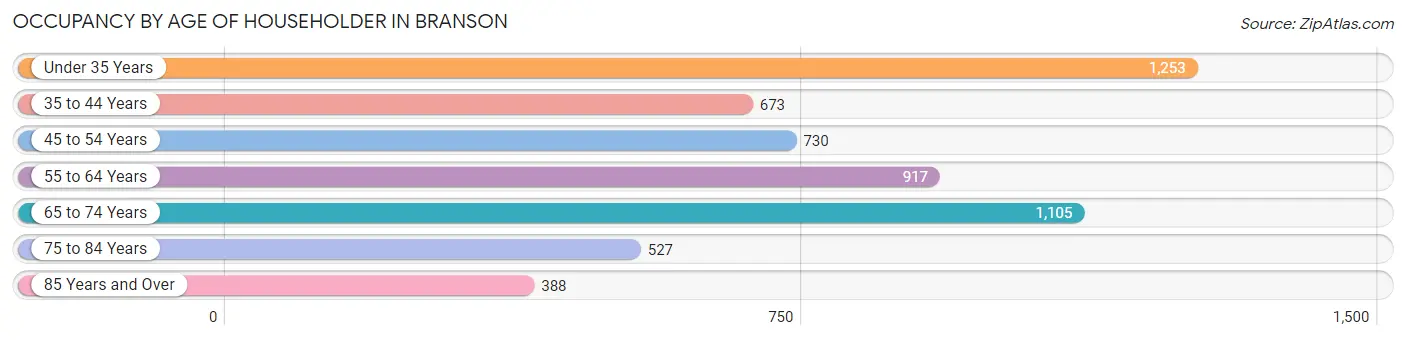
| Age Bracket | # Households | % Households |
| Under 35 Years | 1,253 | 22.4% |
| 35 to 44 Years | 673 | 12.0% |
| 45 to 54 Years | 730 | 13.1% |
| 55 to 64 Years | 917 | 16.4% |
| 65 to 74 Years | 1,105 | 19.8% |
| 75 to 84 Years | 527 | 9.4% |
| 85 Years and Over | 388 | 6.9% |
| Total | 5,593 | 100.0% |
Housing Finances in Branson
Median Income by Occupancy in Branson
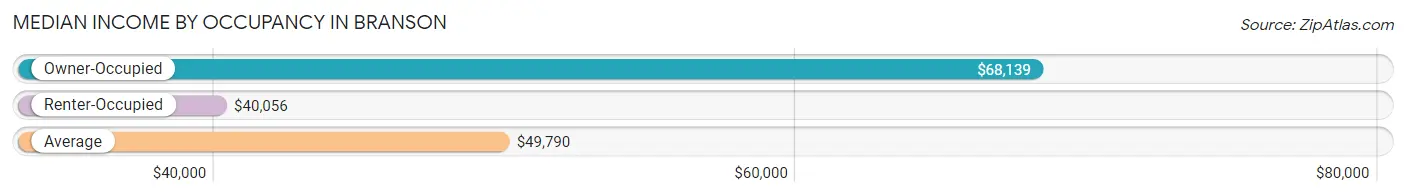
| Occupancy Type | # Households | Median Income |
| Owner-Occupied | 2,521 (45.1%) | $68,139 |
| Renter-Occupied | 3,072 (54.9%) | $40,056 |
| Average | 5,593 (100.0%) | $49,790 |
Occupancy by Householder Income Bracket in Branson
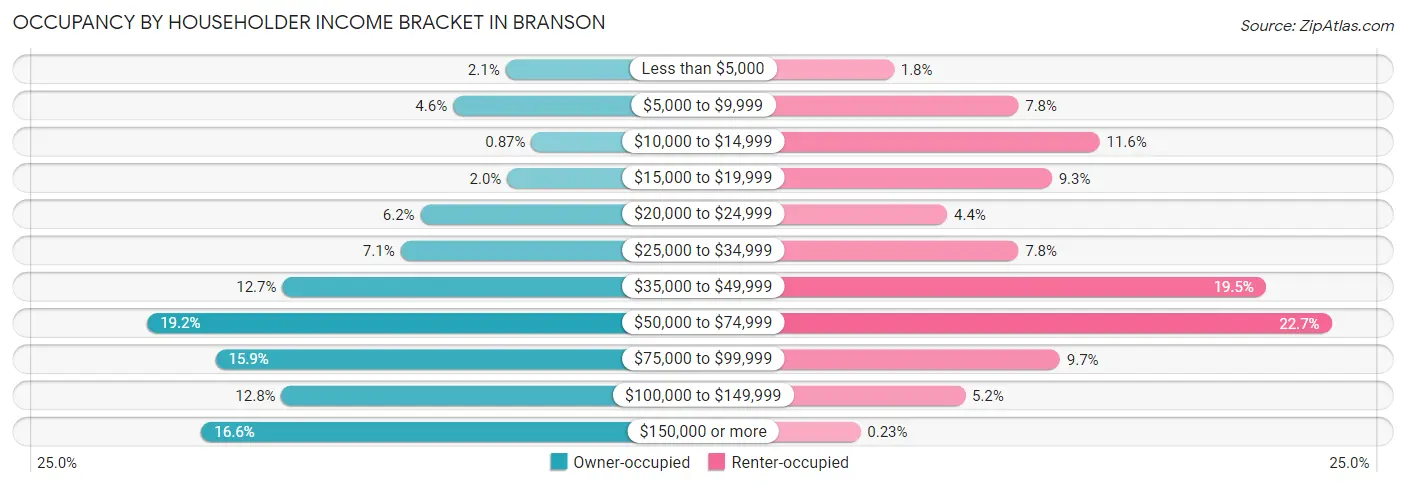
| Income Bracket | Owner-occupied | Renter-occupied |
| Less than $5,000 | 53 (2.1%) | 56 (1.8%) |
| $5,000 to $9,999 | 116 (4.6%) | 238 (7.7%) |
| $10,000 to $14,999 | 22 (0.9%) | 357 (11.6%) |
| $15,000 to $19,999 | 51 (2.0%) | 287 (9.3%) |
| $20,000 to $24,999 | 155 (6.1%) | 134 (4.4%) |
| $25,000 to $34,999 | 179 (7.1%) | 238 (7.7%) |
| $35,000 to $49,999 | 321 (12.7%) | 600 (19.5%) |
| $50,000 to $74,999 | 483 (19.2%) | 696 (22.7%) |
| $75,000 to $99,999 | 401 (15.9%) | 299 (9.7%) |
| $100,000 to $149,999 | 322 (12.8%) | 160 (5.2%) |
| $150,000 or more | 418 (16.6%) | 7 (0.2%) |
| Total | 2,521 (100.0%) | 3,072 (100.0%) |
Monthly Housing Cost Tiers in Branson
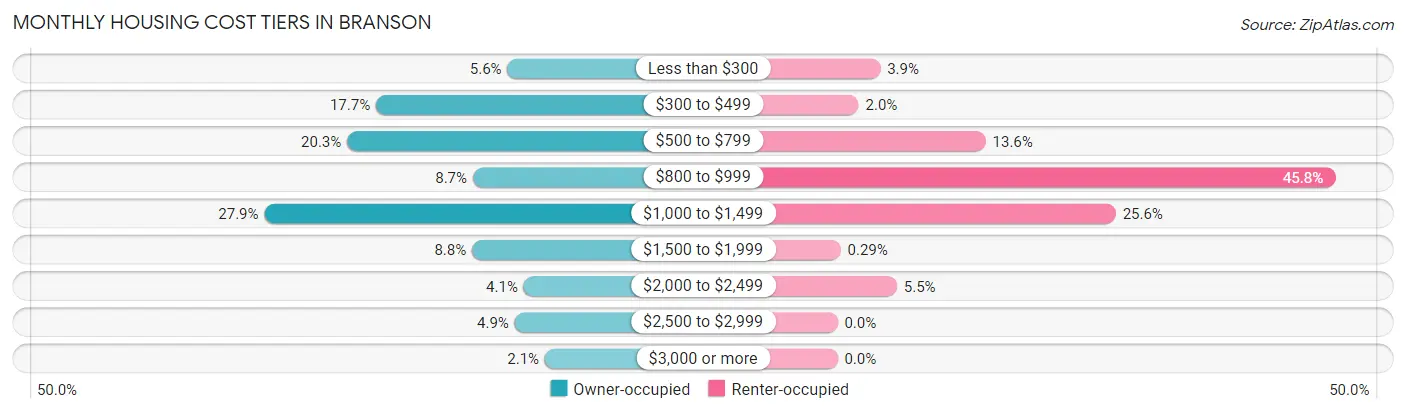
| Monthly Cost | Owner-occupied | Renter-occupied |
| Less than $300 | 140 (5.6%) | 121 (3.9%) |
| $300 to $499 | 445 (17.6%) | 60 (1.9%) |
| $500 to $799 | 512 (20.3%) | 419 (13.6%) |
| $800 to $999 | 220 (8.7%) | 1,407 (45.8%) |
| $1,000 to $1,499 | 704 (27.9%) | 787 (25.6%) |
| $1,500 to $1,999 | 222 (8.8%) | 9 (0.3%) |
| $2,000 to $2,499 | 102 (4.1%) | 168 (5.5%) |
| $2,500 to $2,999 | 123 (4.9%) | 0 (0.0%) |
| $3,000 or more | 53 (2.1%) | 0 (0.0%) |
| Total | 2,521 (100.0%) | 3,072 (100.0%) |
Physical Housing Characteristics in Branson
Housing Structures in Branson
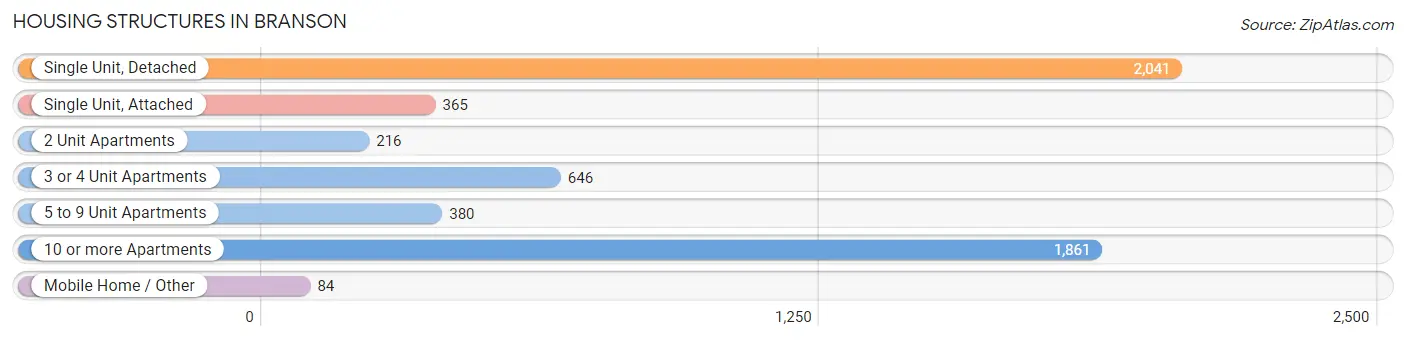
| Structure Type | # Housing Units | % Housing Units |
| Single Unit, Detached | 2,041 | 36.5% |
| Single Unit, Attached | 365 | 6.5% |
| 2 Unit Apartments | 216 | 3.9% |
| 3 or 4 Unit Apartments | 646 | 11.6% |
| 5 to 9 Unit Apartments | 380 | 6.8% |
| 10 or more Apartments | 1,861 | 33.3% |
| Mobile Home / Other | 84 | 1.5% |
| Total | 5,593 | 100.0% |
Housing Structures by Occupancy in Branson
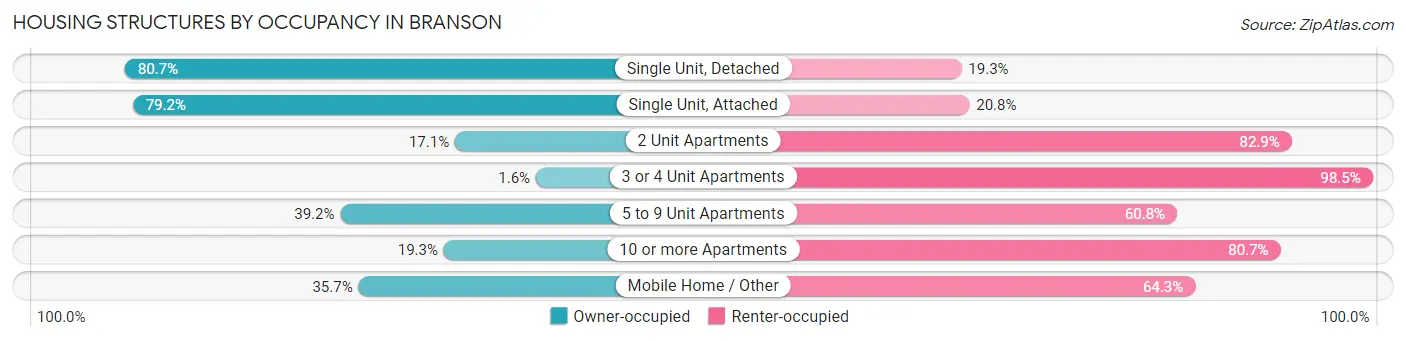
| Structure Type | Owner-occupied | Renter-occupied |
| Single Unit, Detached | 1,647 (80.7%) | 394 (19.3%) |
| Single Unit, Attached | 289 (79.2%) | 76 (20.8%) |
| 2 Unit Apartments | 37 (17.1%) | 179 (82.9%) |
| 3 or 4 Unit Apartments | 10 (1.5%) | 636 (98.5%) |
| 5 to 9 Unit Apartments | 149 (39.2%) | 231 (60.8%) |
| 10 or more Apartments | 359 (19.3%) | 1,502 (80.7%) |
| Mobile Home / Other | 30 (35.7%) | 54 (64.3%) |
| Total | 2,521 (45.1%) | 3,072 (54.9%) |
Housing Structures by Number of Rooms in Branson
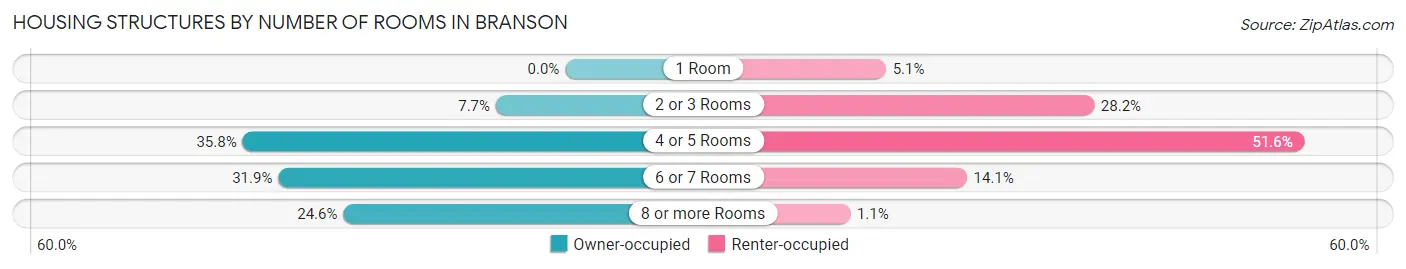
| Number of Rooms | Owner-occupied | Renter-occupied |
| 1 Room | 0 (0.0%) | 156 (5.1%) |
| 2 or 3 Rooms | 194 (7.7%) | 866 (28.2%) |
| 4 or 5 Rooms | 903 (35.8%) | 1,584 (51.6%) |
| 6 or 7 Rooms | 803 (31.9%) | 432 (14.1%) |
| 8 or more Rooms | 621 (24.6%) | 34 (1.1%) |
| Total | 2,521 (100.0%) | 3,072 (100.0%) |
Housing Structure by Heating Type in Branson
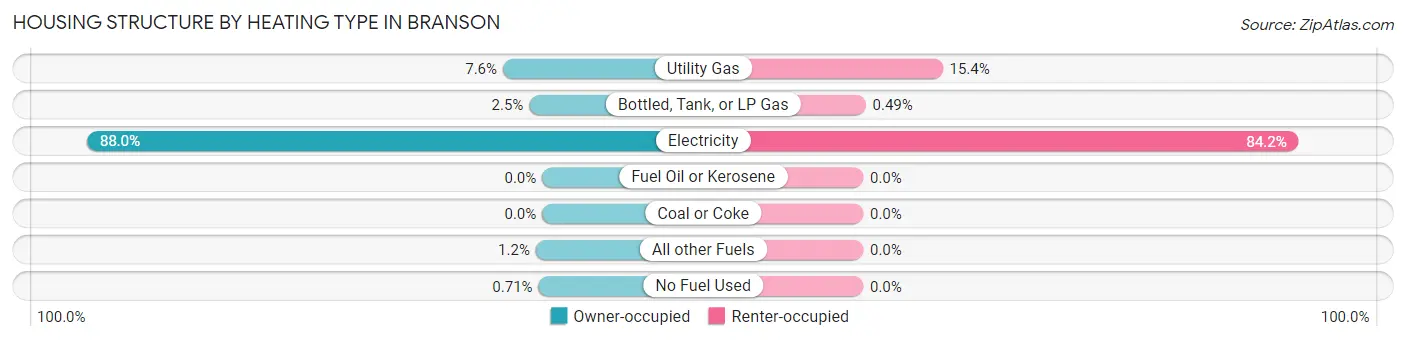
| Heating Type | Owner-occupied | Renter-occupied |
| Utility Gas | 191 (7.6%) | 472 (15.4%) |
| Bottled, Tank, or LP Gas | 63 (2.5%) | 15 (0.5%) |
| Electricity | 2,218 (88.0%) | 2,585 (84.2%) |
| Fuel Oil or Kerosene | 0 (0.0%) | 0 (0.0%) |
| Coal or Coke | 0 (0.0%) | 0 (0.0%) |
| All other Fuels | 31 (1.2%) | 0 (0.0%) |
| No Fuel Used | 18 (0.7%) | 0 (0.0%) |
| Total | 2,521 (100.0%) | 3,072 (100.0%) |
Household Vehicle Usage in Branson
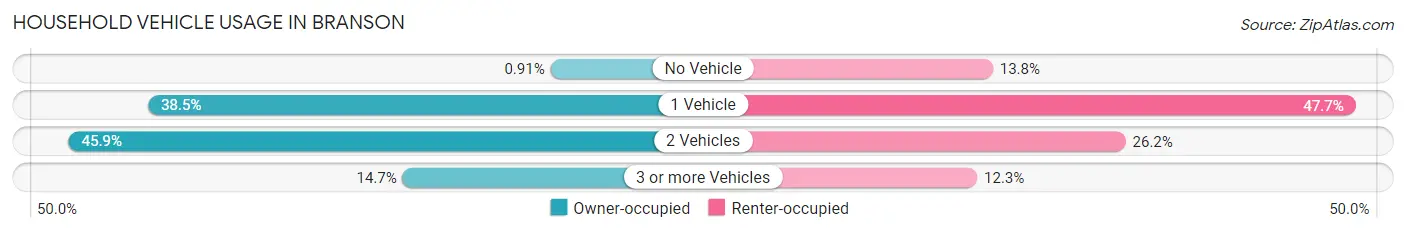
| Vehicles per Household | Owner-occupied | Renter-occupied |
| No Vehicle | 23 (0.9%) | 424 (13.8%) |
| 1 Vehicle | 970 (38.5%) | 1,464 (47.7%) |
| 2 Vehicles | 1,157 (45.9%) | 805 (26.2%) |
| 3 or more Vehicles | 371 (14.7%) | 379 (12.3%) |
| Total | 2,521 (100.0%) | 3,072 (100.0%) |
Real Estate & Mortgages in Branson
Real Estate and Mortgage Overview in Branson
| Characteristic | Without Mortgage | With Mortgage |
| Housing Units | 1,053 | 1,468 |
| Median Property Value | $189,200 | $211,100 |
| Median Household Income | $54,875 | $207 |
| Monthly Housing Costs | $482 | $48 |
| Real Estate Taxes | $1,282 | $31 |
Property Value by Mortgage Status in Branson
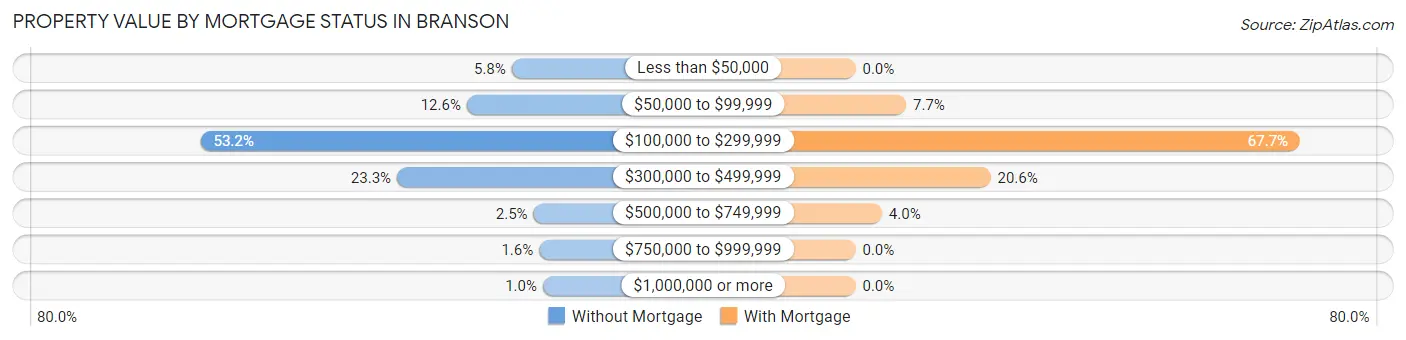
| Property Value | Without Mortgage | With Mortgage |
| Less than $50,000 | 61 (5.8%) | 0 (0.0%) |
| $50,000 to $99,999 | 133 (12.6%) | 113 (7.7%) |
| $100,000 to $299,999 | 560 (53.2%) | 994 (67.7%) |
| $300,000 to $499,999 | 245 (23.3%) | 302 (20.6%) |
| $500,000 to $749,999 | 26 (2.5%) | 59 (4.0%) |
| $750,000 to $999,999 | 17 (1.6%) | 0 (0.0%) |
| $1,000,000 or more | 11 (1.0%) | 0 (0.0%) |
| Total | 1,053 (100.0%) | 1,468 (100.0%) |
Household Income by Mortgage Status in Branson
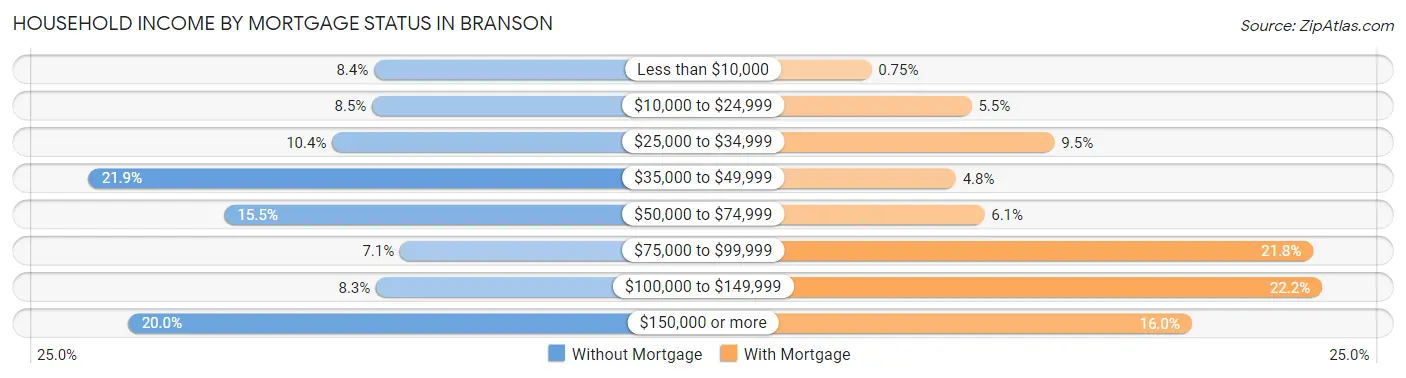
| Household Income | Without Mortgage | With Mortgage |
| Less than $10,000 | 88 (8.4%) | 11 (0.7%) |
| $10,000 to $24,999 | 89 (8.5%) | 81 (5.5%) |
| $25,000 to $34,999 | 109 (10.3%) | 139 (9.5%) |
| $35,000 to $49,999 | 231 (21.9%) | 70 (4.8%) |
| $50,000 to $74,999 | 163 (15.5%) | 90 (6.1%) |
| $75,000 to $99,999 | 75 (7.1%) | 320 (21.8%) |
| $100,000 to $149,999 | 87 (8.3%) | 326 (22.2%) |
| $150,000 or more | 211 (20.0%) | 235 (16.0%) |
| Total | 1,053 (100.0%) | 1,468 (100.0%) |
Property Value to Household Income Ratio in Branson
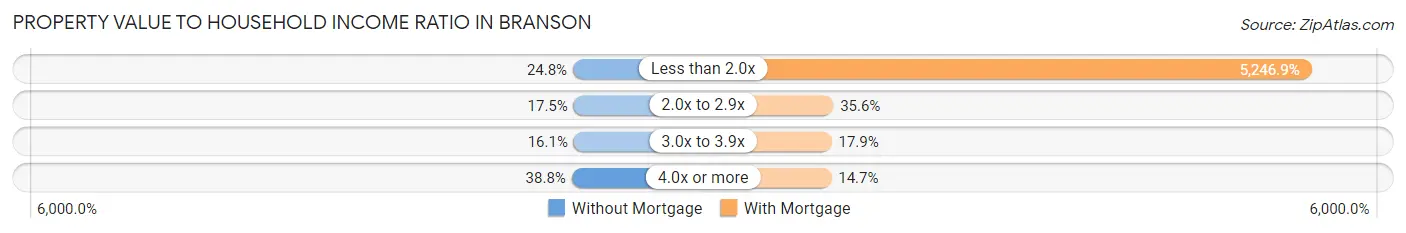
| Value-to-Income Ratio | Without Mortgage | With Mortgage |
| Less than 2.0x | 261 (24.8%) | 77,024 (5,246.9%) |
| 2.0x to 2.9x | 184 (17.5%) | 523 (35.6%) |
| 3.0x to 3.9x | 170 (16.1%) | 263 (17.9%) |
| 4.0x or more | 408 (38.8%) | 216 (14.7%) |
| Total | 1,053 (100.0%) | 1,468 (100.0%) |
Real Estate Taxes by Mortgage Status in Branson
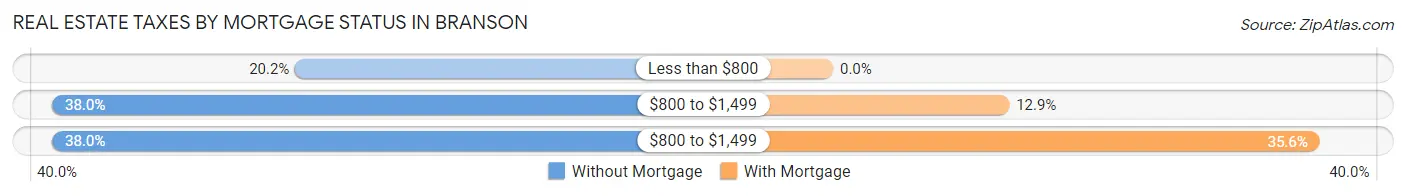
| Property Taxes | Without Mortgage | With Mortgage |
| Less than $800 | 213 (20.2%) | 0 (0.0%) |
| $800 to $1,499 | 400 (38.0%) | 189 (12.9%) |
| $800 to $1,499 | 400 (38.0%) | 522 (35.6%) |
| Total | 1,053 (100.0%) | 1,468 (100.0%) |
Health & Disability in Branson
Health Insurance Coverage by Age in Branson
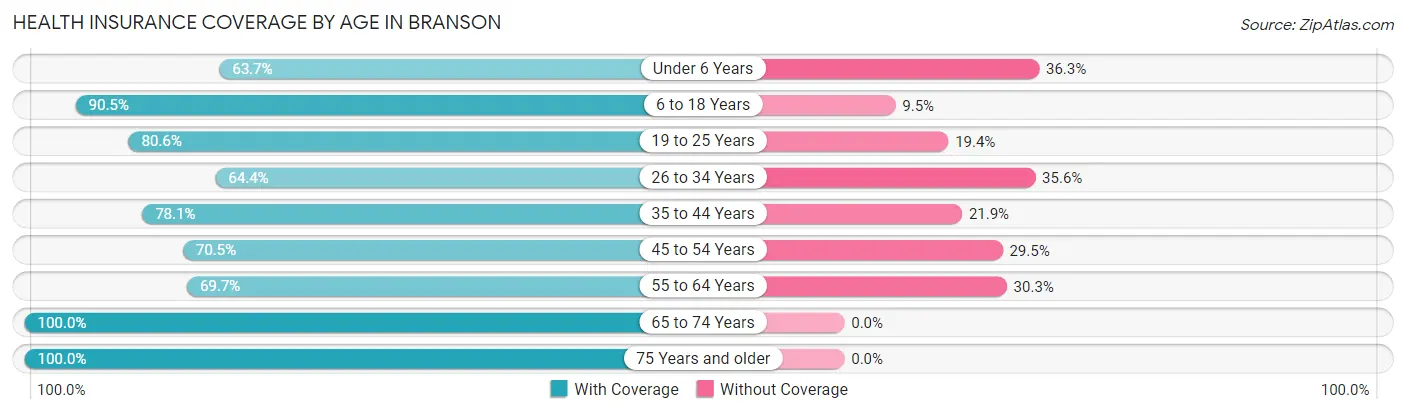
| Age Bracket | With Coverage | Without Coverage |
| Under 6 Years | 635 (63.7%) | 362 (36.3%) |
| 6 to 18 Years | 1,388 (90.5%) | 146 (9.5%) |
| 19 to 25 Years | 994 (80.6%) | 239 (19.4%) |
| 26 to 34 Years | 1,046 (64.4%) | 578 (35.6%) |
| 35 to 44 Years | 1,028 (78.1%) | 289 (21.9%) |
| 45 to 54 Years | 815 (70.5%) | 341 (29.5%) |
| 55 to 64 Years | 1,156 (69.7%) | 502 (30.3%) |
| 65 to 74 Years | 1,691 (100.0%) | 0 (0.0%) |
| 75 Years and older | 1,325 (100.0%) | 0 (0.0%) |
| Total | 10,078 (80.4%) | 2,457 (19.6%) |
Health Insurance Coverage by Citizenship Status in Branson
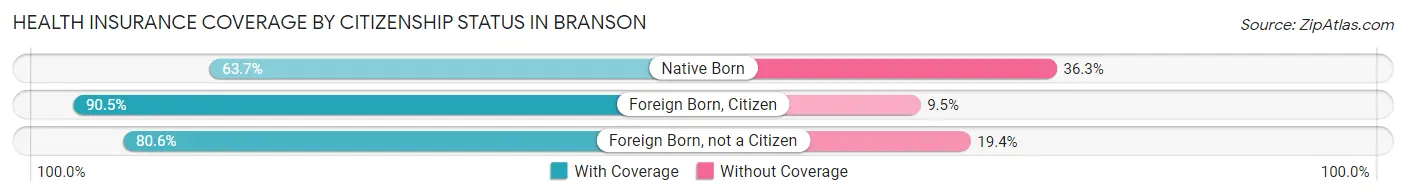
| Citizenship Status | With Coverage | Without Coverage |
| Native Born | 635 (63.7%) | 362 (36.3%) |
| Foreign Born, Citizen | 1,388 (90.5%) | 146 (9.5%) |
| Foreign Born, not a Citizen | 994 (80.6%) | 239 (19.4%) |
Health Insurance Coverage by Household Income in Branson
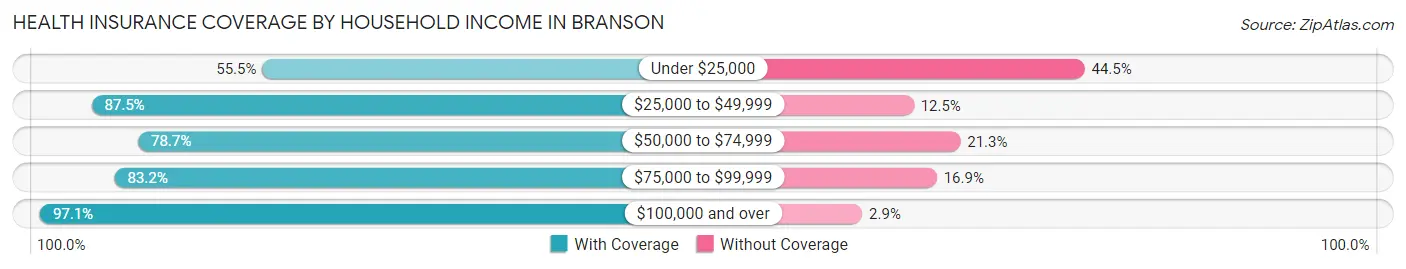
| Household Income | With Coverage | Without Coverage |
| Under $25,000 | 1,377 (55.5%) | 1,106 (44.5%) |
| $25,000 to $49,999 | 2,561 (87.5%) | 367 (12.5%) |
| $50,000 to $74,999 | 2,256 (78.7%) | 609 (21.3%) |
| $75,000 to $99,999 | 1,283 (83.2%) | 260 (16.9%) |
| $100,000 and over | 2,528 (97.1%) | 75 (2.9%) |
Public vs Private Health Insurance Coverage by Age in Branson
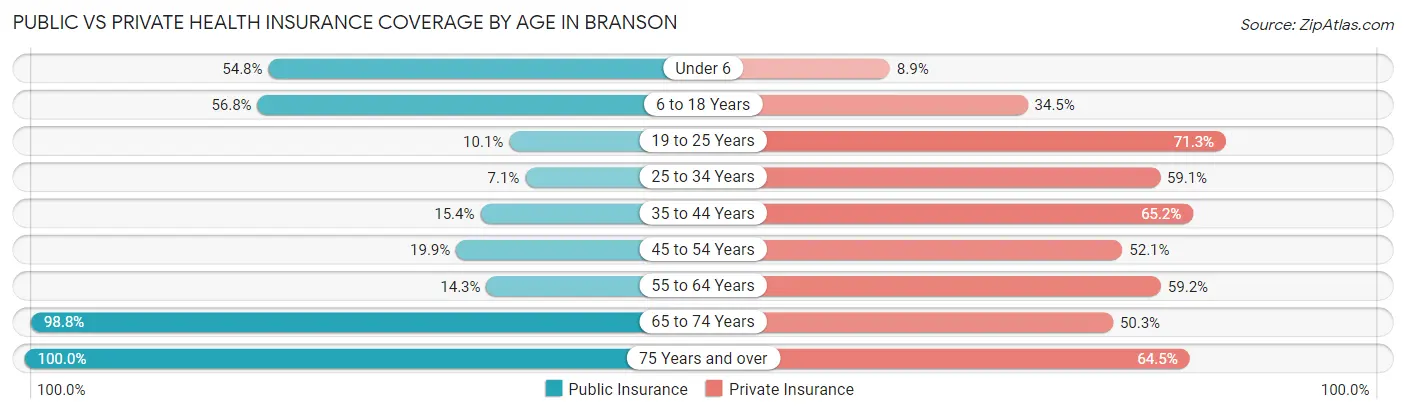
| Age Bracket | Public Insurance | Private Insurance |
| Under 6 | 546 (54.8%) | 89 (8.9%) |
| 6 to 18 Years | 871 (56.8%) | 529 (34.5%) |
| 19 to 25 Years | 124 (10.1%) | 879 (71.3%) |
| 25 to 34 Years | 115 (7.1%) | 959 (59.1%) |
| 35 to 44 Years | 203 (15.4%) | 859 (65.2%) |
| 45 to 54 Years | 230 (19.9%) | 602 (52.1%) |
| 55 to 64 Years | 237 (14.3%) | 982 (59.2%) |
| 65 to 74 Years | 1,671 (98.8%) | 851 (50.3%) |
| 75 Years and over | 1,325 (100.0%) | 855 (64.5%) |
| Total | 5,322 (42.5%) | 6,605 (52.7%) |
Disability Status by Sex by Age in Branson
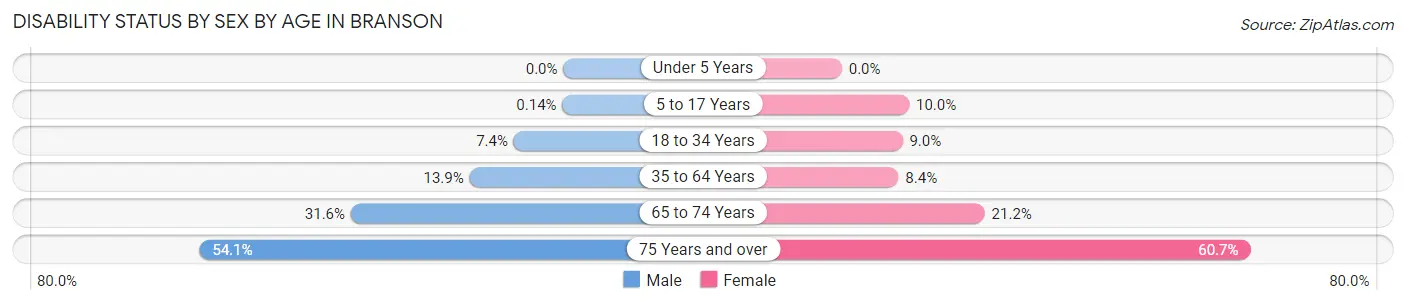
| Age Bracket | Male | Female |
| Under 5 Years | 0 (0.0%) | 0 (0.0%) |
| 5 to 17 Years | 1 (0.1%) | 81 (10.0%) |
| 18 to 34 Years | 107 (7.4%) | 138 (9.0%) |
| 35 to 64 Years | 231 (13.9%) | 208 (8.4%) |
| 65 to 74 Years | 242 (31.6%) | 196 (21.2%) |
| 75 Years and over | 267 (54.0%) | 504 (60.7%) |
Disability Class by Sex by Age in Branson
Disability Class: Hearing Difficulty
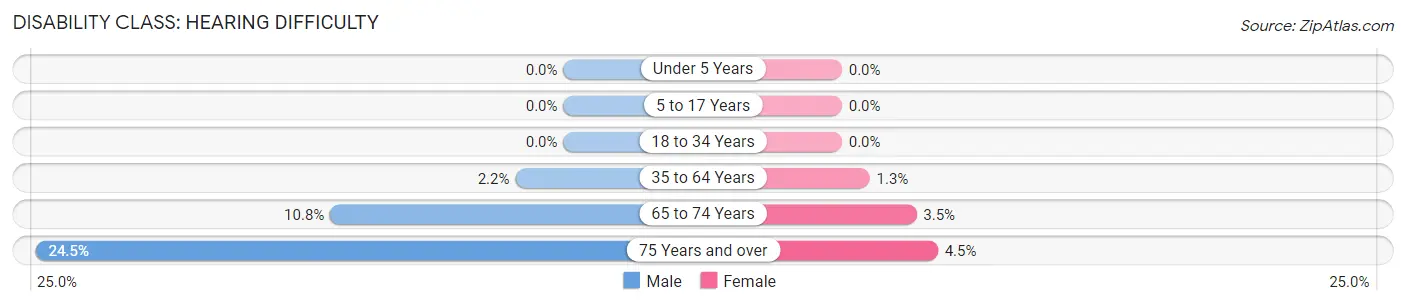
| Age Bracket | Male | Female |
| Under 5 Years | 0 (0.0%) | 0 (0.0%) |
| 5 to 17 Years | 0 (0.0%) | 0 (0.0%) |
| 18 to 34 Years | 0 (0.0%) | 0 (0.0%) |
| 35 to 64 Years | 37 (2.2%) | 32 (1.3%) |
| 65 to 74 Years | 83 (10.8%) | 32 (3.5%) |
| 75 Years and over | 121 (24.5%) | 37 (4.4%) |
Disability Class: Vision Difficulty
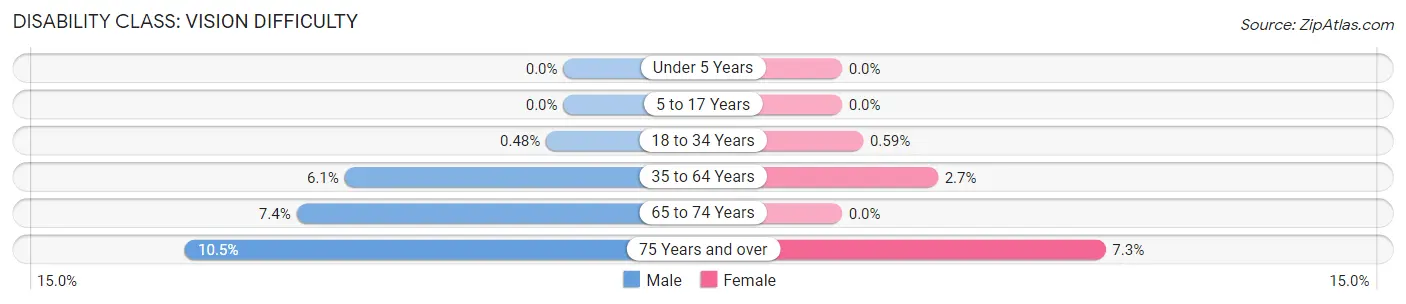
| Age Bracket | Male | Female |
| Under 5 Years | 0 (0.0%) | 0 (0.0%) |
| 5 to 17 Years | 0 (0.0%) | 0 (0.0%) |
| 18 to 34 Years | 7 (0.5%) | 9 (0.6%) |
| 35 to 64 Years | 101 (6.1%) | 66 (2.7%) |
| 65 to 74 Years | 57 (7.4%) | 0 (0.0%) |
| 75 Years and over | 52 (10.5%) | 61 (7.3%) |
Disability Class: Cognitive Difficulty
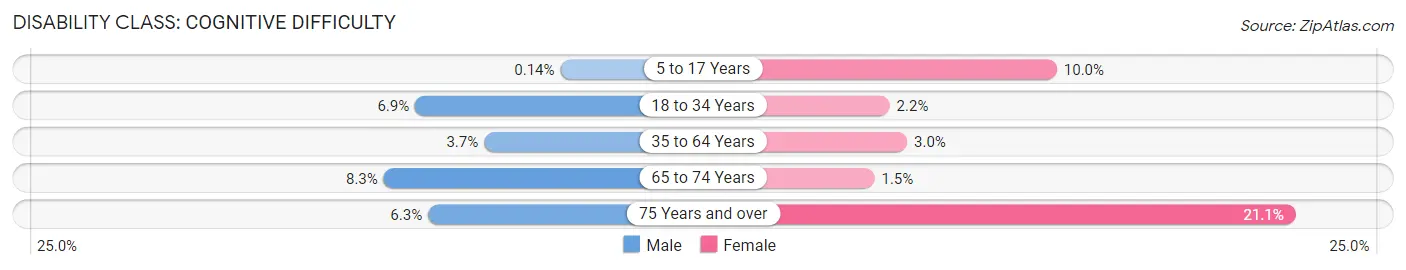
| Age Bracket | Male | Female |
| 5 to 17 Years | 1 (0.1%) | 81 (10.0%) |
| 18 to 34 Years | 100 (6.9%) | 34 (2.2%) |
| 35 to 64 Years | 61 (3.7%) | 75 (3.0%) |
| 65 to 74 Years | 64 (8.3%) | 14 (1.5%) |
| 75 Years and over | 31 (6.3%) | 175 (21.1%) |
Disability Class: Ambulatory Difficulty
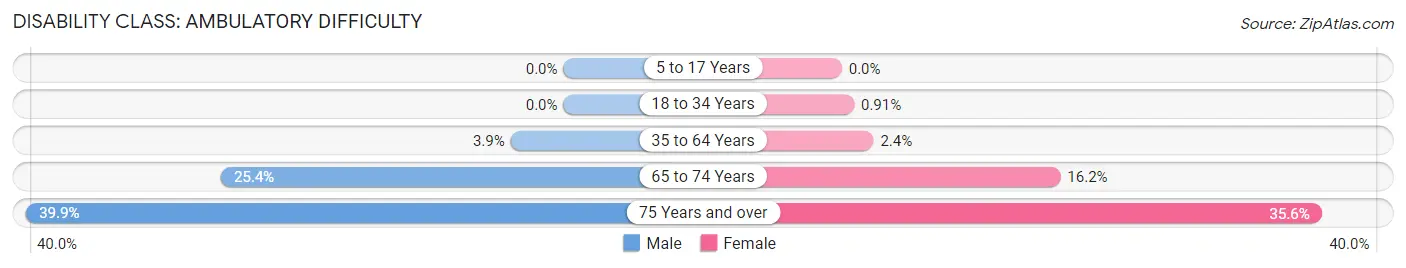
| Age Bracket | Male | Female |
| 5 to 17 Years | 0 (0.0%) | 0 (0.0%) |
| 18 to 34 Years | 0 (0.0%) | 14 (0.9%) |
| 35 to 64 Years | 65 (3.9%) | 58 (2.4%) |
| 65 to 74 Years | 195 (25.4%) | 150 (16.2%) |
| 75 Years and over | 197 (39.9%) | 296 (35.6%) |
Disability Class: Self-Care Difficulty
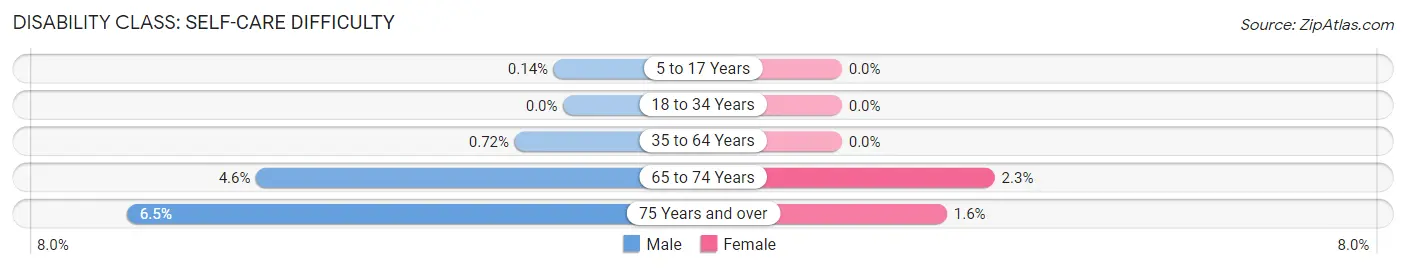
| Age Bracket | Male | Female |
| 5 to 17 Years | 1 (0.1%) | 0 (0.0%) |
| 18 to 34 Years | 0 (0.0%) | 0 (0.0%) |
| 35 to 64 Years | 12 (0.7%) | 0 (0.0%) |
| 65 to 74 Years | 35 (4.6%) | 21 (2.3%) |
| 75 Years and over | 32 (6.5%) | 13 (1.6%) |
Technology Access in Branson
Computing Device Access in Branson
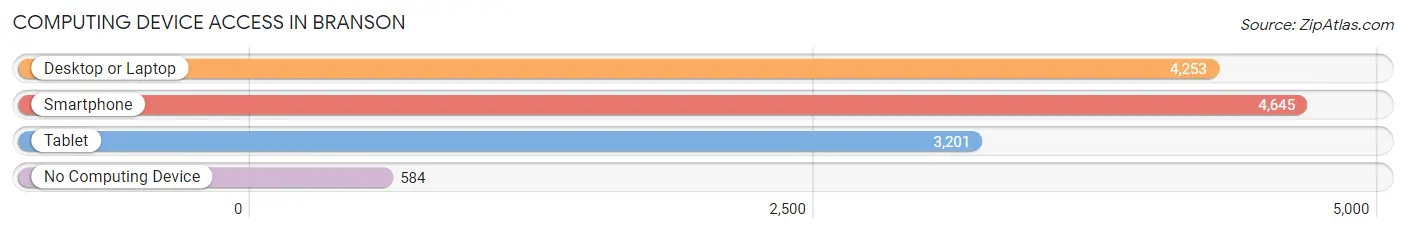
| Device Type | # Households | % Households |
| Desktop or Laptop | 4,253 | 76.0% |
| Smartphone | 4,645 | 83.1% |
| Tablet | 3,201 | 57.2% |
| No Computing Device | 584 | 10.4% |
| Total | 5,593 | 100.0% |
Internet Access in Branson
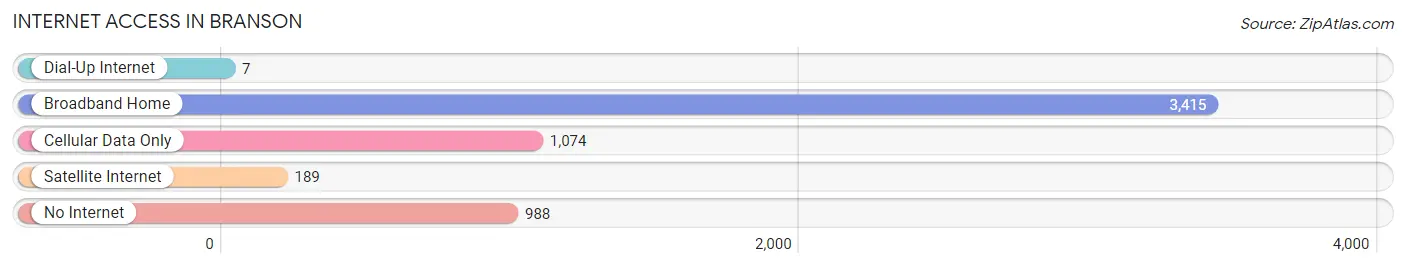
| Internet Type | # Households | % Households |
| Dial-Up Internet | 7 | 0.1% |
| Broadband Home | 3,415 | 61.1% |
| Cellular Data Only | 1,074 | 19.2% |
| Satellite Internet | 189 | 3.4% |
| No Internet | 988 | 17.7% |
| Total | 5,593 | 100.0% |
Branson Summary
Branson, Missouri is a city located in the Ozark Mountains of southwestern Missouri. It is the county seat of Taney County and is known for its live entertainment, outdoor activities, and family-friendly attractions. The city has a population of 11,430 as of the 2020 census, making it the second-largest city in the county.
History
The area that is now Branson was first settled in the early 1800s by settlers from the Ozark Plateau. The first permanent settlement was established in 1882 when Reuben Branson opened a general store and post office. The town was named after him and was incorporated in 1912.
In the early 1900s, the area began to attract tourists due to its natural beauty and outdoor activities. The first hotel was built in 1906 and the first theater opened in 1911. The city continued to grow throughout the 20th century, becoming a popular tourist destination.
Geography
Branson is located in the Ozark Mountains of southwestern Missouri. It is situated on the White River and is surrounded by the Mark Twain National Forest. The city has a total area of 16.2 square miles, with 15.9 square miles of land and 0.3 square miles of water.
The city has a humid subtropical climate, with hot, humid summers and mild winters. The average annual temperature is 57°F, with an average high of 79°F in July and an average low of 35°F in January.
Economy
Branson’s economy is largely driven by tourism. The city is home to numerous attractions, including Silver Dollar City, the Titanic Museum, and the Branson Landing. It is also home to several live entertainment venues, such as the Grand Palace Theater and the Andy Williams Moon River Theater.
The city is also home to several manufacturing companies, including Bass Pro Shops, which is the largest employer in the city. Other major employers include the College of the Ozarks, the Branson Airport, and the Branson Convention Center.
Demographics
As of the 2020 census, Branson had a population of 11,430. The racial makeup of the city was 92.2% White, 4.2% African American, 0.7% Native American, 0.7% Asian, 0.2% Pacific Islander, 0.7% from other races, and 1.4% from two or more races. Hispanic or Latino of any race were 2.3% of the population.
The median household income in Branson was $41,945 in 2019, and the median family income was $50,945. The per capita income was $25,945. About 11.2% of the population was below the poverty line.
Branson is a popular tourist destination and is known for its live entertainment, outdoor activities, and family-friendly attractions. The city has a diverse economy and a growing population, making it an attractive place to live and work.
Common Questions
What is Per Capita Income in Branson?
Per Capita income in Branson is $30,706.
What is the Median Family Income in Branson?
Median Family Income in Branson is $64,343.
What is the Median Household income in Branson?
Median Household Income in Branson is $49,790.
What is Income or Wage Gap in Branson?
Income or Wage Gap in Branson is 23.5%.
Women in Branson earn 76.5 cents for every dollar earned by a man.
What is Inequality or Gini Index in Branson?
Inequality or Gini Index in Branson is 0.46.
What is the Total Population of Branson?
Total Population of Branson is 12,651.
What is the Total Male Population of Branson?
Total Male Population of Branson is 5,383.
What is the Total Female Population of Branson?
Total Female Population of Branson is 7,268.
What is the Ratio of Males per 100 Females in Branson?
There are 74.06 Males per 100 Females in Branson.
What is the Ratio of Females per 100 Males in Branson?
There are 135.02 Females per 100 Males in Branson.
What is the Median Population Age in Branson?
Median Population Age in Branson is 41.2 Years.
What is the Average Family Size in Branson
Average Family Size in Branson is 3.0 People.
What is the Average Household Size in Branson
Average Household Size in Branson is 2.2 People.
How Large is the Labor Force in Branson?
There are 6,117 People in the Labor Forcein in Branson.
What is the Percentage of People in the Labor Force in Branson?
57.5% of People are in the Labor Force in Branson.
What is the Unemployment Rate in Branson?
Unemployment Rate in Branson is 4.0%.