Mercer, MO Map & Demographics
Mercer Map
Mercer Overview
$32,458
PER CAPITA INCOME
$56,563
AVG FAMILY INCOME
$45,625
AVG HOUSEHOLD INCOME
0.55
INEQUALITY / GINI INDEX
380
TOTAL POPULATION
219
MALE POPULATION
161
FEMALE POPULATION
136.02
MALES / 100 FEMALES
73.52
FEMALES / 100 MALES
50.9
MEDIAN AGE
3.2
AVG FAMILY SIZE
2.3
AVG HOUSEHOLD SIZE
228
LABOR FORCE [ PEOPLE ]
72.4%
PERCENT IN LABOR FORCE
0.9%
UNEMPLOYMENT RATE
Mercer Zip Codes
Mercer Area Codes
Income in Mercer
Income Overview in Mercer
Per Capita Income in Mercer is $32,458, while median incomes of families and households are $56,563 and $45,625 respectively.
| Characteristic | Number | Measure |
| Per Capita Income | 380 | $32,458 |
| Median Family Income | 89 | $56,563 |
| Mean Family Income | 89 | $108,900 |
| Median Household Income | 163 | $45,625 |
| Mean Household Income | 163 | $74,456 |
| Income Deficit | 89 | $0 |
| Wage / Income Gap (%) | 380 | 0.00% |
| Wage / Income Gap ($) | 380 | 100.00¢ per $1 |
| Gini / Inequality Index | 380 | 0.55 |
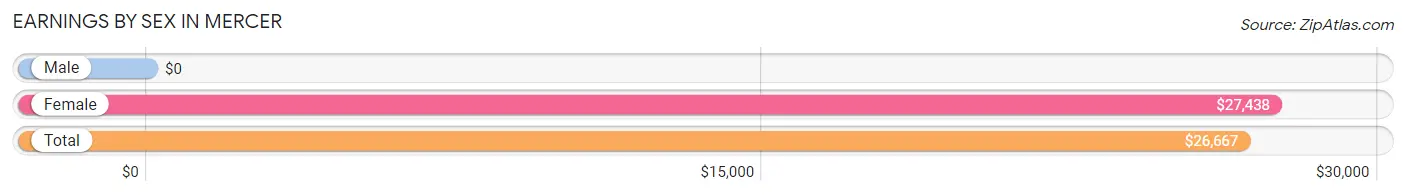
Earnings by Sex in Mercer
| Sex | Number | Average Earnings |
| Male | 147 (62.8%) | $0 |
| Female | 87 (37.2%) | $27,438 |
| Total | 234 (100.0%) | $26,667 |
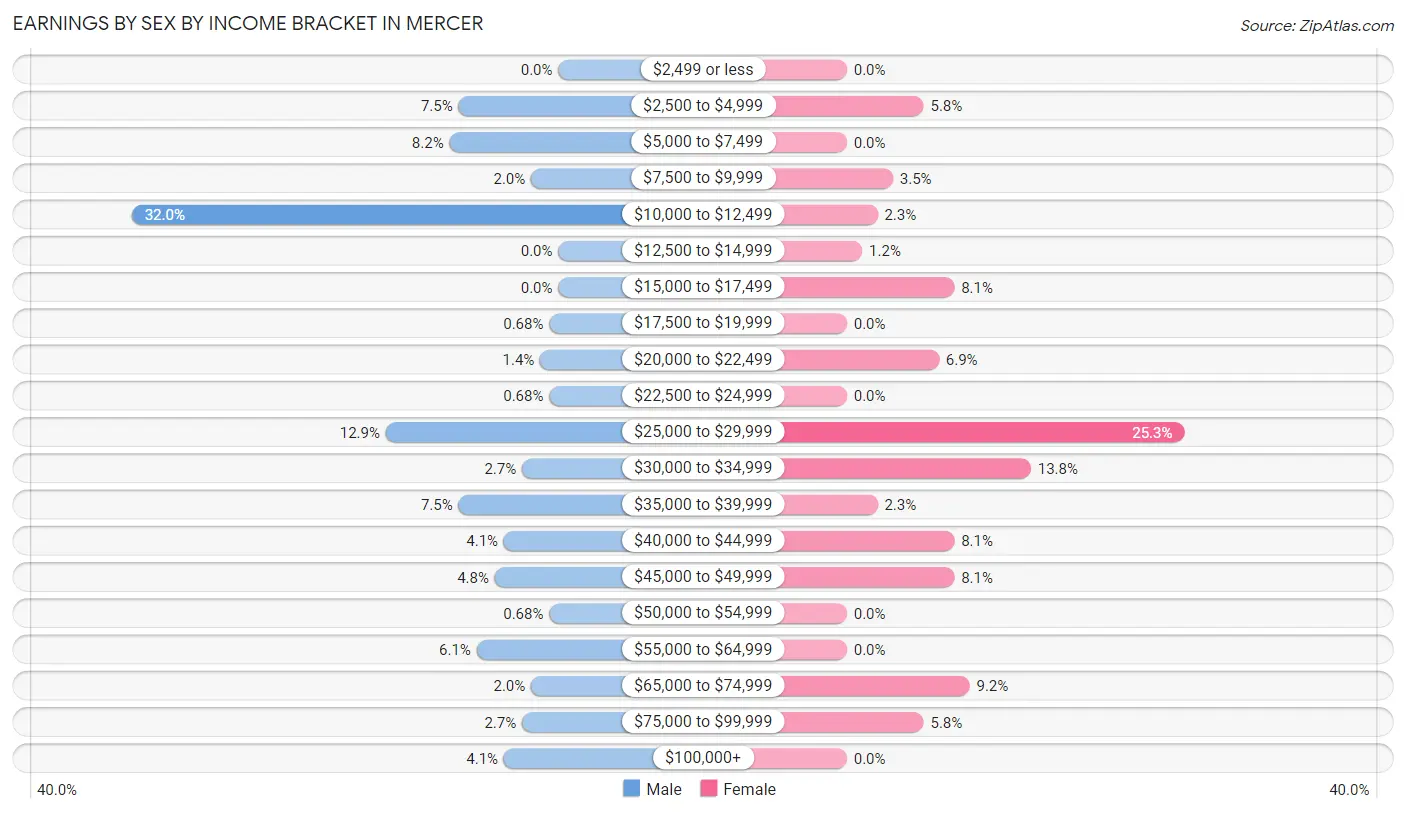
Earnings by Sex by Income Bracket in Mercer
The most common earnings brackets in Mercer are $10,000 to $12,499 for men (47 | 32.0%) and $25,000 to $29,999 for women (22 | 25.3%).
| Income | Male | Female |
| $2,499 or less | 0 (0.0%) | 0 (0.0%) |
| $2,500 to $4,999 | 11 (7.5%) | 5 (5.8%) |
| $5,000 to $7,499 | 12 (8.2%) | 0 (0.0%) |
| $7,500 to $9,999 | 3 (2.0%) | 3 (3.5%) |
| $10,000 to $12,499 | 47 (32.0%) | 2 (2.3%) |
| $12,500 to $14,999 | 0 (0.0%) | 1 (1.1%) |
| $15,000 to $17,499 | 0 (0.0%) | 7 (8.1%) |
| $17,500 to $19,999 | 1 (0.7%) | 0 (0.0%) |
| $20,000 to $22,499 | 2 (1.4%) | 6 (6.9%) |
| $22,500 to $24,999 | 1 (0.7%) | 0 (0.0%) |
| $25,000 to $29,999 | 19 (12.9%) | 22 (25.3%) |
| $30,000 to $34,999 | 4 (2.7%) | 12 (13.8%) |
| $35,000 to $39,999 | 11 (7.5%) | 2 (2.3%) |
| $40,000 to $44,999 | 6 (4.1%) | 7 (8.1%) |
| $45,000 to $49,999 | 7 (4.8%) | 7 (8.1%) |
| $50,000 to $54,999 | 1 (0.7%) | 0 (0.0%) |
| $55,000 to $64,999 | 9 (6.1%) | 0 (0.0%) |
| $65,000 to $74,999 | 3 (2.0%) | 8 (9.2%) |
| $75,000 to $99,999 | 4 (2.7%) | 5 (5.8%) |
| $100,000+ | 6 (4.1%) | 0 (0.0%) |
| Total | 147 (100.0%) | 87 (100.0%) |
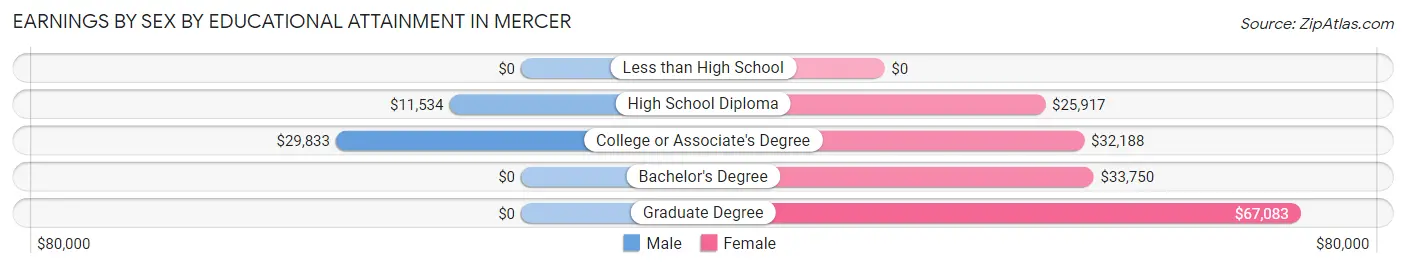
Earnings by Sex by Educational Attainment in Mercer
| Educational Attainment | Male Income | Female Income |
| Less than High School | - | - |
| High School Diploma | $11,534 | $25,917 |
| College or Associate's Degree | $29,833 | $32,188 |
| Bachelor's Degree | - | - |
| Graduate Degree | - | - |
| Total | - | - |
Family Income in Mercer
Family Income Brackets in Mercer
According to the Mercer family income data, there are 23 families falling into the $50,000 to $74,999 income range, which is the most common income bracket and makes up 25.8% of all families.
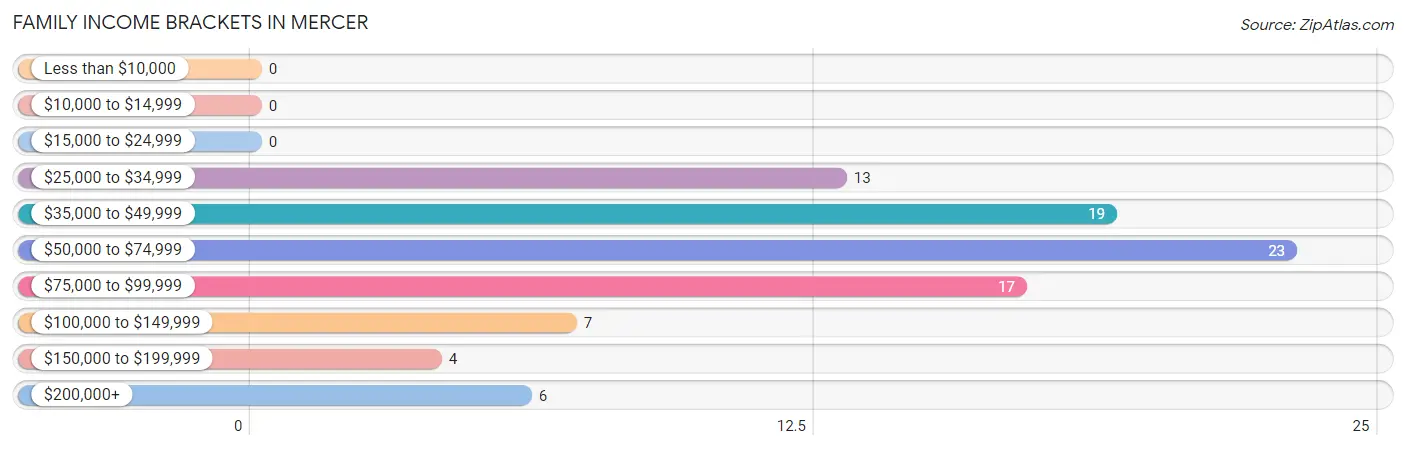
| Income Bracket | # Families | % Families |
| Less than $10,000 | 0 | 0.0% |
| $10,000 to $14,999 | 0 | 0.0% |
| $15,000 to $24,999 | 0 | 0.0% |
| $25,000 to $34,999 | 13 | 14.6% |
| $35,000 to $49,999 | 19 | 21.3% |
| $50,000 to $74,999 | 23 | 25.8% |
| $75,000 to $99,999 | 17 | 19.1% |
| $100,000 to $149,999 | 7 | 7.9% |
| $150,000 to $199,999 | 4 | 4.5% |
| $200,000+ | 6 | 6.7% |
Family Income by Famaliy Size in Mercer
3-person families (11 | 12.4%) account for the highest median family income in Mercer with $83,281 per family, while 3-person families (11 | 12.4%) have the highest median income of $27,760 per family member.
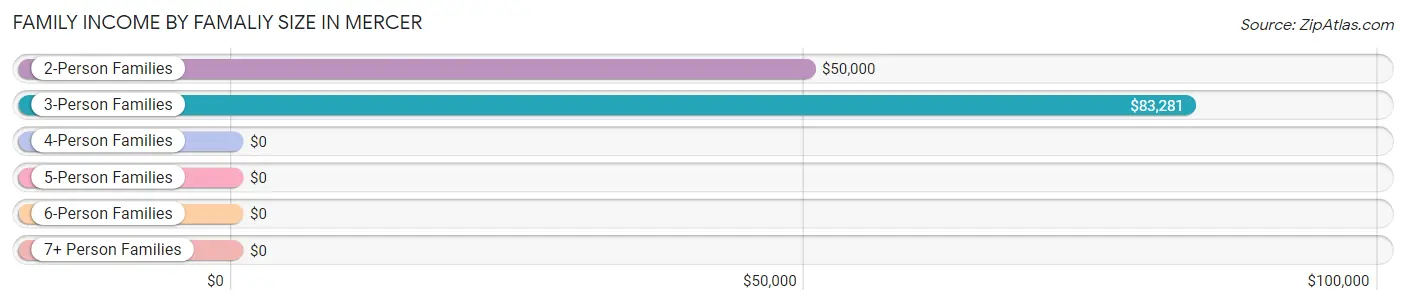
| Income Bracket | # Families | Median Income |
| 2-Person Families | 58 (65.2%) | $50,000 |
| 3-Person Families | 11 (12.4%) | $83,281 |
| 4-Person Families | 16 (18.0%) | $0 |
| 5-Person Families | 2 (2.2%) | $0 |
| 6-Person Families | 1 (1.1%) | $0 |
| 7+ Person Families | 1 (1.1%) | $0 |
| Total | 89 (100.0%) | $56,563 |
Family Income by Number of Earners in Mercer
The median family income in Mercer is $56,563, with families comprising 2 earners (28) having the highest median family income of $100,000, while families with no earners (22) have the lowest median family income of $36,071, accounting for 31.5% and 24.7% of families, respectively.
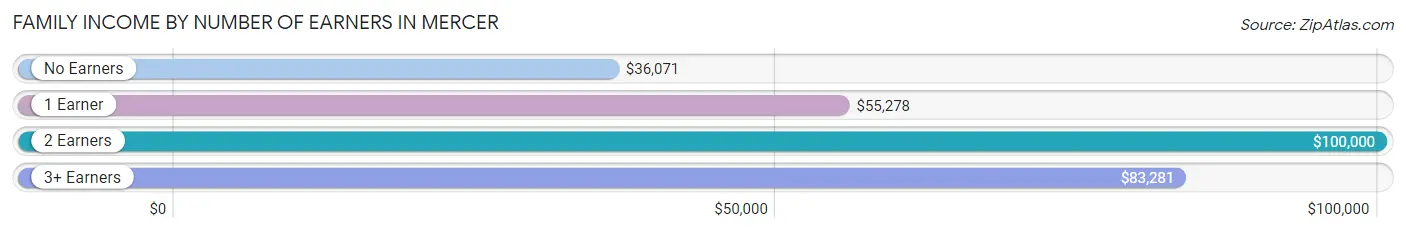
| Number of Earners | # Families | Median Income |
| No Earners | 22 (24.7%) | $36,071 |
| 1 Earner | 26 (29.2%) | $55,278 |
| 2 Earners | 28 (31.5%) | $100,000 |
| 3+ Earners | 13 (14.6%) | $83,281 |
| Total | 89 (100.0%) | $56,563 |
Household Income in Mercer
Household Income Brackets in Mercer
With 31 households falling in the category, the $50,000 to $74,999 income range is the most frequent in Mercer, accounting for 19.0% of all households. In contrast, only 4 households (2.5%) fall into the $150,000 to $199,999 income bracket, making it the least populous group.
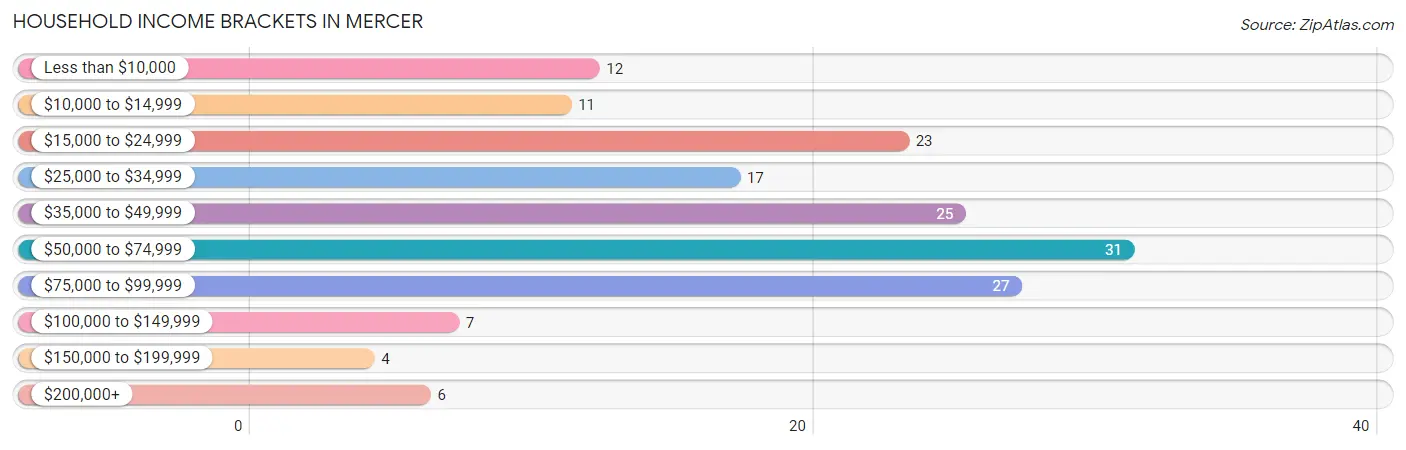
| Income Bracket | # Households | % Households |
| Less than $10,000 | 12 | 7.4% |
| $10,000 to $14,999 | 11 | 6.7% |
| $15,000 to $24,999 | 23 | 14.1% |
| $25,000 to $34,999 | 17 | 10.4% |
| $35,000 to $49,999 | 25 | 15.3% |
| $50,000 to $74,999 | 31 | 19.0% |
| $75,000 to $99,999 | 27 | 16.6% |
| $100,000 to $149,999 | 7 | 4.3% |
| $150,000 to $199,999 | 4 | 2.5% |
| $200,000+ | 6 | 3.7% |
Household Income by Householder Age in Mercer
The median household income in Mercer is $45,625, with the highest median household income of $87,778 found in the 25 to 44 years age bracket for the primary householder. A total of 34 households (20.9%) fall into this category. Meanwhile, the 15 to 24 years age bracket for the primary householder has the lowest median household income of $0, with 7 households (4.3%) in this group.
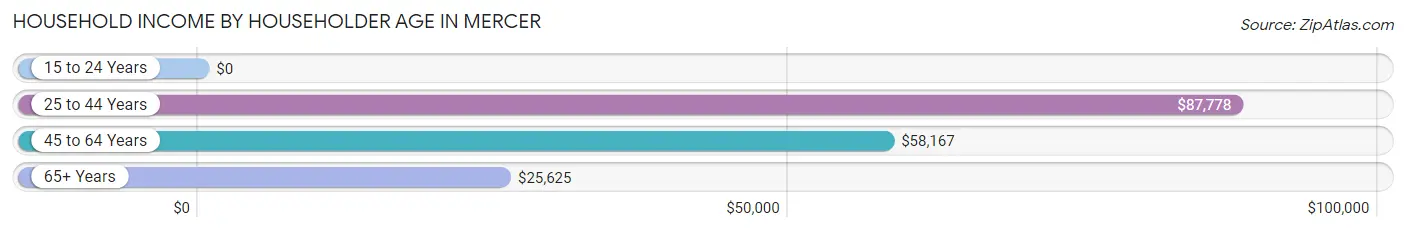
| Income Bracket | # Households | Median Income |
| 15 to 24 Years | 7 (4.3%) | $0 |
| 25 to 44 Years | 34 (20.9%) | $87,778 |
| 45 to 64 Years | 54 (33.1%) | $58,167 |
| 65+ Years | 68 (41.7%) | $25,625 |
| Total | 163 (100.0%) | $45,625 |
Poverty in Mercer
Income Below Poverty by Sex and Age in Mercer
With 2.7% poverty level for males and 12.4% for females among the residents of Mercer, 25 to 34 year old males and 75 year old and over females are the most vulnerable to poverty, with 6 males (18.8%) and 9 females (40.9%) in their respective age groups living below the poverty level.
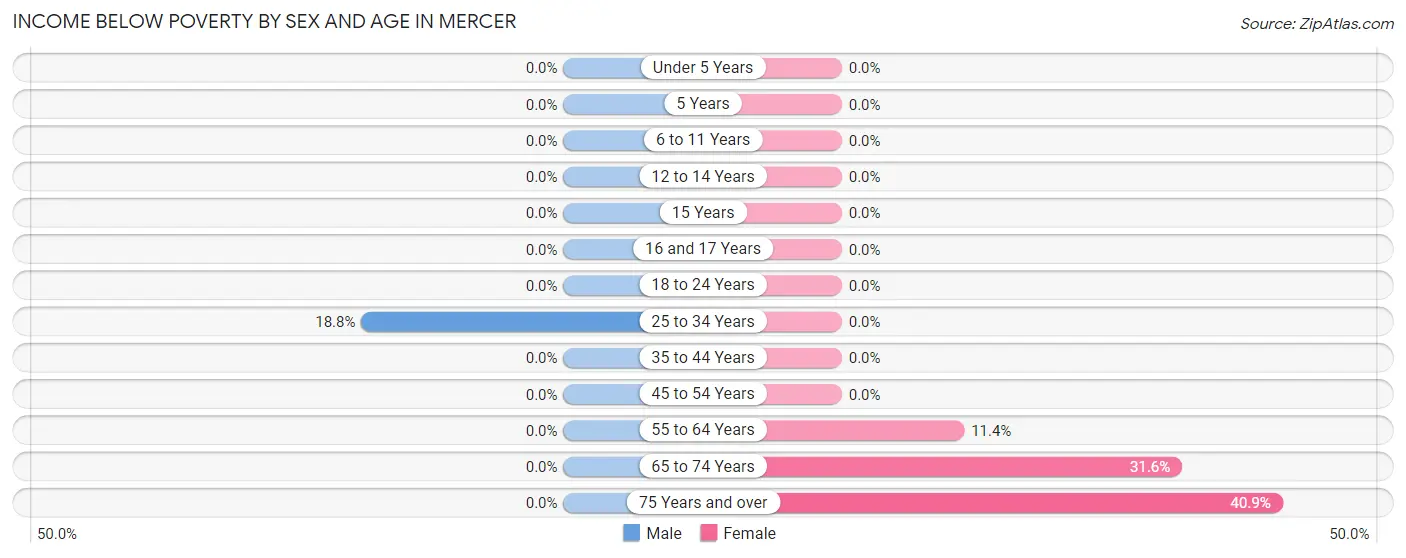
| Age Bracket | Male | Female |
| Under 5 Years | 0 (0.0%) | 0 (0.0%) |
| 5 Years | 0 (0.0%) | 0 (0.0%) |
| 6 to 11 Years | 0 (0.0%) | 0 (0.0%) |
| 12 to 14 Years | 0 (0.0%) | 0 (0.0%) |
| 15 Years | 0 (0.0%) | 0 (0.0%) |
| 16 and 17 Years | 0 (0.0%) | 0 (0.0%) |
| 18 to 24 Years | 0 (0.0%) | 0 (0.0%) |
| 25 to 34 Years | 6 (18.8%) | 0 (0.0%) |
| 35 to 44 Years | 0 (0.0%) | 0 (0.0%) |
| 45 to 54 Years | 0 (0.0%) | 0 (0.0%) |
| 55 to 64 Years | 0 (0.0%) | 5 (11.4%) |
| 65 to 74 Years | 0 (0.0%) | 6 (31.6%) |
| 75 Years and over | 0 (0.0%) | 9 (40.9%) |
| Total | 6 (2.7%) | 20 (12.4%) |
Income Above Poverty by Sex and Age in Mercer
According to the poverty statistics in Mercer, males aged under 5 years and females aged under 5 years are the age groups that are most secure financially, with 100.0% of males and 100.0% of females in these age groups living above the poverty line.
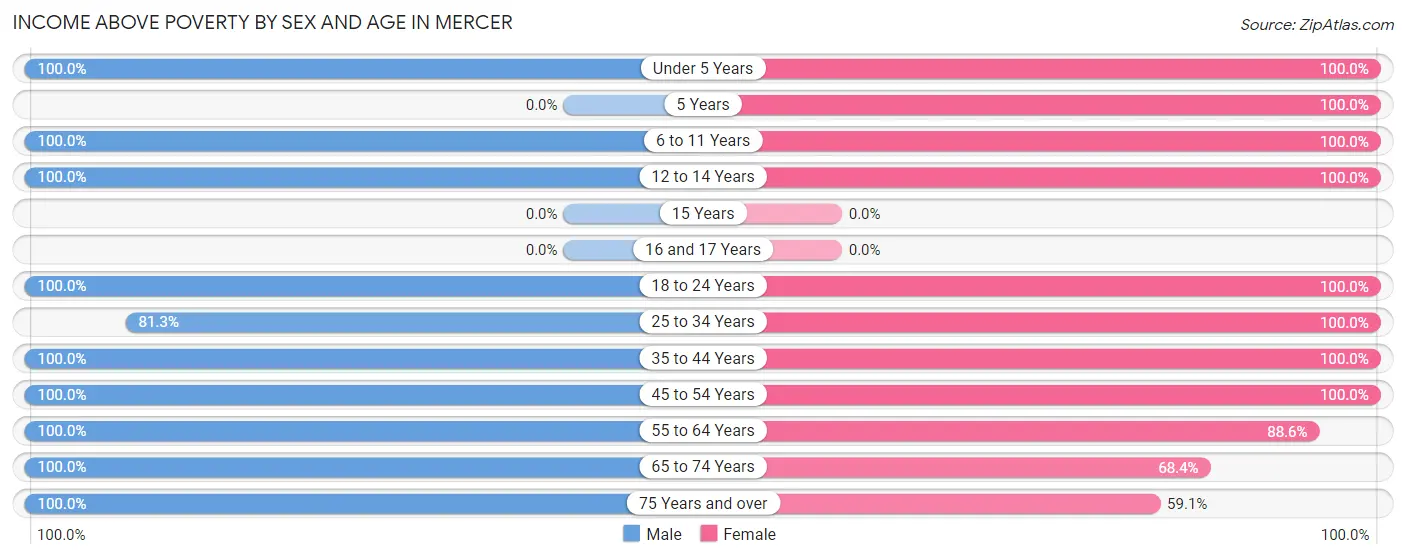
| Age Bracket | Male | Female |
| Under 5 Years | 8 (100.0%) | 12 (100.0%) |
| 5 Years | 0 (0.0%) | 2 (100.0%) |
| 6 to 11 Years | 15 (100.0%) | 9 (100.0%) |
| 12 to 14 Years | 10 (100.0%) | 9 (100.0%) |
| 15 Years | 0 (0.0%) | 0 (0.0%) |
| 16 and 17 Years | 0 (0.0%) | 0 (0.0%) |
| 18 to 24 Years | 5 (100.0%) | 11 (100.0%) |
| 25 to 34 Years | 26 (81.2%) | 13 (100.0%) |
| 35 to 44 Years | 6 (100.0%) | 9 (100.0%) |
| 45 to 54 Years | 58 (100.0%) | 11 (100.0%) |
| 55 to 64 Years | 37 (100.0%) | 39 (88.6%) |
| 65 to 74 Years | 32 (100.0%) | 13 (68.4%) |
| 75 Years and over | 16 (100.0%) | 13 (59.1%) |
| Total | 213 (97.3%) | 141 (87.6%) |
Income Below Poverty Among Married-Couple Families in Mercer
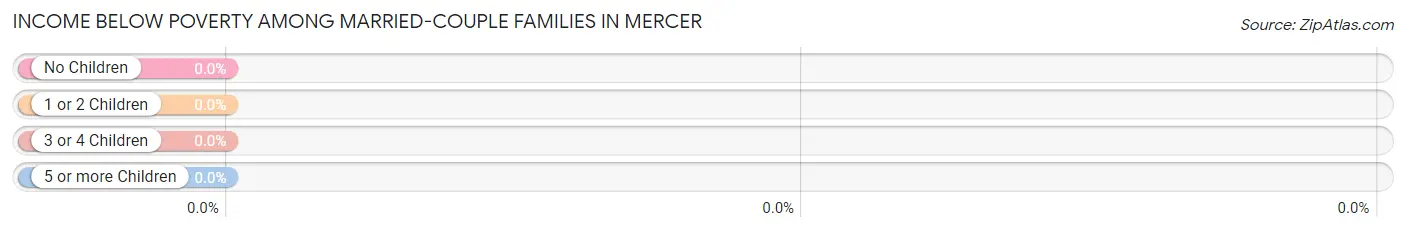
| Children | Above Poverty | Below Poverty |
| No Children | 61 (100.0%) | 0 (0.0%) |
| 1 or 2 Children | 10 (100.0%) | 0 (0.0%) |
| 3 or 4 Children | 2 (100.0%) | 0 (0.0%) |
| 5 or more Children | 0 (0.0%) | 0 (0.0%) |
| Total | 73 (100.0%) | 0 (0.0%) |
Income Below Poverty Among Single-Parent Households in Mercer
| Children | Single Father | Single Mother |
| No Children | 0 (0.0%) | 0 (0.0%) |
| 1 or 2 Children | 0 (0.0%) | 0 (0.0%) |
| 3 or 4 Children | 0 (0.0%) | 0 (0.0%) |
| 5 or more Children | 0 (0.0%) | 0 (0.0%) |
| Total | 0 (0.0%) | 0 (0.0%) |
Income Below Poverty Among Married-Couple vs Single-Parent Households in Mercer
| Children | Married-Couple Families | Single-Parent Households |
| No Children | 0 (0.0%) | 0 (0.0%) |
| 1 or 2 Children | 0 (0.0%) | 0 (0.0%) |
| 3 or 4 Children | 0 (0.0%) | 0 (0.0%) |
| 5 or more Children | 0 (0.0%) | 0 (0.0%) |
| Total | 0 (0.0%) | 0 (0.0%) |
Race in Mercer
The most populous races in Mercer are White / Caucasian (349 | 91.8%), Two or more Races (16 | 4.2%), and Asian (15 | 4.0%).
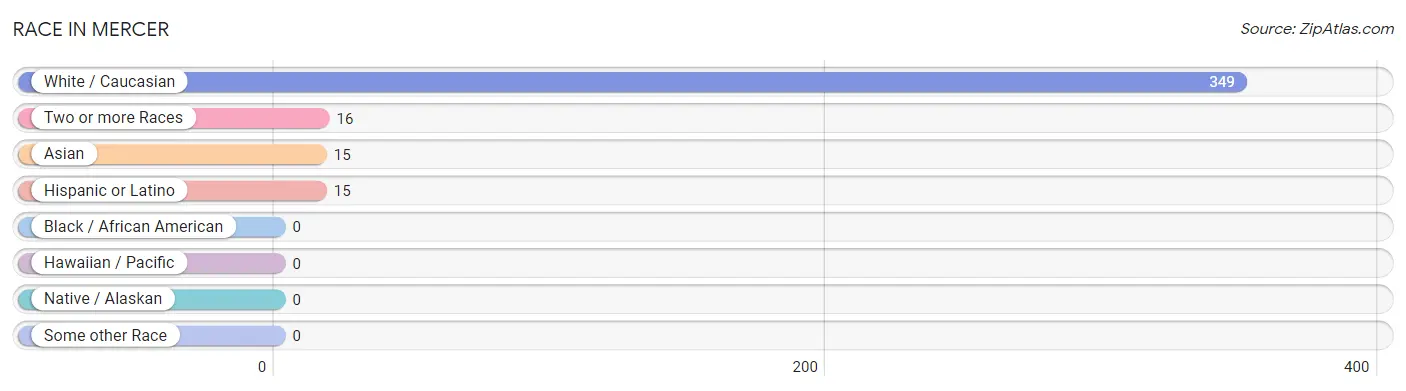
| Race | # Population | % Population |
| Asian | 15 | 4.0% |
| Black / African American | 0 | 0.0% |
| Hawaiian / Pacific | 0 | 0.0% |
| Hispanic or Latino | 15 | 4.0% |
| Native / Alaskan | 0 | 0.0% |
| White / Caucasian | 349 | 91.8% |
| Two or more Races | 16 | 4.2% |
| Some other Race | 0 | 0.0% |
| Total | 380 | 100.0% |
Ancestry in Mercer
The most populous ancestries reported in Mercer are Irish (42 | 11.1%), German (41 | 10.8%), American (27 | 7.1%), English (17 | 4.5%), and Italian (12 | 3.2%), together accounting for 36.6% of all Mercer residents.
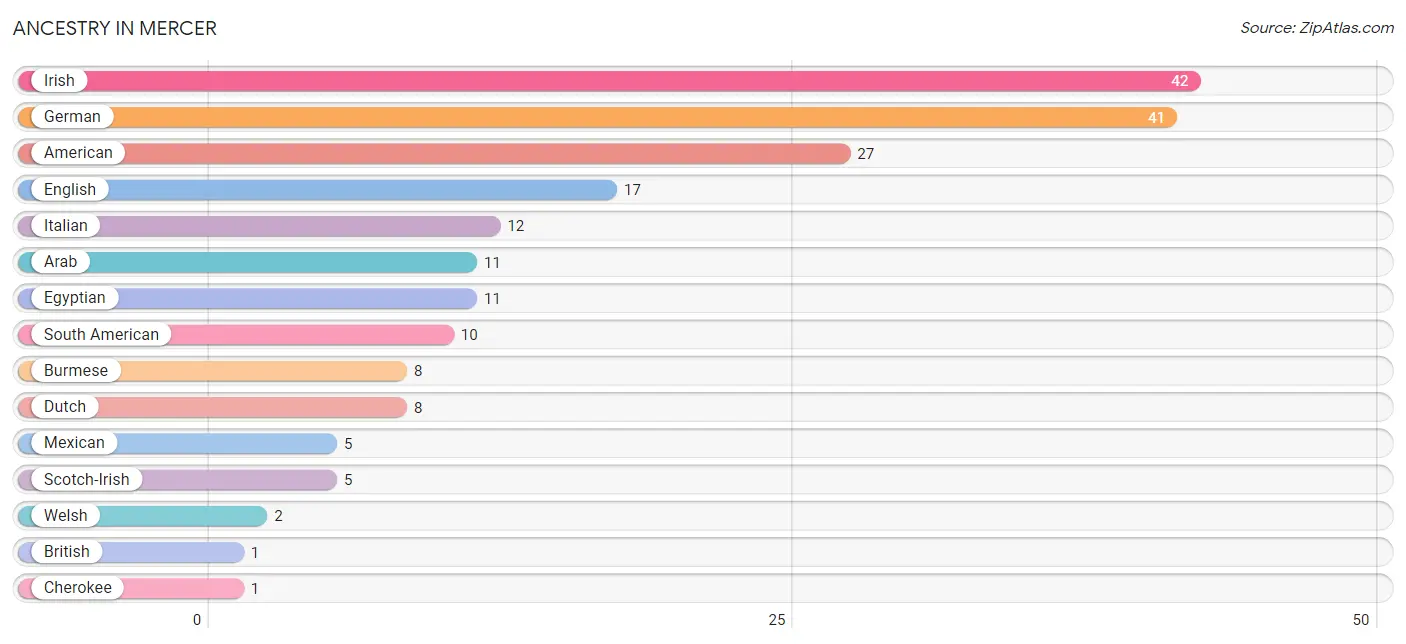
| Ancestry | # Population | % Population |
| American | 27 | 7.1% |
| Arab | 11 | 2.9% |
| British | 1 | 0.3% |
| Burmese | 8 | 2.1% |
| Cherokee | 1 | 0.3% |
| Dutch | 8 | 2.1% |
| Egyptian | 11 | 2.9% |
| English | 17 | 4.5% |
| French | 1 | 0.3% |
| German | 41 | 10.8% |
| Irish | 42 | 11.1% |
| Italian | 12 | 3.2% |
| Mexican | 5 | 1.3% |
| Scotch-Irish | 5 | 1.3% |
| South American | 10 | 2.6% |
| Welsh | 2 | 0.5% | View All 16 Rows |
Immigrants in Mercer
The most numerous immigrant groups reported in Mercer came from Asia (15 | 4.0%), South Eastern Asia (15 | 4.0%), and Thailand (15 | 4.0%), together accounting for 11.8% of all Mercer residents.
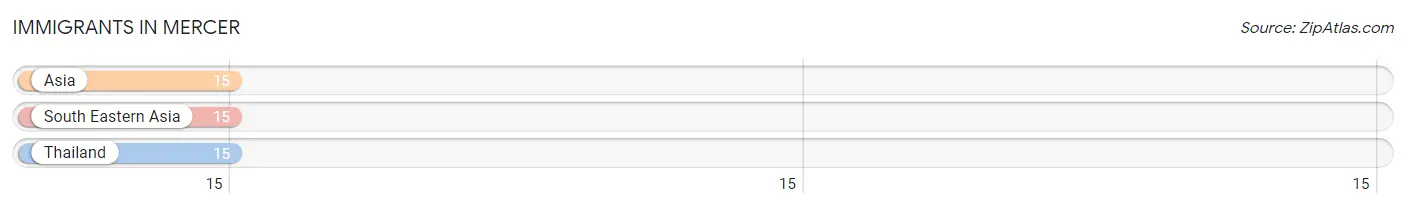
| Immigration Origin | # Population | % Population |
| Asia | 15 | 4.0% |
| South Eastern Asia | 15 | 4.0% |
| Thailand | 15 | 4.0% | View All 3 Rows |
Sex and Age in Mercer
Sex and Age in Mercer
The most populous age groups in Mercer are 50 to 54 Years (52 | 23.7%) for men and 55 to 59 Years (33 | 20.5%) for women.
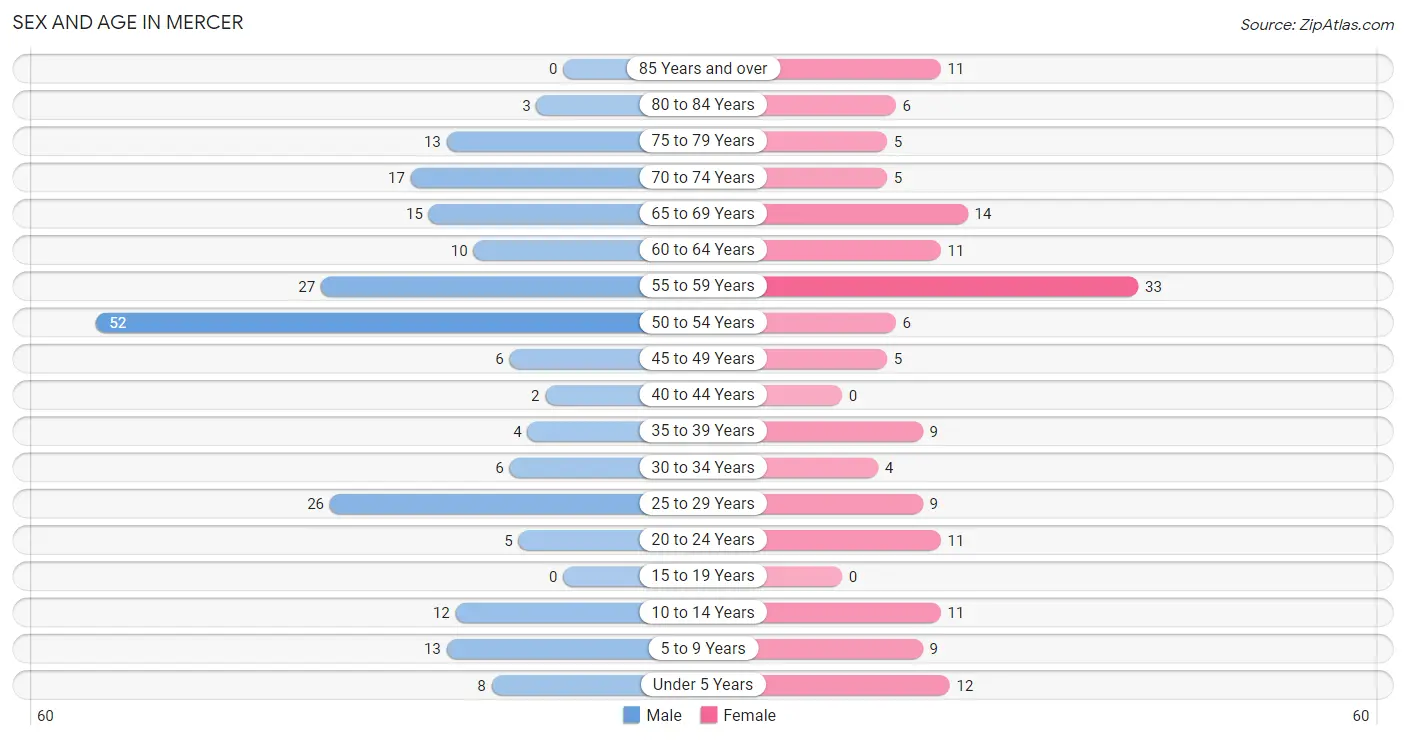
| Age Bracket | Male | Female |
| Under 5 Years | 8 (3.6%) | 12 (7.4%) |
| 5 to 9 Years | 13 (5.9%) | 9 (5.6%) |
| 10 to 14 Years | 12 (5.5%) | 11 (6.8%) |
| 15 to 19 Years | 0 (0.0%) | 0 (0.0%) |
| 20 to 24 Years | 5 (2.3%) | 11 (6.8%) |
| 25 to 29 Years | 26 (11.9%) | 9 (5.6%) |
| 30 to 34 Years | 6 (2.7%) | 4 (2.5%) |
| 35 to 39 Years | 4 (1.8%) | 9 (5.6%) |
| 40 to 44 Years | 2 (0.9%) | 0 (0.0%) |
| 45 to 49 Years | 6 (2.7%) | 5 (3.1%) |
| 50 to 54 Years | 52 (23.7%) | 6 (3.7%) |
| 55 to 59 Years | 27 (12.3%) | 33 (20.5%) |
| 60 to 64 Years | 10 (4.6%) | 11 (6.8%) |
| 65 to 69 Years | 15 (6.9%) | 14 (8.7%) |
| 70 to 74 Years | 17 (7.8%) | 5 (3.1%) |
| 75 to 79 Years | 13 (5.9%) | 5 (3.1%) |
| 80 to 84 Years | 3 (1.4%) | 6 (3.7%) |
| 85 Years and over | 0 (0.0%) | 11 (6.8%) |
| Total | 219 (100.0%) | 161 (100.0%) |
Families and Households in Mercer
Median Family Size in Mercer
The median family size in Mercer is 3.18 persons per family, with married-couple families (73 | 82.0%) accounting for the largest median family size of 3.27 persons per family. On the other hand, single female/mother families (9 | 10.1%) represent the smallest median family size with 2.67 persons per family.
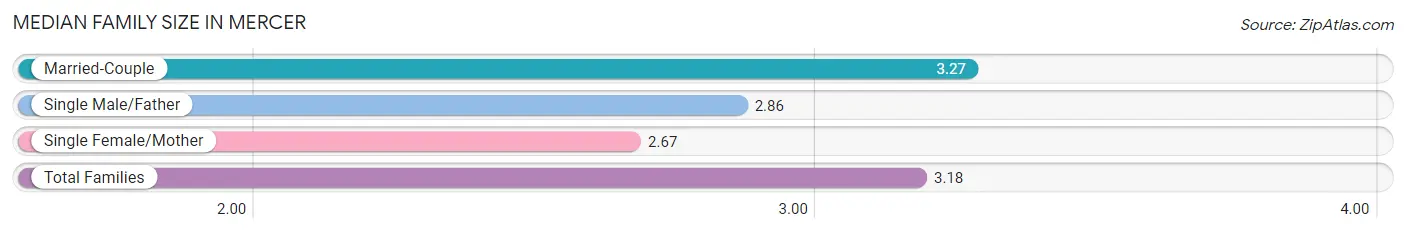
| Family Type | # Families | Family Size |
| Married-Couple | 73 (82.0%) | 3.27 |
| Single Male/Father | 7 (7.9%) | 2.86 |
| Single Female/Mother | 9 (10.1%) | 2.67 |
| Total Families | 89 (100.0%) | 3.18 |
Median Household Size in Mercer
The median household size in Mercer is 2.33 persons per household, with single female/mother households (9 | 5.5%) accounting for the largest median household size of 3.33 persons per household. non-family households (74 | 45.4%) represent the smallest median household size with 1.20 persons per household.
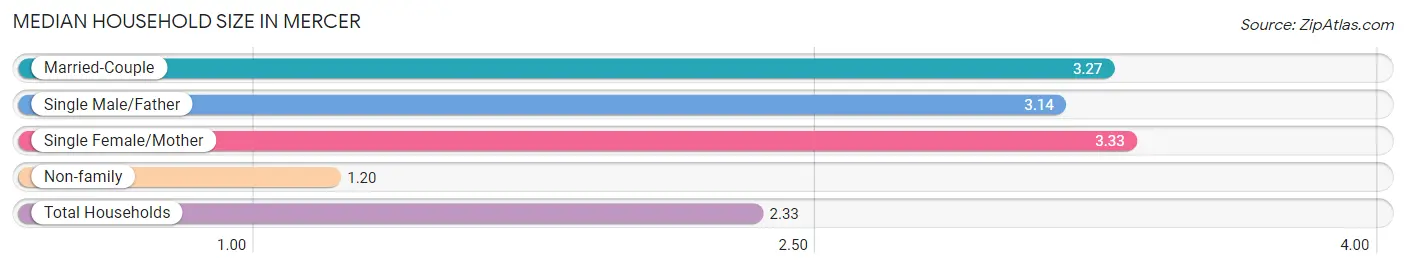
| Household Type | # Households | Household Size |
| Married-Couple | 73 (44.8%) | 3.27 |
| Single Male/Father | 7 (4.3%) | 3.14 |
| Single Female/Mother | 9 (5.5%) | 3.33 |
| Non-family | 74 (45.4%) | 1.20 |
| Total Households | 163 (100.0%) | 2.33 |
Household Size by Marriage Status in Mercer
Out of a total of 163 households in Mercer, 89 (54.6%) are family households, while 74 (45.4%) are nonfamily households. The most numerous type of family households are 2-person households, comprising 55, and the most common type of nonfamily households are 1-person households, comprising 59.
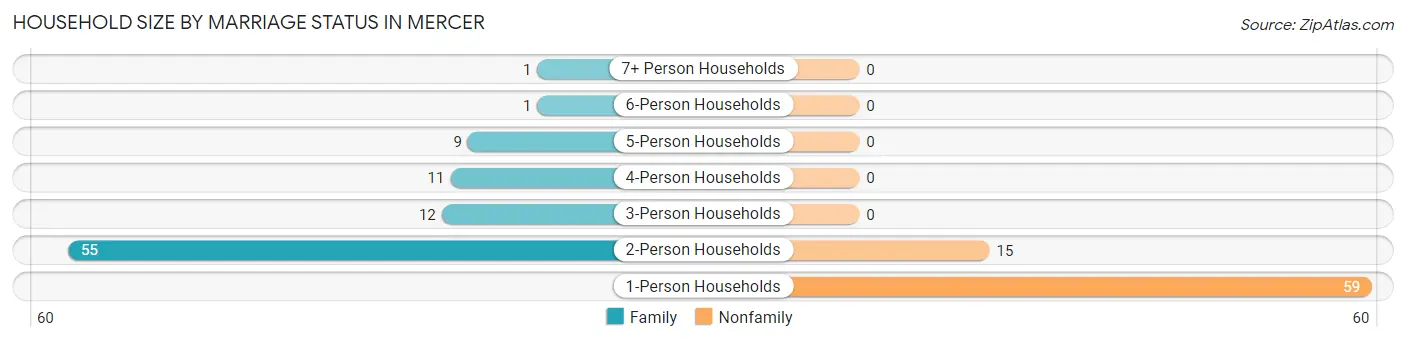
| Household Size | Family Households | Nonfamily Households |
| 1-Person Households | - | 59 (36.2%) |
| 2-Person Households | 55 (33.7%) | 15 (9.2%) |
| 3-Person Households | 12 (7.4%) | 0 (0.0%) |
| 4-Person Households | 11 (6.8%) | 0 (0.0%) |
| 5-Person Households | 9 (5.5%) | 0 (0.0%) |
| 6-Person Households | 1 (0.6%) | 0 (0.0%) |
| 7+ Person Households | 1 (0.6%) | 0 (0.0%) |
| Total | 89 (54.6%) | 74 (45.4%) |
Female Fertility in Mercer
Fertility by Age in Mercer
| Age Bracket | Women with Births | Births / 1,000 Women |
| 15 to 19 years | 0 (0.0%) | 0.0 |
| 20 to 34 years | 0 (0.0%) | 0.0 |
| 35 to 50 years | 0 (0.0%) | 0.0 |
| Total | 0 (0.0%) | 0.0 |
Fertility by Age by Marriage Status in Mercer
| Age Bracket | Married | Unmarried |
| 15 to 19 years | 0 (0.0%) | 0 (0.0%) |
| 20 to 34 years | 0 (0.0%) | 0 (0.0%) |
| 35 to 50 years | 0 (0.0%) | 0 (0.0%) |
| Total | 0 (0.0%) | 0 (0.0%) |
Fertility by Education in Mercer
| Educational Attainment | Women with Births | Births / 1,000 Women |
| Less than High School | 0 (0.0%) | 0.0 |
| High School Diploma | 0 (0.0%) | 0.0 |
| College or Associate's Degree | 0 (0.0%) | 0.0 |
| Bachelor's Degree | 0 (0.0%) | 0.0 |
| Graduate Degree | 0 (0.0%) | 0.0 |
| Total | 0 (0.0%) | 0.0 |
Fertility by Education by Marriage Status in Mercer
| Educational Attainment | Married | Unmarried |
| Less than High School | 0 (0.0%) | 0 (0.0%) |
| High School Diploma | 0 (0.0%) | 0 (0.0%) |
| College or Associate's Degree | 0 (0.0%) | 0 (0.0%) |
| Bachelor's Degree | 0 (0.0%) | 0 (0.0%) |
| Graduate Degree | 0 (0.0%) | 0 (0.0%) |
| Total | 0 (0.0%) | 0 (0.0%) |
Employment Characteristics in Mercer
Employment by Class of Employer in Mercer
Among the 226 employed individuals in Mercer, private company employees (150 | 66.4%), self-employed (not incorporated) (21 | 9.3%), and not-for-profit organizations (15 | 6.6%) make up the most common classes of employment.
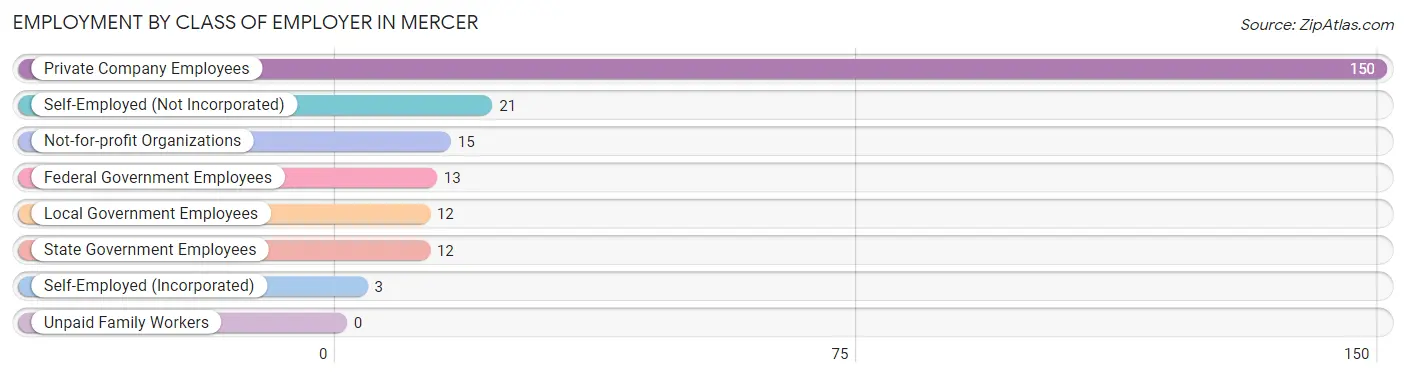
| Employer Class | # Employees | % Employees |
| Private Company Employees | 150 | 66.4% |
| Self-Employed (Incorporated) | 3 | 1.3% |
| Self-Employed (Not Incorporated) | 21 | 9.3% |
| Not-for-profit Organizations | 15 | 6.6% |
| Local Government Employees | 12 | 5.3% |
| State Government Employees | 12 | 5.3% |
| Federal Government Employees | 13 | 5.8% |
| Unpaid Family Workers | 0 | 0.0% |
| Total | 226 | 100.0% |
Employment Status by Age in Mercer
According to the labor force statistics for Mercer, out of the total population over 16 years of age (315), 72.4% or 228 individuals are in the labor force, with 0.9% or 2 of them unemployed. The age group with the highest labor force participation rate is 20 to 24 years, with 100.0% or 16 individuals in the labor force. Within the labor force, the 55 to 59 years age range has the highest percentage of unemployed individuals, with 4.2% or 2 of them being unemployed.
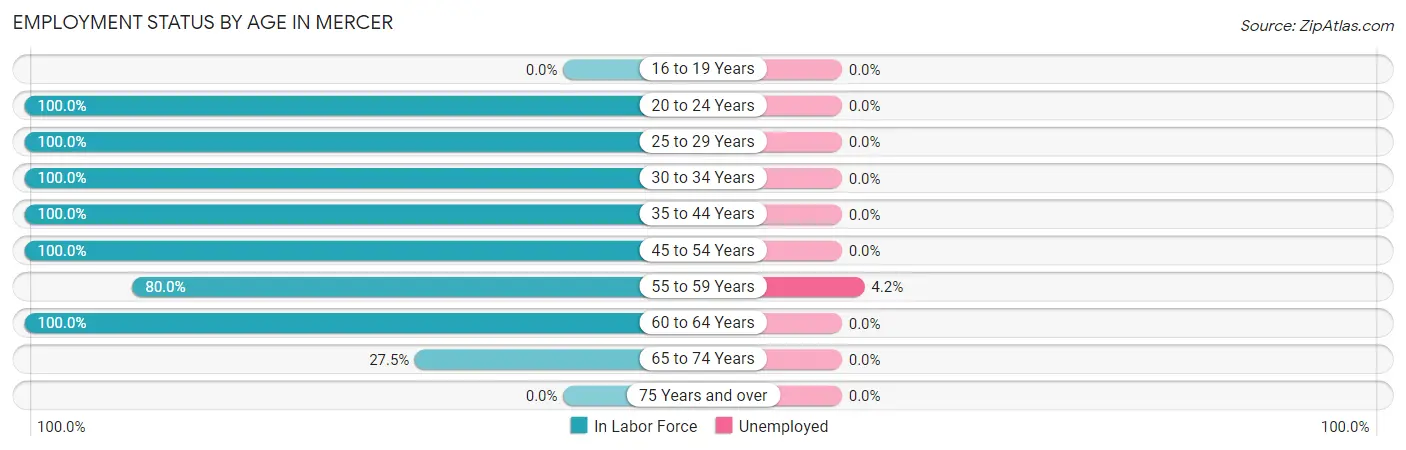
| Age Bracket | In Labor Force | Unemployed |
| 16 to 19 Years | 0 (0.0%) | 0 (0.0%) |
| 20 to 24 Years | 16 (100.0%) | 0 (0.0%) |
| 25 to 29 Years | 35 (100.0%) | 0 (0.0%) |
| 30 to 34 Years | 10 (100.0%) | 0 (0.0%) |
| 35 to 44 Years | 15 (100.0%) | 0 (0.0%) |
| 45 to 54 Years | 69 (100.0%) | 0 (0.0%) |
| 55 to 59 Years | 48 (80.0%) | 2 (4.2%) |
| 60 to 64 Years | 21 (100.0%) | 0 (0.0%) |
| 65 to 74 Years | 14 (27.5%) | 0 (0.0%) |
| 75 Years and over | 0 (0.0%) | 0 (0.0%) |
| Total | 228 (72.4%) | 2 (0.9%) |
Employment Status by Educational Attainment in Mercer
According to labor force statistics for Mercer, 94.3% of individuals (198) out of the total population between 25 and 64 years of age (210) are in the labor force, with 1.0% or 2 of them being unemployed. The group with the highest labor force participation rate are those with the educational attainment of less than high school, with 100.0% or 6 individuals in the labor force. Within the labor force, individuals with high school diploma education have the highest percentage of unemployment, with 2.0% or 2 of them being unemployed.
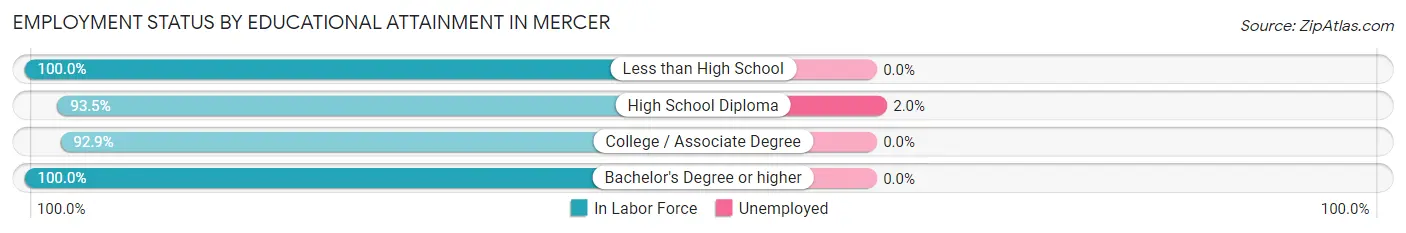
| Educational Attainment | In Labor Force | Unemployed |
| Less than High School | 6 (100.0%) | 0 (0.0%) |
| High School Diploma | 101 (93.5%) | 2 (2.0%) |
| College / Associate Degree | 65 (92.9%) | 0 (0.0%) |
| Bachelor's Degree or higher | 26 (100.0%) | 0 (0.0%) |
| Total | 198 (94.3%) | 2 (1.0%) |
Employment Occupations by Sex in Mercer
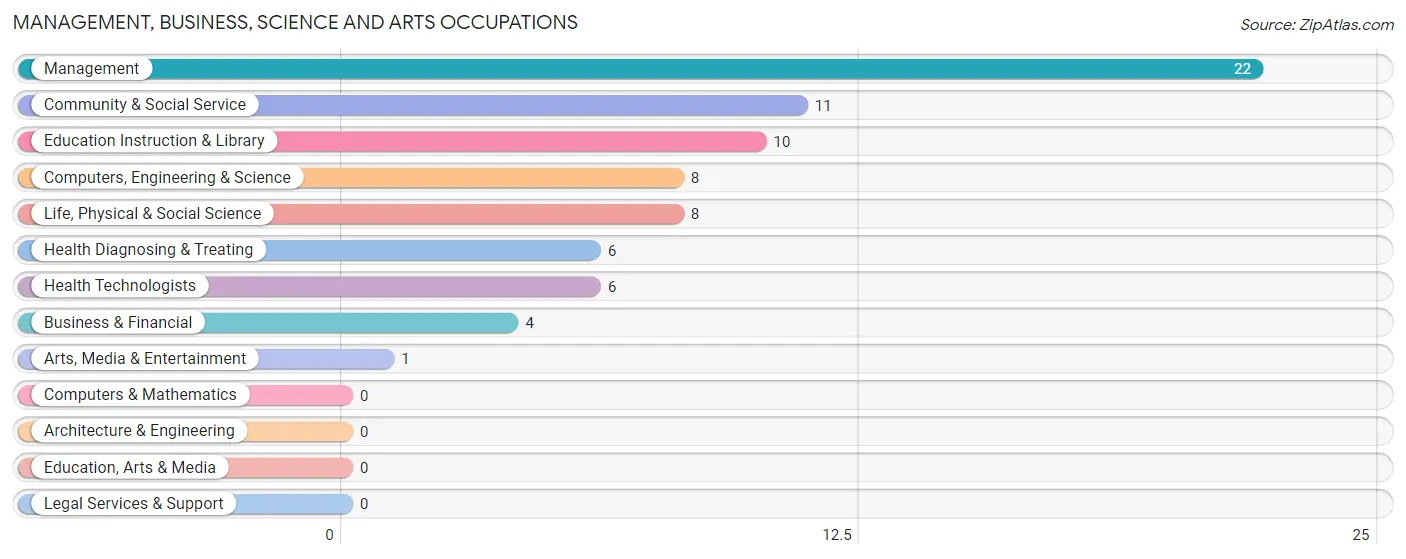
Management, Business, Science and Arts Occupations
The most common Management, Business, Science and Arts occupations in Mercer are Management (22 | 10.1%), Community & Social Service (11 | 5.0%), Education Instruction & Library (10 | 4.6%), Computers, Engineering & Science (8 | 3.6%), and Life, Physical & Social Science (8 | 3.6%).
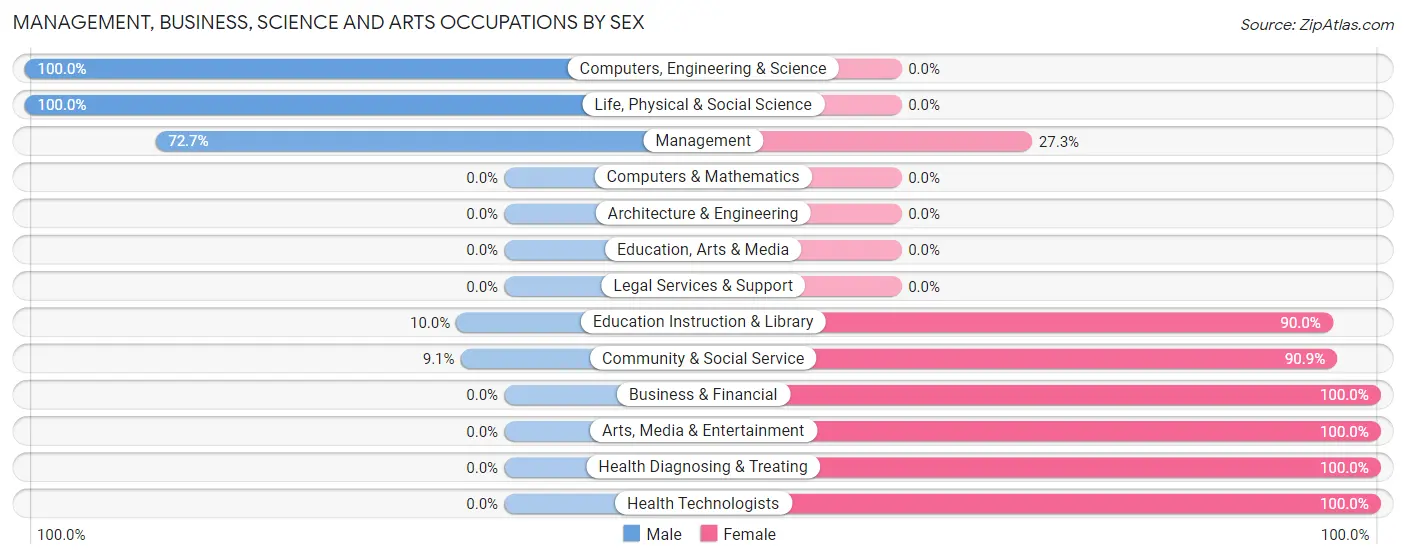
Management, Business, Science and Arts Occupations by Sex
Within the Management, Business, Science and Arts occupations in Mercer, the most male-oriented occupations are Computers, Engineering & Science (100.0%), Life, Physical & Social Science (100.0%), and Management (72.7%), while the most female-oriented occupations are Business & Financial (100.0%), Arts, Media & Entertainment (100.0%), and Health Diagnosing & Treating (100.0%).
| Occupation | Male | Female |
| Management | 16 (72.7%) | 6 (27.3%) |
| Business & Financial | 0 (0.0%) | 4 (100.0%) |
| Computers, Engineering & Science | 8 (100.0%) | 0 (0.0%) |
| Computers & Mathematics | 0 (0.0%) | 0 (0.0%) |
| Architecture & Engineering | 0 (0.0%) | 0 (0.0%) |
| Life, Physical & Social Science | 8 (100.0%) | 0 (0.0%) |
| Community & Social Service | 1 (9.1%) | 10 (90.9%) |
| Education, Arts & Media | 0 (0.0%) | 0 (0.0%) |
| Legal Services & Support | 0 (0.0%) | 0 (0.0%) |
| Education Instruction & Library | 1 (10.0%) | 9 (90.0%) |
| Arts, Media & Entertainment | 0 (0.0%) | 1 (100.0%) |
| Health Diagnosing & Treating | 0 (0.0%) | 6 (100.0%) |
| Health Technologists | 0 (0.0%) | 6 (100.0%) |
| Total (Category) | 25 (49.0%) | 26 (51.0%) |
| Total (Overall) | 136 (62.1%) | 83 (37.9%) |
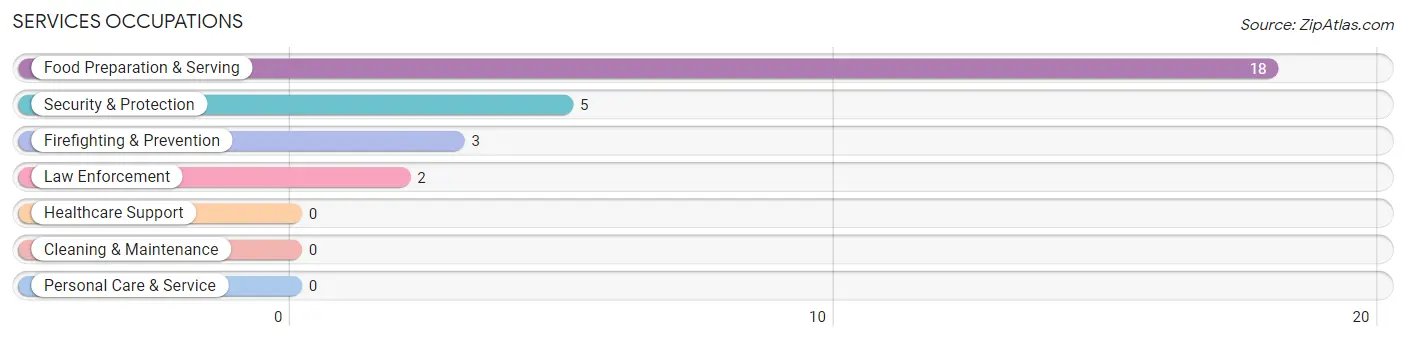
Services Occupations
The most common Services occupations in Mercer are Food Preparation & Serving (18 | 8.2%), Security & Protection (5 | 2.3%), Firefighting & Prevention (3 | 1.4%), and Law Enforcement (2 | 0.9%).
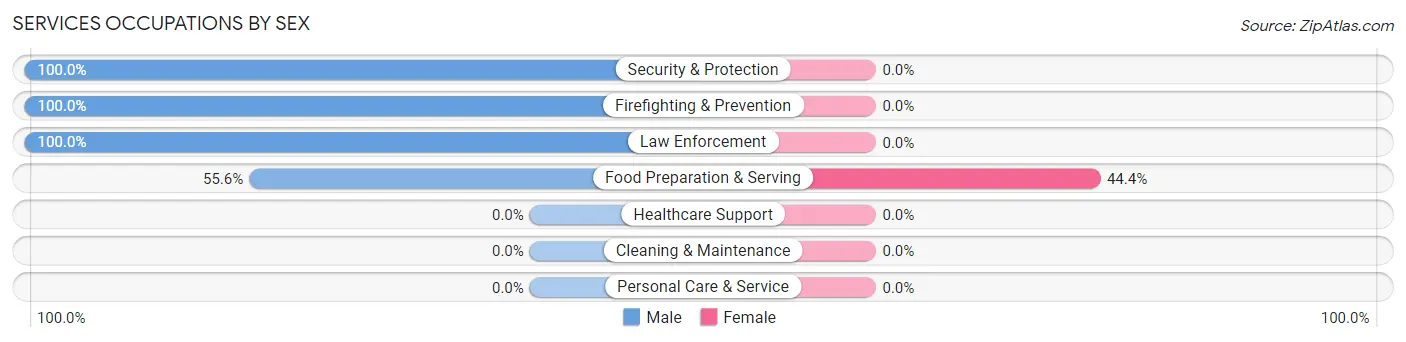
Services Occupations by Sex
| Occupation | Male | Female |
| Healthcare Support | 0 (0.0%) | 0 (0.0%) |
| Security & Protection | 5 (100.0%) | 0 (0.0%) |
| Firefighting & Prevention | 3 (100.0%) | 0 (0.0%) |
| Law Enforcement | 2 (100.0%) | 0 (0.0%) |
| Food Preparation & Serving | 10 (55.6%) | 8 (44.4%) |
| Cleaning & Maintenance | 0 (0.0%) | 0 (0.0%) |
| Personal Care & Service | 0 (0.0%) | 0 (0.0%) |
| Total (Category) | 15 (65.2%) | 8 (34.8%) |
| Total (Overall) | 136 (62.1%) | 83 (37.9%) |
Sales and Office Occupations
The most common Sales and Office occupations in Mercer are Sales & Related (27 | 12.3%), and Office & Administration (11 | 5.0%).
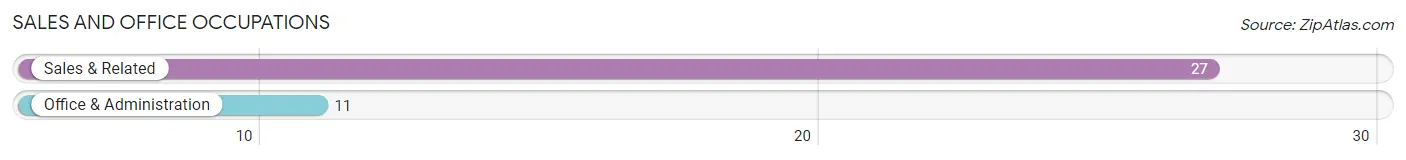
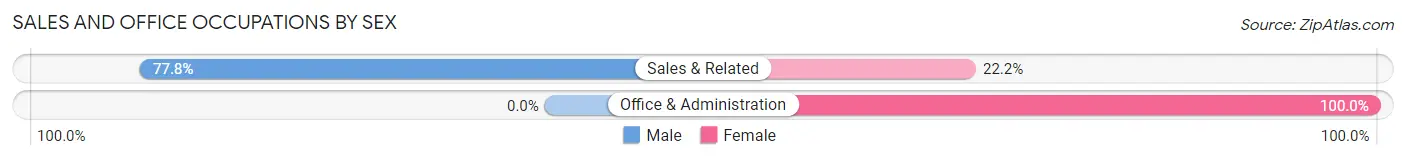
Sales and Office Occupations by Sex
| Occupation | Male | Female |
| Sales & Related | 21 (77.8%) | 6 (22.2%) |
| Office & Administration | 0 (0.0%) | 11 (100.0%) |
| Total (Category) | 21 (55.3%) | 17 (44.7%) |
| Total (Overall) | 136 (62.1%) | 83 (37.9%) |
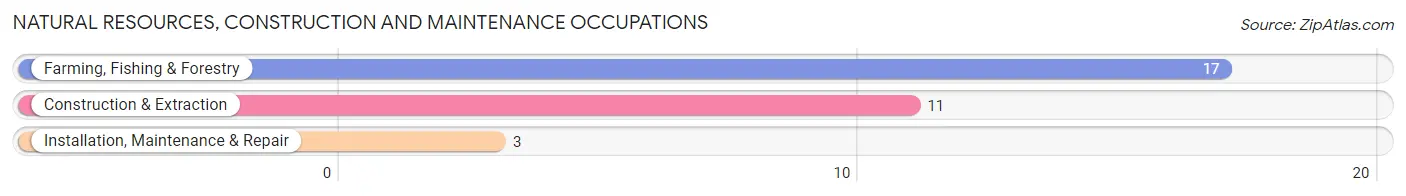
Natural Resources, Construction and Maintenance Occupations
The most common Natural Resources, Construction and Maintenance occupations in Mercer are Farming, Fishing & Forestry (17 | 7.8%), Construction & Extraction (11 | 5.0%), and Installation, Maintenance & Repair (3 | 1.4%).
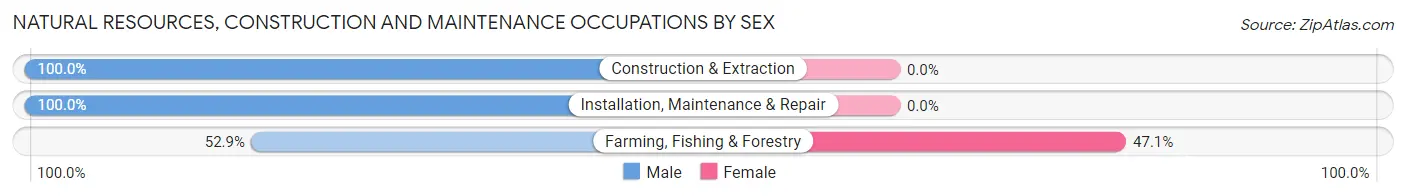
Natural Resources, Construction and Maintenance Occupations by Sex
| Occupation | Male | Female |
| Farming, Fishing & Forestry | 9 (52.9%) | 8 (47.1%) |
| Construction & Extraction | 11 (100.0%) | 0 (0.0%) |
| Installation, Maintenance & Repair | 3 (100.0%) | 0 (0.0%) |
| Total (Category) | 23 (74.2%) | 8 (25.8%) |
| Total (Overall) | 136 (62.1%) | 83 (37.9%) |
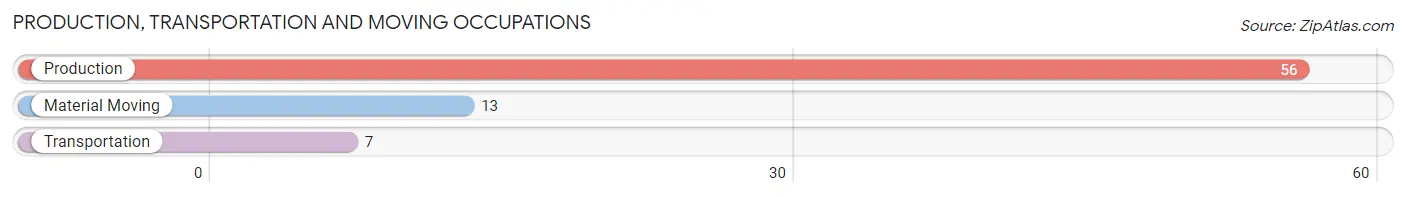
Production, Transportation and Moving Occupations
The most common Production, Transportation and Moving occupations in Mercer are Production (56 | 25.6%), Material Moving (13 | 5.9%), and Transportation (7 | 3.2%).
Production, Transportation and Moving Occupations by Sex
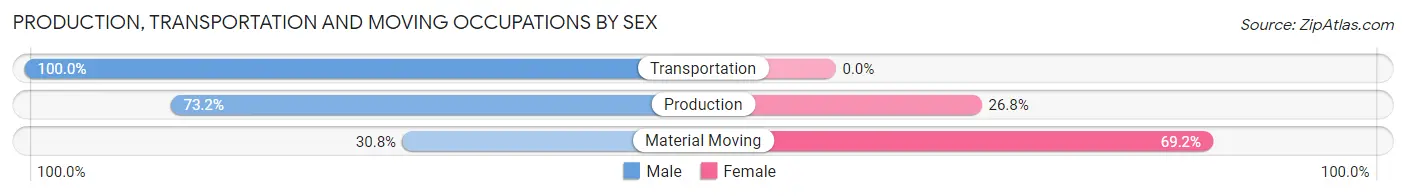
| Occupation | Male | Female |
| Production | 41 (73.2%) | 15 (26.8%) |
| Transportation | 7 (100.0%) | 0 (0.0%) |
| Material Moving | 4 (30.8%) | 9 (69.2%) |
| Total (Category) | 52 (68.4%) | 24 (31.6%) |
| Total (Overall) | 136 (62.1%) | 83 (37.9%) |
Employment Industries by Sex in Mercer
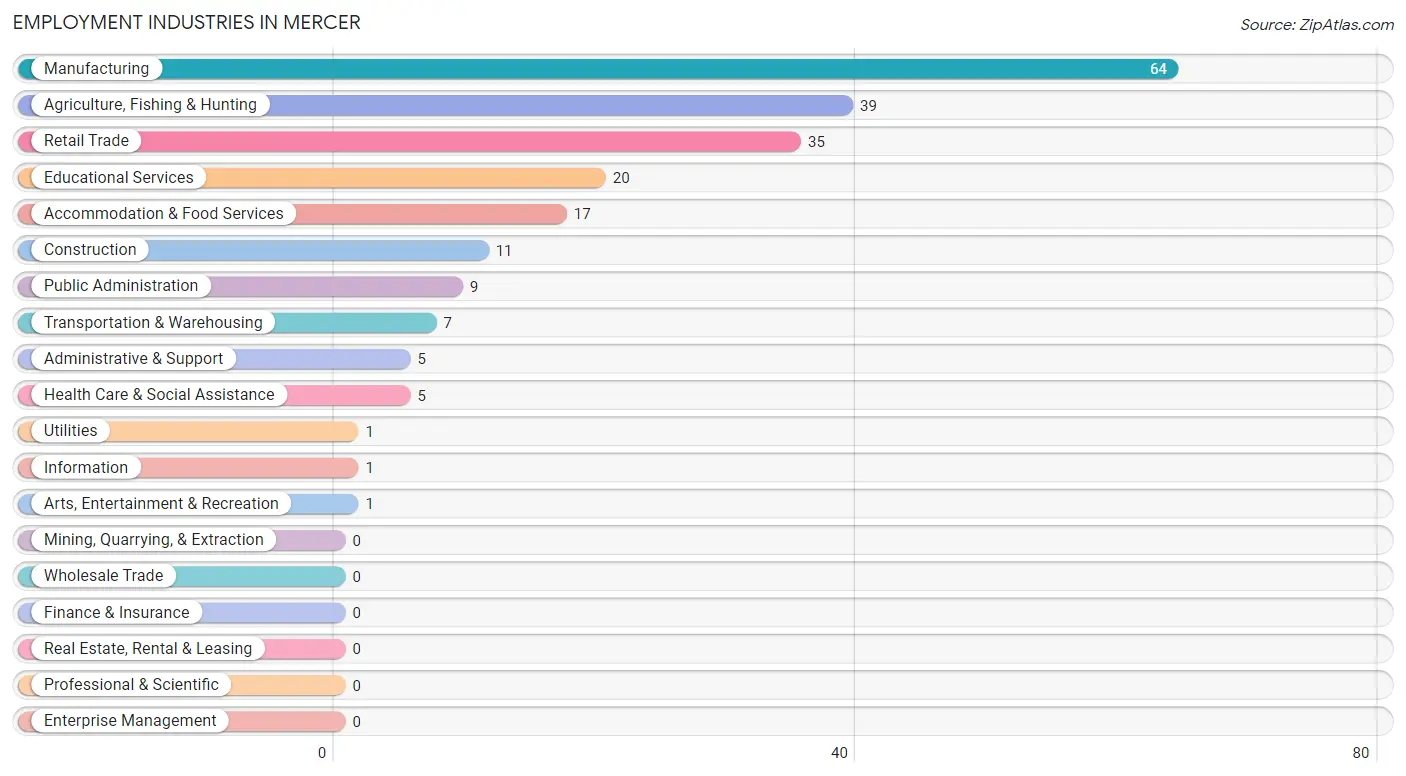
Employment Industries in Mercer
The major employment industries in Mercer include Manufacturing (64 | 29.2%), Agriculture, Fishing & Hunting (39 | 17.8%), Retail Trade (35 | 16.0%), Educational Services (20 | 9.1%), and Accommodation & Food Services (17 | 7.8%).
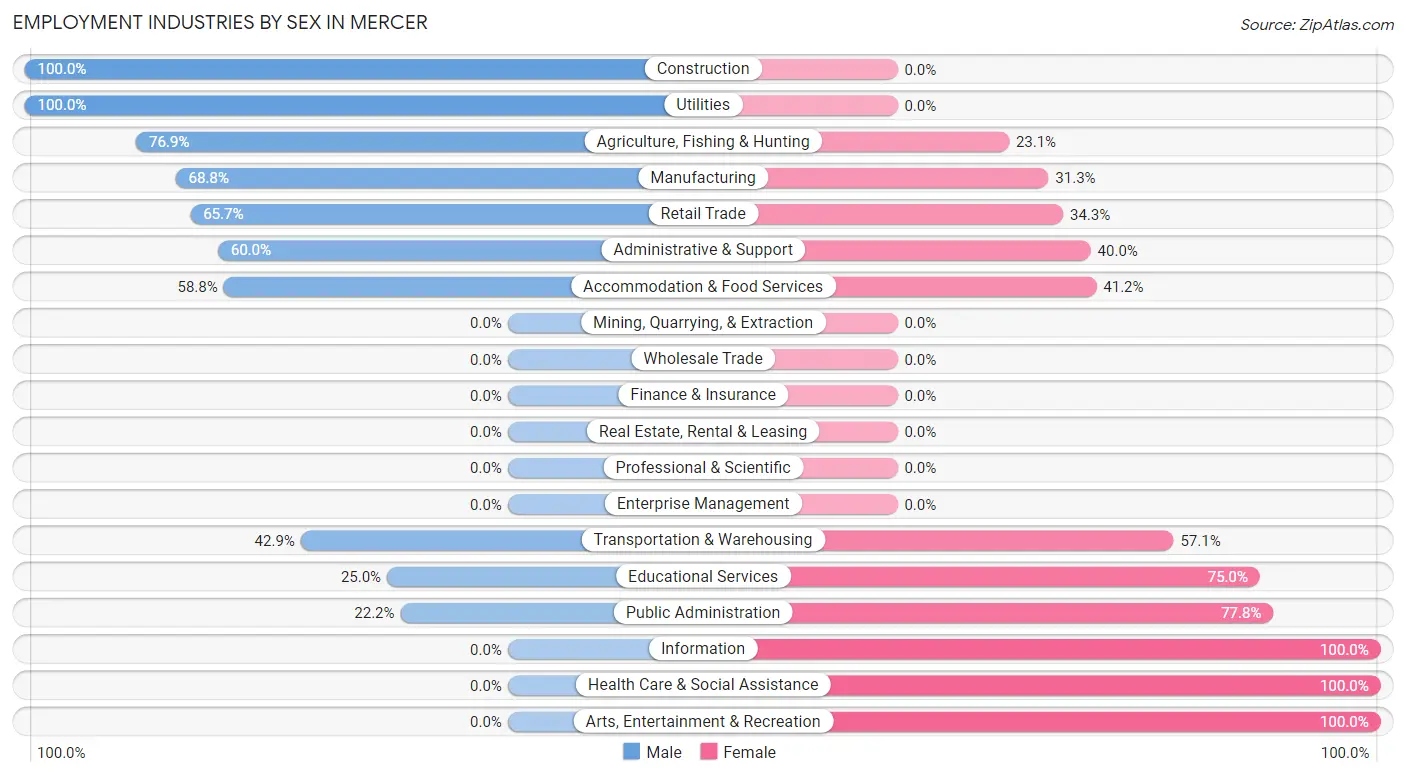
Employment Industries by Sex in Mercer
The Mercer industries that see more men than women are Construction (100.0%), Utilities (100.0%), and Agriculture, Fishing & Hunting (76.9%), whereas the industries that tend to have a higher number of women are Information (100.0%), Health Care & Social Assistance (100.0%), and Arts, Entertainment & Recreation (100.0%).
| Industry | Male | Female |
| Agriculture, Fishing & Hunting | 30 (76.9%) | 9 (23.1%) |
| Mining, Quarrying, & Extraction | 0 (0.0%) | 0 (0.0%) |
| Construction | 11 (100.0%) | 0 (0.0%) |
| Manufacturing | 44 (68.8%) | 20 (31.2%) |
| Wholesale Trade | 0 (0.0%) | 0 (0.0%) |
| Retail Trade | 23 (65.7%) | 12 (34.3%) |
| Transportation & Warehousing | 3 (42.9%) | 4 (57.1%) |
| Utilities | 1 (100.0%) | 0 (0.0%) |
| Information | 0 (0.0%) | 1 (100.0%) |
| Finance & Insurance | 0 (0.0%) | 0 (0.0%) |
| Real Estate, Rental & Leasing | 0 (0.0%) | 0 (0.0%) |
| Professional & Scientific | 0 (0.0%) | 0 (0.0%) |
| Enterprise Management | 0 (0.0%) | 0 (0.0%) |
| Administrative & Support | 3 (60.0%) | 2 (40.0%) |
| Educational Services | 5 (25.0%) | 15 (75.0%) |
| Health Care & Social Assistance | 0 (0.0%) | 5 (100.0%) |
| Arts, Entertainment & Recreation | 0 (0.0%) | 1 (100.0%) |
| Accommodation & Food Services | 10 (58.8%) | 7 (41.2%) |
| Public Administration | 2 (22.2%) | 7 (77.8%) |
| Total | 136 (62.1%) | 83 (37.9%) |
Education in Mercer
School Enrollment in Mercer
The most common levels of schooling among the 41 students in Mercer are middle school (19 | 46.3%), elementary school (9 | 22.0%), and college / undergraduate (9 | 22.0%).
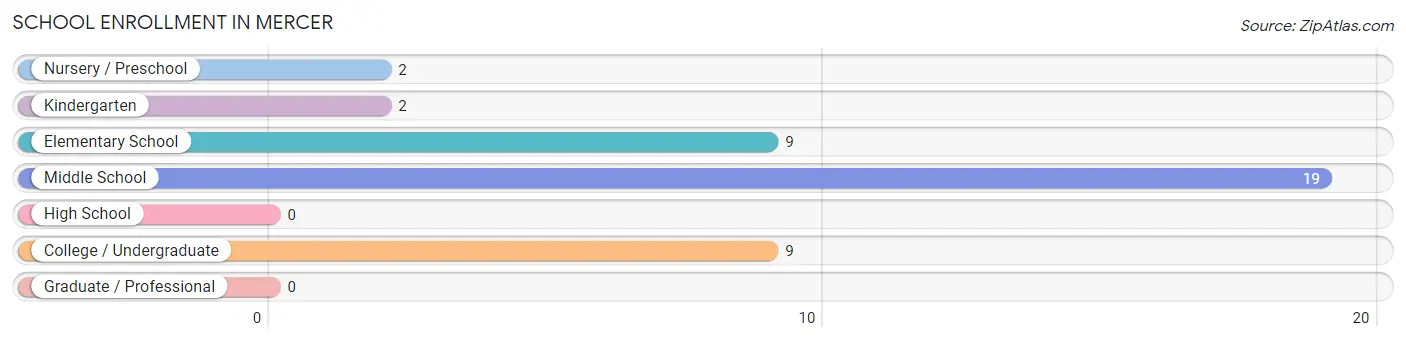
| School Level | # Students | % Students |
| Nursery / Preschool | 2 | 4.9% |
| Kindergarten | 2 | 4.9% |
| Elementary School | 9 | 22.0% |
| Middle School | 19 | 46.3% |
| High School | 0 | 0.0% |
| College / Undergraduate | 9 | 22.0% |
| Graduate / Professional | 0 | 0.0% |
| Total | 41 | 100.0% |
School Enrollment by Age by Funding Source in Mercer
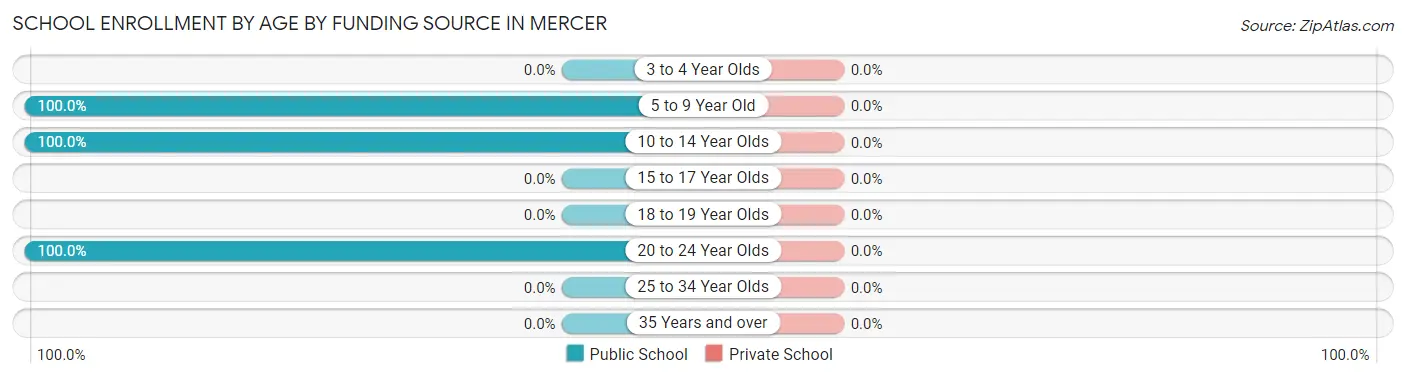
| Age Bracket | Public School | Private School |
| 3 to 4 Year Olds | 0 (0.0%) | 0 (0.0%) |
| 5 to 9 Year Old | 13 (100.0%) | 0 (0.0%) |
| 10 to 14 Year Olds | 19 (100.0%) | 0 (0.0%) |
| 15 to 17 Year Olds | 0 (0.0%) | 0 (0.0%) |
| 18 to 19 Year Olds | 0 (0.0%) | 0 (0.0%) |
| 20 to 24 Year Olds | 9 (100.0%) | 0 (0.0%) |
| 25 to 34 Year Olds | 0 (0.0%) | 0 (0.0%) |
| 35 Years and over | 0 (0.0%) | 0 (0.0%) |
| Total | 41 (100.0%) | 0 (0.0%) |
Educational Attainment by Field of Study in Mercer
Education (15 | 35.7%), liberal arts & history (6 | 14.3%), communications (5 | 11.9%), business (4 | 9.5%), and literature & languages (4 | 9.5%) are the most common fields of study among 42 individuals in Mercer who have obtained a bachelor's degree or higher.
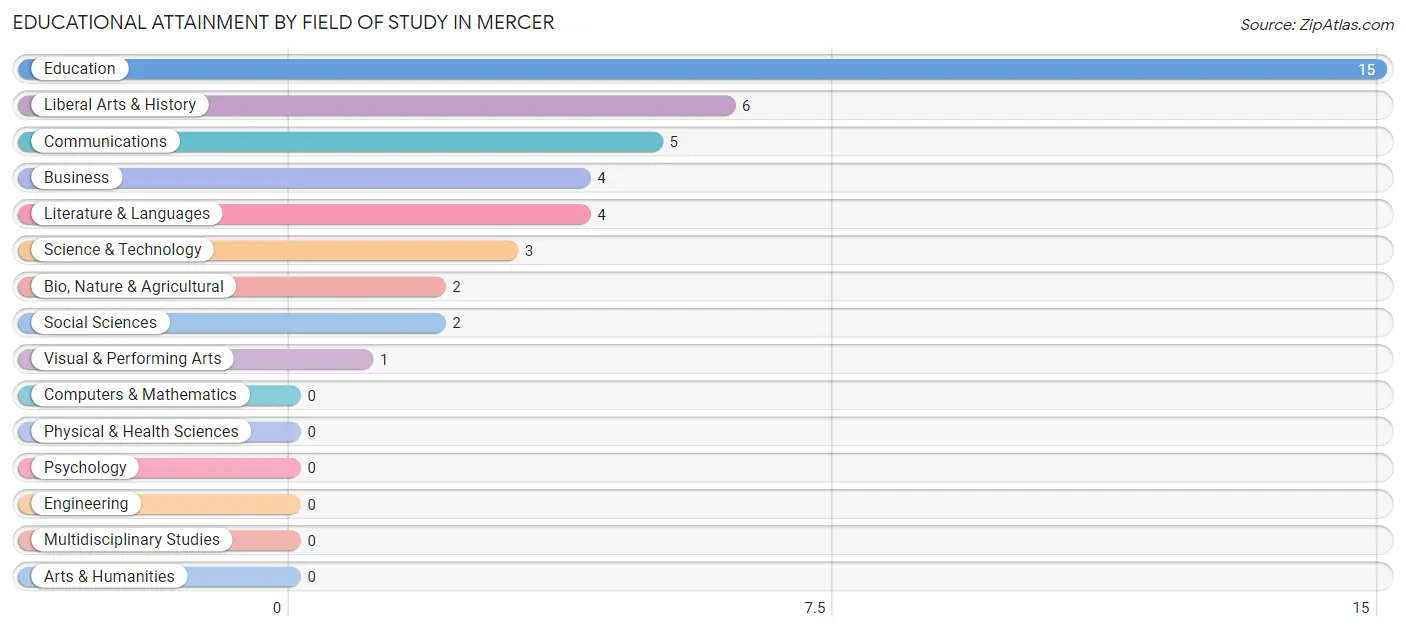
| Field of Study | # Graduates | % Graduates |
| Computers & Mathematics | 0 | 0.0% |
| Bio, Nature & Agricultural | 2 | 4.8% |
| Physical & Health Sciences | 0 | 0.0% |
| Psychology | 0 | 0.0% |
| Social Sciences | 2 | 4.8% |
| Engineering | 0 | 0.0% |
| Multidisciplinary Studies | 0 | 0.0% |
| Science & Technology | 3 | 7.1% |
| Business | 4 | 9.5% |
| Education | 15 | 35.7% |
| Literature & Languages | 4 | 9.5% |
| Liberal Arts & History | 6 | 14.3% |
| Visual & Performing Arts | 1 | 2.4% |
| Communications | 5 | 11.9% |
| Arts & Humanities | 0 | 0.0% |
| Total | 42 | 100.0% |
Transportation & Commute in Mercer
Vehicle Availability by Sex in Mercer
The most prevalent vehicle ownership categories in Mercer are males with 3 vehicles (92, accounting for 64.3%) and females with 3 vehicles (39, making up 110.8%).
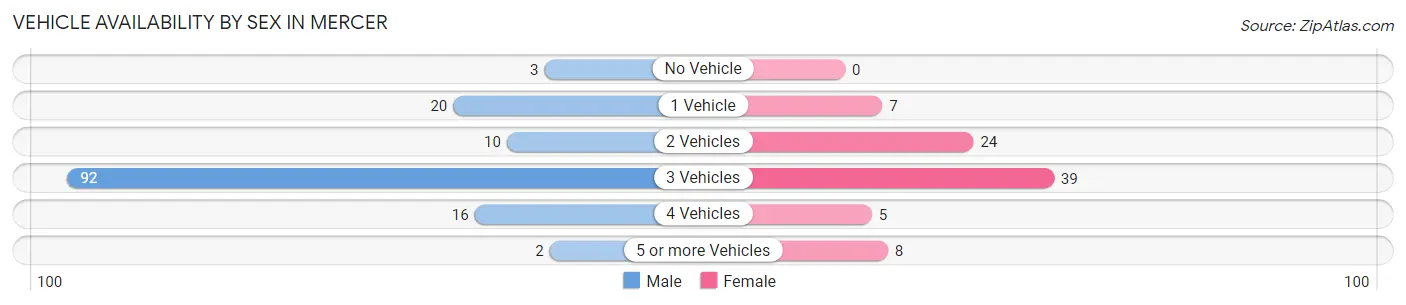
| Vehicles Available | Male | Female |
| No Vehicle | 3 (2.1%) | 0 (0.0%) |
| 1 Vehicle | 20 (14.0%) | 7 (8.4%) |
| 2 Vehicles | 10 (7.0%) | 24 (28.9%) |
| 3 Vehicles | 92 (64.3%) | 39 (47.0%) |
| 4 Vehicles | 16 (11.2%) | 5 (6.0%) |
| 5 or more Vehicles | 2 (1.4%) | 8 (9.6%) |
| Total | 143 (100.0%) | 83 (100.0%) |
Commute Time in Mercer
The most frequently occuring commute durations in Mercer are 10 to 14 minutes (74 commuters, 33.3%), 30 to 34 minutes (31 commuters, 14.0%), and 25 to 29 minutes (26 commuters, 11.7%).
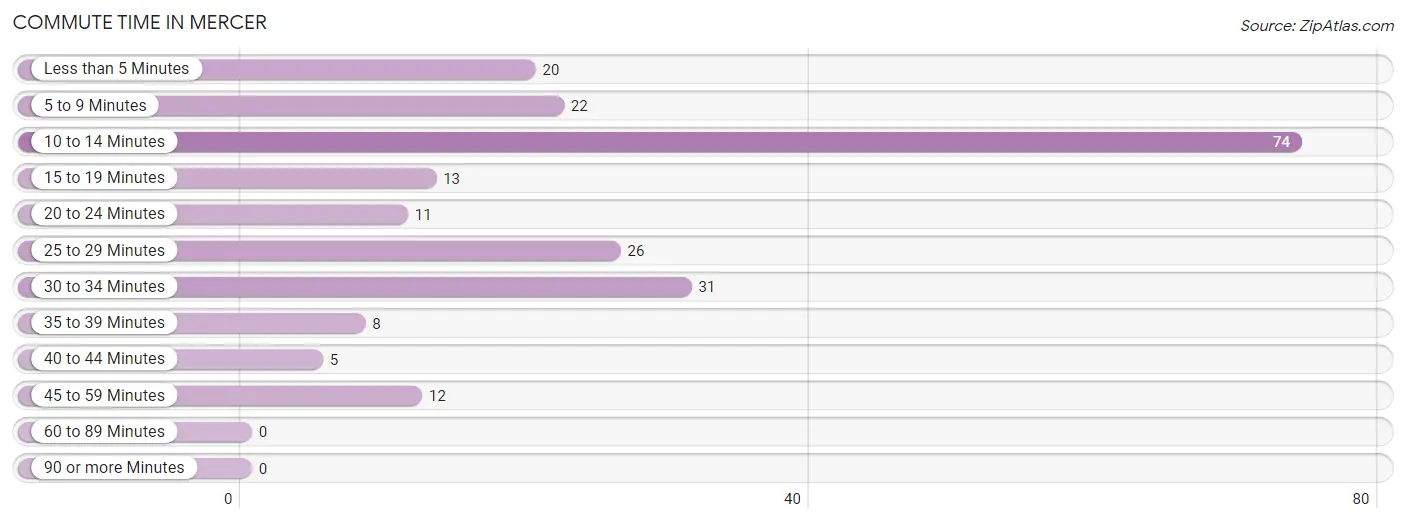
| Commute Time | # Commuters | % Commuters |
| Less than 5 Minutes | 20 | 9.0% |
| 5 to 9 Minutes | 22 | 9.9% |
| 10 to 14 Minutes | 74 | 33.3% |
| 15 to 19 Minutes | 13 | 5.9% |
| 20 to 24 Minutes | 11 | 5.0% |
| 25 to 29 Minutes | 26 | 11.7% |
| 30 to 34 Minutes | 31 | 14.0% |
| 35 to 39 Minutes | 8 | 3.6% |
| 40 to 44 Minutes | 5 | 2.2% |
| 45 to 59 Minutes | 12 | 5.4% |
| 60 to 89 Minutes | 0 | 0.0% |
| 90 or more Minutes | 0 | 0.0% |
Commute Time by Sex in Mercer
The most common commute times in Mercer are 10 to 14 minutes (58 commuters, 41.7%) for males and 25 to 29 minutes (24 commuters, 28.9%) for females.
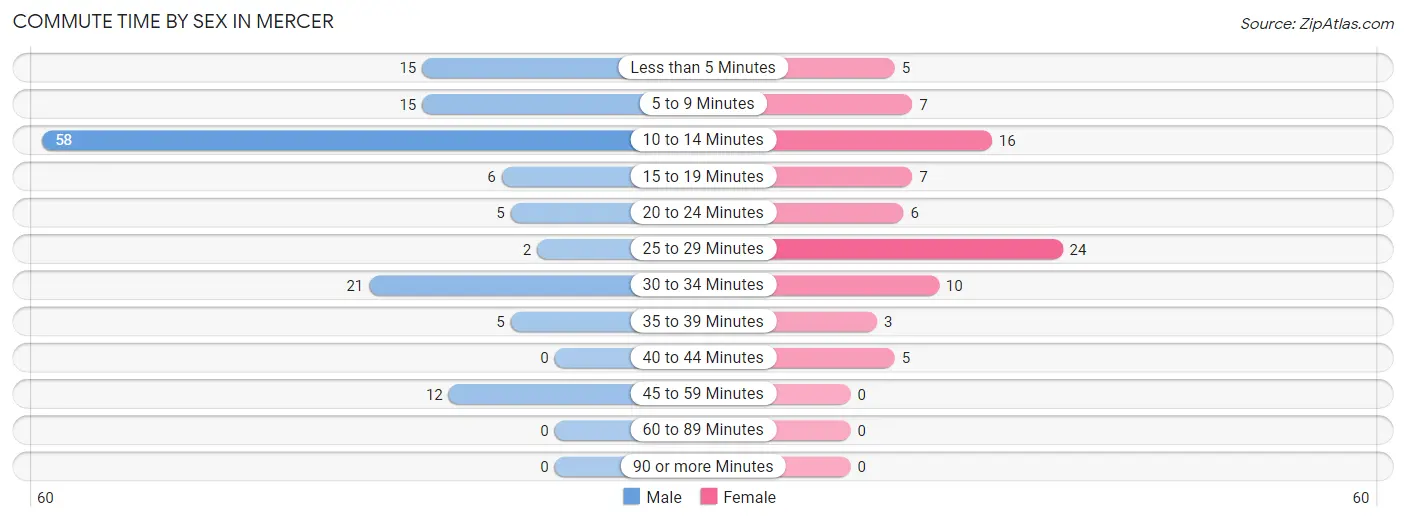
| Commute Time | Male | Female |
| Less than 5 Minutes | 15 (10.8%) | 5 (6.0%) |
| 5 to 9 Minutes | 15 (10.8%) | 7 (8.4%) |
| 10 to 14 Minutes | 58 (41.7%) | 16 (19.3%) |
| 15 to 19 Minutes | 6 (4.3%) | 7 (8.4%) |
| 20 to 24 Minutes | 5 (3.6%) | 6 (7.2%) |
| 25 to 29 Minutes | 2 (1.4%) | 24 (28.9%) |
| 30 to 34 Minutes | 21 (15.1%) | 10 (12.0%) |
| 35 to 39 Minutes | 5 (3.6%) | 3 (3.6%) |
| 40 to 44 Minutes | 0 (0.0%) | 5 (6.0%) |
| 45 to 59 Minutes | 12 (8.6%) | 0 (0.0%) |
| 60 to 89 Minutes | 0 (0.0%) | 0 (0.0%) |
| 90 or more Minutes | 0 (0.0%) | 0 (0.0%) |
Time of Departure to Work by Sex in Mercer
The most frequent times of departure to work in Mercer are 5:30 AM to 5:59 AM (42, 30.2%) for males and 7:00 AM to 7:29 AM (36, 43.4%) for females.
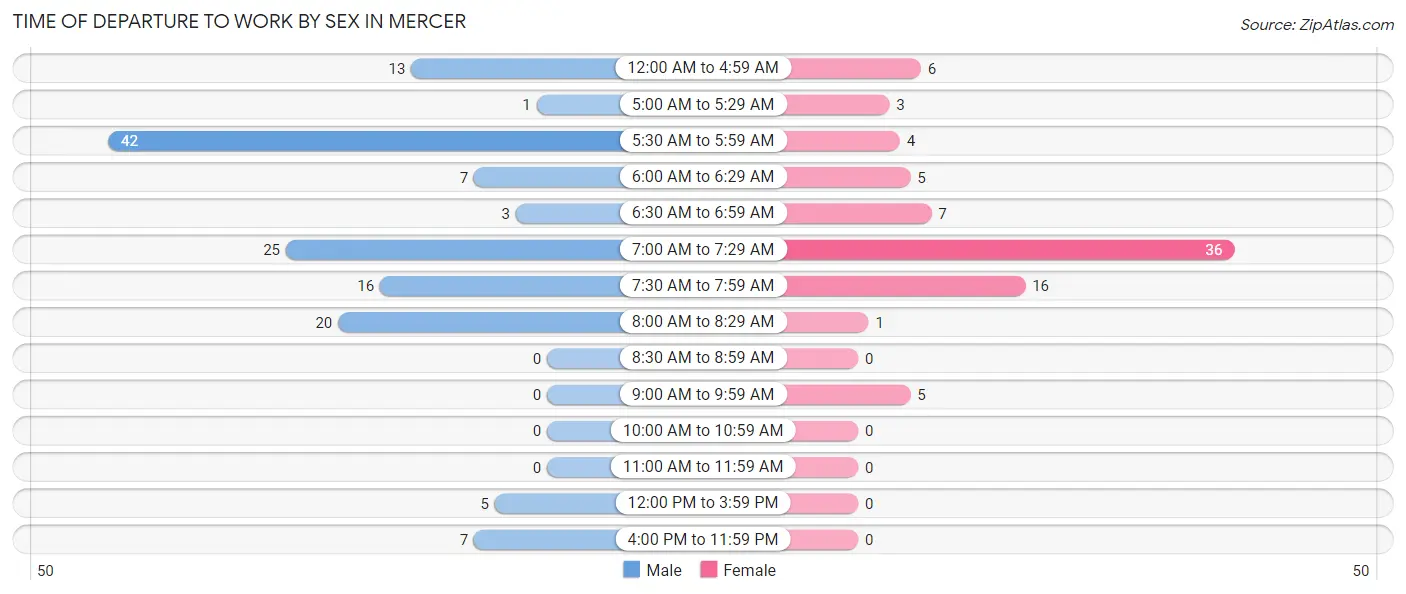
| Time of Departure | Male | Female |
| 12:00 AM to 4:59 AM | 13 (9.3%) | 6 (7.2%) |
| 5:00 AM to 5:29 AM | 1 (0.7%) | 3 (3.6%) |
| 5:30 AM to 5:59 AM | 42 (30.2%) | 4 (4.8%) |
| 6:00 AM to 6:29 AM | 7 (5.0%) | 5 (6.0%) |
| 6:30 AM to 6:59 AM | 3 (2.2%) | 7 (8.4%) |
| 7:00 AM to 7:29 AM | 25 (18.0%) | 36 (43.4%) |
| 7:30 AM to 7:59 AM | 16 (11.5%) | 16 (19.3%) |
| 8:00 AM to 8:29 AM | 20 (14.4%) | 1 (1.2%) |
| 8:30 AM to 8:59 AM | 0 (0.0%) | 0 (0.0%) |
| 9:00 AM to 9:59 AM | 0 (0.0%) | 5 (6.0%) |
| 10:00 AM to 10:59 AM | 0 (0.0%) | 0 (0.0%) |
| 11:00 AM to 11:59 AM | 0 (0.0%) | 0 (0.0%) |
| 12:00 PM to 3:59 PM | 5 (3.6%) | 0 (0.0%) |
| 4:00 PM to 11:59 PM | 7 (5.0%) | 0 (0.0%) |
| Total | 139 (100.0%) | 83 (100.0%) |
Housing Occupancy in Mercer
Occupancy by Ownership in Mercer
Of the total 163 dwellings in Mercer, owner-occupied units account for 103 (63.2%), while renter-occupied units make up 60 (36.8%).
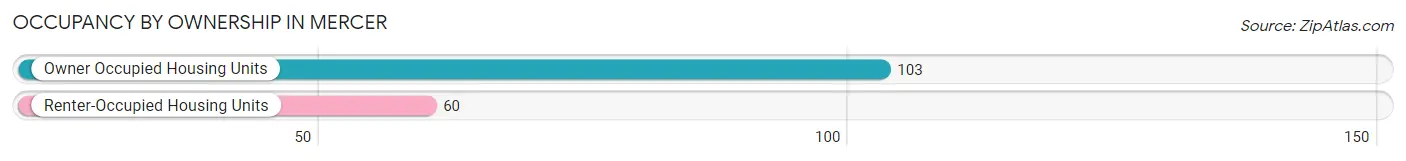
| Occupancy | # Housing Units | % Housing Units |
| Owner Occupied Housing Units | 103 | 63.2% |
| Renter-Occupied Housing Units | 60 | 36.8% |
| Total Occupied Housing Units | 163 | 100.0% |
Occupancy by Household Size in Mercer
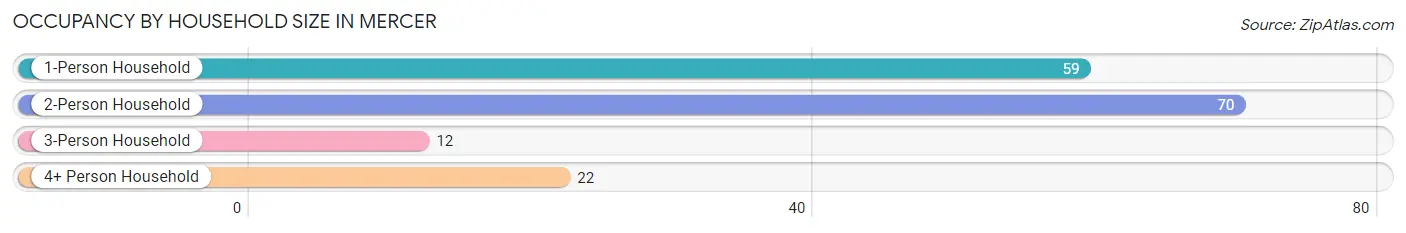
| Household Size | # Housing Units | % Housing Units |
| 1-Person Household | 59 | 36.2% |
| 2-Person Household | 70 | 42.9% |
| 3-Person Household | 12 | 7.4% |
| 4+ Person Household | 22 | 13.5% |
| Total Housing Units | 163 | 100.0% |
Occupancy by Ownership by Household Size in Mercer
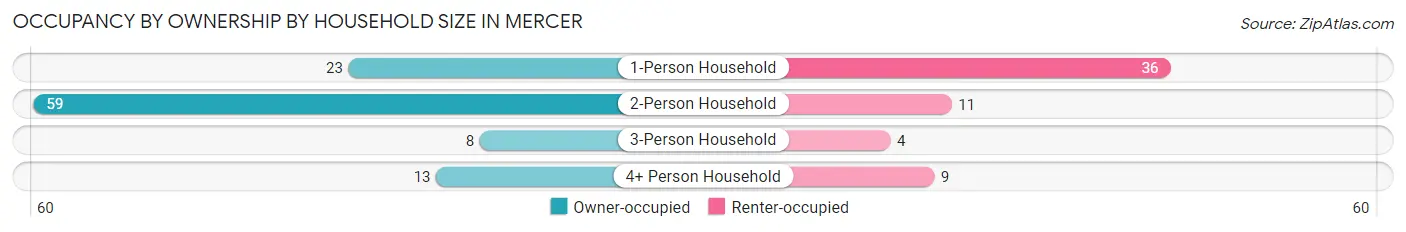
| Household Size | Owner-occupied | Renter-occupied |
| 1-Person Household | 23 (39.0%) | 36 (61.0%) |
| 2-Person Household | 59 (84.3%) | 11 (15.7%) |
| 3-Person Household | 8 (66.7%) | 4 (33.3%) |
| 4+ Person Household | 13 (59.1%) | 9 (40.9%) |
| Total Housing Units | 103 (63.2%) | 60 (36.8%) |
Occupancy by Educational Attainment in Mercer
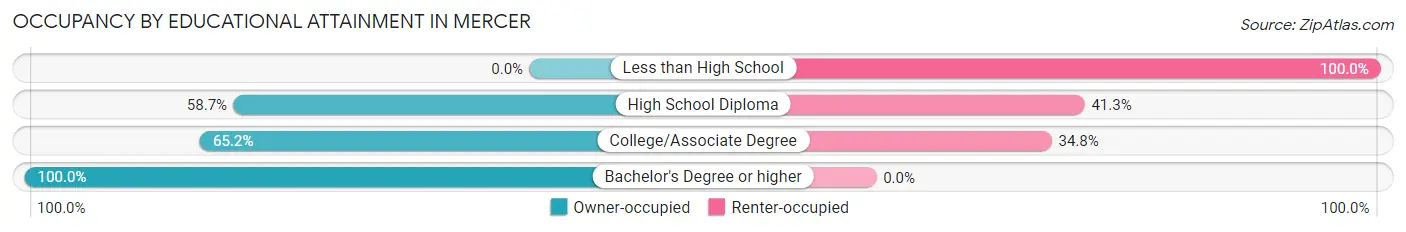
| Household Size | Owner-occupied | Renter-occupied |
| Less than High School | 0 (0.0%) | 6 (100.0%) |
| High School Diploma | 54 (58.7%) | 38 (41.3%) |
| College/Associate Degree | 30 (65.2%) | 16 (34.8%) |
| Bachelor's Degree or higher | 19 (100.0%) | 0 (0.0%) |
Occupancy by Age of Householder in Mercer
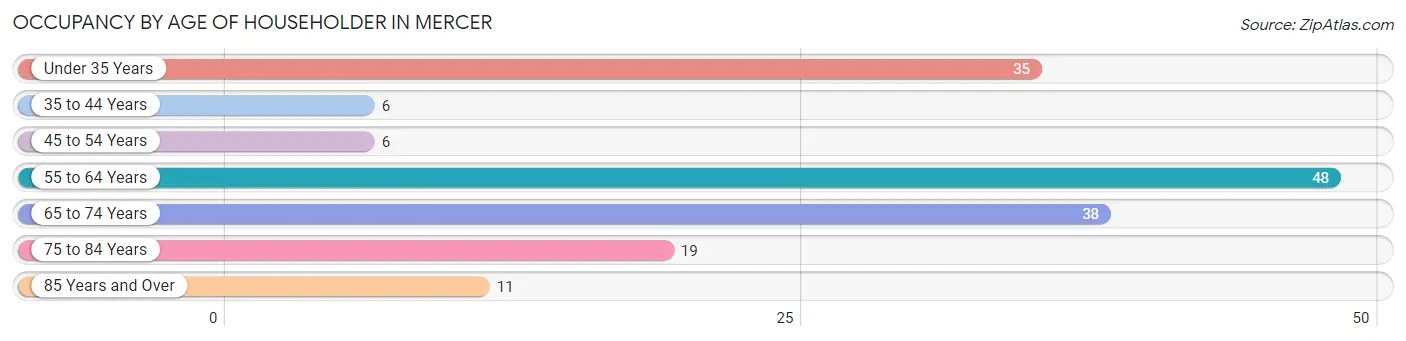
| Age Bracket | # Households | % Households |
| Under 35 Years | 35 | 21.5% |
| 35 to 44 Years | 6 | 3.7% |
| 45 to 54 Years | 6 | 3.7% |
| 55 to 64 Years | 48 | 29.4% |
| 65 to 74 Years | 38 | 23.3% |
| 75 to 84 Years | 19 | 11.7% |
| 85 Years and Over | 11 | 6.8% |
| Total | 163 | 100.0% |
Housing Finances in Mercer
Median Income by Occupancy in Mercer
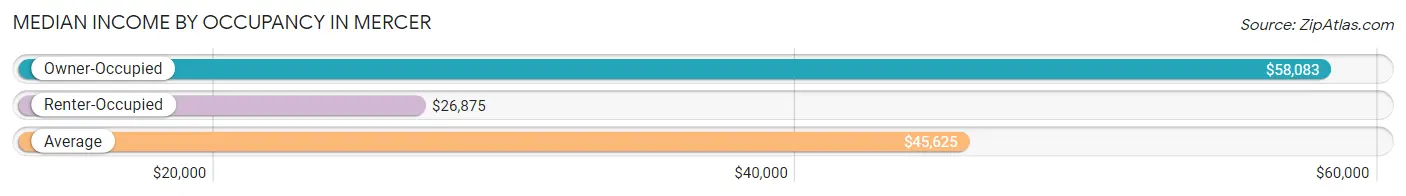
| Occupancy Type | # Households | Median Income |
| Owner-Occupied | 103 (63.2%) | $58,083 |
| Renter-Occupied | 60 (36.8%) | $26,875 |
| Average | 163 (100.0%) | $45,625 |
Occupancy by Householder Income Bracket in Mercer
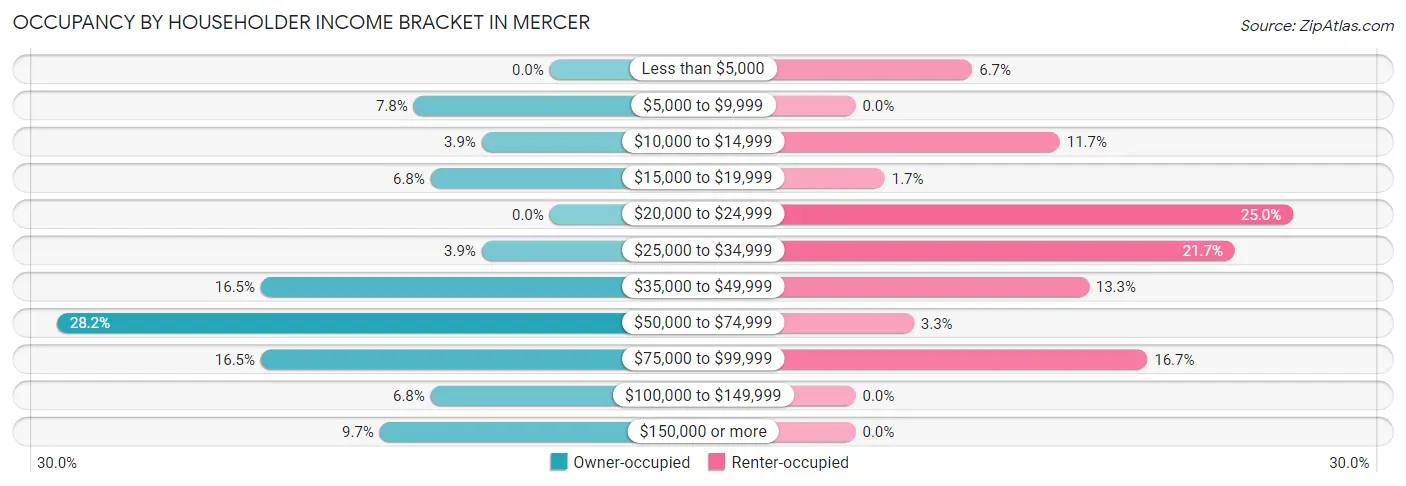
| Income Bracket | Owner-occupied | Renter-occupied |
| Less than $5,000 | 0 (0.0%) | 4 (6.7%) |
| $5,000 to $9,999 | 8 (7.8%) | 0 (0.0%) |
| $10,000 to $14,999 | 4 (3.9%) | 7 (11.7%) |
| $15,000 to $19,999 | 7 (6.8%) | 1 (1.7%) |
| $20,000 to $24,999 | 0 (0.0%) | 15 (25.0%) |
| $25,000 to $34,999 | 4 (3.9%) | 13 (21.7%) |
| $35,000 to $49,999 | 17 (16.5%) | 8 (13.3%) |
| $50,000 to $74,999 | 29 (28.2%) | 2 (3.3%) |
| $75,000 to $99,999 | 17 (16.5%) | 10 (16.7%) |
| $100,000 to $149,999 | 7 (6.8%) | 0 (0.0%) |
| $150,000 or more | 10 (9.7%) | 0 (0.0%) |
| Total | 103 (100.0%) | 60 (100.0%) |
Monthly Housing Cost Tiers in Mercer
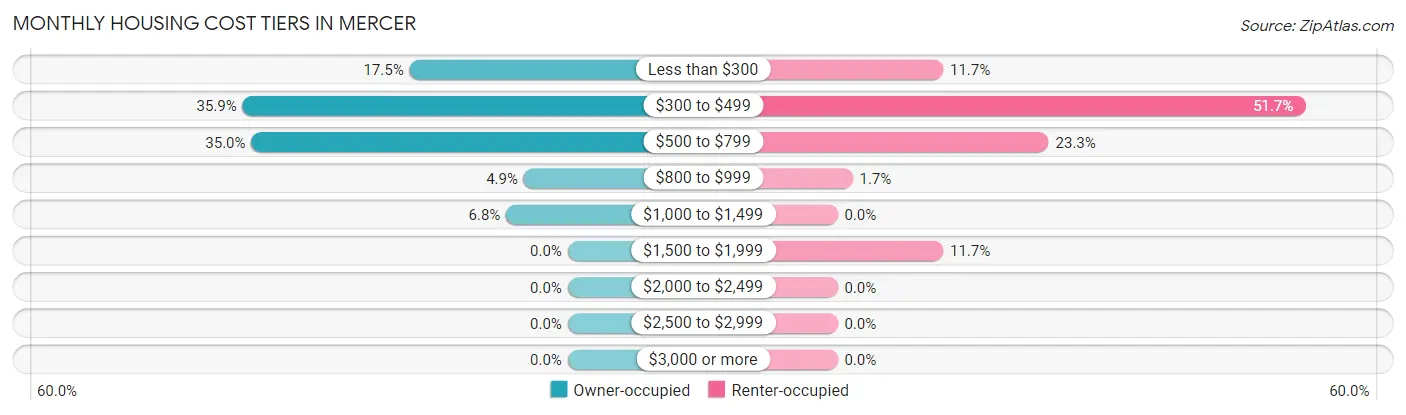
| Monthly Cost | Owner-occupied | Renter-occupied |
| Less than $300 | 18 (17.5%) | 7 (11.7%) |
| $300 to $499 | 37 (35.9%) | 31 (51.7%) |
| $500 to $799 | 36 (34.9%) | 14 (23.3%) |
| $800 to $999 | 5 (4.9%) | 1 (1.7%) |
| $1,000 to $1,499 | 7 (6.8%) | 0 (0.0%) |
| $1,500 to $1,999 | 0 (0.0%) | 7 (11.7%) |
| $2,000 to $2,499 | 0 (0.0%) | 0 (0.0%) |
| $2,500 to $2,999 | 0 (0.0%) | 0 (0.0%) |
| $3,000 or more | 0 (0.0%) | 0 (0.0%) |
| Total | 103 (100.0%) | 60 (100.0%) |
Physical Housing Characteristics in Mercer
Housing Structures in Mercer
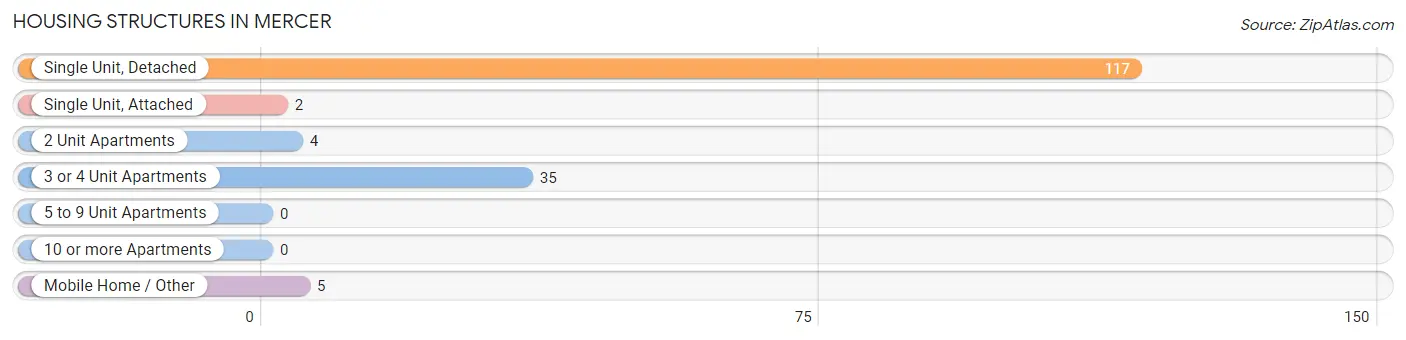
| Structure Type | # Housing Units | % Housing Units |
| Single Unit, Detached | 117 | 71.8% |
| Single Unit, Attached | 2 | 1.2% |
| 2 Unit Apartments | 4 | 2.5% |
| 3 or 4 Unit Apartments | 35 | 21.5% |
| 5 to 9 Unit Apartments | 0 | 0.0% |
| 10 or more Apartments | 0 | 0.0% |
| Mobile Home / Other | 5 | 3.1% |
| Total | 163 | 100.0% |
Housing Structures by Occupancy in Mercer
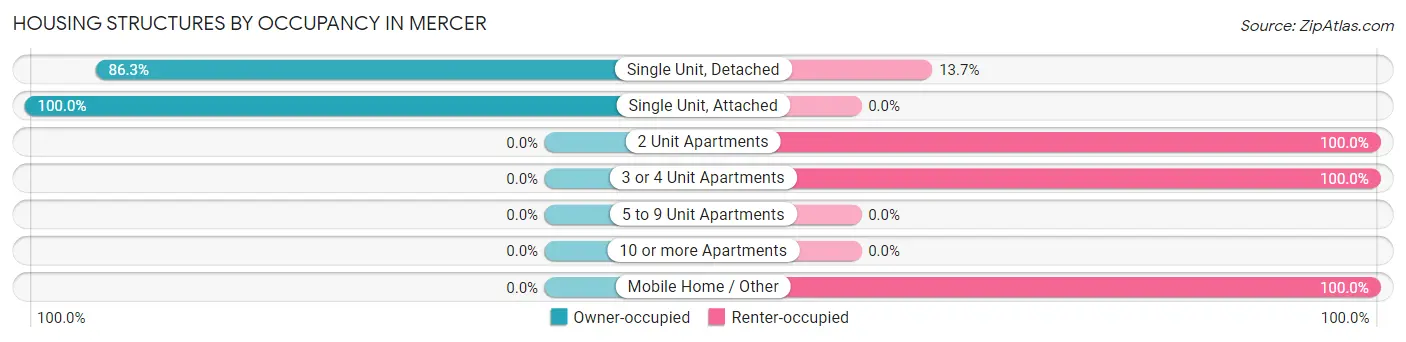
| Structure Type | Owner-occupied | Renter-occupied |
| Single Unit, Detached | 101 (86.3%) | 16 (13.7%) |
| Single Unit, Attached | 2 (100.0%) | 0 (0.0%) |
| 2 Unit Apartments | 0 (0.0%) | 4 (100.0%) |
| 3 or 4 Unit Apartments | 0 (0.0%) | 35 (100.0%) |
| 5 to 9 Unit Apartments | 0 (0.0%) | 0 (0.0%) |
| 10 or more Apartments | 0 (0.0%) | 0 (0.0%) |
| Mobile Home / Other | 0 (0.0%) | 5 (100.0%) |
| Total | 103 (63.2%) | 60 (36.8%) |
Housing Structures by Number of Rooms in Mercer
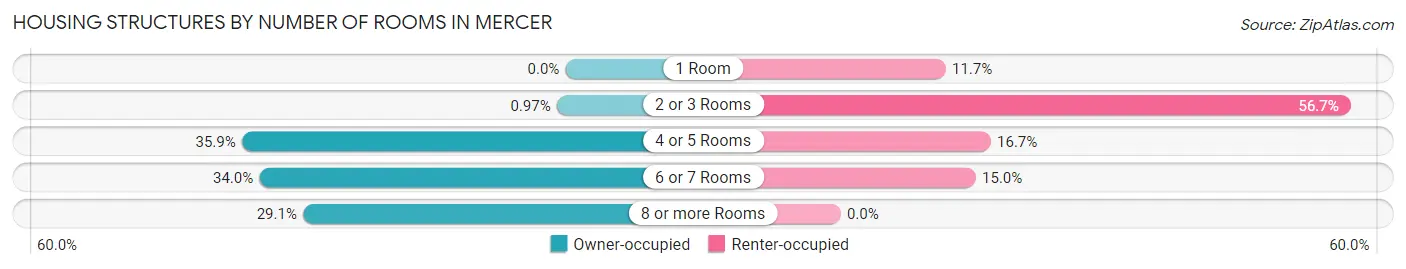
| Number of Rooms | Owner-occupied | Renter-occupied |
| 1 Room | 0 (0.0%) | 7 (11.7%) |
| 2 or 3 Rooms | 1 (1.0%) | 34 (56.7%) |
| 4 or 5 Rooms | 37 (35.9%) | 10 (16.7%) |
| 6 or 7 Rooms | 35 (34.0%) | 9 (15.0%) |
| 8 or more Rooms | 30 (29.1%) | 0 (0.0%) |
| Total | 103 (100.0%) | 60 (100.0%) |
Housing Structure by Heating Type in Mercer
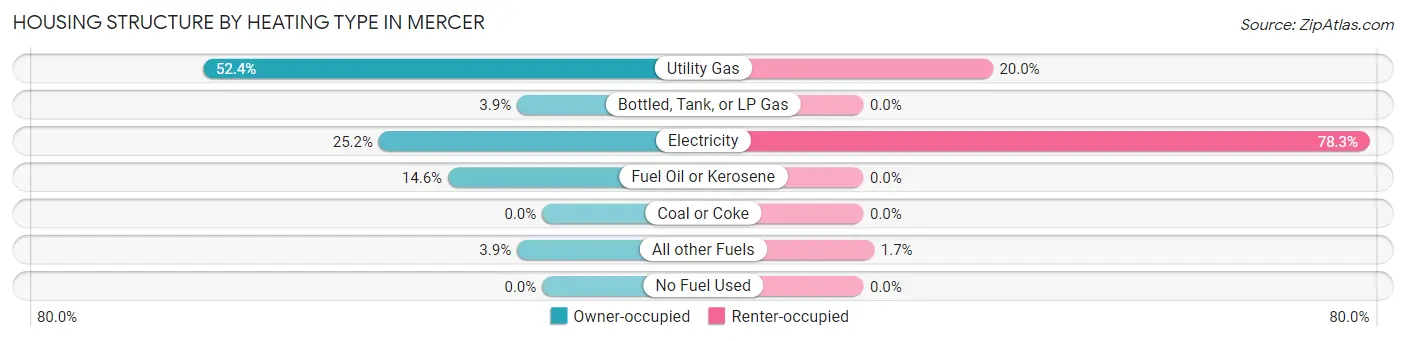
| Heating Type | Owner-occupied | Renter-occupied |
| Utility Gas | 54 (52.4%) | 12 (20.0%) |
| Bottled, Tank, or LP Gas | 4 (3.9%) | 0 (0.0%) |
| Electricity | 26 (25.2%) | 47 (78.3%) |
| Fuel Oil or Kerosene | 15 (14.6%) | 0 (0.0%) |
| Coal or Coke | 0 (0.0%) | 0 (0.0%) |
| All other Fuels | 4 (3.9%) | 1 (1.7%) |
| No Fuel Used | 0 (0.0%) | 0 (0.0%) |
| Total | 103 (100.0%) | 60 (100.0%) |
Household Vehicle Usage in Mercer
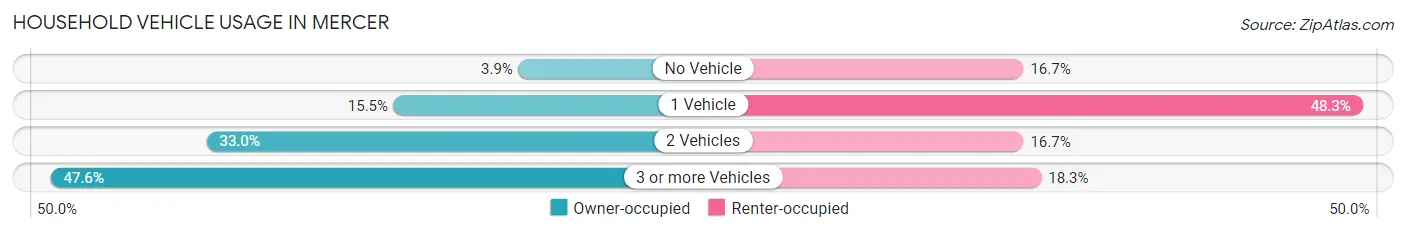
| Vehicles per Household | Owner-occupied | Renter-occupied |
| No Vehicle | 4 (3.9%) | 10 (16.7%) |
| 1 Vehicle | 16 (15.5%) | 29 (48.3%) |
| 2 Vehicles | 34 (33.0%) | 10 (16.7%) |
| 3 or more Vehicles | 49 (47.6%) | 11 (18.3%) |
| Total | 103 (100.0%) | 60 (100.0%) |
Real Estate & Mortgages in Mercer
Real Estate and Mortgage Overview in Mercer
| Characteristic | Without Mortgage | With Mortgage |
| Housing Units | 77 | 26 |
| Median Property Value | $82,500 | $57,500 |
| Median Household Income | $57,583 | $0 |
| Monthly Housing Costs | $403 | $0 |
| Real Estate Taxes | $477 | $0 |
Property Value by Mortgage Status in Mercer
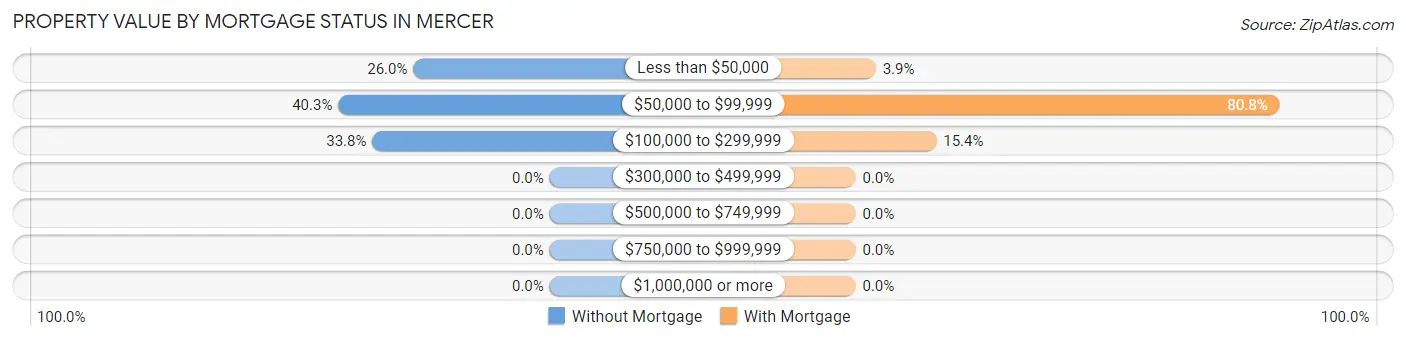
| Property Value | Without Mortgage | With Mortgage |
| Less than $50,000 | 20 (26.0%) | 1 (3.8%) |
| $50,000 to $99,999 | 31 (40.3%) | 21 (80.8%) |
| $100,000 to $299,999 | 26 (33.8%) | 4 (15.4%) |
| $300,000 to $499,999 | 0 (0.0%) | 0 (0.0%) |
| $500,000 to $749,999 | 0 (0.0%) | 0 (0.0%) |
| $750,000 to $999,999 | 0 (0.0%) | 0 (0.0%) |
| $1,000,000 or more | 0 (0.0%) | 0 (0.0%) |
| Total | 77 (100.0%) | 26 (100.0%) |
Household Income by Mortgage Status in Mercer
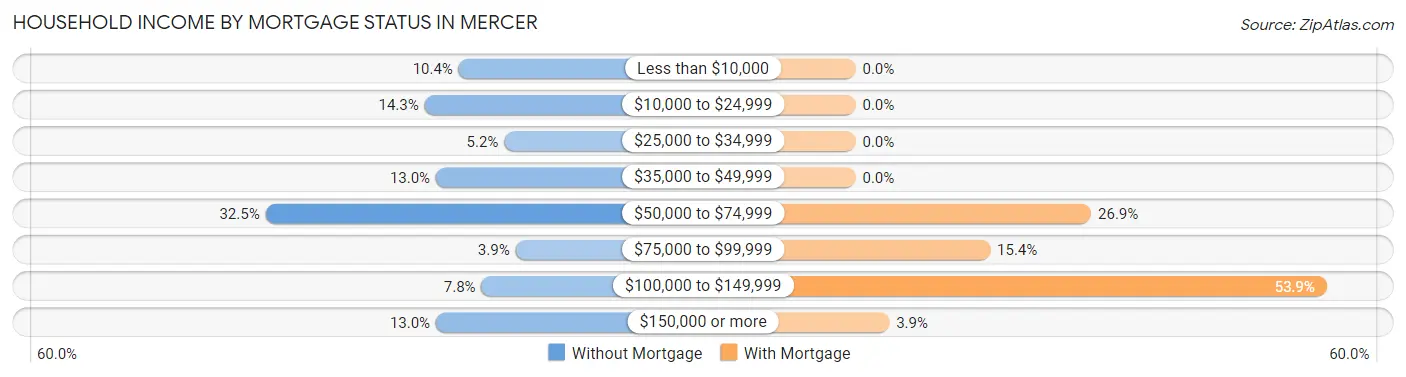
| Household Income | Without Mortgage | With Mortgage |
| Less than $10,000 | 8 (10.4%) | 0 (0.0%) |
| $10,000 to $24,999 | 11 (14.3%) | 0 (0.0%) |
| $25,000 to $34,999 | 4 (5.2%) | 0 (0.0%) |
| $35,000 to $49,999 | 10 (13.0%) | 0 (0.0%) |
| $50,000 to $74,999 | 25 (32.5%) | 7 (26.9%) |
| $75,000 to $99,999 | 3 (3.9%) | 4 (15.4%) |
| $100,000 to $149,999 | 6 (7.8%) | 14 (53.8%) |
| $150,000 or more | 10 (13.0%) | 1 (3.8%) |
| Total | 77 (100.0%) | 26 (100.0%) |
Property Value to Household Income Ratio in Mercer
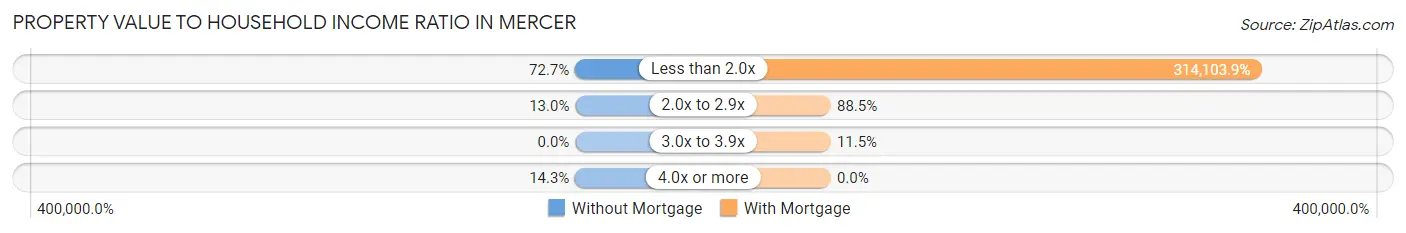
| Value-to-Income Ratio | Without Mortgage | With Mortgage |
| Less than 2.0x | 56 (72.7%) | 81,667 (314,103.9%) |
| 2.0x to 2.9x | 10 (13.0%) | 23 (88.5%) |
| 3.0x to 3.9x | 0 (0.0%) | 3 (11.5%) |
| 4.0x or more | 11 (14.3%) | 0 (0.0%) |
| Total | 77 (100.0%) | 26 (100.0%) |
Real Estate Taxes by Mortgage Status in Mercer
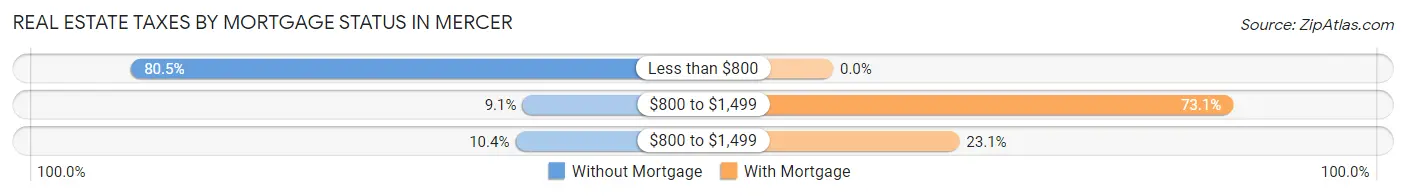
| Property Taxes | Without Mortgage | With Mortgage |
| Less than $800 | 62 (80.5%) | 0 (0.0%) |
| $800 to $1,499 | 7 (9.1%) | 19 (73.1%) |
| $800 to $1,499 | 8 (10.4%) | 6 (23.1%) |
| Total | 77 (100.0%) | 26 (100.0%) |
Health & Disability in Mercer
Health Insurance Coverage by Age in Mercer
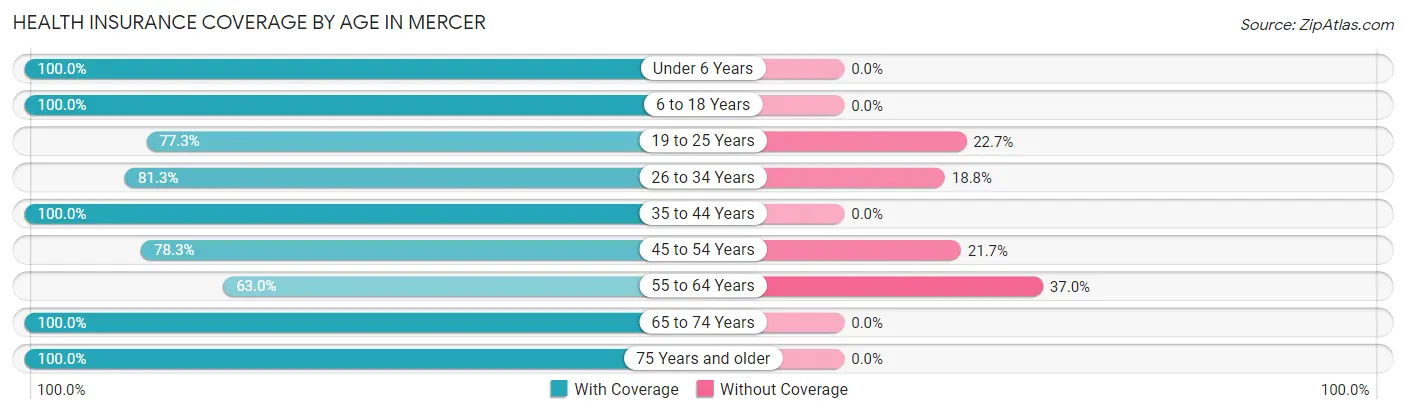
| Age Bracket | With Coverage | Without Coverage |
| Under 6 Years | 22 (100.0%) | 0 (0.0%) |
| 6 to 18 Years | 43 (100.0%) | 0 (0.0%) |
| 19 to 25 Years | 17 (77.3%) | 5 (22.7%) |
| 26 to 34 Years | 26 (81.2%) | 6 (18.8%) |
| 35 to 44 Years | 15 (100.0%) | 0 (0.0%) |
| 45 to 54 Years | 54 (78.3%) | 15 (21.7%) |
| 55 to 64 Years | 51 (63.0%) | 30 (37.0%) |
| 65 to 74 Years | 51 (100.0%) | 0 (0.0%) |
| 75 Years and older | 38 (100.0%) | 0 (0.0%) |
| Total | 317 (85.0%) | 56 (15.0%) |
Health Insurance Coverage by Citizenship Status in Mercer
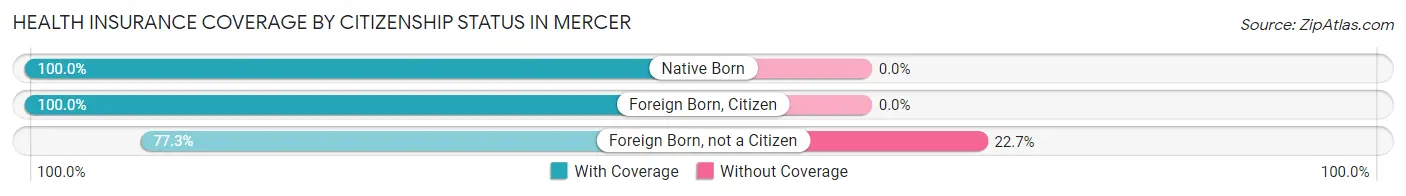
| Citizenship Status | With Coverage | Without Coverage |
| Native Born | 22 (100.0%) | 0 (0.0%) |
| Foreign Born, Citizen | 43 (100.0%) | 0 (0.0%) |
| Foreign Born, not a Citizen | 17 (77.3%) | 5 (22.7%) |
Health Insurance Coverage by Household Income in Mercer
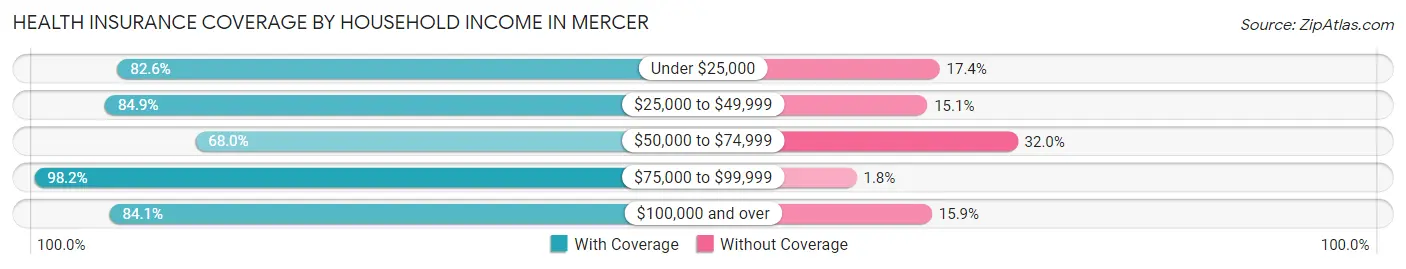
| Household Income | With Coverage | Without Coverage |
| Under $25,000 | 38 (82.6%) | 8 (17.4%) |
| $25,000 to $49,999 | 62 (84.9%) | 11 (15.1%) |
| $50,000 to $74,999 | 51 (68.0%) | 24 (32.0%) |
| $75,000 to $99,999 | 108 (98.2%) | 2 (1.8%) |
| $100,000 and over | 58 (84.1%) | 11 (15.9%) |
Public vs Private Health Insurance Coverage by Age in Mercer
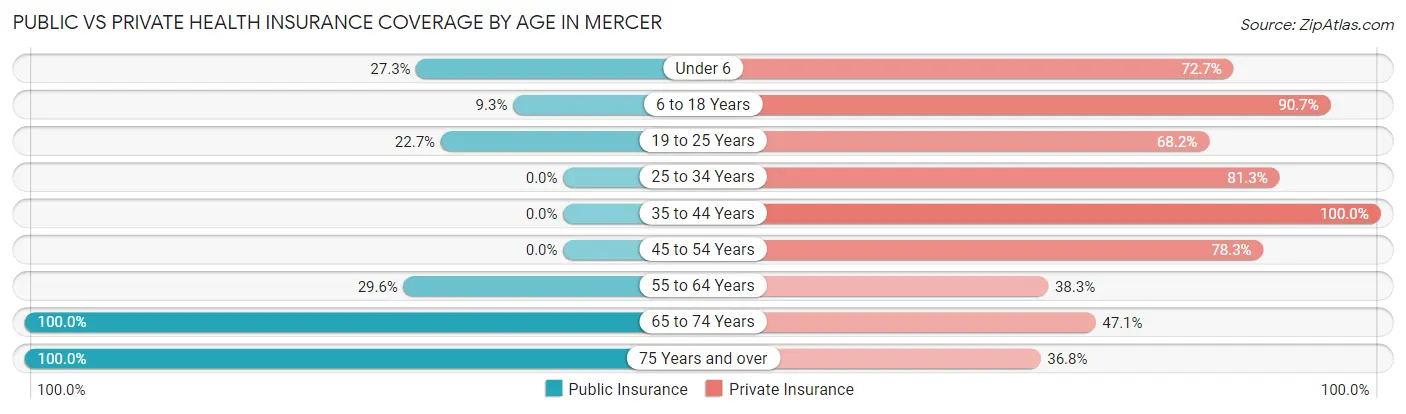
| Age Bracket | Public Insurance | Private Insurance |
| Under 6 | 6 (27.3%) | 16 (72.7%) |
| 6 to 18 Years | 4 (9.3%) | 39 (90.7%) |
| 19 to 25 Years | 5 (22.7%) | 15 (68.2%) |
| 25 to 34 Years | 0 (0.0%) | 26 (81.2%) |
| 35 to 44 Years | 0 (0.0%) | 15 (100.0%) |
| 45 to 54 Years | 0 (0.0%) | 54 (78.3%) |
| 55 to 64 Years | 24 (29.6%) | 31 (38.3%) |
| 65 to 74 Years | 51 (100.0%) | 24 (47.1%) |
| 75 Years and over | 38 (100.0%) | 14 (36.8%) |
| Total | 128 (34.3%) | 234 (62.7%) |
Disability Status by Sex by Age in Mercer
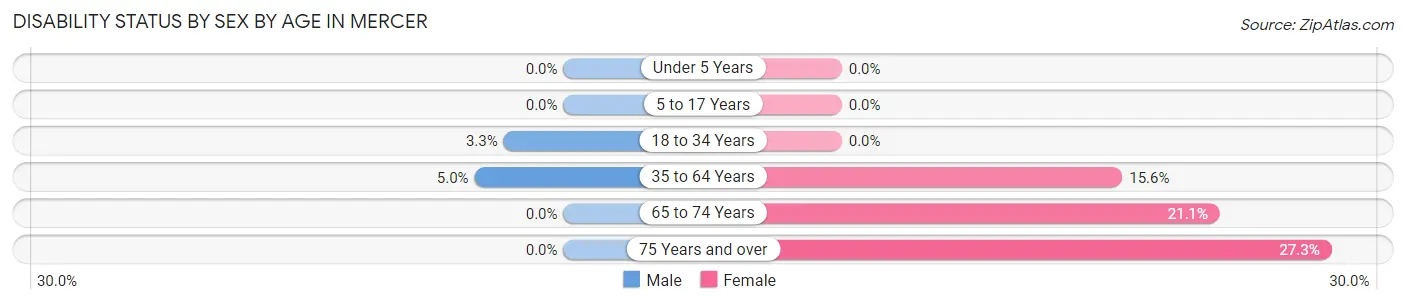
| Age Bracket | Male | Female |
| Under 5 Years | 0 (0.0%) | 0 (0.0%) |
| 5 to 17 Years | 0 (0.0%) | 0 (0.0%) |
| 18 to 34 Years | 1 (3.3%) | 0 (0.0%) |
| 35 to 64 Years | 5 (5.0%) | 10 (15.6%) |
| 65 to 74 Years | 0 (0.0%) | 4 (21.0%) |
| 75 Years and over | 0 (0.0%) | 6 (27.3%) |
Disability Class by Sex by Age in Mercer
Disability Class: Hearing Difficulty
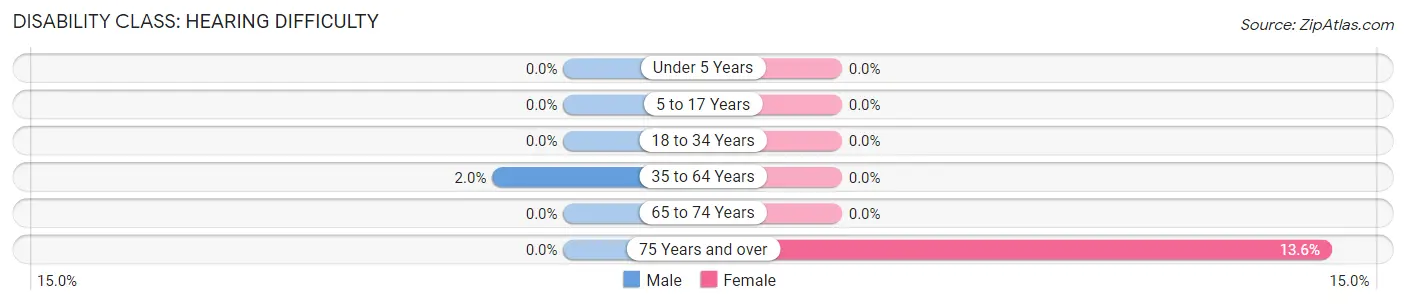
| Age Bracket | Male | Female |
| Under 5 Years | 0 (0.0%) | 0 (0.0%) |
| 5 to 17 Years | 0 (0.0%) | 0 (0.0%) |
| 18 to 34 Years | 0 (0.0%) | 0 (0.0%) |
| 35 to 64 Years | 2 (2.0%) | 0 (0.0%) |
| 65 to 74 Years | 0 (0.0%) | 0 (0.0%) |
| 75 Years and over | 0 (0.0%) | 3 (13.6%) |
Disability Class: Vision Difficulty
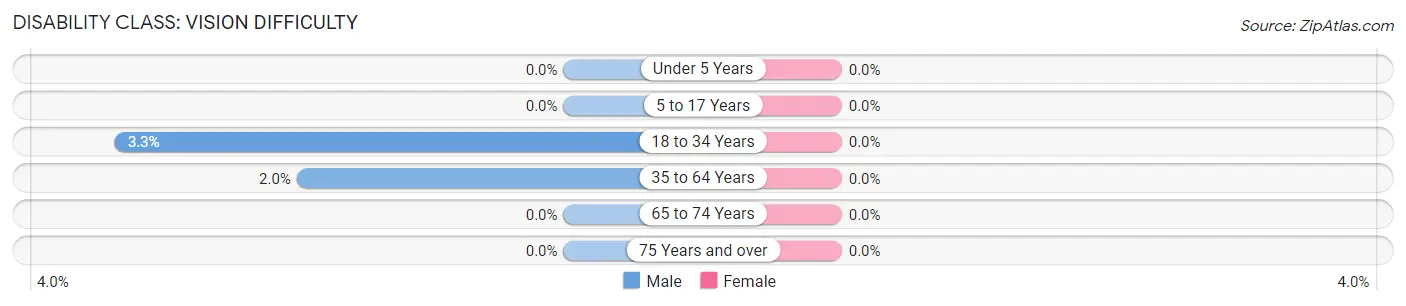
| Age Bracket | Male | Female |
| Under 5 Years | 0 (0.0%) | 0 (0.0%) |
| 5 to 17 Years | 0 (0.0%) | 0 (0.0%) |
| 18 to 34 Years | 1 (3.3%) | 0 (0.0%) |
| 35 to 64 Years | 2 (2.0%) | 0 (0.0%) |
| 65 to 74 Years | 0 (0.0%) | 0 (0.0%) |
| 75 Years and over | 0 (0.0%) | 0 (0.0%) |
Disability Class: Cognitive Difficulty
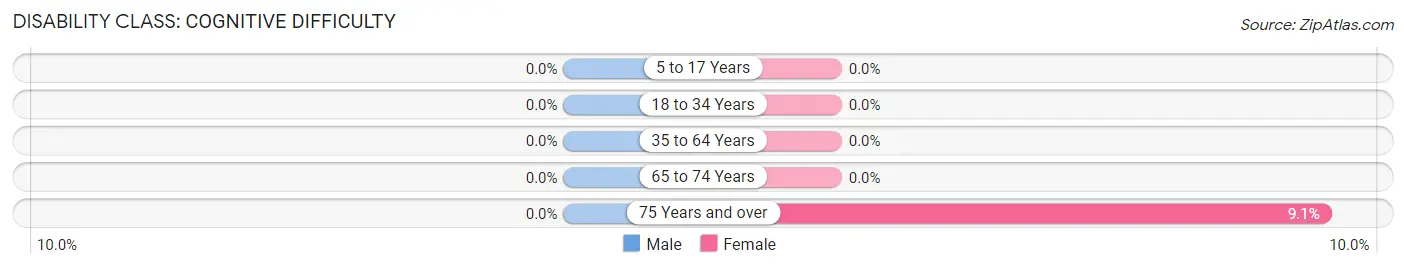
| Age Bracket | Male | Female |
| 5 to 17 Years | 0 (0.0%) | 0 (0.0%) |
| 18 to 34 Years | 0 (0.0%) | 0 (0.0%) |
| 35 to 64 Years | 0 (0.0%) | 0 (0.0%) |
| 65 to 74 Years | 0 (0.0%) | 0 (0.0%) |
| 75 Years and over | 0 (0.0%) | 2 (9.1%) |
Disability Class: Ambulatory Difficulty
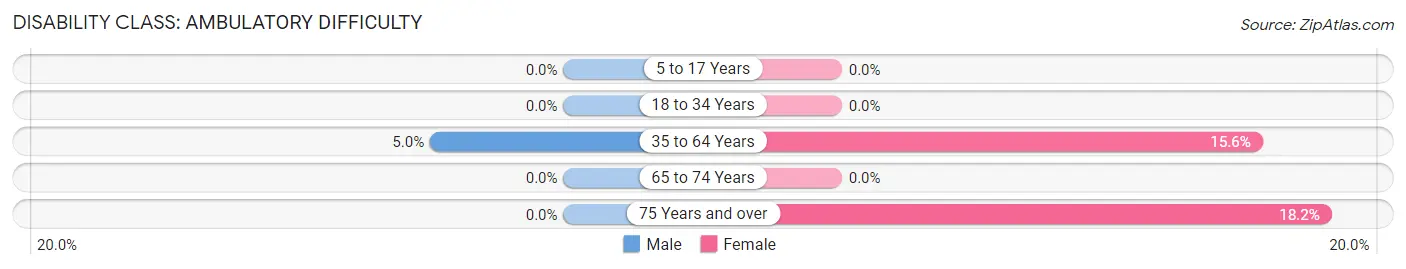
| Age Bracket | Male | Female |
| 5 to 17 Years | 0 (0.0%) | 0 (0.0%) |
| 18 to 34 Years | 0 (0.0%) | 0 (0.0%) |
| 35 to 64 Years | 5 (5.0%) | 10 (15.6%) |
| 65 to 74 Years | 0 (0.0%) | 0 (0.0%) |
| 75 Years and over | 0 (0.0%) | 4 (18.2%) |
Disability Class: Self-Care Difficulty
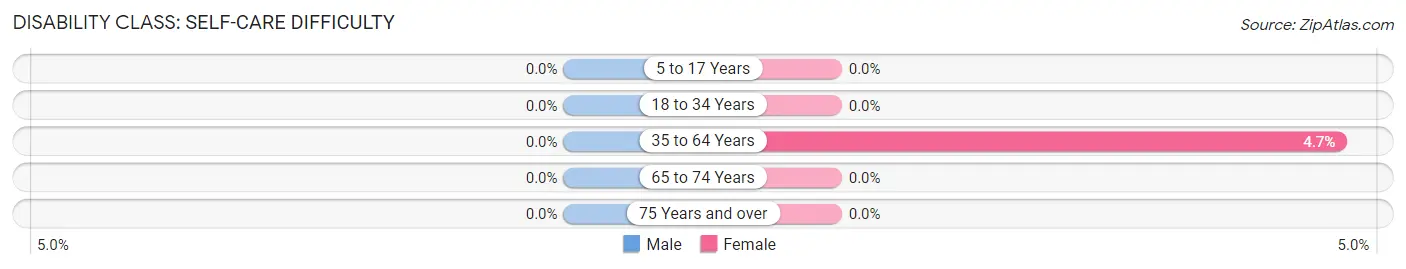
| Age Bracket | Male | Female |
| 5 to 17 Years | 0 (0.0%) | 0 (0.0%) |
| 18 to 34 Years | 0 (0.0%) | 0 (0.0%) |
| 35 to 64 Years | 0 (0.0%) | 3 (4.7%) |
| 65 to 74 Years | 0 (0.0%) | 0 (0.0%) |
| 75 Years and over | 0 (0.0%) | 0 (0.0%) |
Technology Access in Mercer
Computing Device Access in Mercer
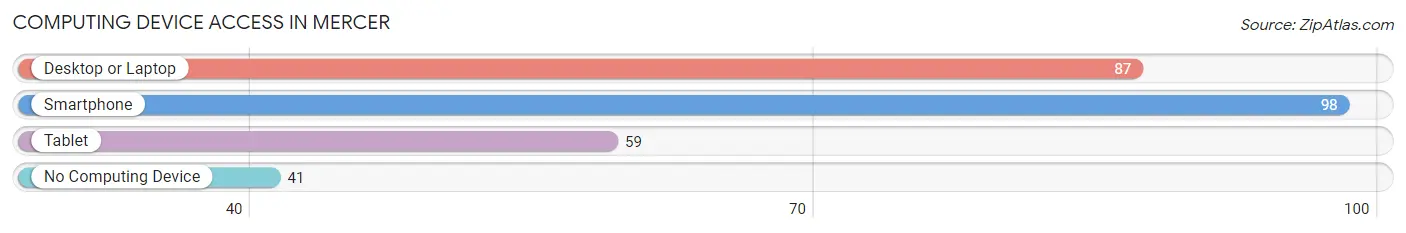
| Device Type | # Households | % Households |
| Desktop or Laptop | 87 | 53.4% |
| Smartphone | 98 | 60.1% |
| Tablet | 59 | 36.2% |
| No Computing Device | 41 | 25.2% |
| Total | 163 | 100.0% |
Internet Access in Mercer
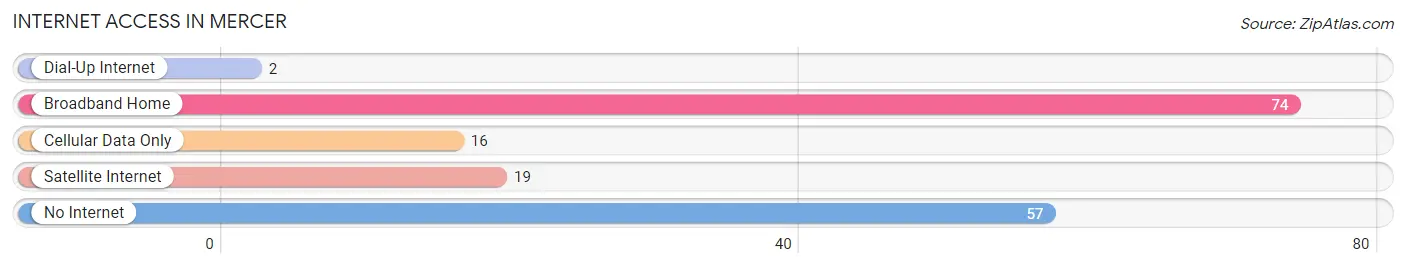
| Internet Type | # Households | % Households |
| Dial-Up Internet | 2 | 1.2% |
| Broadband Home | 74 | 45.4% |
| Cellular Data Only | 16 | 9.8% |
| Satellite Internet | 19 | 11.7% |
| No Internet | 57 | 35.0% |
| Total | 163 | 100.0% |
Mercer Summary
Mercer is a small town located in Mercer County, Missouri. It is situated in the northwest corner of the state, near the Iowa border. The town was founded in 1871 and has a population of approximately 500 people.
Geography
Mercer is located in the northwest corner of Missouri, near the Iowa border. It is situated in the rolling hills of the Ozark Plateau, and is surrounded by farmland and wooded areas. The town is located on the banks of the Chariton River, which flows through the area. The climate in Mercer is humid continental, with hot summers and cold winters.
Economy
The economy of Mercer is largely based on agriculture. The town is home to several farms, which produce a variety of crops, including corn, soybeans, wheat, and hay. The town also has a few small businesses, including a grocery store, a hardware store, and a few restaurants.
Demographics
As of the 2010 census, the population of Mercer was 498 people. The racial makeup of the town was 97.2% White, 0.2% African American, 0.2% Native American, 0.2% Asian, 0.2% from other races, and 1.8% from two or more races. The median household income was $37,500, and the median family income was $45,000.
History
Mercer was founded in 1871 by a group of settlers from Iowa. The town was named after William Mercer, a prominent local businessman. The town grew slowly, and by the early 1900s, it had a population of around 500 people.
In the early 1900s, Mercer was a thriving agricultural community. The town had several grain elevators, a flour mill, and a creamery. The town also had a few small businesses, including a grocery store, a hardware store, and a few restaurants.
In the 1950s, the town began to decline. Many of the businesses closed, and the population began to decline. By the 1970s, the population had dropped to around 300 people.
In recent years, Mercer has seen a resurgence. The town has seen an influx of new businesses, including a winery, a brewery, and a distillery. The population has also grown, and as of the 2010 census, it was 498 people.
Mercer is a small town with a rich history and a bright future. It is a great place to live, work, and raise a family. The town has a strong sense of community, and its residents are proud of their heritage.
Common Questions
What is Per Capita Income in Mercer?
Per Capita income in Mercer is $32,458.
What is the Median Family Income in Mercer?
Median Family Income in Mercer is $56,563.
What is the Median Household income in Mercer?
Median Household Income in Mercer is $45,625.
What is Inequality or Gini Index in Mercer?
Inequality or Gini Index in Mercer is 0.55.
What is the Total Population of Mercer?
Total Population of Mercer is 380.
What is the Total Male Population of Mercer?
Total Male Population of Mercer is 219.
What is the Total Female Population of Mercer?
Total Female Population of Mercer is 161.
What is the Ratio of Males per 100 Females in Mercer?
There are 136.02 Males per 100 Females in Mercer.
What is the Ratio of Females per 100 Males in Mercer?
There are 73.52 Females per 100 Males in Mercer.
What is the Median Population Age in Mercer?
Median Population Age in Mercer is 50.9 Years.
What is the Average Family Size in Mercer
Average Family Size in Mercer is 3.2 People.
What is the Average Household Size in Mercer
Average Household Size in Mercer is 2.3 People.
How Large is the Labor Force in Mercer?
There are 228 People in the Labor Forcein in Mercer.
What is the Percentage of People in the Labor Force in Mercer?
72.4% of People are in the Labor Force in Mercer.
What is the Unemployment Rate in Mercer?
Unemployment Rate in Mercer is 0.9%.