Tuscumbia, MO Map & Demographics
Tuscumbia Map
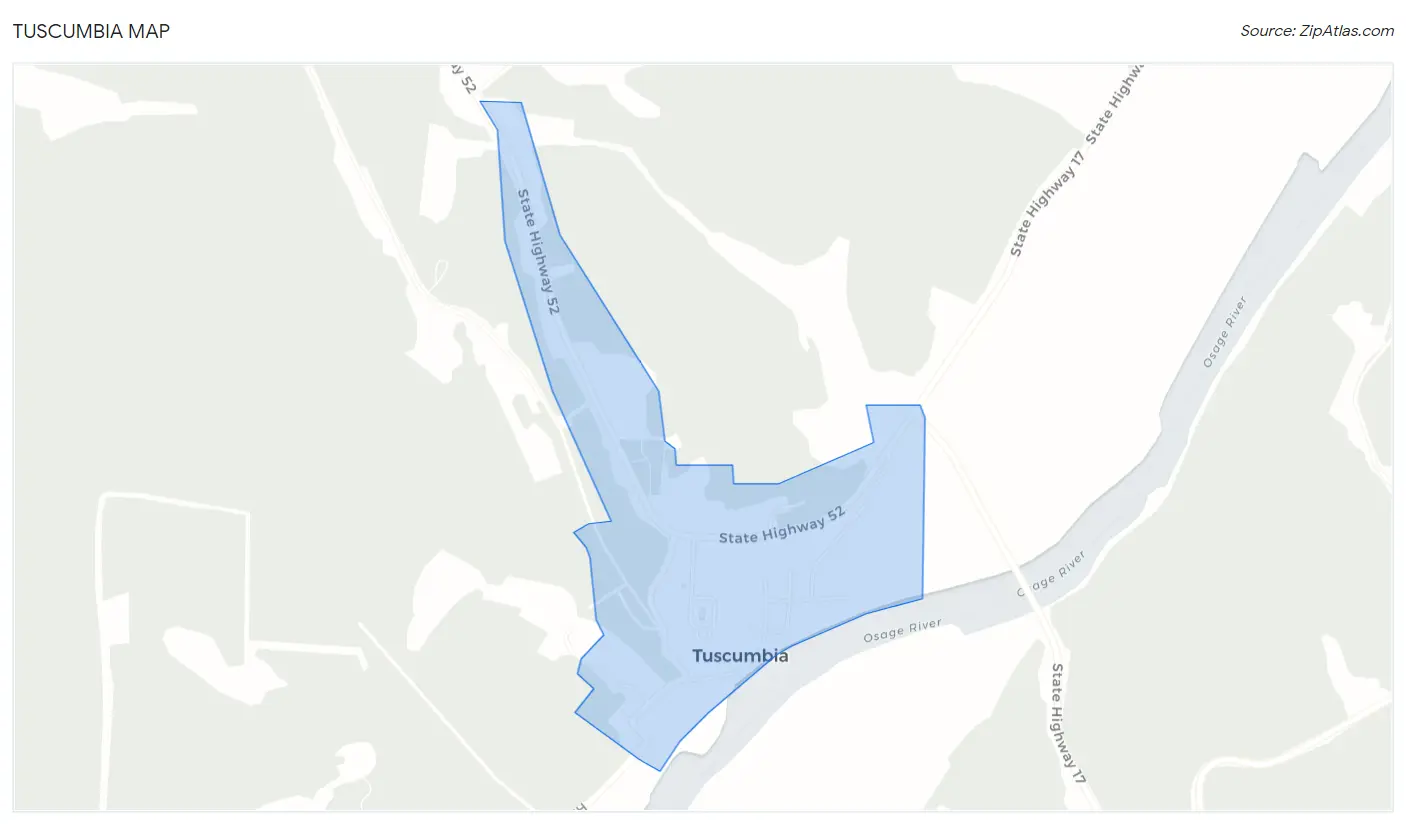
Tuscumbia Overview
$24,486
PER CAPITA INCOME
$66,250
AVG FAMILY INCOME
$44,375
AVG HOUSEHOLD INCOME
0.40
INEQUALITY / GINI INDEX
148
TOTAL POPULATION
88
MALE POPULATION
60
FEMALE POPULATION
146.67
MALES / 100 FEMALES
68.18
FEMALES / 100 MALES
40.4
MEDIAN AGE
3.0
AVG FAMILY SIZE
2.5
AVG HOUSEHOLD SIZE
56
LABOR FORCE [ PEOPLE ]
42.7%
PERCENT IN LABOR FORCE
5.4%
UNEMPLOYMENT RATE
Tuscumbia Zip Codes
Tuscumbia Area Codes
Income in Tuscumbia
Income Overview in Tuscumbia
Per Capita Income in Tuscumbia is $24,486, while median incomes of families and households are $66,250 and $44,375 respectively.
| Characteristic | Number | Measure |
| Per Capita Income | 148 | $24,486 |
| Median Family Income | 25 | $66,250 |
| Mean Family Income | 25 | $78,792 |
| Median Household Income | 37 | $44,375 |
| Mean Household Income | 37 | $74,203 |
| Income Deficit | 25 | $0 |
| Wage / Income Gap (%) | 148 | 0.00% |
| Wage / Income Gap ($) | 148 | 100.00¢ per $1 |
| Gini / Inequality Index | 148 | 0.40 |
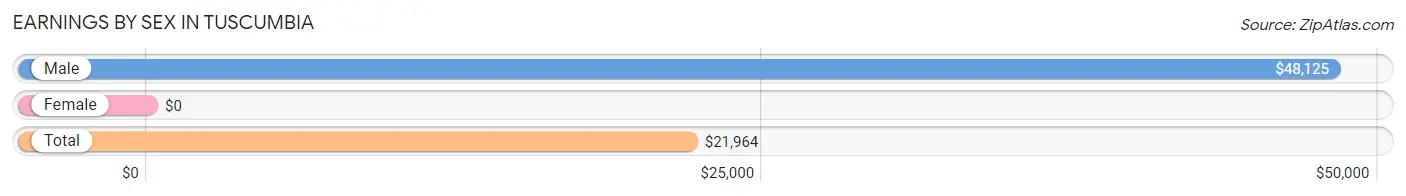
Earnings by Sex in Tuscumbia
| Sex | Number | Average Earnings |
| Male | 31 (42.5%) | $48,125 |
| Female | 42 (57.5%) | $0 |
| Total | 73 (100.0%) | $21,964 |
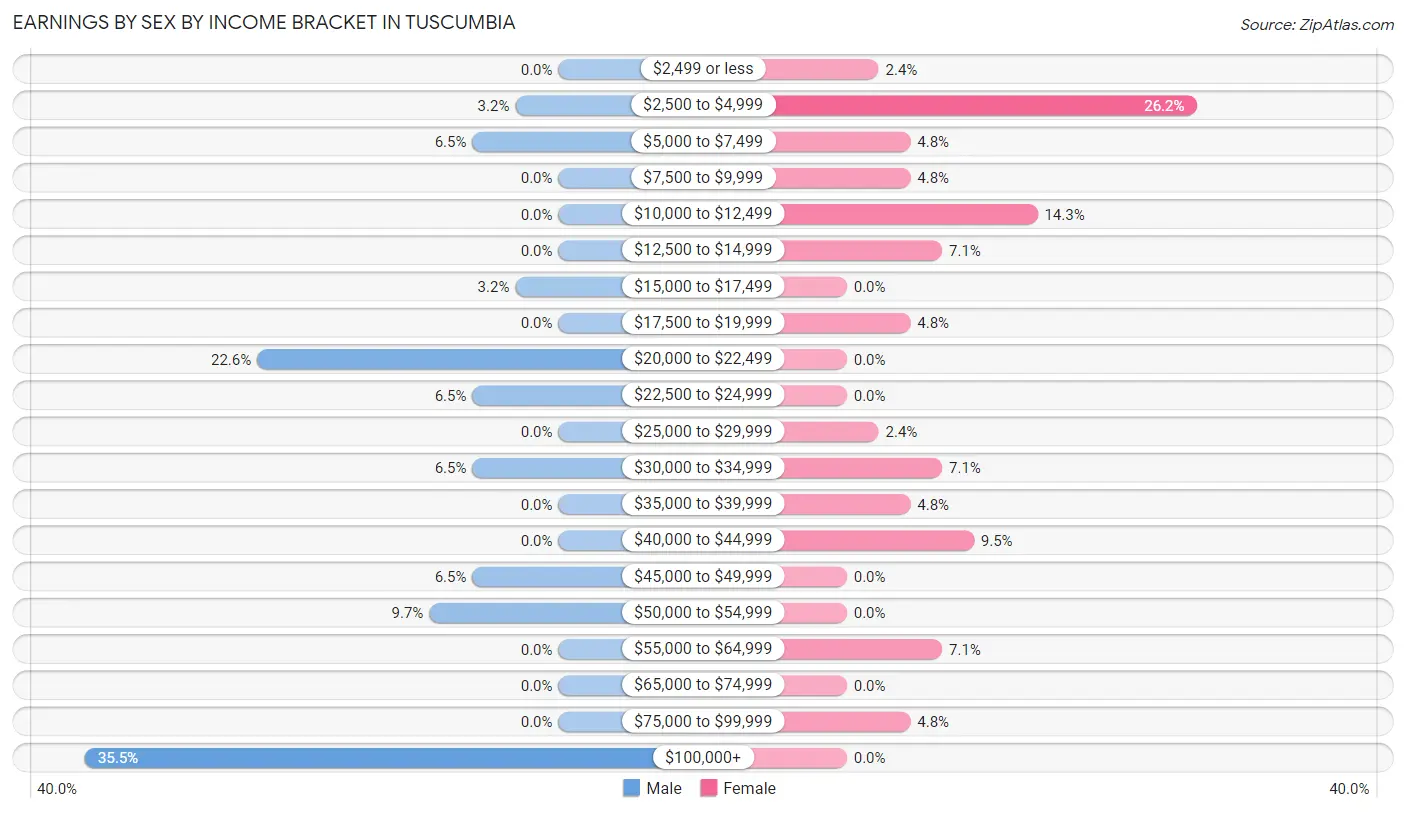
Earnings by Sex by Income Bracket in Tuscumbia
The most common earnings brackets in Tuscumbia are $100,000+ for men (11 | 35.5%) and $2,500 to $4,999 for women (11 | 26.2%).
| Income | Male | Female |
| $2,499 or less | 0 (0.0%) | 1 (2.4%) |
| $2,500 to $4,999 | 1 (3.2%) | 11 (26.2%) |
| $5,000 to $7,499 | 2 (6.5%) | 2 (4.8%) |
| $7,500 to $9,999 | 0 (0.0%) | 2 (4.8%) |
| $10,000 to $12,499 | 0 (0.0%) | 6 (14.3%) |
| $12,500 to $14,999 | 0 (0.0%) | 3 (7.1%) |
| $15,000 to $17,499 | 1 (3.2%) | 0 (0.0%) |
| $17,500 to $19,999 | 0 (0.0%) | 2 (4.8%) |
| $20,000 to $22,499 | 7 (22.6%) | 0 (0.0%) |
| $22,500 to $24,999 | 2 (6.5%) | 0 (0.0%) |
| $25,000 to $29,999 | 0 (0.0%) | 1 (2.4%) |
| $30,000 to $34,999 | 2 (6.5%) | 3 (7.1%) |
| $35,000 to $39,999 | 0 (0.0%) | 2 (4.8%) |
| $40,000 to $44,999 | 0 (0.0%) | 4 (9.5%) |
| $45,000 to $49,999 | 2 (6.5%) | 0 (0.0%) |
| $50,000 to $54,999 | 3 (9.7%) | 0 (0.0%) |
| $55,000 to $64,999 | 0 (0.0%) | 3 (7.1%) |
| $65,000 to $74,999 | 0 (0.0%) | 0 (0.0%) |
| $75,000 to $99,999 | 0 (0.0%) | 2 (4.8%) |
| $100,000+ | 11 (35.5%) | 0 (0.0%) |
| Total | 31 (100.0%) | 42 (100.0%) |
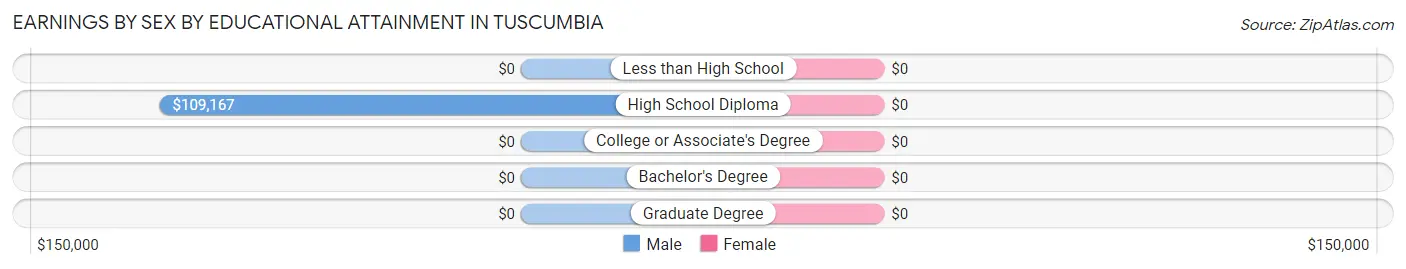
Earnings by Sex by Educational Attainment in Tuscumbia
| Educational Attainment | Male Income | Female Income |
| Less than High School | - | - |
| High School Diploma | $109,167 | $0 |
| College or Associate's Degree | - | - |
| Bachelor's Degree | - | - |
| Graduate Degree | - | - |
| Total | $49,375 | $30,000 |
Family Income in Tuscumbia
Family Income Brackets in Tuscumbia
According to the Tuscumbia family income data, there are 7 families falling into the $25,000 to $34,999 income range, which is the most common income bracket and makes up 28.0% of all families.
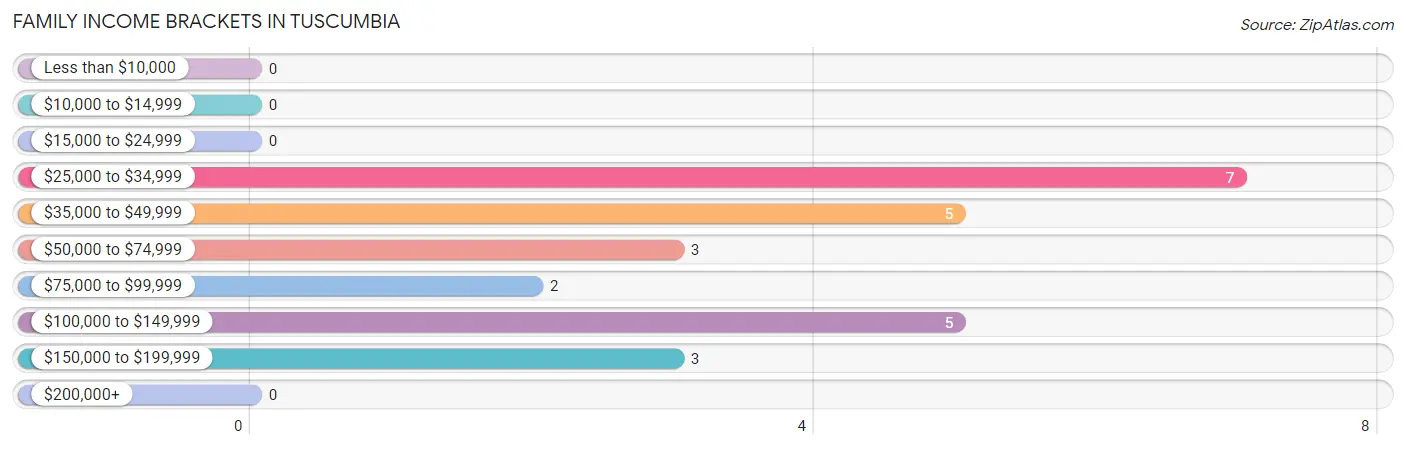
| Income Bracket | # Families | % Families |
| Less than $10,000 | 0 | 0.0% |
| $10,000 to $14,999 | 0 | 0.0% |
| $15,000 to $24,999 | 0 | 0.0% |
| $25,000 to $34,999 | 7 | 28.0% |
| $35,000 to $49,999 | 5 | 20.0% |
| $50,000 to $74,999 | 3 | 12.0% |
| $75,000 to $99,999 | 2 | 8.0% |
| $100,000 to $149,999 | 5 | 20.0% |
| $150,000 to $199,999 | 3 | 12.0% |
| $200,000+ | 0 | 0.0% |
Family Income by Famaliy Size in Tuscumbia
2-person families (15 | 60.0%) account for the highest median family income in Tuscumbia with $36,875 per family, while 2-person families (15 | 60.0%) have the highest median income of $18,438 per family member.
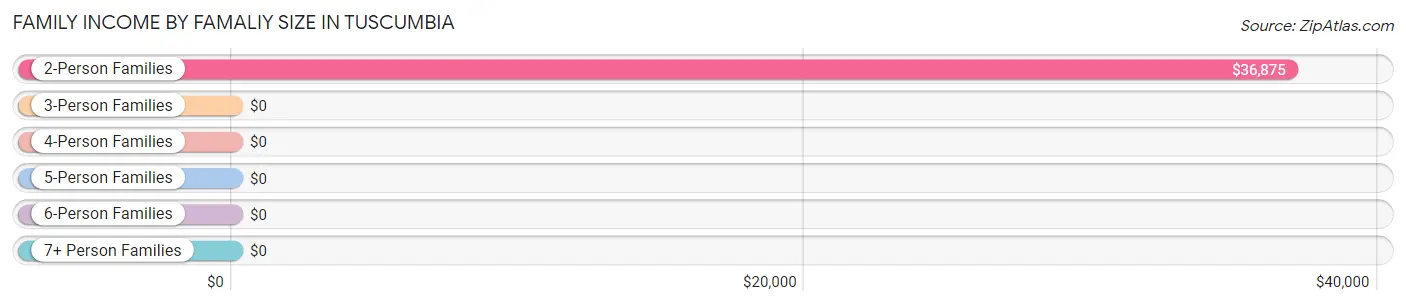
| Income Bracket | # Families | Median Income |
| 2-Person Families | 15 (60.0%) | $36,875 |
| 3-Person Families | 5 (20.0%) | $0 |
| 4-Person Families | 2 (8.0%) | $0 |
| 5-Person Families | 3 (12.0%) | $0 |
| 6-Person Families | 0 (0.0%) | $0 |
| 7+ Person Families | 0 (0.0%) | $0 |
| Total | 25 (100.0%) | $66,250 |
Family Income by Number of Earners in Tuscumbia
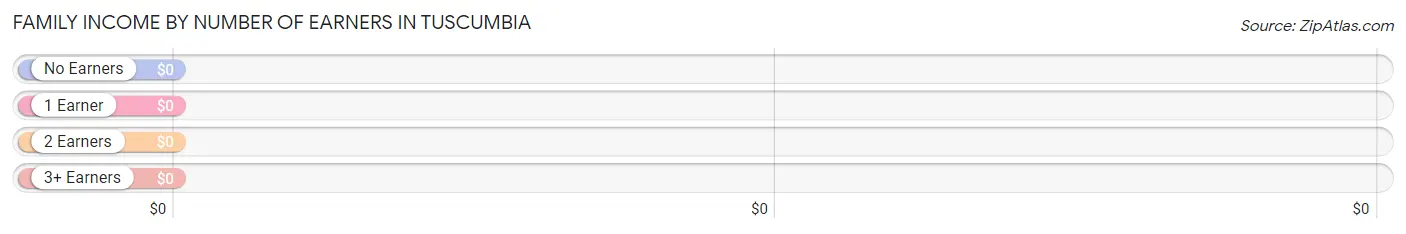
| Number of Earners | # Families | Median Income |
| No Earners | 3 (12.0%) | $0 |
| 1 Earner | 2 (8.0%) | $0 |
| 2 Earners | 19 (76.0%) | $0 |
| 3+ Earners | 1 (4.0%) | $0 |
| Total | 25 (100.0%) | $66,250 |
Household Income in Tuscumbia
Household Income Brackets in Tuscumbia
With 10 households falling in the category, the $35,000 to $49,999 income range is the most frequent in Tuscumbia, accounting for 27.0% of all households.
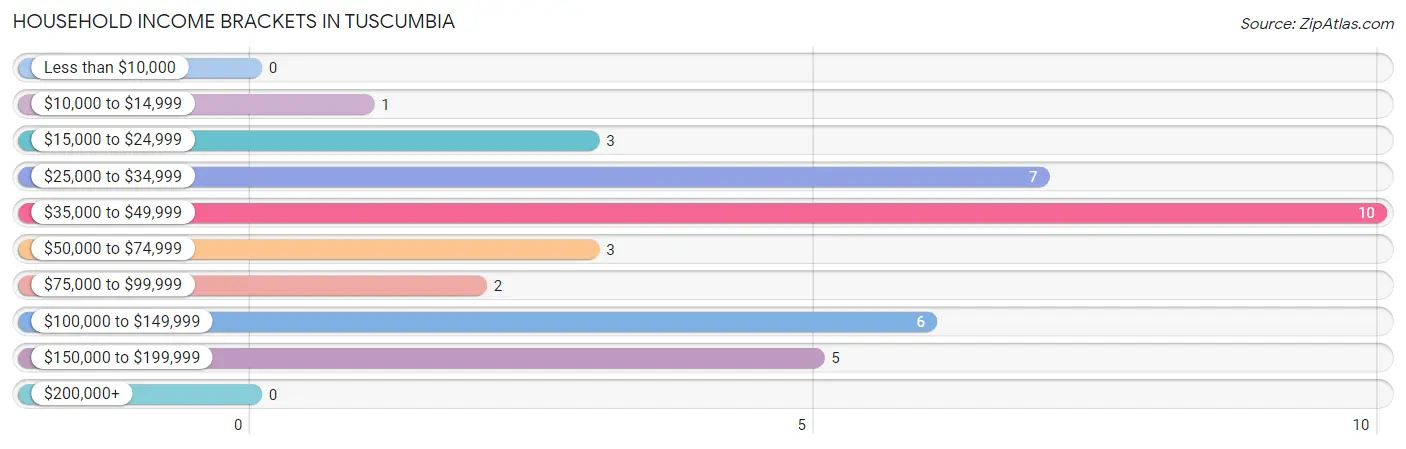
| Income Bracket | # Households | % Households |
| Less than $10,000 | 0 | 0.0% |
| $10,000 to $14,999 | 1 | 2.7% |
| $15,000 to $24,999 | 3 | 8.1% |
| $25,000 to $34,999 | 7 | 18.9% |
| $35,000 to $49,999 | 10 | 27.0% |
| $50,000 to $74,999 | 3 | 8.1% |
| $75,000 to $99,999 | 2 | 5.4% |
| $100,000 to $149,999 | 6 | 16.2% |
| $150,000 to $199,999 | 5 | 13.5% |
| $200,000+ | 0 | 0.0% |
Household Income by Householder Age in Tuscumbia
The median household income in Tuscumbia is $44,375, with the highest median household income of $35,750 found in the 65+ years age bracket for the primary householder. A total of 19 households (51.3%) fall into this category.
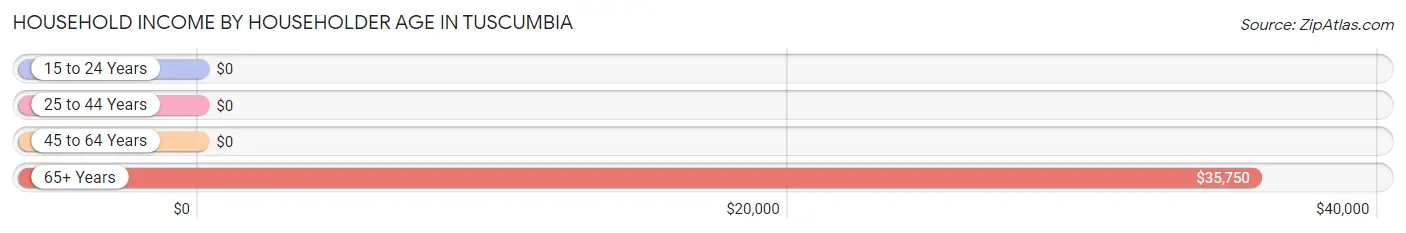
| Income Bracket | # Households | Median Income |
| 15 to 24 Years | 0 (0.0%) | $0 |
| 25 to 44 Years | 5 (13.5%) | $0 |
| 45 to 64 Years | 13 (35.1%) | $0 |
| 65+ Years | 19 (51.3%) | $35,750 |
| Total | 37 (100.0%) | $44,375 |
Poverty in Tuscumbia
Income Below Poverty by Sex and Age in Tuscumbia
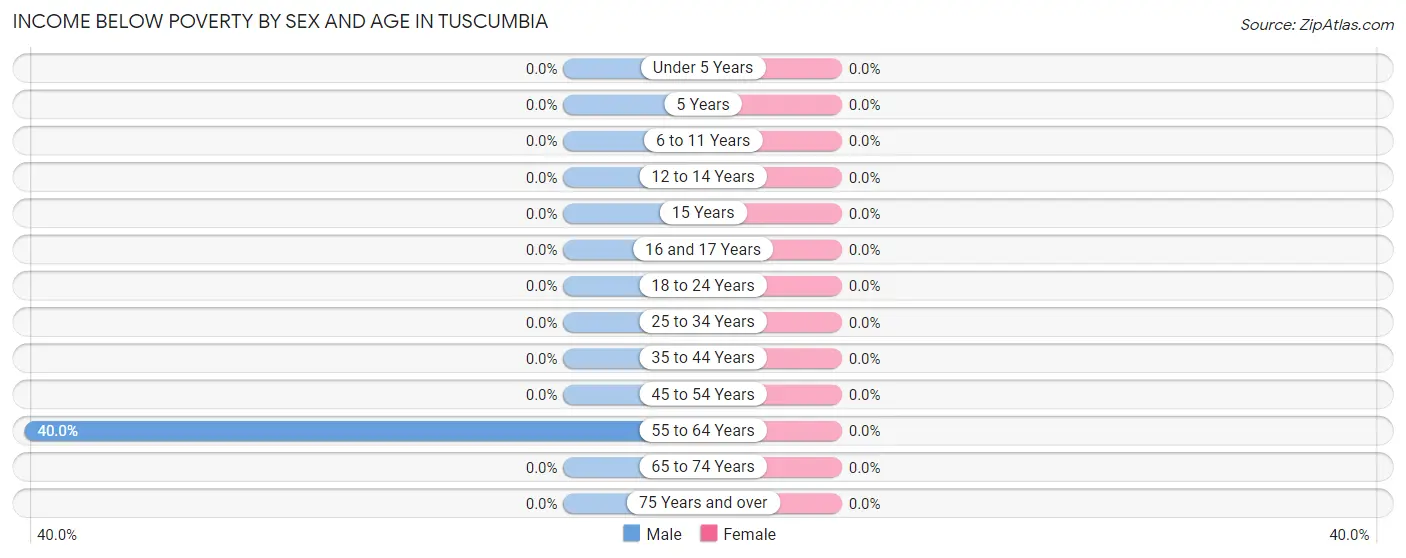
| Age Bracket | Male | Female |
| Under 5 Years | 0 (0.0%) | 0 (0.0%) |
| 5 Years | 0 (0.0%) | 0 (0.0%) |
| 6 to 11 Years | 0 (0.0%) | 0 (0.0%) |
| 12 to 14 Years | 0 (0.0%) | 0 (0.0%) |
| 15 Years | 0 (0.0%) | 0 (0.0%) |
| 16 and 17 Years | 0 (0.0%) | 0 (0.0%) |
| 18 to 24 Years | 0 (0.0%) | 0 (0.0%) |
| 25 to 34 Years | 0 (0.0%) | 0 (0.0%) |
| 35 to 44 Years | 0 (0.0%) | 0 (0.0%) |
| 45 to 54 Years | 0 (0.0%) | 0 (0.0%) |
| 55 to 64 Years | 2 (40.0%) | 0 (0.0%) |
| 65 to 74 Years | 0 (0.0%) | 0 (0.0%) |
| 75 Years and over | 0 (0.0%) | 0 (0.0%) |
| Total | 2 (6.2%) | 0 (0.0%) |
Income Above Poverty by Sex and Age in Tuscumbia
According to the poverty statistics in Tuscumbia, males aged 12 to 14 years and females aged under 5 years are the age groups that are most secure financially, with 100.0% of males and 100.0% of females in these age groups living above the poverty line.
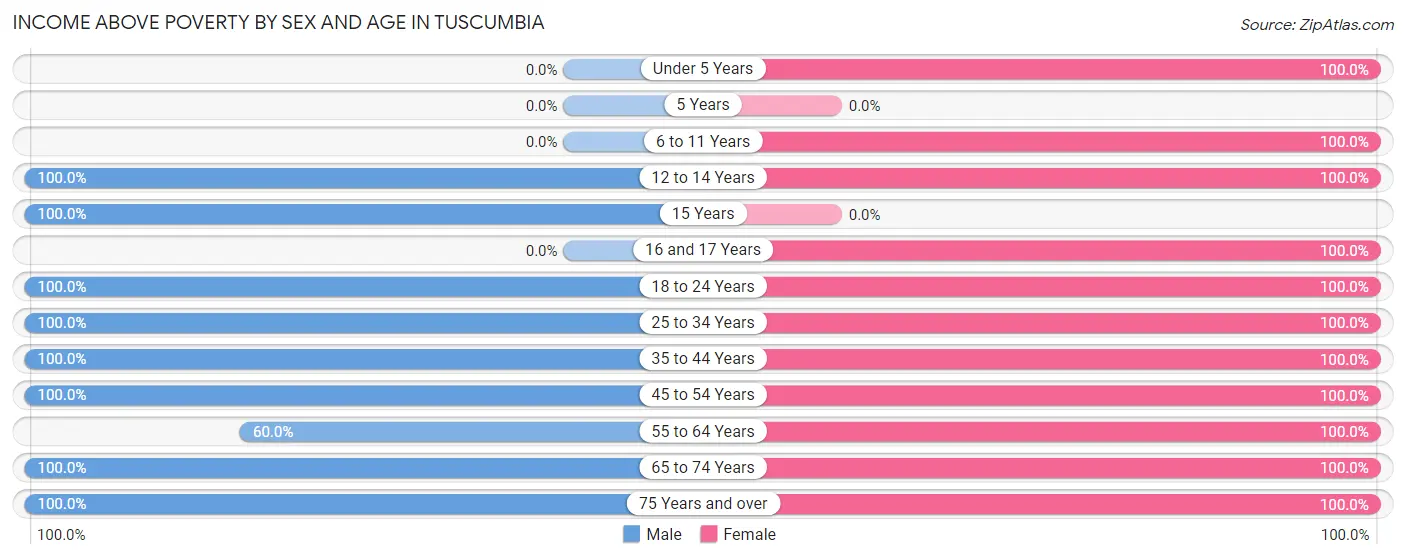
| Age Bracket | Male | Female |
| Under 5 Years | 0 (0.0%) | 4 (100.0%) |
| 5 Years | 0 (0.0%) | 0 (0.0%) |
| 6 to 11 Years | 0 (0.0%) | 1 (100.0%) |
| 12 to 14 Years | 2 (100.0%) | 8 (100.0%) |
| 15 Years | 2 (100.0%) | 0 (0.0%) |
| 16 and 17 Years | 0 (0.0%) | 11 (100.0%) |
| 18 to 24 Years | 2 (100.0%) | 3 (100.0%) |
| 25 to 34 Years | 3 (100.0%) | 2 (100.0%) |
| 35 to 44 Years | 3 (100.0%) | 2 (100.0%) |
| 45 to 54 Years | 7 (100.0%) | 8 (100.0%) |
| 55 to 64 Years | 3 (60.0%) | 6 (100.0%) |
| 65 to 74 Years | 7 (100.0%) | 14 (100.0%) |
| 75 Years and over | 1 (100.0%) | 1 (100.0%) |
| Total | 30 (93.8%) | 60 (100.0%) |
Income Below Poverty Among Married-Couple Families in Tuscumbia
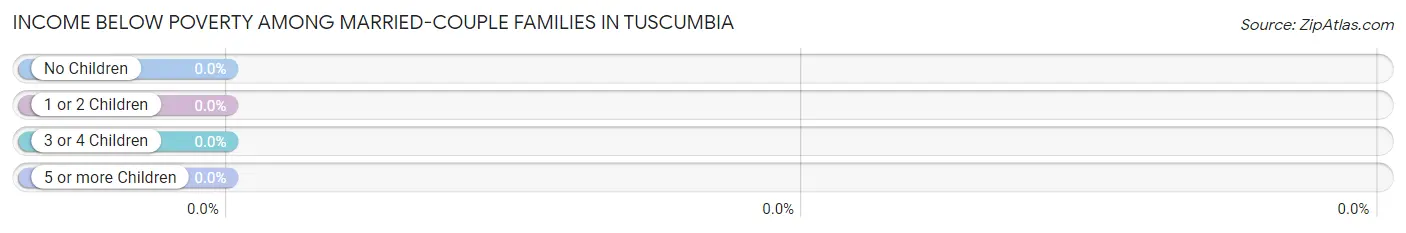
| Children | Above Poverty | Below Poverty |
| No Children | 8 (100.0%) | 0 (0.0%) |
| 1 or 2 Children | 4 (100.0%) | 0 (0.0%) |
| 3 or 4 Children | 0 (0.0%) | 0 (0.0%) |
| 5 or more Children | 0 (0.0%) | 0 (0.0%) |
| Total | 12 (100.0%) | 0 (0.0%) |
Income Below Poverty Among Single-Parent Households in Tuscumbia
| Children | Single Father | Single Mother |
| No Children | 0 (0.0%) | 0 (0.0%) |
| 1 or 2 Children | 0 (0.0%) | 0 (0.0%) |
| 3 or 4 Children | 0 (0.0%) | 0 (0.0%) |
| 5 or more Children | 0 (0.0%) | 0 (0.0%) |
| Total | 0 (0.0%) | 0 (0.0%) |
Income Below Poverty Among Married-Couple vs Single-Parent Households in Tuscumbia
| Children | Married-Couple Families | Single-Parent Households |
| No Children | 0 (0.0%) | 0 (0.0%) |
| 1 or 2 Children | 0 (0.0%) | 0 (0.0%) |
| 3 or 4 Children | 0 (0.0%) | 0 (0.0%) |
| 5 or more Children | 0 (0.0%) | 0 (0.0%) |
| Total | 0 (0.0%) | 0 (0.0%) |
Race in Tuscumbia
The most populous races in Tuscumbia are White / Caucasian (112 | 75.7%), Black / African American (32 | 21.6%), and Hispanic or Latino (6 | 4.1%).
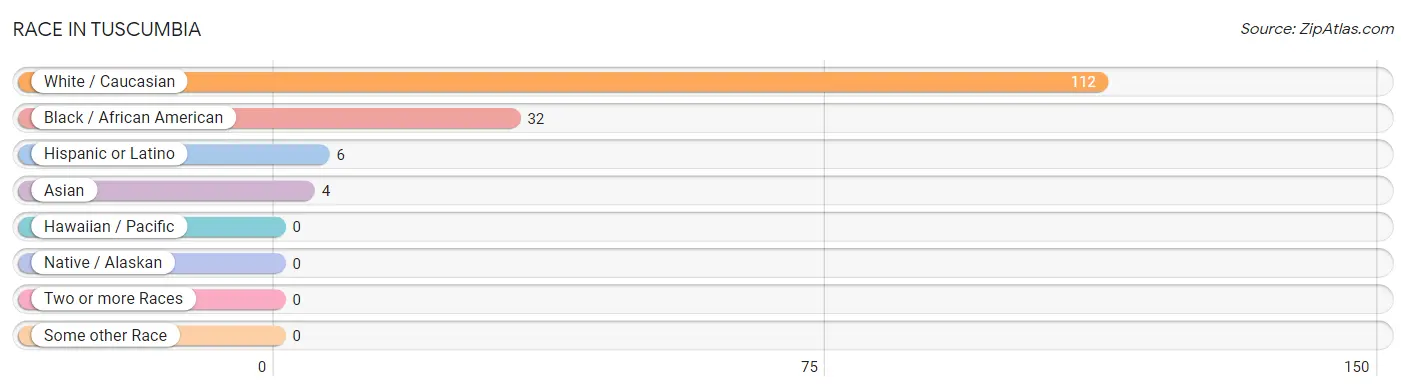
| Race | # Population | % Population |
| Asian | 4 | 2.7% |
| Black / African American | 32 | 21.6% |
| Hawaiian / Pacific | 0 | 0.0% |
| Hispanic or Latino | 6 | 4.1% |
| Native / Alaskan | 0 | 0.0% |
| White / Caucasian | 112 | 75.7% |
| Two or more Races | 0 | 0.0% |
| Some other Race | 0 | 0.0% |
| Total | 148 | 100.0% |
Ancestry in Tuscumbia
The most populous ancestries reported in Tuscumbia are German (17 | 11.5%), English (15 | 10.1%), American (12 | 8.1%), Irish (12 | 8.1%), and Mexican (6 | 4.1%), together accounting for 41.9% of all Tuscumbia residents.
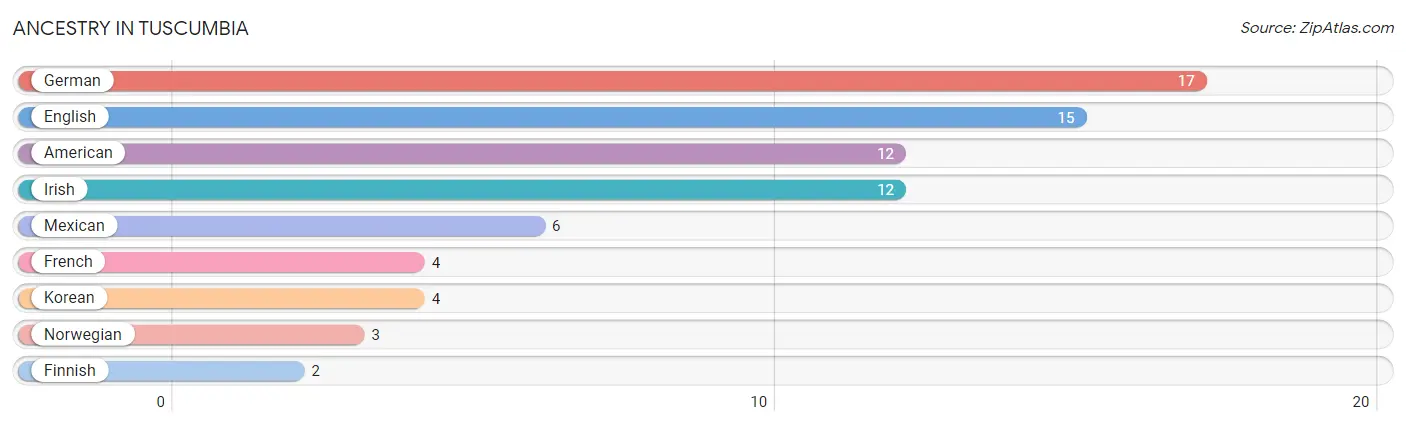
| Ancestry | # Population | % Population |
| American | 12 | 8.1% |
| English | 15 | 10.1% |
| Finnish | 2 | 1.3% |
| French | 4 | 2.7% |
| German | 17 | 11.5% |
| Irish | 12 | 8.1% |
| Korean | 4 | 2.7% |
| Mexican | 6 | 4.1% |
| Norwegian | 3 | 2.0% | View All 9 Rows |
Immigrants in Tuscumbia
The most numerous immigrant groups reported in Tuscumbia came from Asia (2 | 1.3%), Philippines (2 | 1.3%), and South Eastern Asia (2 | 1.3%), together accounting for 4.1% of all Tuscumbia residents.
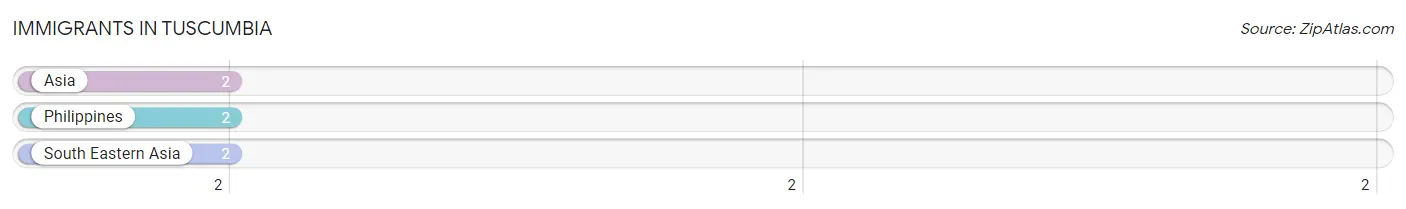
| Immigration Origin | # Population | % Population |
| Asia | 2 | 1.3% |
| Philippines | 2 | 1.3% |
| South Eastern Asia | 2 | 1.3% | View All 3 Rows |
Sex and Age in Tuscumbia
Sex and Age in Tuscumbia
The most populous age groups in Tuscumbia are 40 to 44 Years (16 | 18.2%) for men and 15 to 19 Years (14 | 23.3%) for women.
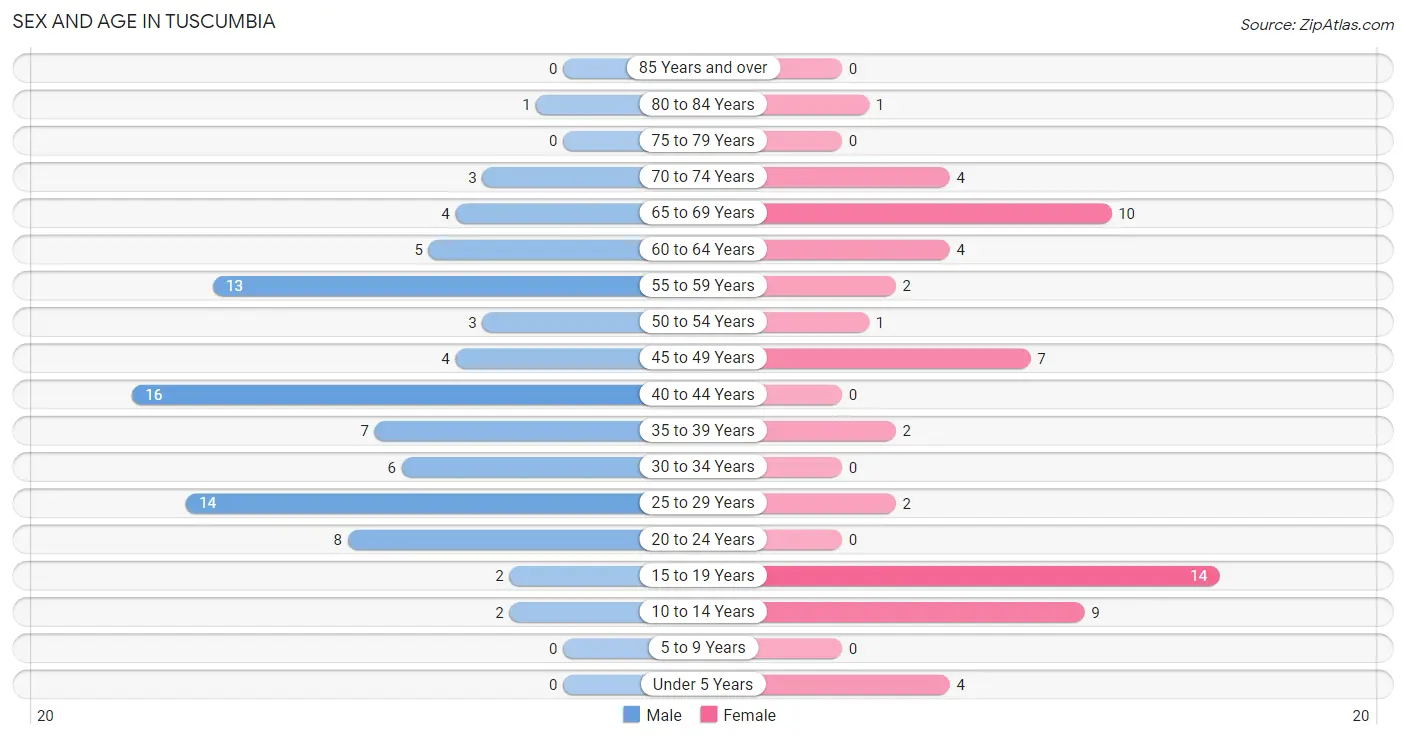
| Age Bracket | Male | Female |
| Under 5 Years | 0 (0.0%) | 4 (6.7%) |
| 5 to 9 Years | 0 (0.0%) | 0 (0.0%) |
| 10 to 14 Years | 2 (2.3%) | 9 (15.0%) |
| 15 to 19 Years | 2 (2.3%) | 14 (23.3%) |
| 20 to 24 Years | 8 (9.1%) | 0 (0.0%) |
| 25 to 29 Years | 14 (15.9%) | 2 (3.3%) |
| 30 to 34 Years | 6 (6.8%) | 0 (0.0%) |
| 35 to 39 Years | 7 (8.0%) | 2 (3.3%) |
| 40 to 44 Years | 16 (18.2%) | 0 (0.0%) |
| 45 to 49 Years | 4 (4.5%) | 7 (11.7%) |
| 50 to 54 Years | 3 (3.4%) | 1 (1.7%) |
| 55 to 59 Years | 13 (14.8%) | 2 (3.3%) |
| 60 to 64 Years | 5 (5.7%) | 4 (6.7%) |
| 65 to 69 Years | 4 (4.5%) | 10 (16.7%) |
| 70 to 74 Years | 3 (3.4%) | 4 (6.7%) |
| 75 to 79 Years | 0 (0.0%) | 0 (0.0%) |
| 80 to 84 Years | 1 (1.1%) | 1 (1.7%) |
| 85 Years and over | 0 (0.0%) | 0 (0.0%) |
| Total | 88 (100.0%) | 60 (100.0%) |
Families and Households in Tuscumbia
Median Family Size in Tuscumbia
The median family size in Tuscumbia is 3.00 persons per family, with married-couple families (12 | 48.0%) accounting for the largest median family size of 3 persons per family. On the other hand, married-couple families (12 | 48.0%) represent the smallest median family size with 3.00 persons per family.
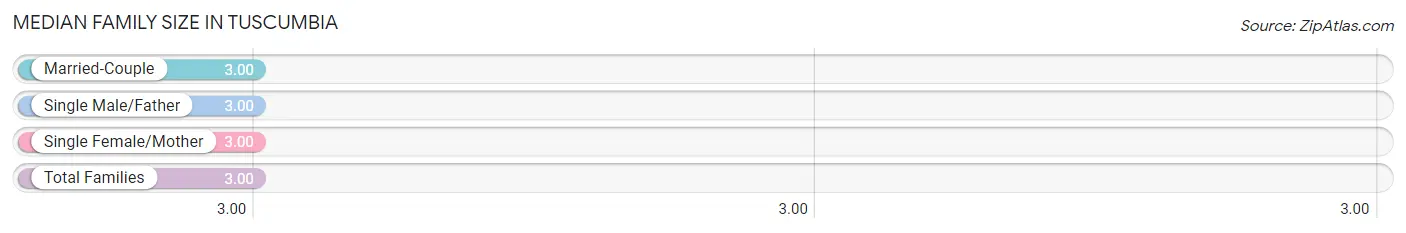
| Family Type | # Families | Family Size |
| Married-Couple | 12 (48.0%) | 3.00 |
| Single Male/Father | 2 (8.0%) | 3.00 |
| Single Female/Mother | 11 (44.0%) | 3.00 |
| Total Families | 25 (100.0%) | 3.00 |
Median Household Size in Tuscumbia
The median household size in Tuscumbia is 2.49 persons per household, with single male/father households (2 | 5.4%) accounting for the largest median household size of 4 persons per household. non-family households (12 | 32.4%) represent the smallest median household size with 1.25 persons per household.
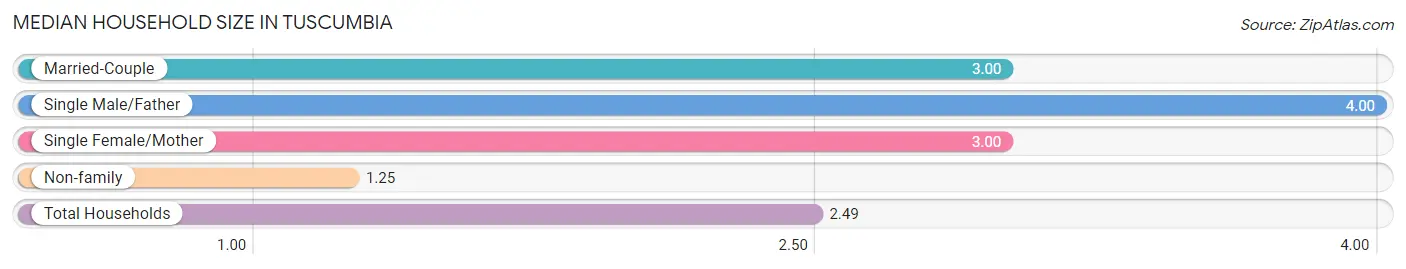
| Household Type | # Households | Household Size |
| Married-Couple | 12 (32.4%) | 3.00 |
| Single Male/Father | 2 (5.4%) | 4.00 |
| Single Female/Mother | 11 (29.7%) | 3.00 |
| Non-family | 12 (32.4%) | 1.25 |
| Total Households | 37 (100.0%) | 2.49 |
Household Size by Marriage Status in Tuscumbia
Out of a total of 37 households in Tuscumbia, 25 (67.6%) are family households, while 12 (32.4%) are nonfamily households. The most numerous type of family households are 2-person households, comprising 15, and the most common type of nonfamily households are 1-person households, comprising 7.
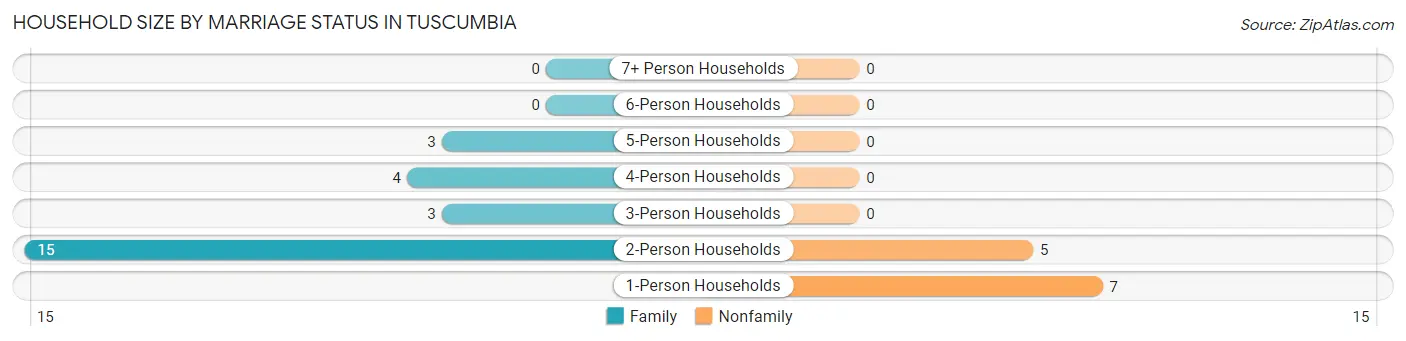
| Household Size | Family Households | Nonfamily Households |
| 1-Person Households | - | 7 (18.9%) |
| 2-Person Households | 15 (40.5%) | 5 (13.5%) |
| 3-Person Households | 3 (8.1%) | 0 (0.0%) |
| 4-Person Households | 4 (10.8%) | 0 (0.0%) |
| 5-Person Households | 3 (8.1%) | 0 (0.0%) |
| 6-Person Households | 0 (0.0%) | 0 (0.0%) |
| 7+ Person Households | 0 (0.0%) | 0 (0.0%) |
| Total | 25 (67.6%) | 12 (32.4%) |
Female Fertility in Tuscumbia
Fertility by Age in Tuscumbia
| Age Bracket | Women with Births | Births / 1,000 Women |
| 15 to 19 years | 0 (0.0%) | 0.0 |
| 20 to 34 years | 0 (0.0%) | 0.0 |
| 35 to 50 years | 0 (0.0%) | 0.0 |
| Total | 0 (0.0%) | 0.0 |
Fertility by Age by Marriage Status in Tuscumbia
| Age Bracket | Married | Unmarried |
| 15 to 19 years | 0 (0.0%) | 0 (0.0%) |
| 20 to 34 years | 0 (0.0%) | 0 (0.0%) |
| 35 to 50 years | 0 (0.0%) | 0 (0.0%) |
| Total | 0 (0.0%) | 0 (0.0%) |
Fertility by Education in Tuscumbia
| Educational Attainment | Women with Births | Births / 1,000 Women |
| Less than High School | 0 (0.0%) | 0.0 |
| High School Diploma | 0 (0.0%) | 0.0 |
| College or Associate's Degree | 0 (0.0%) | 0.0 |
| Bachelor's Degree | 0 (0.0%) | 0.0 |
| Graduate Degree | 0 (0.0%) | 0.0 |
| Total | 0 (0.0%) | 0.0 |
Fertility by Education by Marriage Status in Tuscumbia
| Educational Attainment | Married | Unmarried |
| Less than High School | 0 (0.0%) | 0 (0.0%) |
| High School Diploma | 0 (0.0%) | 0 (0.0%) |
| College or Associate's Degree | 0 (0.0%) | 0 (0.0%) |
| Bachelor's Degree | 0 (0.0%) | 0 (0.0%) |
| Graduate Degree | 0 (0.0%) | 0 (0.0%) |
| Total | 0 (0.0%) | 0 (0.0%) |
Employment Characteristics in Tuscumbia
Employment by Class of Employer in Tuscumbia
Among the 53 employed individuals in Tuscumbia, private company employees (44 | 83.0%), not-for-profit organizations (4 | 7.5%), and state government employees (3 | 5.7%) make up the most common classes of employment.
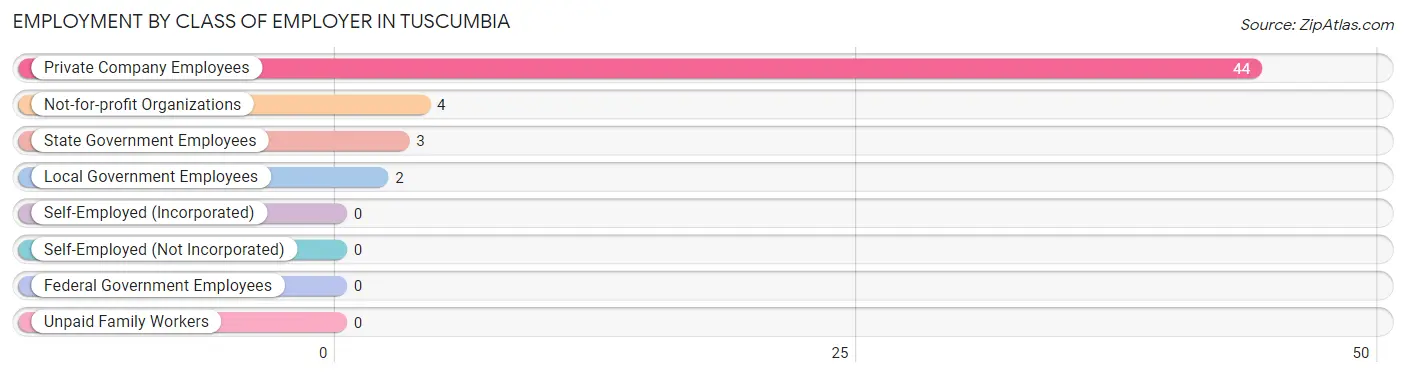
| Employer Class | # Employees | % Employees |
| Private Company Employees | 44 | 83.0% |
| Self-Employed (Incorporated) | 0 | 0.0% |
| Self-Employed (Not Incorporated) | 0 | 0.0% |
| Not-for-profit Organizations | 4 | 7.5% |
| Local Government Employees | 2 | 3.8% |
| State Government Employees | 3 | 5.7% |
| Federal Government Employees | 0 | 0.0% |
| Unpaid Family Workers | 0 | 0.0% |
| Total | 53 | 100.0% |
Employment Status by Age in Tuscumbia
According to the labor force statistics for Tuscumbia, out of the total population over 16 years of age (131), 42.7% or 56 individuals are in the labor force, with 5.4% or 3 of them unemployed. The age group with the highest labor force participation rate is 45 to 54 years, with 86.7% or 13 individuals in the labor force. Within the labor force, the 60 to 64 years age range has the highest percentage of unemployed individuals, with 50.0% or 3 of them being unemployed.
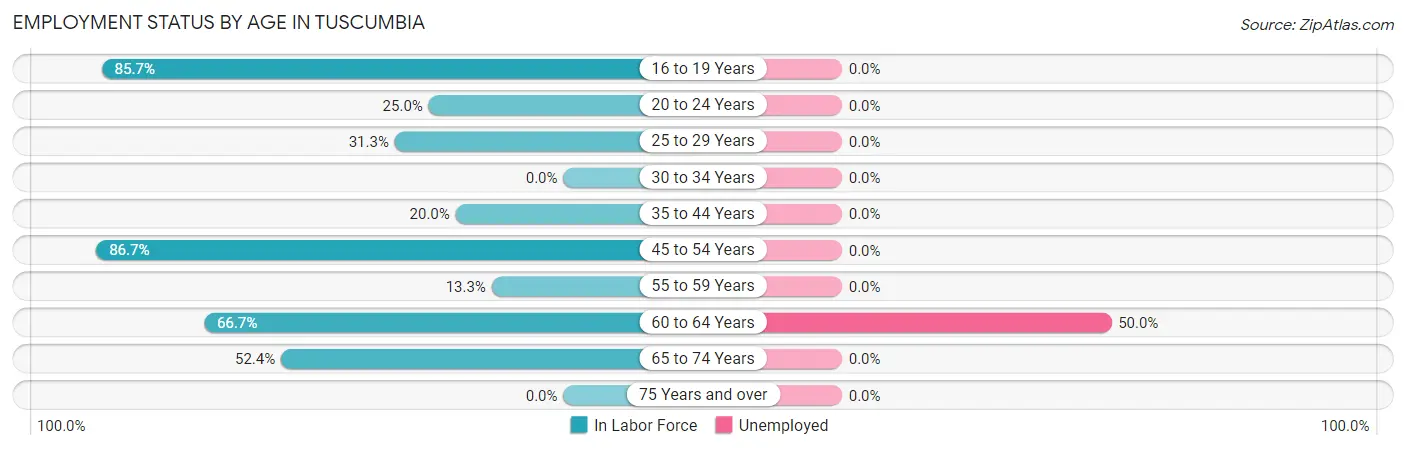
| Age Bracket | In Labor Force | Unemployed |
| 16 to 19 Years | 12 (85.7%) | 0 (0.0%) |
| 20 to 24 Years | 2 (25.0%) | 0 (0.0%) |
| 25 to 29 Years | 5 (31.3%) | 0 (0.0%) |
| 30 to 34 Years | 0 (0.0%) | 0 (0.0%) |
| 35 to 44 Years | 5 (20.0%) | 0 (0.0%) |
| 45 to 54 Years | 13 (86.7%) | 0 (0.0%) |
| 55 to 59 Years | 2 (13.3%) | 0 (0.0%) |
| 60 to 64 Years | 6 (66.7%) | 3 (50.0%) |
| 65 to 74 Years | 11 (52.4%) | 0 (0.0%) |
| 75 Years and over | 0 (0.0%) | 0 (0.0%) |
| Total | 56 (42.7%) | 3 (5.4%) |
Employment Status by Educational Attainment in Tuscumbia
According to labor force statistics for Tuscumbia, 36.0% of individuals (31) out of the total population between 25 and 64 years of age (86) are in the labor force, with 9.7% or 3 of them being unemployed. The group with the highest labor force participation rate are those with the educational attainment of bachelor's degree or higher, with 77.8% or 7 individuals in the labor force. Within the labor force, individuals with high school diploma education have the highest percentage of unemployment, with 25.0% or 3 of them being unemployed.
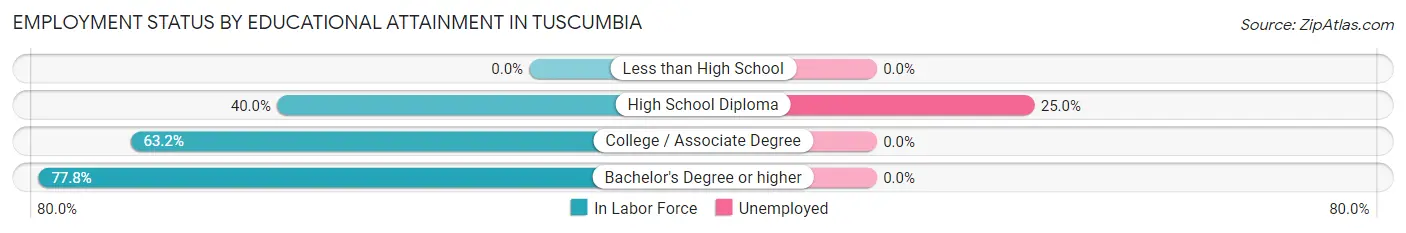
| Educational Attainment | In Labor Force | Unemployed |
| Less than High School | 0 (0.0%) | 0 (0.0%) |
| High School Diploma | 12 (40.0%) | 8 (25.0%) |
| College / Associate Degree | 12 (63.2%) | 0 (0.0%) |
| Bachelor's Degree or higher | 7 (77.8%) | 0 (0.0%) |
| Total | 31 (36.0%) | 8 (9.7%) |
Employment Occupations by Sex in Tuscumbia
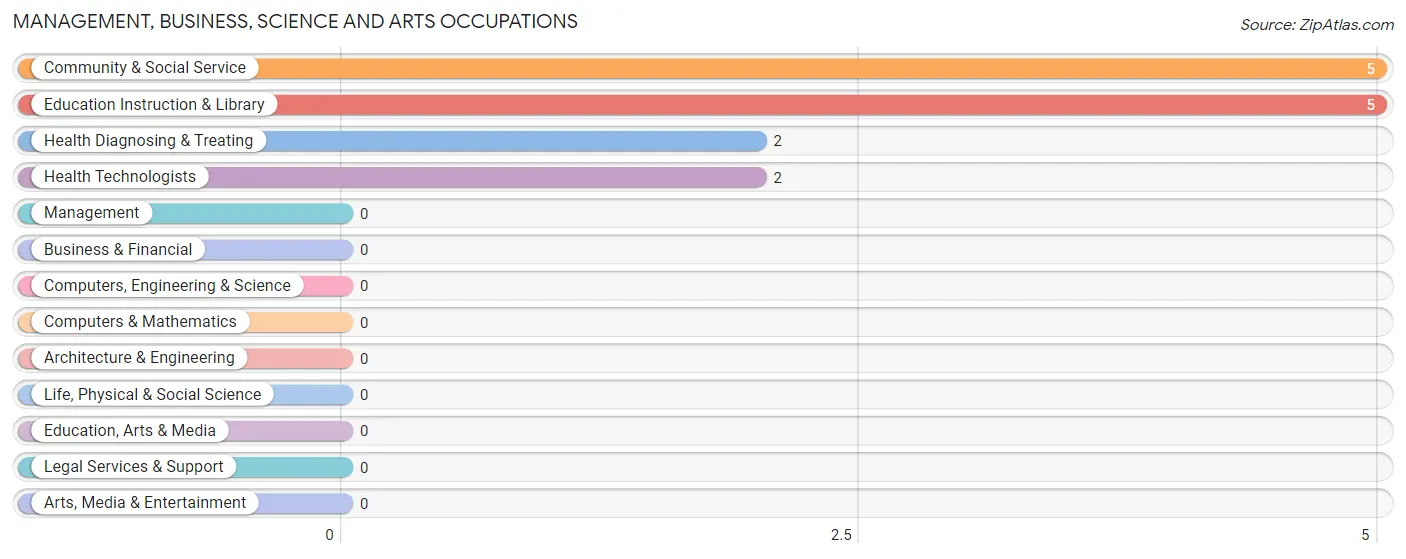
Management, Business, Science and Arts Occupations
The most common Management, Business, Science and Arts occupations in Tuscumbia are Community & Social Service (5 | 9.4%), Education Instruction & Library (5 | 9.4%), Health Diagnosing & Treating (2 | 3.8%), and Health Technologists (2 | 3.8%).
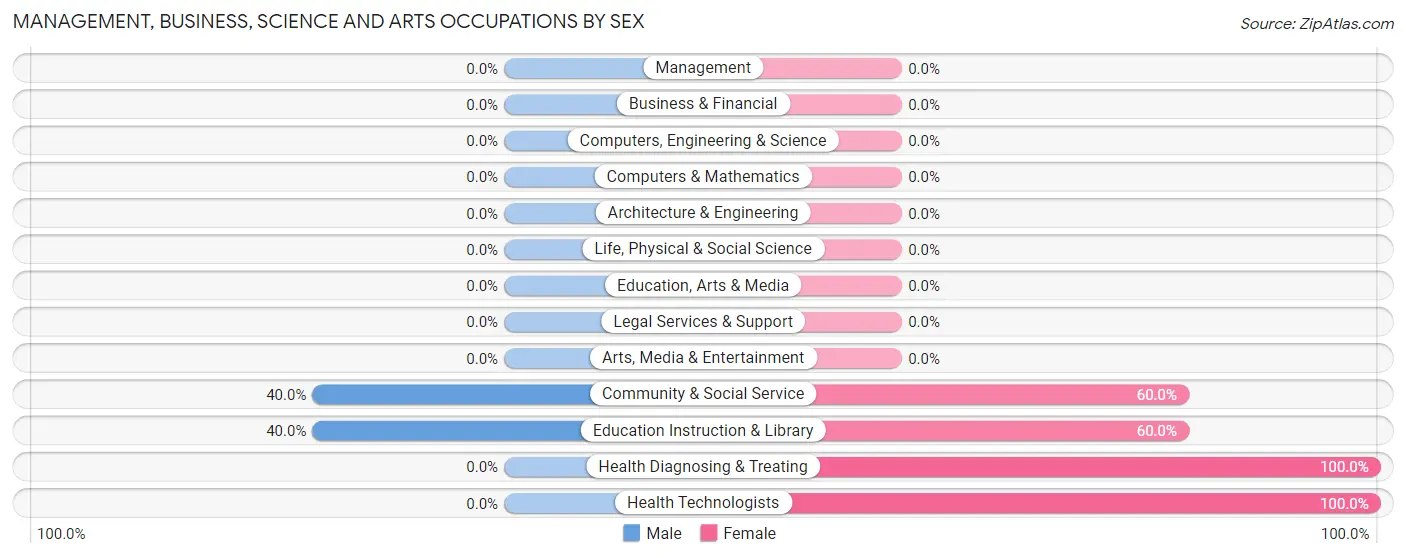
Management, Business, Science and Arts Occupations by Sex
Within the Management, Business, Science and Arts occupations in Tuscumbia, the most male-oriented occupations are Community & Social Service (40.0%), and Education Instruction & Library (40.0%), while the most female-oriented occupations are Health Diagnosing & Treating (100.0%), Health Technologists (100.0%), and Community & Social Service (60.0%).
| Occupation | Male | Female |
| Management | 0 (0.0%) | 0 (0.0%) |
| Business & Financial | 0 (0.0%) | 0 (0.0%) |
| Computers, Engineering & Science | 0 (0.0%) | 0 (0.0%) |
| Computers & Mathematics | 0 (0.0%) | 0 (0.0%) |
| Architecture & Engineering | 0 (0.0%) | 0 (0.0%) |
| Life, Physical & Social Science | 0 (0.0%) | 0 (0.0%) |
| Community & Social Service | 2 (40.0%) | 3 (60.0%) |
| Education, Arts & Media | 0 (0.0%) | 0 (0.0%) |
| Legal Services & Support | 0 (0.0%) | 0 (0.0%) |
| Education Instruction & Library | 2 (40.0%) | 3 (60.0%) |
| Arts, Media & Entertainment | 0 (0.0%) | 0 (0.0%) |
| Health Diagnosing & Treating | 0 (0.0%) | 2 (100.0%) |
| Health Technologists | 0 (0.0%) | 2 (100.0%) |
| Total (Category) | 2 (28.6%) | 5 (71.4%) |
| Total (Overall) | 18 (34.0%) | 35 (66.0%) |
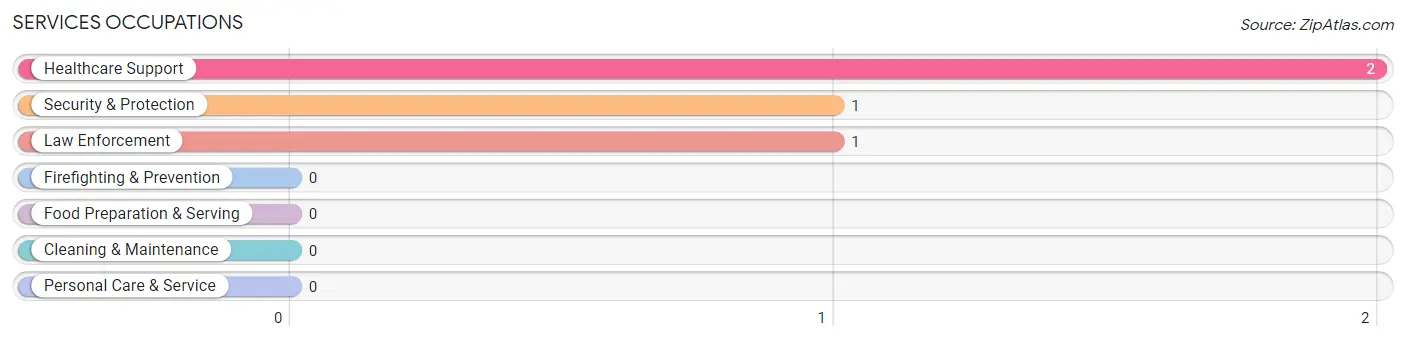
Services Occupations
The most common Services occupations in Tuscumbia are Healthcare Support (2 | 3.8%), Security & Protection (1 | 1.9%), and Law Enforcement (1 | 1.9%).
Services Occupations by Sex
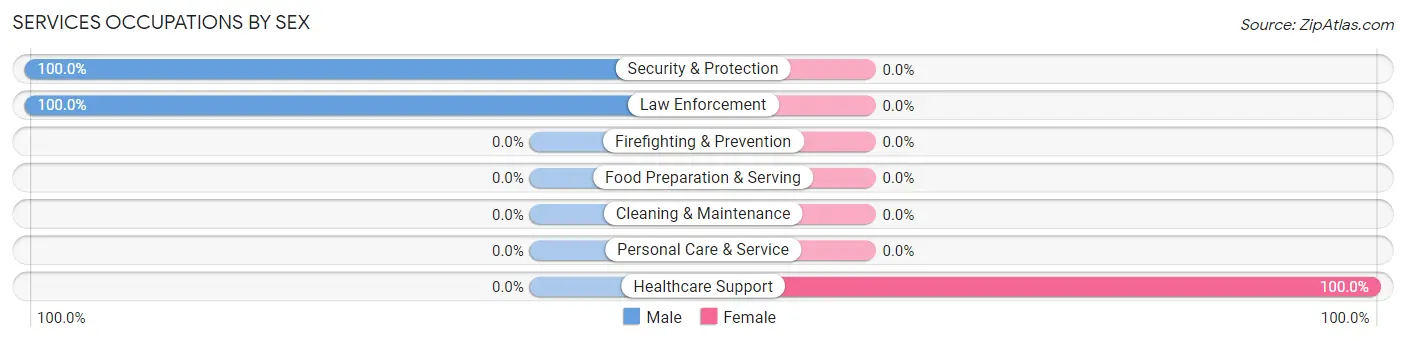
| Occupation | Male | Female |
| Healthcare Support | 0 (0.0%) | 2 (100.0%) |
| Security & Protection | 1 (100.0%) | 0 (0.0%) |
| Firefighting & Prevention | 0 (0.0%) | 0 (0.0%) |
| Law Enforcement | 1 (100.0%) | 0 (0.0%) |
| Food Preparation & Serving | 0 (0.0%) | 0 (0.0%) |
| Cleaning & Maintenance | 0 (0.0%) | 0 (0.0%) |
| Personal Care & Service | 0 (0.0%) | 0 (0.0%) |
| Total (Category) | 1 (33.3%) | 2 (66.7%) |
| Total (Overall) | 18 (34.0%) | 35 (66.0%) |
Sales and Office Occupations
The most common Sales and Office occupations in Tuscumbia are Office & Administration (26 | 49.1%), and Sales & Related (4 | 7.5%).
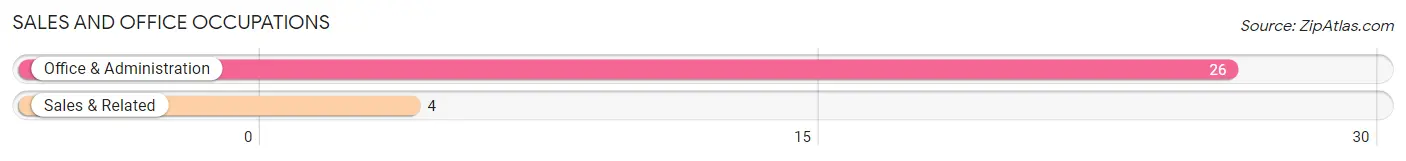
Sales and Office Occupations by Sex
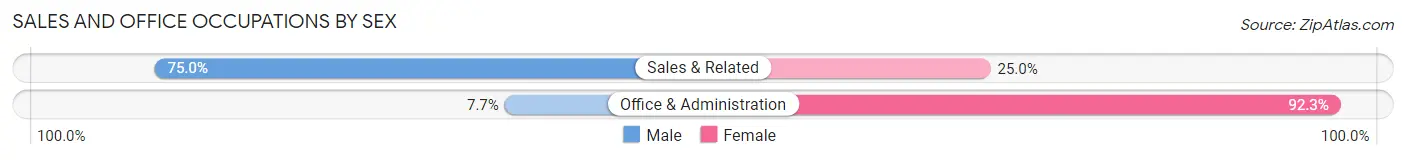
| Occupation | Male | Female |
| Sales & Related | 3 (75.0%) | 1 (25.0%) |
| Office & Administration | 2 (7.7%) | 24 (92.3%) |
| Total (Category) | 5 (16.7%) | 25 (83.3%) |
| Total (Overall) | 18 (34.0%) | 35 (66.0%) |
Natural Resources, Construction and Maintenance Occupations
The most common Natural Resources, Construction and Maintenance occupations in Tuscumbia are Construction & Extraction (6 | 11.3%), and Installation, Maintenance & Repair (4 | 7.5%).
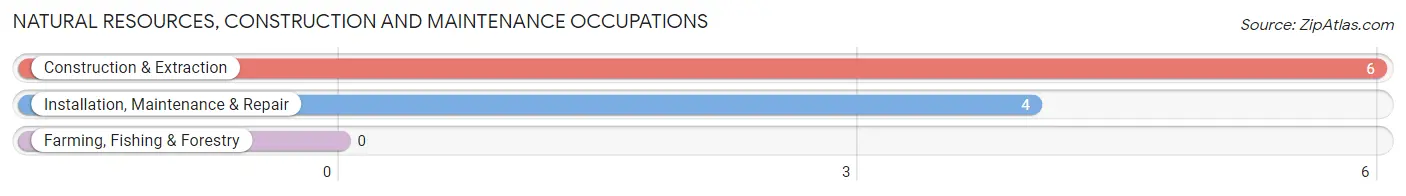
Natural Resources, Construction and Maintenance Occupations by Sex
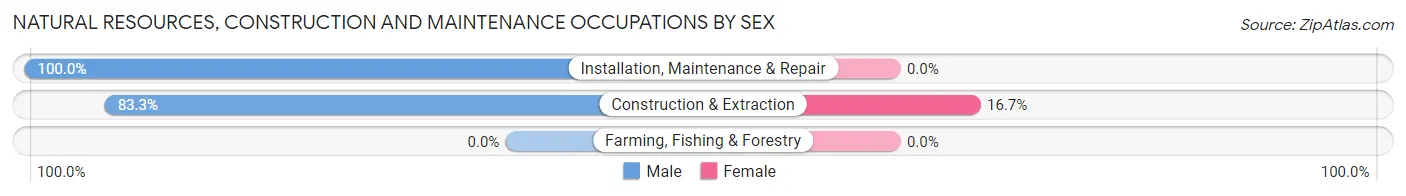
| Occupation | Male | Female |
| Farming, Fishing & Forestry | 0 (0.0%) | 0 (0.0%) |
| Construction & Extraction | 5 (83.3%) | 1 (16.7%) |
| Installation, Maintenance & Repair | 4 (100.0%) | 0 (0.0%) |
| Total (Category) | 9 (90.0%) | 1 (10.0%) |
| Total (Overall) | 18 (34.0%) | 35 (66.0%) |
Production, Transportation and Moving Occupations
The most common Production, Transportation and Moving occupations in Tuscumbia are , and Production (3 | 5.7%).
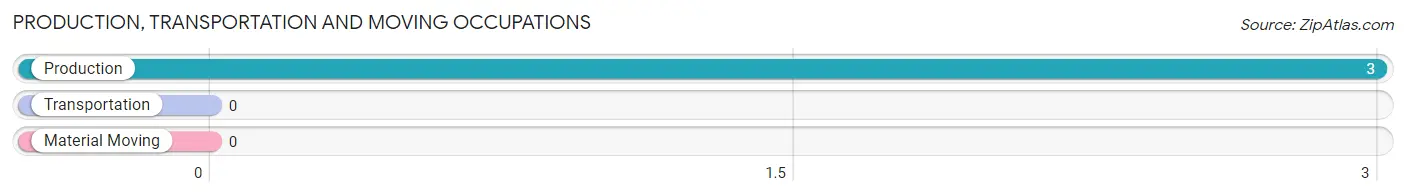
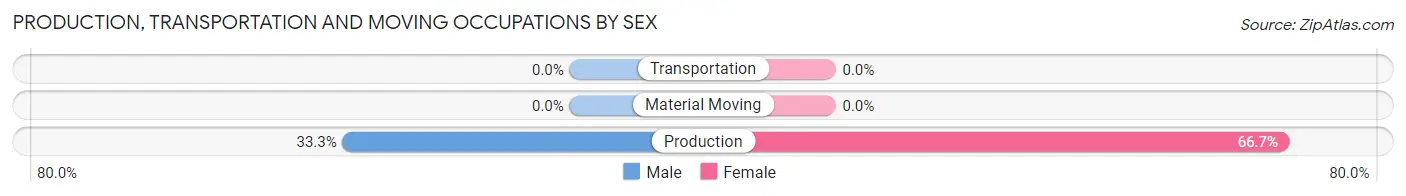
Production, Transportation and Moving Occupations by Sex
| Occupation | Male | Female |
| Production | 1 (33.3%) | 2 (66.7%) |
| Transportation | 0 (0.0%) | 0 (0.0%) |
| Material Moving | 0 (0.0%) | 0 (0.0%) |
| Total (Category) | 1 (33.3%) | 2 (66.7%) |
| Total (Overall) | 18 (34.0%) | 35 (66.0%) |
Employment Industries by Sex in Tuscumbia
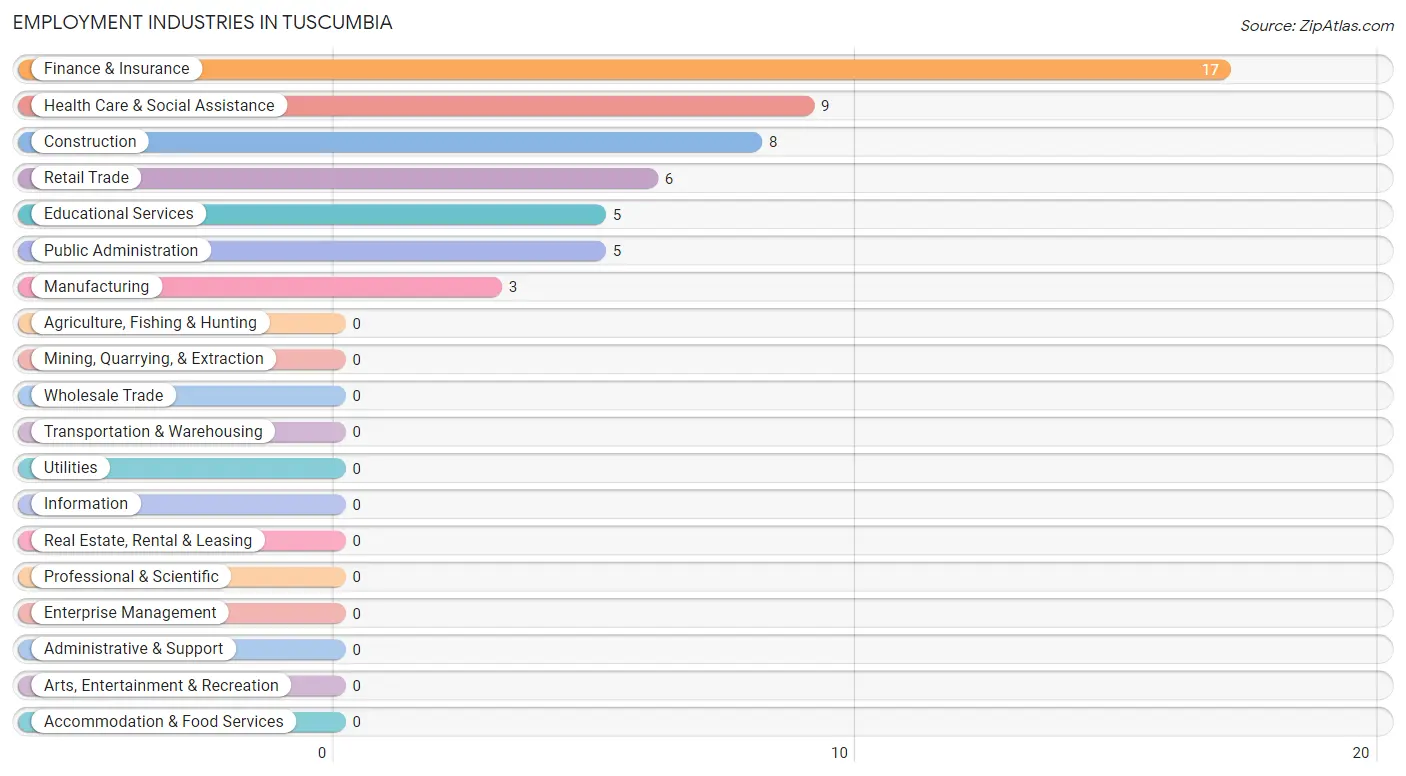
Employment Industries in Tuscumbia
The major employment industries in Tuscumbia include Finance & Insurance (17 | 32.1%), Health Care & Social Assistance (9 | 17.0%), Construction (8 | 15.1%), Retail Trade (6 | 11.3%), and Educational Services (5 | 9.4%).
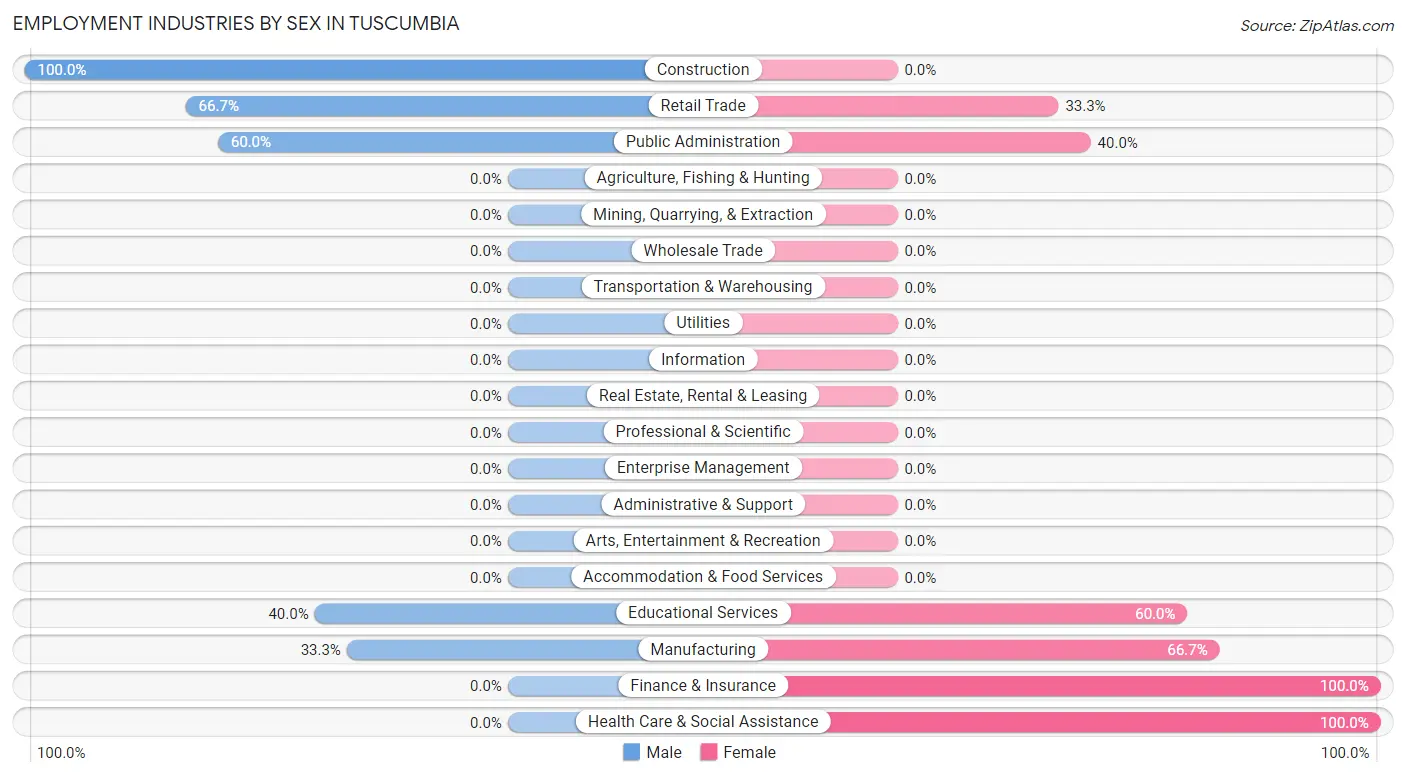
Employment Industries by Sex in Tuscumbia
The Tuscumbia industries that see more men than women are Construction (100.0%), Retail Trade (66.7%), and Public Administration (60.0%), whereas the industries that tend to have a higher number of women are Finance & Insurance (100.0%), Health Care & Social Assistance (100.0%), and Manufacturing (66.7%).
| Industry | Male | Female |
| Agriculture, Fishing & Hunting | 0 (0.0%) | 0 (0.0%) |
| Mining, Quarrying, & Extraction | 0 (0.0%) | 0 (0.0%) |
| Construction | 8 (100.0%) | 0 (0.0%) |
| Manufacturing | 1 (33.3%) | 2 (66.7%) |
| Wholesale Trade | 0 (0.0%) | 0 (0.0%) |
| Retail Trade | 4 (66.7%) | 2 (33.3%) |
| Transportation & Warehousing | 0 (0.0%) | 0 (0.0%) |
| Utilities | 0 (0.0%) | 0 (0.0%) |
| Information | 0 (0.0%) | 0 (0.0%) |
| Finance & Insurance | 0 (0.0%) | 17 (100.0%) |
| Real Estate, Rental & Leasing | 0 (0.0%) | 0 (0.0%) |
| Professional & Scientific | 0 (0.0%) | 0 (0.0%) |
| Enterprise Management | 0 (0.0%) | 0 (0.0%) |
| Administrative & Support | 0 (0.0%) | 0 (0.0%) |
| Educational Services | 2 (40.0%) | 3 (60.0%) |
| Health Care & Social Assistance | 0 (0.0%) | 9 (100.0%) |
| Arts, Entertainment & Recreation | 0 (0.0%) | 0 (0.0%) |
| Accommodation & Food Services | 0 (0.0%) | 0 (0.0%) |
| Public Administration | 3 (60.0%) | 2 (40.0%) |
| Total | 18 (34.0%) | 35 (66.0%) |
Education in Tuscumbia
School Enrollment in Tuscumbia
The most common levels of schooling among the 35 students in Tuscumbia are high school (24 | 68.6%), middle school (8 | 22.9%), and college / undergraduate (3 | 8.6%).
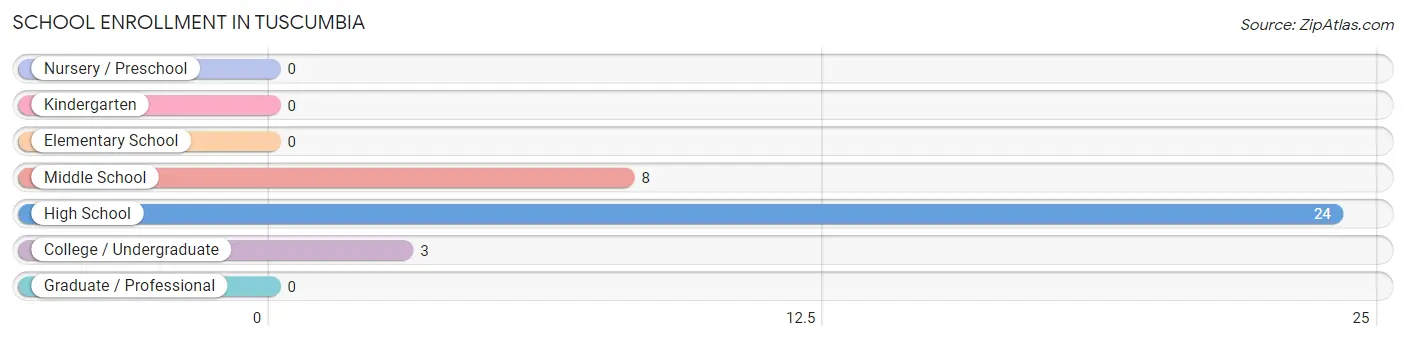
| School Level | # Students | % Students |
| Nursery / Preschool | 0 | 0.0% |
| Kindergarten | 0 | 0.0% |
| Elementary School | 0 | 0.0% |
| Middle School | 8 | 22.9% |
| High School | 24 | 68.6% |
| College / Undergraduate | 3 | 8.6% |
| Graduate / Professional | 0 | 0.0% |
| Total | 35 | 100.0% |
School Enrollment by Age by Funding Source in Tuscumbia
Out of a total of 35 students who are enrolled in schools in Tuscumbia, 7 (20.0%) attend a private institution, while the remaining 28 (80.0%) are enrolled in public schools. The age group of 20 to 24 year olds has the highest likelihood of being enrolled in private schools, with 2 (100.0% in the age bracket) enrolled. Conversely, the age group of 10 to 14 year olds has the lowest likelihood of being enrolled in a private school, with 11 (100.0% in the age bracket) attending a public institution.
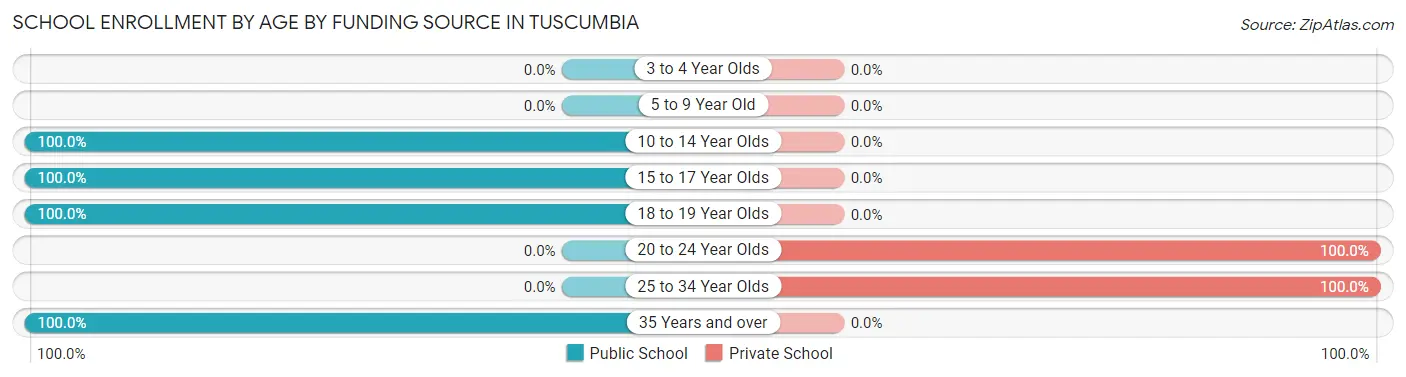
| Age Bracket | Public School | Private School |
| 3 to 4 Year Olds | 0 (0.0%) | 0 (0.0%) |
| 5 to 9 Year Old | 0 (0.0%) | 0 (0.0%) |
| 10 to 14 Year Olds | 11 (100.0%) | 0 (0.0%) |
| 15 to 17 Year Olds | 13 (100.0%) | 0 (0.0%) |
| 18 to 19 Year Olds | 3 (100.0%) | 0 (0.0%) |
| 20 to 24 Year Olds | 0 (0.0%) | 2 (100.0%) |
| 25 to 34 Year Olds | 0 (0.0%) | 5 (100.0%) |
| 35 Years and over | 1 (100.0%) | 0 (0.0%) |
| Total | 28 (80.0%) | 7 (20.0%) |
Educational Attainment by Field of Study in Tuscumbia
Education (3 | 33.3%), engineering (2 | 22.2%), science & technology (2 | 22.2%), and business (2 | 22.2%) are the most common fields of study among 9 individuals in Tuscumbia who have obtained a bachelor's degree or higher.
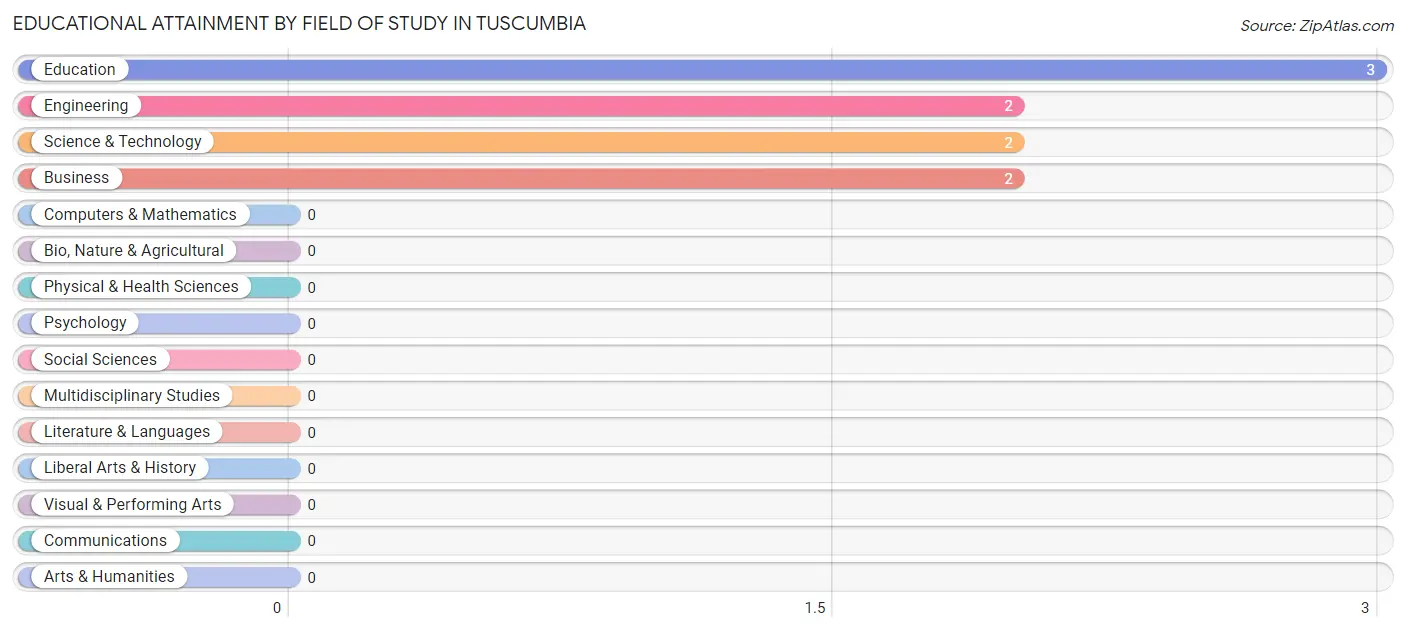
| Field of Study | # Graduates | % Graduates |
| Computers & Mathematics | 0 | 0.0% |
| Bio, Nature & Agricultural | 0 | 0.0% |
| Physical & Health Sciences | 0 | 0.0% |
| Psychology | 0 | 0.0% |
| Social Sciences | 0 | 0.0% |
| Engineering | 2 | 22.2% |
| Multidisciplinary Studies | 0 | 0.0% |
| Science & Technology | 2 | 22.2% |
| Business | 2 | 22.2% |
| Education | 3 | 33.3% |
| Literature & Languages | 0 | 0.0% |
| Liberal Arts & History | 0 | 0.0% |
| Visual & Performing Arts | 0 | 0.0% |
| Communications | 0 | 0.0% |
| Arts & Humanities | 0 | 0.0% |
| Total | 9 | 100.0% |
Transportation & Commute in Tuscumbia
Vehicle Availability by Sex in Tuscumbia
The most prevalent vehicle ownership categories in Tuscumbia are males with 3 vehicles (11, accounting for 61.1%) and females with 3 vehicles (27, making up 31.4%).
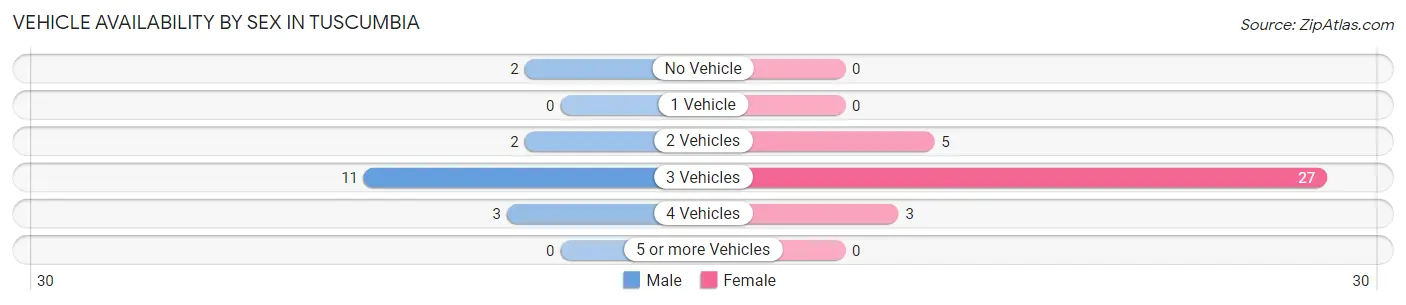
| Vehicles Available | Male | Female |
| No Vehicle | 2 (11.1%) | 0 (0.0%) |
| 1 Vehicle | 0 (0.0%) | 0 (0.0%) |
| 2 Vehicles | 2 (11.1%) | 5 (14.3%) |
| 3 Vehicles | 11 (61.1%) | 27 (77.1%) |
| 4 Vehicles | 3 (16.7%) | 3 (8.6%) |
| 5 or more Vehicles | 0 (0.0%) | 0 (0.0%) |
| Total | 18 (100.0%) | 35 (100.0%) |
Commute Time in Tuscumbia
The most frequently occuring commute durations in Tuscumbia are 35 to 39 minutes (22 commuters, 41.5%), 40 to 44 minutes (11 commuters, 20.7%), and 30 to 34 minutes (8 commuters, 15.1%).
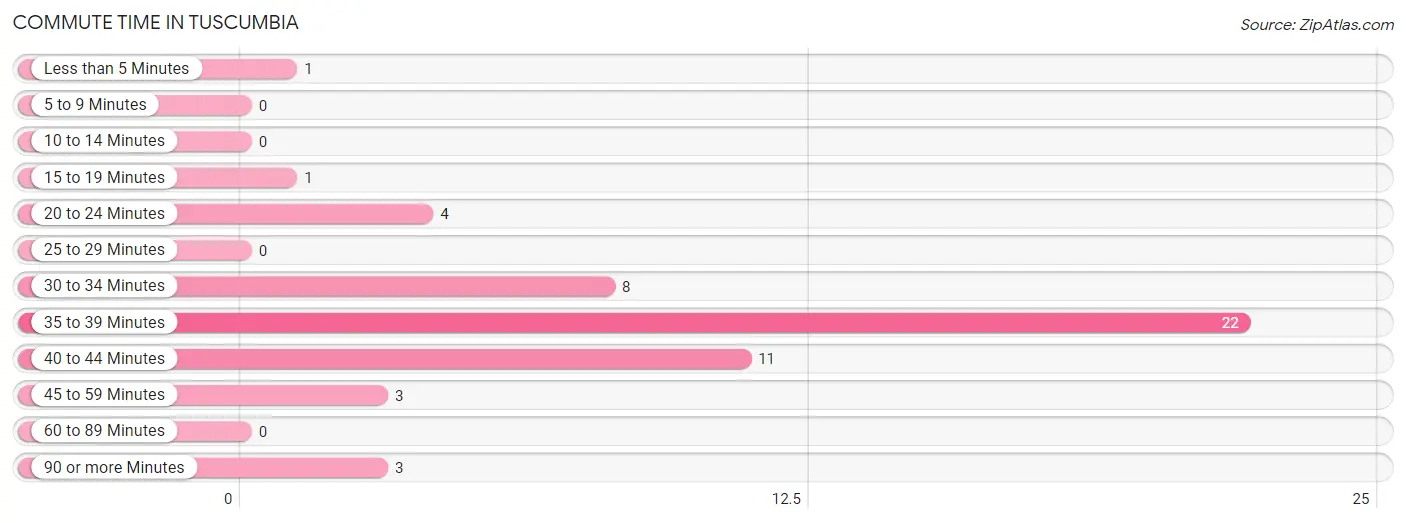
| Commute Time | # Commuters | % Commuters |
| Less than 5 Minutes | 1 | 1.9% |
| 5 to 9 Minutes | 0 | 0.0% |
| 10 to 14 Minutes | 0 | 0.0% |
| 15 to 19 Minutes | 1 | 1.9% |
| 20 to 24 Minutes | 4 | 7.5% |
| 25 to 29 Minutes | 0 | 0.0% |
| 30 to 34 Minutes | 8 | 15.1% |
| 35 to 39 Minutes | 22 | 41.5% |
| 40 to 44 Minutes | 11 | 20.7% |
| 45 to 59 Minutes | 3 | 5.7% |
| 60 to 89 Minutes | 0 | 0.0% |
| 90 or more Minutes | 3 | 5.7% |
Commute Time by Sex in Tuscumbia
The most common commute times in Tuscumbia are 35 to 39 minutes (6 commuters, 33.3%) for males and 35 to 39 minutes (16 commuters, 45.7%) for females.
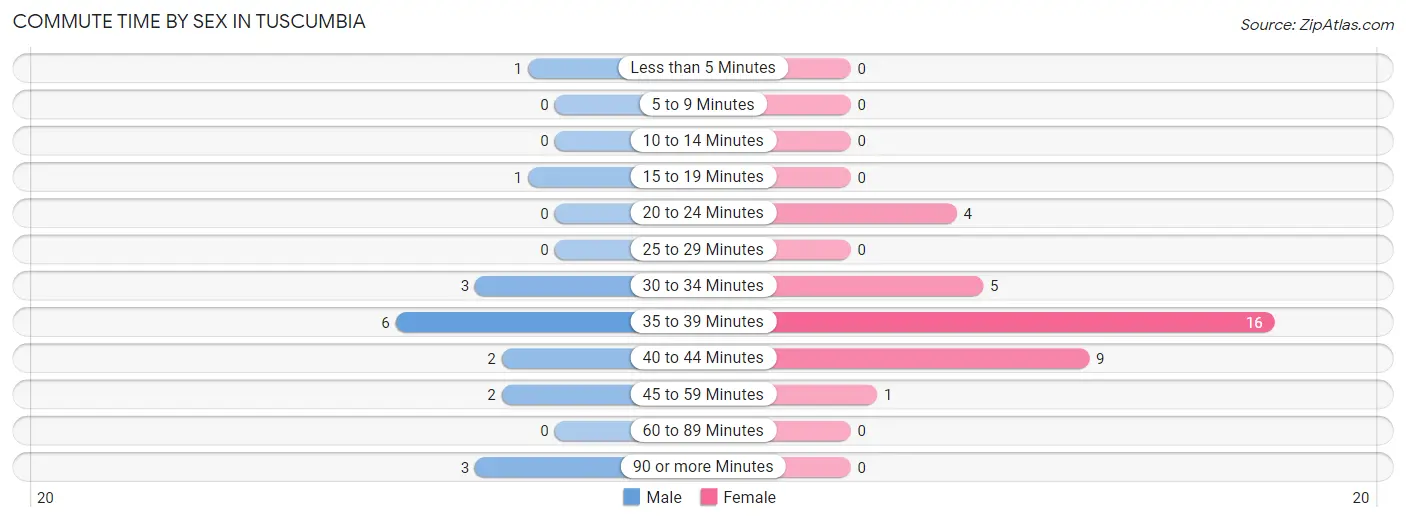
| Commute Time | Male | Female |
| Less than 5 Minutes | 1 (5.6%) | 0 (0.0%) |
| 5 to 9 Minutes | 0 (0.0%) | 0 (0.0%) |
| 10 to 14 Minutes | 0 (0.0%) | 0 (0.0%) |
| 15 to 19 Minutes | 1 (5.6%) | 0 (0.0%) |
| 20 to 24 Minutes | 0 (0.0%) | 4 (11.4%) |
| 25 to 29 Minutes | 0 (0.0%) | 0 (0.0%) |
| 30 to 34 Minutes | 3 (16.7%) | 5 (14.3%) |
| 35 to 39 Minutes | 6 (33.3%) | 16 (45.7%) |
| 40 to 44 Minutes | 2 (11.1%) | 9 (25.7%) |
| 45 to 59 Minutes | 2 (11.1%) | 1 (2.9%) |
| 60 to 89 Minutes | 0 (0.0%) | 0 (0.0%) |
| 90 or more Minutes | 3 (16.7%) | 0 (0.0%) |
Time of Departure to Work by Sex in Tuscumbia
The most frequent times of departure to work in Tuscumbia are 5:30 AM to 5:59 AM (4, 22.2%) for males and 6:00 AM to 6:29 AM (11, 31.4%) for females.
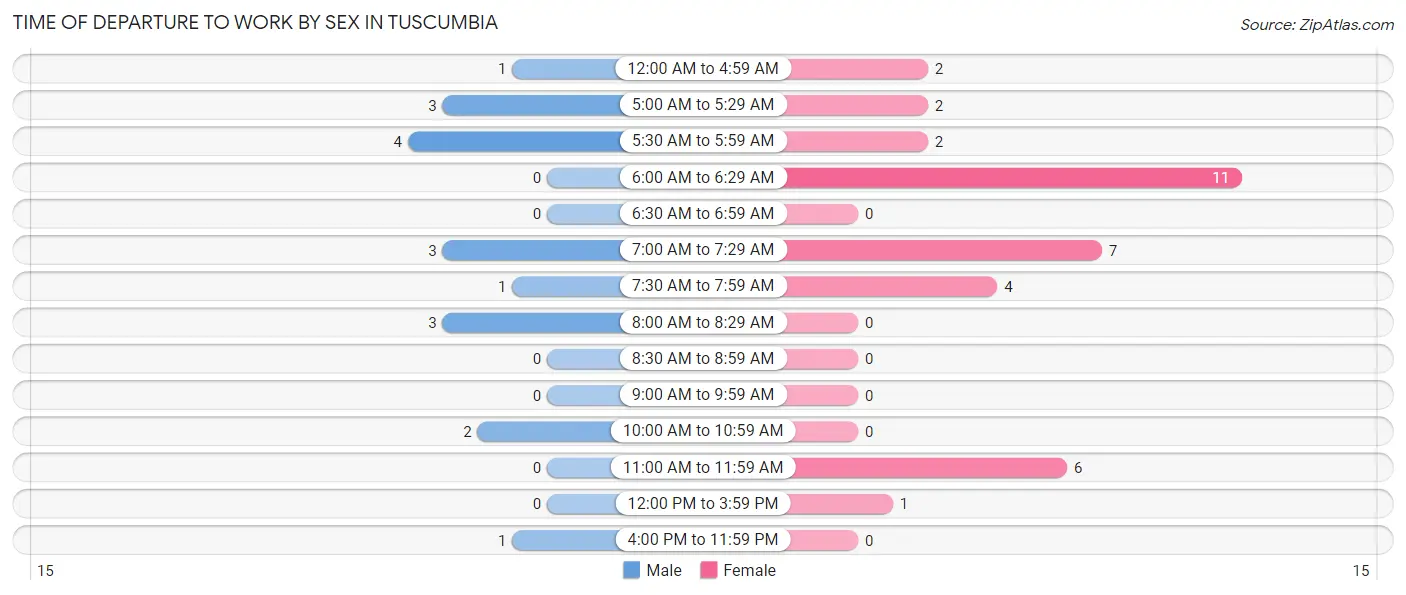
| Time of Departure | Male | Female |
| 12:00 AM to 4:59 AM | 1 (5.6%) | 2 (5.7%) |
| 5:00 AM to 5:29 AM | 3 (16.7%) | 2 (5.7%) |
| 5:30 AM to 5:59 AM | 4 (22.2%) | 2 (5.7%) |
| 6:00 AM to 6:29 AM | 0 (0.0%) | 11 (31.4%) |
| 6:30 AM to 6:59 AM | 0 (0.0%) | 0 (0.0%) |
| 7:00 AM to 7:29 AM | 3 (16.7%) | 7 (20.0%) |
| 7:30 AM to 7:59 AM | 1 (5.6%) | 4 (11.4%) |
| 8:00 AM to 8:29 AM | 3 (16.7%) | 0 (0.0%) |
| 8:30 AM to 8:59 AM | 0 (0.0%) | 0 (0.0%) |
| 9:00 AM to 9:59 AM | 0 (0.0%) | 0 (0.0%) |
| 10:00 AM to 10:59 AM | 2 (11.1%) | 0 (0.0%) |
| 11:00 AM to 11:59 AM | 0 (0.0%) | 6 (17.1%) |
| 12:00 PM to 3:59 PM | 0 (0.0%) | 1 (2.9%) |
| 4:00 PM to 11:59 PM | 1 (5.6%) | 0 (0.0%) |
| Total | 18 (100.0%) | 35 (100.0%) |
Housing Occupancy in Tuscumbia
Occupancy by Ownership in Tuscumbia
Of the total 37 dwellings in Tuscumbia, owner-occupied units account for 34 (91.9%), while renter-occupied units make up 3 (8.1%).
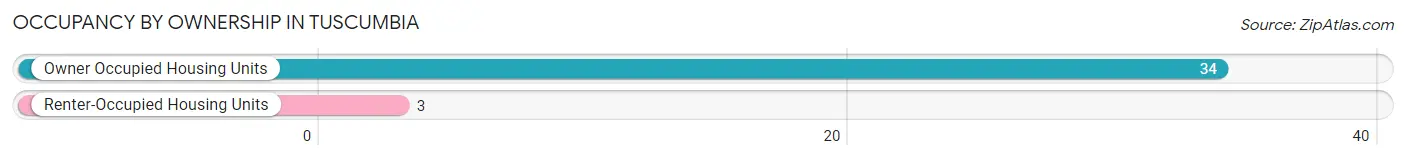
| Occupancy | # Housing Units | % Housing Units |
| Owner Occupied Housing Units | 34 | 91.9% |
| Renter-Occupied Housing Units | 3 | 8.1% |
| Total Occupied Housing Units | 37 | 100.0% |
Occupancy by Household Size in Tuscumbia
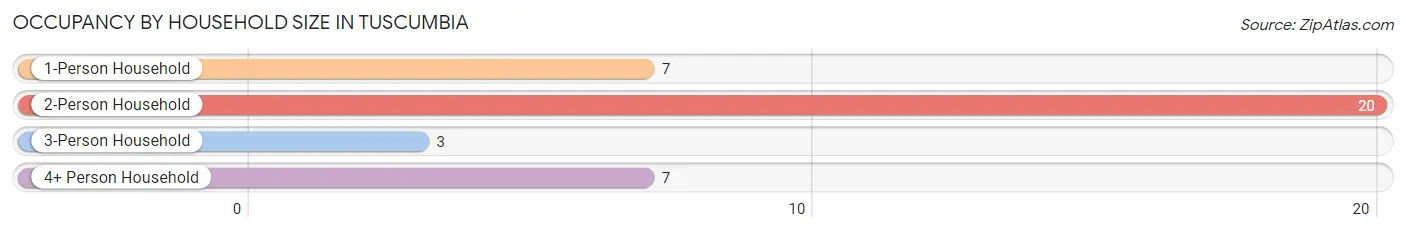
| Household Size | # Housing Units | % Housing Units |
| 1-Person Household | 7 | 18.9% |
| 2-Person Household | 20 | 54.0% |
| 3-Person Household | 3 | 8.1% |
| 4+ Person Household | 7 | 18.9% |
| Total Housing Units | 37 | 100.0% |
Occupancy by Ownership by Household Size in Tuscumbia
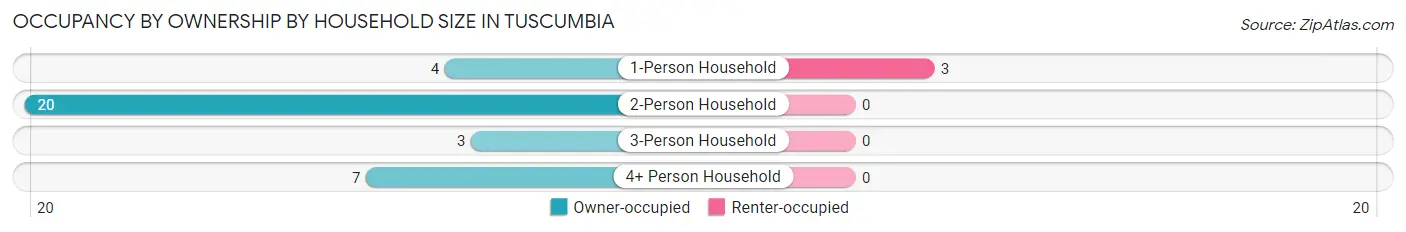
| Household Size | Owner-occupied | Renter-occupied |
| 1-Person Household | 4 (57.1%) | 3 (42.9%) |
| 2-Person Household | 20 (100.0%) | 0 (0.0%) |
| 3-Person Household | 3 (100.0%) | 0 (0.0%) |
| 4+ Person Household | 7 (100.0%) | 0 (0.0%) |
| Total Housing Units | 34 (91.9%) | 3 (8.1%) |
Occupancy by Educational Attainment in Tuscumbia
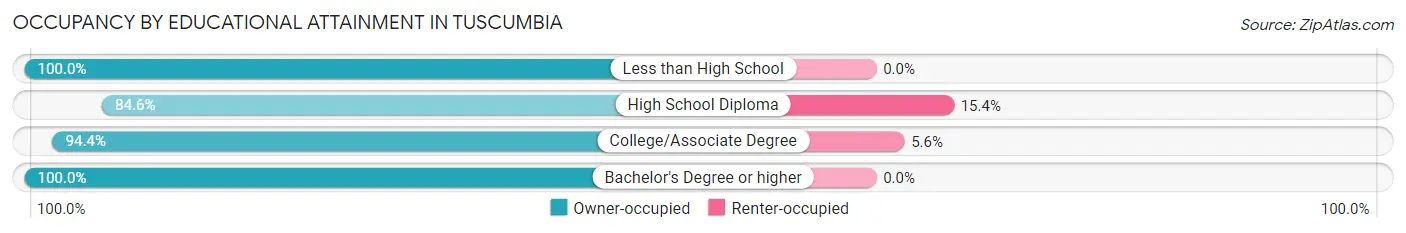
| Household Size | Owner-occupied | Renter-occupied |
| Less than High School | 1 (100.0%) | 0 (0.0%) |
| High School Diploma | 11 (84.6%) | 2 (15.4%) |
| College/Associate Degree | 17 (94.4%) | 1 (5.6%) |
| Bachelor's Degree or higher | 5 (100.0%) | 0 (0.0%) |
Occupancy by Age of Householder in Tuscumbia
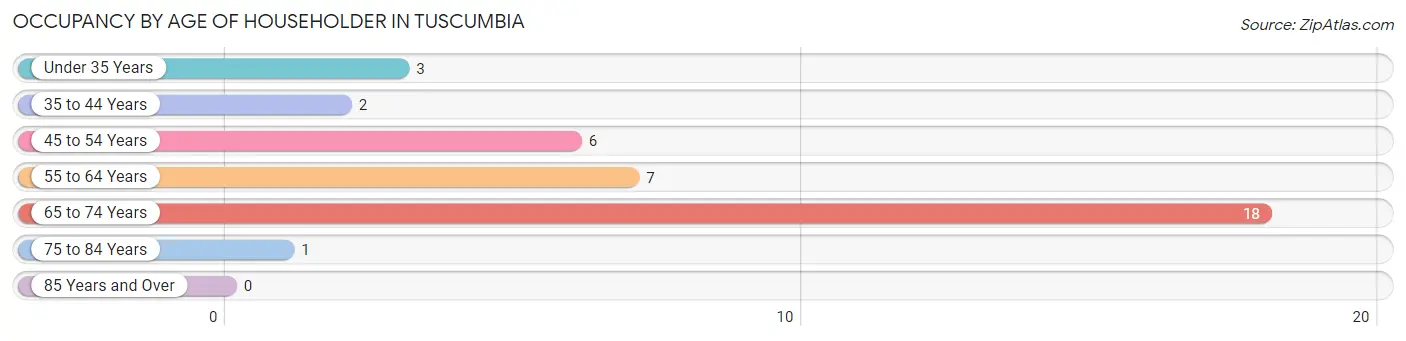
| Age Bracket | # Households | % Households |
| Under 35 Years | 3 | 8.1% |
| 35 to 44 Years | 2 | 5.4% |
| 45 to 54 Years | 6 | 16.2% |
| 55 to 64 Years | 7 | 18.9% |
| 65 to 74 Years | 18 | 48.6% |
| 75 to 84 Years | 1 | 2.7% |
| 85 Years and Over | 0 | 0.0% |
| Total | 37 | 100.0% |
Housing Finances in Tuscumbia
Median Income by Occupancy in Tuscumbia
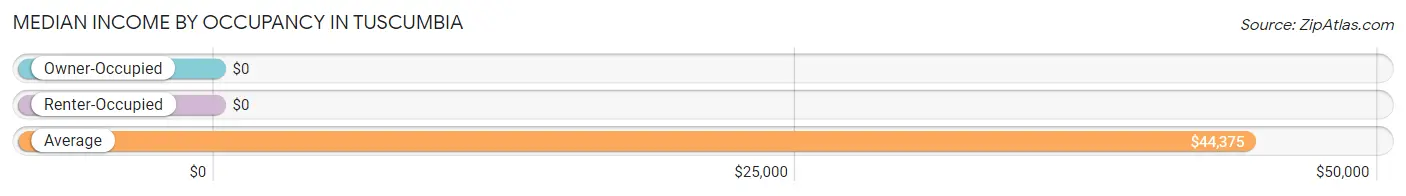
| Occupancy Type | # Households | Median Income |
| Owner-Occupied | 34 (91.9%) | $0 |
| Renter-Occupied | 3 (8.1%) | $0 |
| Average | 37 (100.0%) | $44,375 |
Occupancy by Householder Income Bracket in Tuscumbia
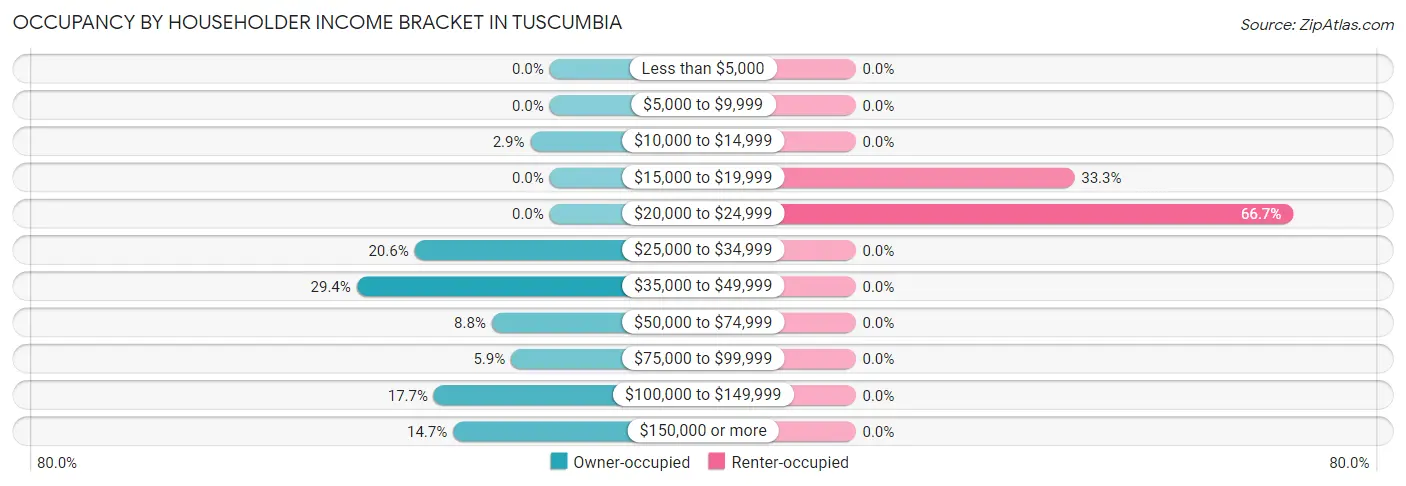
| Income Bracket | Owner-occupied | Renter-occupied |
| Less than $5,000 | 0 (0.0%) | 0 (0.0%) |
| $5,000 to $9,999 | 0 (0.0%) | 0 (0.0%) |
| $10,000 to $14,999 | 1 (2.9%) | 0 (0.0%) |
| $15,000 to $19,999 | 0 (0.0%) | 1 (33.3%) |
| $20,000 to $24,999 | 0 (0.0%) | 2 (66.7%) |
| $25,000 to $34,999 | 7 (20.6%) | 0 (0.0%) |
| $35,000 to $49,999 | 10 (29.4%) | 0 (0.0%) |
| $50,000 to $74,999 | 3 (8.8%) | 0 (0.0%) |
| $75,000 to $99,999 | 2 (5.9%) | 0 (0.0%) |
| $100,000 to $149,999 | 6 (17.6%) | 0 (0.0%) |
| $150,000 or more | 5 (14.7%) | 0 (0.0%) |
| Total | 34 (100.0%) | 3 (100.0%) |
Monthly Housing Cost Tiers in Tuscumbia
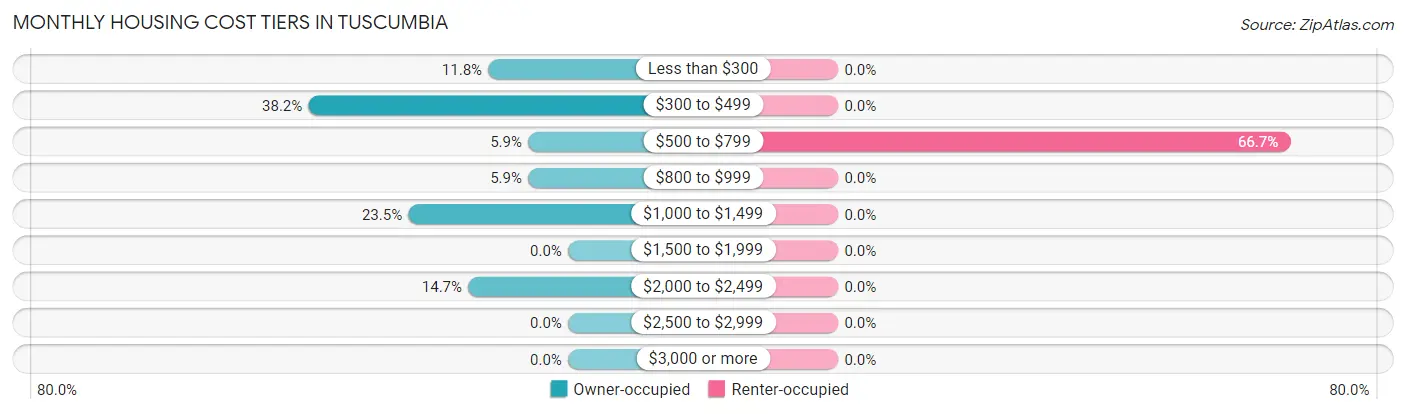
| Monthly Cost | Owner-occupied | Renter-occupied |
| Less than $300 | 4 (11.8%) | 0 (0.0%) |
| $300 to $499 | 13 (38.2%) | 0 (0.0%) |
| $500 to $799 | 2 (5.9%) | 2 (66.7%) |
| $800 to $999 | 2 (5.9%) | 0 (0.0%) |
| $1,000 to $1,499 | 8 (23.5%) | 0 (0.0%) |
| $1,500 to $1,999 | 0 (0.0%) | 0 (0.0%) |
| $2,000 to $2,499 | 5 (14.7%) | 0 (0.0%) |
| $2,500 to $2,999 | 0 (0.0%) | 0 (0.0%) |
| $3,000 or more | 0 (0.0%) | 0 (0.0%) |
| Total | 34 (100.0%) | 3 (100.0%) |
Physical Housing Characteristics in Tuscumbia
Housing Structures in Tuscumbia
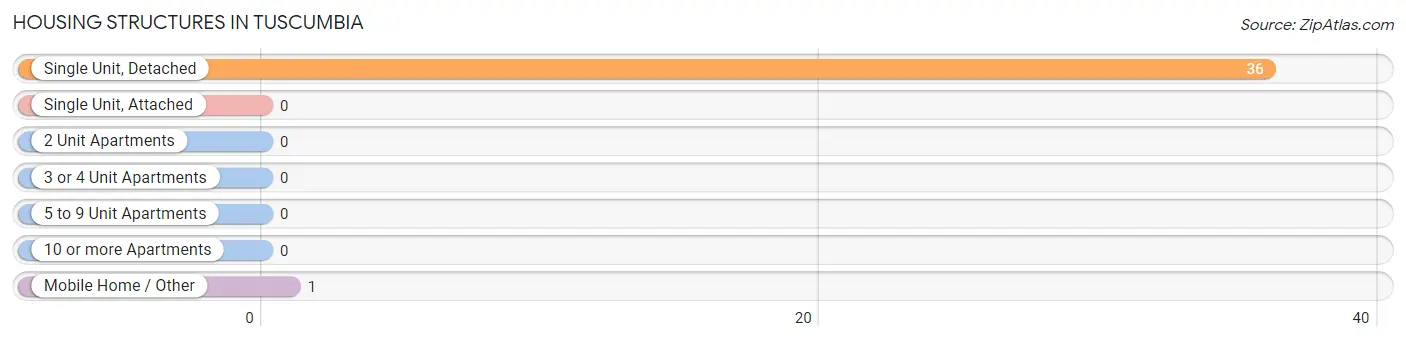
| Structure Type | # Housing Units | % Housing Units |
| Single Unit, Detached | 36 | 97.3% |
| Single Unit, Attached | 0 | 0.0% |
| 2 Unit Apartments | 0 | 0.0% |
| 3 or 4 Unit Apartments | 0 | 0.0% |
| 5 to 9 Unit Apartments | 0 | 0.0% |
| 10 or more Apartments | 0 | 0.0% |
| Mobile Home / Other | 1 | 2.7% |
| Total | 37 | 100.0% |
Housing Structures by Occupancy in Tuscumbia
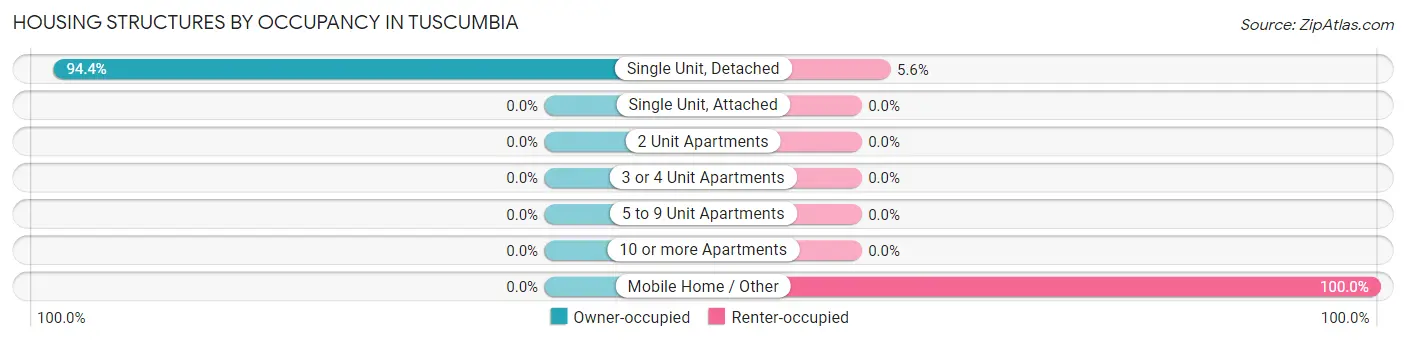
| Structure Type | Owner-occupied | Renter-occupied |
| Single Unit, Detached | 34 (94.4%) | 2 (5.6%) |
| Single Unit, Attached | 0 (0.0%) | 0 (0.0%) |
| 2 Unit Apartments | 0 (0.0%) | 0 (0.0%) |
| 3 or 4 Unit Apartments | 0 (0.0%) | 0 (0.0%) |
| 5 to 9 Unit Apartments | 0 (0.0%) | 0 (0.0%) |
| 10 or more Apartments | 0 (0.0%) | 0 (0.0%) |
| Mobile Home / Other | 0 (0.0%) | 1 (100.0%) |
| Total | 34 (91.9%) | 3 (8.1%) |
Housing Structures by Number of Rooms in Tuscumbia
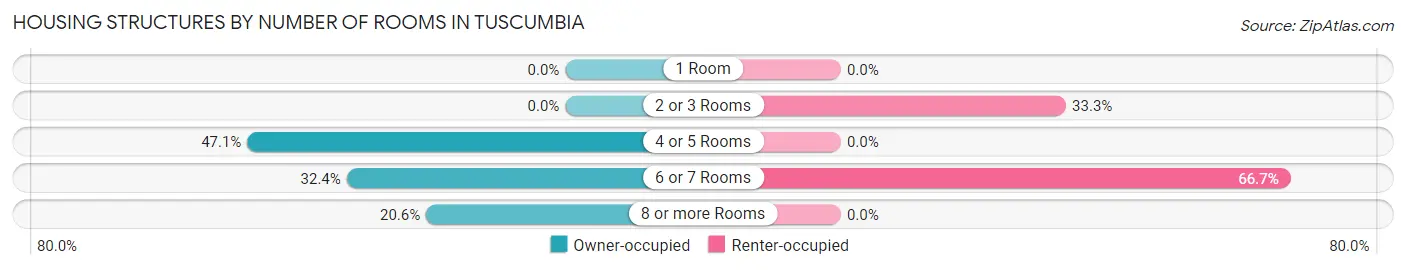
| Number of Rooms | Owner-occupied | Renter-occupied |
| 1 Room | 0 (0.0%) | 0 (0.0%) |
| 2 or 3 Rooms | 0 (0.0%) | 1 (33.3%) |
| 4 or 5 Rooms | 16 (47.1%) | 0 (0.0%) |
| 6 or 7 Rooms | 11 (32.4%) | 2 (66.7%) |
| 8 or more Rooms | 7 (20.6%) | 0 (0.0%) |
| Total | 34 (100.0%) | 3 (100.0%) |
Housing Structure by Heating Type in Tuscumbia
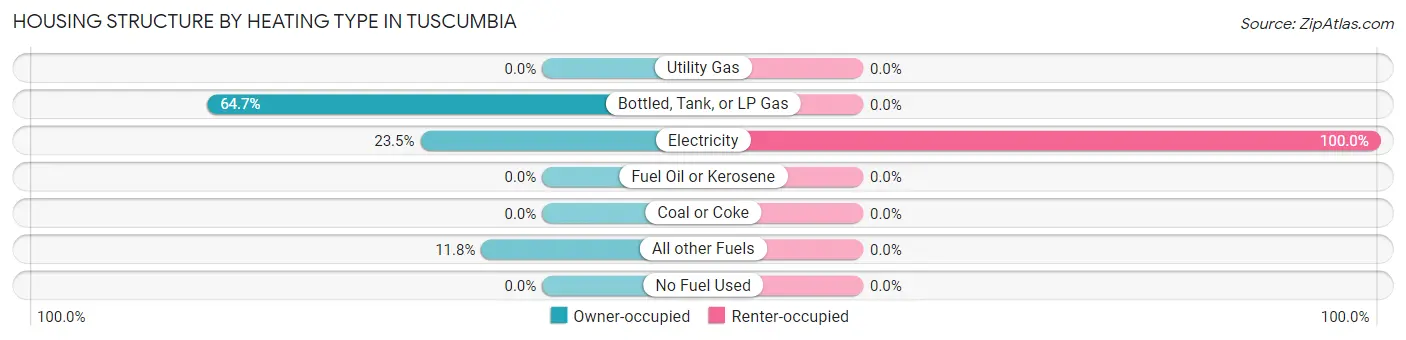
| Heating Type | Owner-occupied | Renter-occupied |
| Utility Gas | 0 (0.0%) | 0 (0.0%) |
| Bottled, Tank, or LP Gas | 22 (64.7%) | 0 (0.0%) |
| Electricity | 8 (23.5%) | 3 (100.0%) |
| Fuel Oil or Kerosene | 0 (0.0%) | 0 (0.0%) |
| Coal or Coke | 0 (0.0%) | 0 (0.0%) |
| All other Fuels | 4 (11.8%) | 0 (0.0%) |
| No Fuel Used | 0 (0.0%) | 0 (0.0%) |
| Total | 34 (100.0%) | 3 (100.0%) |
Household Vehicle Usage in Tuscumbia
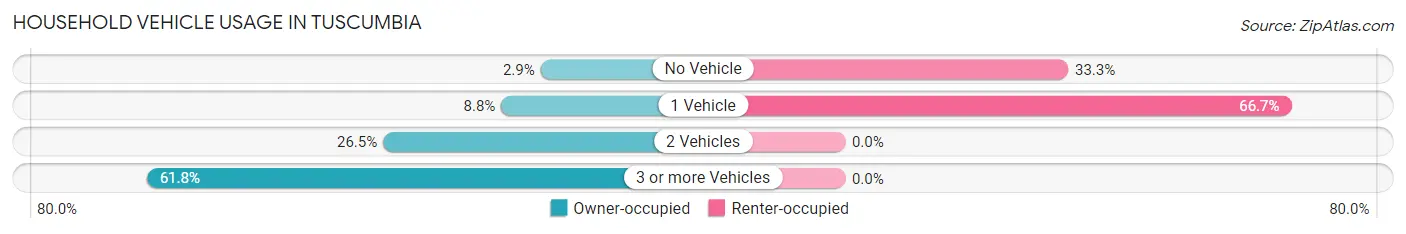
| Vehicles per Household | Owner-occupied | Renter-occupied |
| No Vehicle | 1 (2.9%) | 1 (33.3%) |
| 1 Vehicle | 3 (8.8%) | 2 (66.7%) |
| 2 Vehicles | 9 (26.5%) | 0 (0.0%) |
| 3 or more Vehicles | 21 (61.8%) | 0 (0.0%) |
| Total | 34 (100.0%) | 3 (100.0%) |
Real Estate & Mortgages in Tuscumbia
Real Estate and Mortgage Overview in Tuscumbia
| Characteristic | Without Mortgage | With Mortgage |
| Housing Units | 14 | 20 |
| Median Property Value | $105,000 | $139,600 |
| Median Household Income | - | - |
| Monthly Housing Costs | $338 | $0 |
| Real Estate Taxes | $533 | $0 |
Property Value by Mortgage Status in Tuscumbia
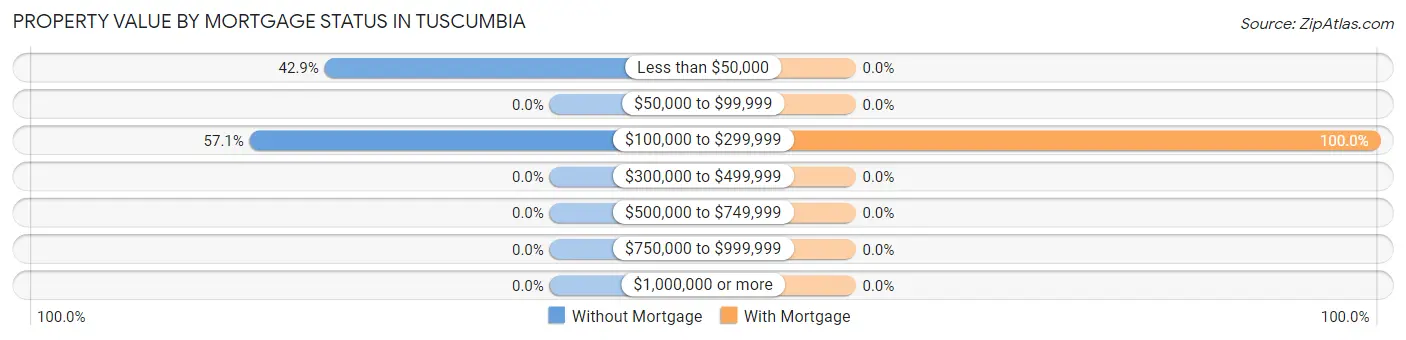
| Property Value | Without Mortgage | With Mortgage |
| Less than $50,000 | 6 (42.9%) | 0 (0.0%) |
| $50,000 to $99,999 | 0 (0.0%) | 0 (0.0%) |
| $100,000 to $299,999 | 8 (57.1%) | 20 (100.0%) |
| $300,000 to $499,999 | 0 (0.0%) | 0 (0.0%) |
| $500,000 to $749,999 | 0 (0.0%) | 0 (0.0%) |
| $750,000 to $999,999 | 0 (0.0%) | 0 (0.0%) |
| $1,000,000 or more | 0 (0.0%) | 0 (0.0%) |
| Total | 14 (100.0%) | 20 (100.0%) |
Household Income by Mortgage Status in Tuscumbia
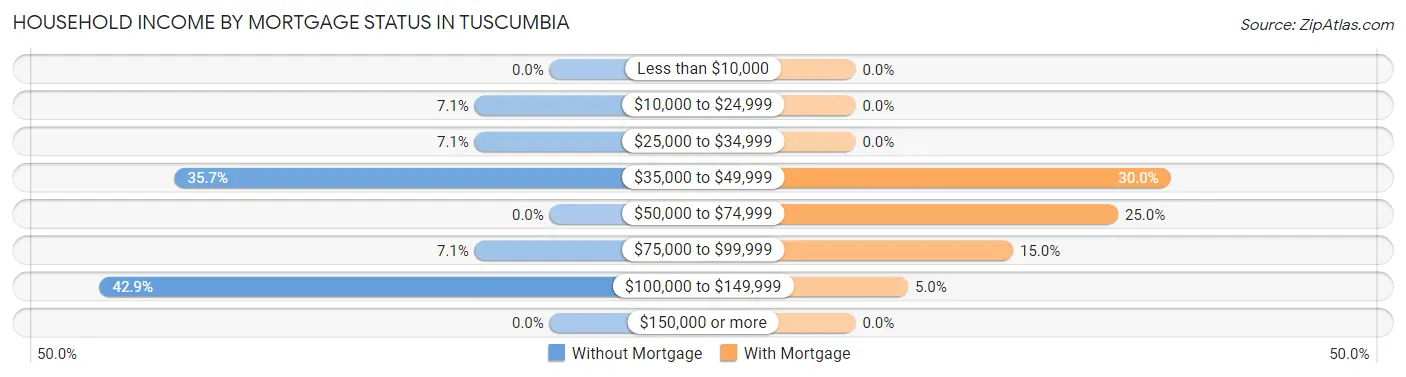
| Household Income | Without Mortgage | With Mortgage |
| Less than $10,000 | 0 (0.0%) | 0 (0.0%) |
| $10,000 to $24,999 | 1 (7.1%) | 0 (0.0%) |
| $25,000 to $34,999 | 1 (7.1%) | 0 (0.0%) |
| $35,000 to $49,999 | 5 (35.7%) | 6 (30.0%) |
| $50,000 to $74,999 | 0 (0.0%) | 5 (25.0%) |
| $75,000 to $99,999 | 1 (7.1%) | 3 (15.0%) |
| $100,000 to $149,999 | 6 (42.9%) | 1 (5.0%) |
| $150,000 or more | 0 (0.0%) | 0 (0.0%) |
| Total | 14 (100.0%) | 20 (100.0%) |
Property Value to Household Income Ratio in Tuscumbia
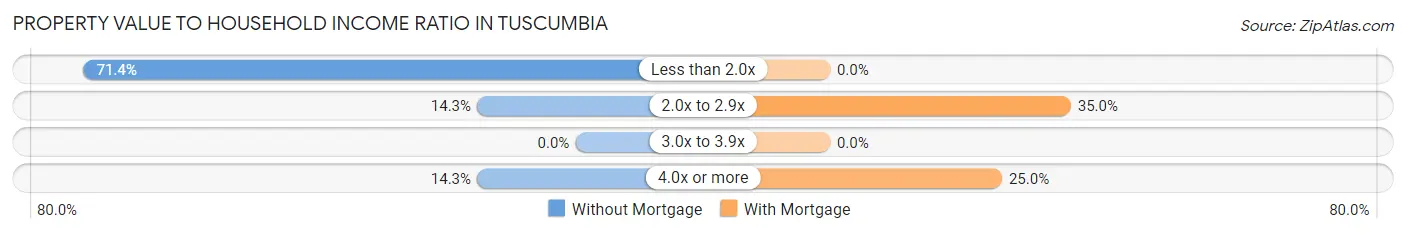
| Value-to-Income Ratio | Without Mortgage | With Mortgage |
| Less than 2.0x | 10 (71.4%) | 0 (0.0%) |
| 2.0x to 2.9x | 2 (14.3%) | 7 (35.0%) |
| 3.0x to 3.9x | 0 (0.0%) | 0 (0.0%) |
| 4.0x or more | 2 (14.3%) | 5 (25.0%) |
| Total | 14 (100.0%) | 20 (100.0%) |
Real Estate Taxes by Mortgage Status in Tuscumbia
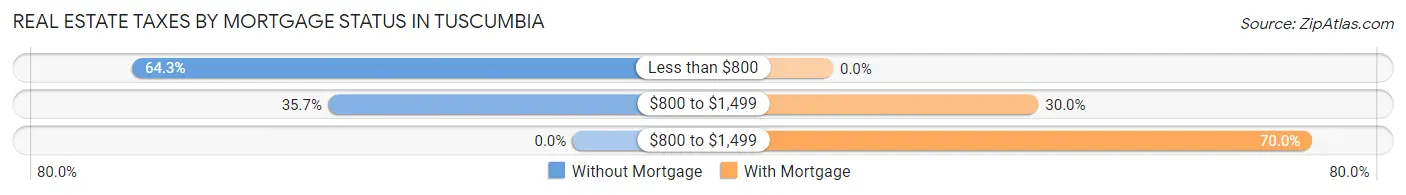
| Property Taxes | Without Mortgage | With Mortgage |
| Less than $800 | 9 (64.3%) | 0 (0.0%) |
| $800 to $1,499 | 5 (35.7%) | 6 (30.0%) |
| $800 to $1,499 | 0 (0.0%) | 14 (70.0%) |
| Total | 14 (100.0%) | 20 (100.0%) |
Health & Disability in Tuscumbia
Health Insurance Coverage by Age in Tuscumbia
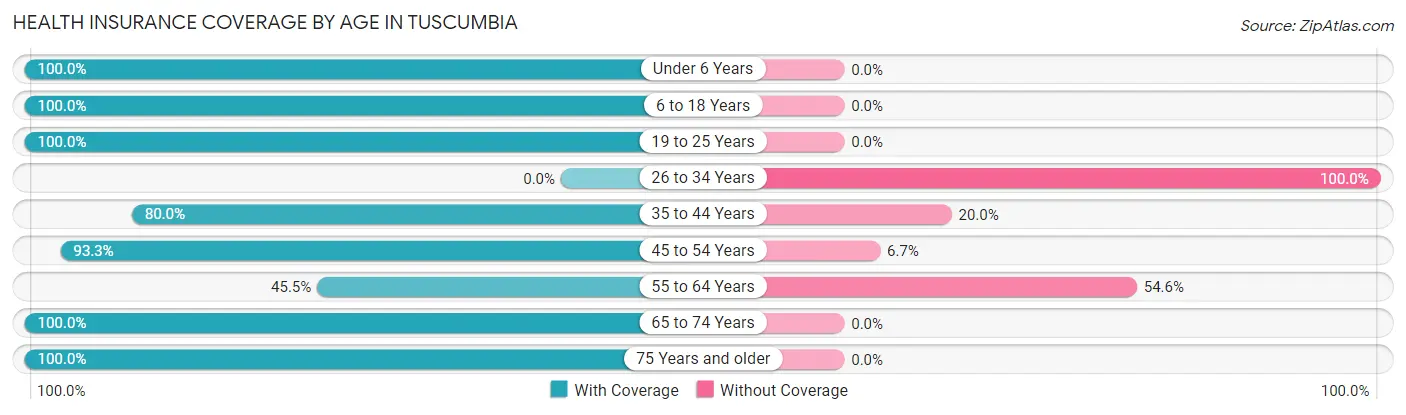
| Age Bracket | With Coverage | Without Coverage |
| Under 6 Years | 4 (100.0%) | 0 (0.0%) |
| 6 to 18 Years | 27 (100.0%) | 0 (0.0%) |
| 19 to 25 Years | 4 (100.0%) | 0 (0.0%) |
| 26 to 34 Years | 0 (0.0%) | 3 (100.0%) |
| 35 to 44 Years | 4 (80.0%) | 1 (20.0%) |
| 45 to 54 Years | 14 (93.3%) | 1 (6.7%) |
| 55 to 64 Years | 5 (45.5%) | 6 (54.5%) |
| 65 to 74 Years | 21 (100.0%) | 0 (0.0%) |
| 75 Years and older | 2 (100.0%) | 0 (0.0%) |
| Total | 81 (88.0%) | 11 (12.0%) |
Health Insurance Coverage by Citizenship Status in Tuscumbia
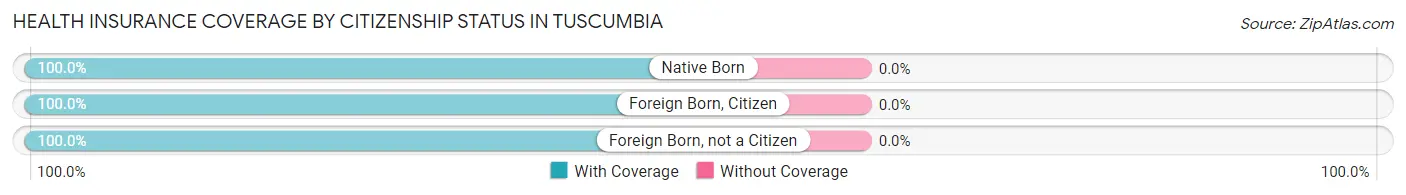
| Citizenship Status | With Coverage | Without Coverage |
| Native Born | 4 (100.0%) | 0 (0.0%) |
| Foreign Born, Citizen | 27 (100.0%) | 0 (0.0%) |
| Foreign Born, not a Citizen | 4 (100.0%) | 0 (0.0%) |
Health Insurance Coverage by Household Income in Tuscumbia
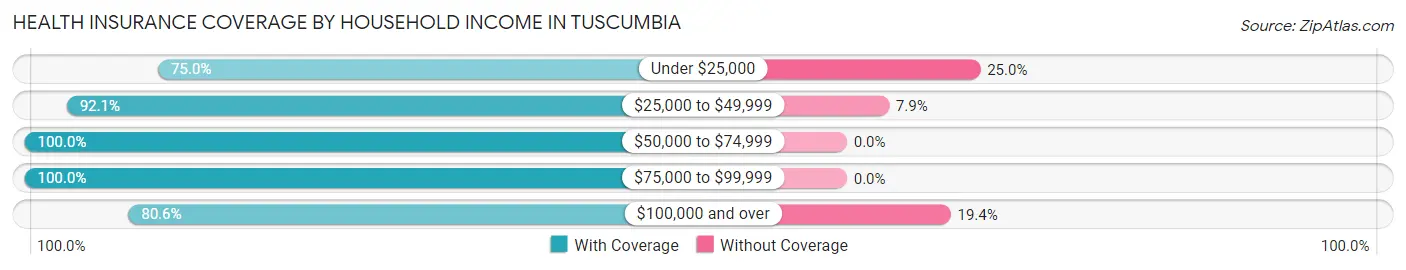
| Household Income | With Coverage | Without Coverage |
| Under $25,000 | 3 (75.0%) | 1 (25.0%) |
| $25,000 to $49,999 | 35 (92.1%) | 3 (7.9%) |
| $50,000 to $74,999 | 6 (100.0%) | 0 (0.0%) |
| $75,000 to $99,999 | 8 (100.0%) | 0 (0.0%) |
| $100,000 and over | 29 (80.6%) | 7 (19.4%) |
Public vs Private Health Insurance Coverage by Age in Tuscumbia
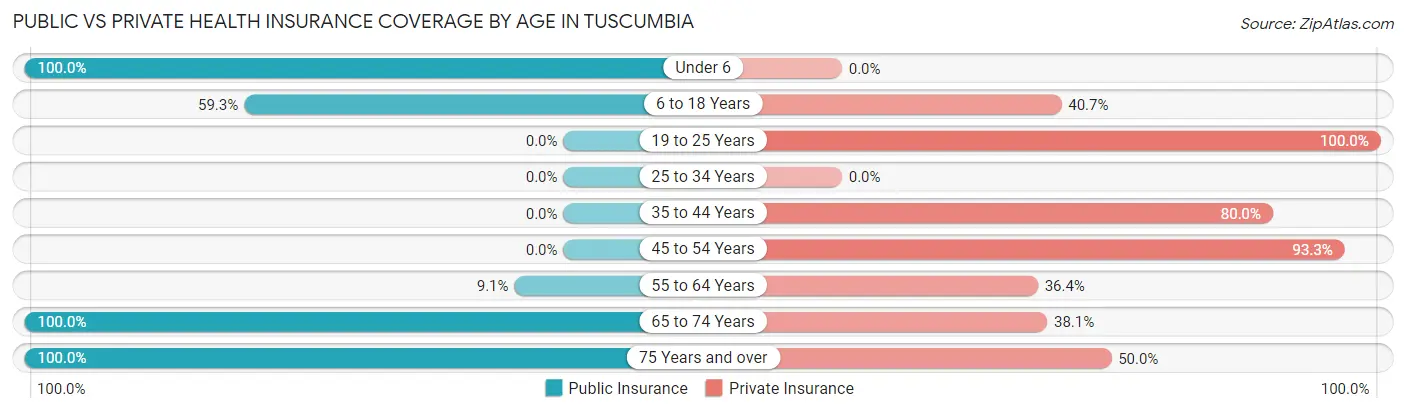
| Age Bracket | Public Insurance | Private Insurance |
| Under 6 | 4 (100.0%) | 0 (0.0%) |
| 6 to 18 Years | 16 (59.3%) | 11 (40.7%) |
| 19 to 25 Years | 0 (0.0%) | 4 (100.0%) |
| 25 to 34 Years | 0 (0.0%) | 0 (0.0%) |
| 35 to 44 Years | 0 (0.0%) | 4 (80.0%) |
| 45 to 54 Years | 0 (0.0%) | 14 (93.3%) |
| 55 to 64 Years | 1 (9.1%) | 4 (36.4%) |
| 65 to 74 Years | 21 (100.0%) | 8 (38.1%) |
| 75 Years and over | 2 (100.0%) | 1 (50.0%) |
| Total | 44 (47.8%) | 46 (50.0%) |
Disability Status by Sex by Age in Tuscumbia
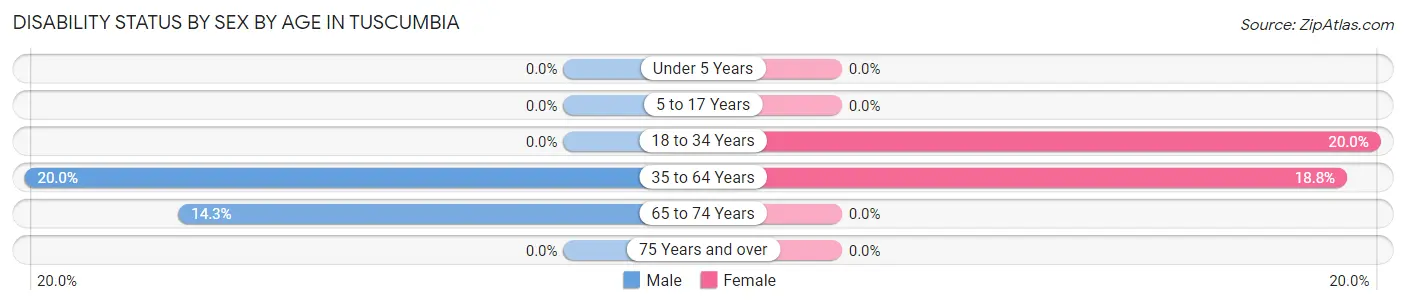
| Age Bracket | Male | Female |
| Under 5 Years | 0 (0.0%) | 0 (0.0%) |
| 5 to 17 Years | 0 (0.0%) | 0 (0.0%) |
| 18 to 34 Years | 0 (0.0%) | 1 (20.0%) |
| 35 to 64 Years | 3 (20.0%) | 3 (18.8%) |
| 65 to 74 Years | 1 (14.3%) | 0 (0.0%) |
| 75 Years and over | 0 (0.0%) | 0 (0.0%) |
Disability Class by Sex by Age in Tuscumbia
Disability Class: Hearing Difficulty
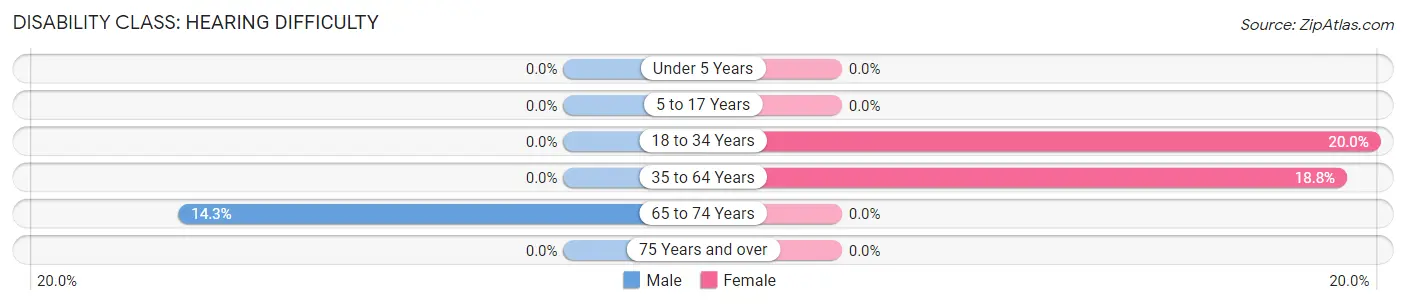
| Age Bracket | Male | Female |
| Under 5 Years | 0 (0.0%) | 0 (0.0%) |
| 5 to 17 Years | 0 (0.0%) | 0 (0.0%) |
| 18 to 34 Years | 0 (0.0%) | 1 (20.0%) |
| 35 to 64 Years | 0 (0.0%) | 3 (18.8%) |
| 65 to 74 Years | 1 (14.3%) | 0 (0.0%) |
| 75 Years and over | 0 (0.0%) | 0 (0.0%) |
Disability Class: Vision Difficulty
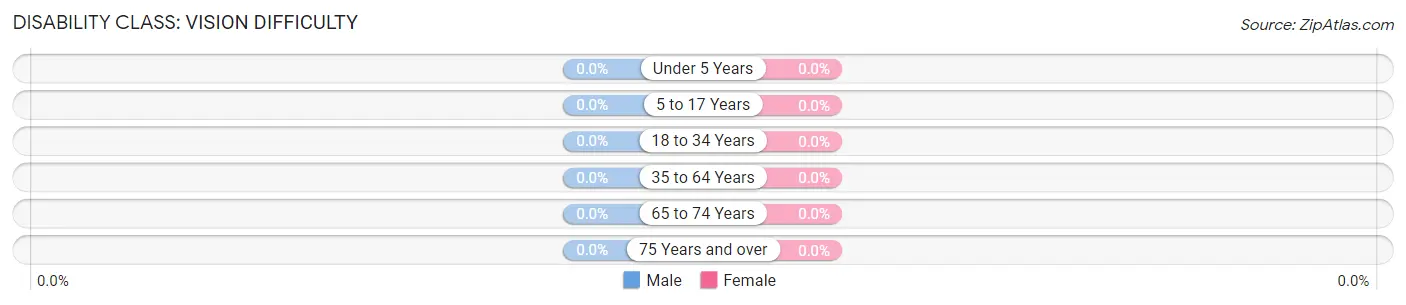
| Age Bracket | Male | Female |
| Under 5 Years | 0 (0.0%) | 0 (0.0%) |
| 5 to 17 Years | 0 (0.0%) | 0 (0.0%) |
| 18 to 34 Years | 0 (0.0%) | 0 (0.0%) |
| 35 to 64 Years | 0 (0.0%) | 0 (0.0%) |
| 65 to 74 Years | 0 (0.0%) | 0 (0.0%) |
| 75 Years and over | 0 (0.0%) | 0 (0.0%) |
Disability Class: Cognitive Difficulty

| Age Bracket | Male | Female |
| 5 to 17 Years | 0 (0.0%) | 0 (0.0%) |
| 18 to 34 Years | 0 (0.0%) | 0 (0.0%) |
| 35 to 64 Years | 1 (6.7%) | 0 (0.0%) |
| 65 to 74 Years | 0 (0.0%) | 0 (0.0%) |
| 75 Years and over | 0 (0.0%) | 0 (0.0%) |
Disability Class: Ambulatory Difficulty
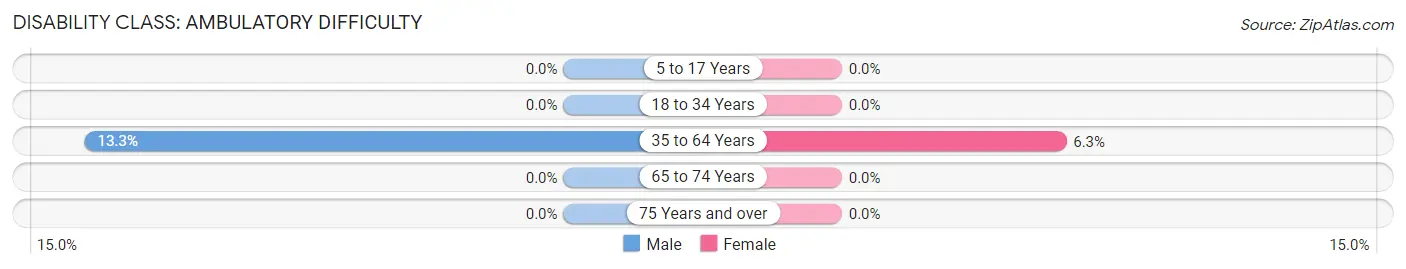
| Age Bracket | Male | Female |
| 5 to 17 Years | 0 (0.0%) | 0 (0.0%) |
| 18 to 34 Years | 0 (0.0%) | 0 (0.0%) |
| 35 to 64 Years | 2 (13.3%) | 1 (6.2%) |
| 65 to 74 Years | 0 (0.0%) | 0 (0.0%) |
| 75 Years and over | 0 (0.0%) | 0 (0.0%) |
Disability Class: Self-Care Difficulty
| Age Bracket | Male | Female |
| 5 to 17 Years | 0 (0.0%) | 0 (0.0%) |
| 18 to 34 Years | 0 (0.0%) | 0 (0.0%) |
| 35 to 64 Years | 0 (0.0%) | 0 (0.0%) |
| 65 to 74 Years | 0 (0.0%) | 0 (0.0%) |
| 75 Years and over | 0 (0.0%) | 0 (0.0%) |
Technology Access in Tuscumbia
Computing Device Access in Tuscumbia
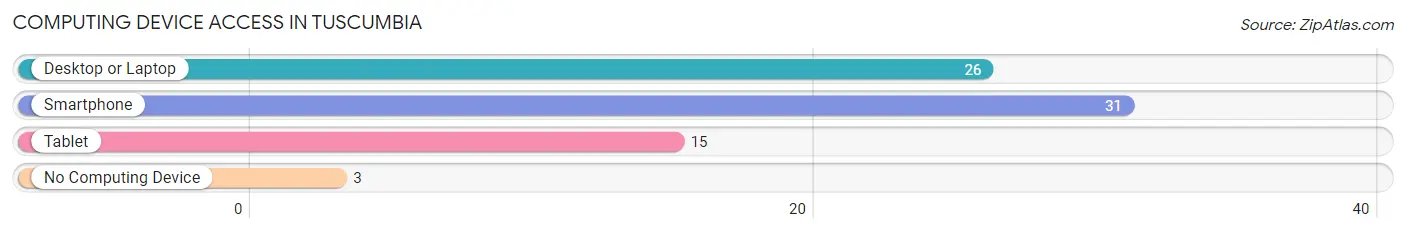
| Device Type | # Households | % Households |
| Desktop or Laptop | 26 | 70.3% |
| Smartphone | 31 | 83.8% |
| Tablet | 15 | 40.5% |
| No Computing Device | 3 | 8.1% |
| Total | 37 | 100.0% |
Internet Access in Tuscumbia
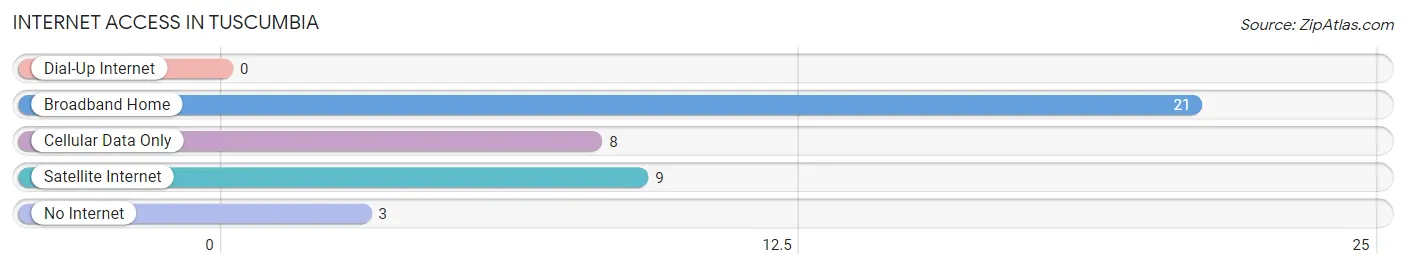
| Internet Type | # Households | % Households |
| Dial-Up Internet | 0 | 0.0% |
| Broadband Home | 21 | 56.8% |
| Cellular Data Only | 8 | 21.6% |
| Satellite Internet | 9 | 24.3% |
| No Internet | 3 | 8.1% |
| Total | 37 | 100.0% |
Tuscumbia Summary
Tuscumbia is a small city located in Miller County, Missouri, United States. It is situated on the banks of the Osage River, approximately 20 miles south of the state capital, Jefferson City. The city has a population of 1,845 as of the 2010 census, and is the county seat of Miller County.
History
Tuscumbia was founded in 1837 by a group of settlers from Kentucky and Tennessee. The city was named after the Tuscarora tribe of Native Americans who had once lived in the area. The city was incorporated in 1845 and was the first town in Miller County.
Tuscumbia was an important stop on the Hannibal and St. Joseph Railroad, which ran from Hannibal, Missouri to St. Joseph, Missouri. The railroad was completed in 1859 and was the first transcontinental railroad in the United States. The railroad brought increased economic activity to the area, and Tuscumbia became a hub for trade and commerce.
During the Civil War, Tuscumbia was the site of a major battle between Union and Confederate forces. The Battle of Tuscumbia was fought on October 22, 1864, and resulted in a Confederate victory.
Geography
Tuscumbia is located in Miller County, Missouri, at the intersection of U.S. Route 54 and Missouri Route 17. The city is situated on the banks of the Osage River, approximately 20 miles south of the state capital, Jefferson City.
The city has a total area of 1.3 square miles, all of which is land. The city is located in the Ozark Mountains region of Missouri, and is surrounded by rolling hills and forests.
Economy
Tuscumbia’s economy is largely based on agriculture and tourism. The city is home to several farms, which produce a variety of crops, including corn, soybeans, wheat, and hay. The city is also home to several wineries, which produce a variety of wines.
Tourism is an important part of the city’s economy. Tuscumbia is home to several historic sites, including the Battle of Tuscumbia site, the Miller County Courthouse, and the Tuscumbia Cemetery. The city is also home to several parks, including the Tuscumbia City Park and the Osage River State Park.
Demographics
As of the 2010 census, Tuscumbia had a population of 1,845. The racial makeup of the city was 95.2% White, 0.7% African American, 0.3% Native American, 0.2% Asian, 0.1% Pacific Islander, 1.2% from other races, and 2.3% from two or more races. Hispanic or Latino of any race were 3.2% of the population.
The median household income in Tuscumbia was $37,917, and the median family income was $45,625. The per capita income for the city was $18,945. About 11.2% of families and 14.2% of the population were below the poverty line, including 19.2% of those under age 18 and 8.3% of those age 65 or over.
Common Questions
What is Per Capita Income in Tuscumbia?
Per Capita income in Tuscumbia is $24,486.
What is the Median Family Income in Tuscumbia?
Median Family Income in Tuscumbia is $66,250.
What is the Median Household income in Tuscumbia?
Median Household Income in Tuscumbia is $44,375.
What is Inequality or Gini Index in Tuscumbia?
Inequality or Gini Index in Tuscumbia is 0.40.
What is the Total Population of Tuscumbia?
Total Population of Tuscumbia is 148.
What is the Total Male Population of Tuscumbia?
Total Male Population of Tuscumbia is 88.
What is the Total Female Population of Tuscumbia?
Total Female Population of Tuscumbia is 60.
What is the Ratio of Males per 100 Females in Tuscumbia?
There are 146.67 Males per 100 Females in Tuscumbia.
What is the Ratio of Females per 100 Males in Tuscumbia?
There are 68.18 Females per 100 Males in Tuscumbia.
What is the Median Population Age in Tuscumbia?
Median Population Age in Tuscumbia is 40.4 Years.
What is the Average Family Size in Tuscumbia
Average Family Size in Tuscumbia is 3.0 People.
What is the Average Household Size in Tuscumbia
Average Household Size in Tuscumbia is 2.5 People.
How Large is the Labor Force in Tuscumbia?
There are 56 People in the Labor Forcein in Tuscumbia.
What is the Percentage of People in the Labor Force in Tuscumbia?
42.7% of People are in the Labor Force in Tuscumbia.
What is the Unemployment Rate in Tuscumbia?
Unemployment Rate in Tuscumbia is 5.4%.