Warrensburg, MO Map & Demographics
Warrensburg Map
Warrensburg Overview
$29,092
PER CAPITA INCOME
$81,205
AVG FAMILY INCOME
$54,535
AVG HOUSEHOLD INCOME
37.7%
WAGE / INCOME GAP [ % ]
62.3¢/ $1
WAGE / INCOME GAP [ $ ]
$9,054
FAMILY INCOME DEFICIT
0.45
INEQUALITY / GINI INDEX
19,317
TOTAL POPULATION
9,597
MALE POPULATION
9,720
FEMALE POPULATION
98.73
MALES / 100 FEMALES
101.28
FEMALES / 100 MALES
24.4
MEDIAN AGE
2.9
AVG FAMILY SIZE
2.2
AVG HOUSEHOLD SIZE
10,529
LABOR FORCE [ PEOPLE ]
64.8%
PERCENT IN LABOR FORCE
6.8%
UNEMPLOYMENT RATE
Warrensburg Zip Codes
Warrensburg Area Codes
Income in Warrensburg
Income Overview in Warrensburg
Per Capita Income in Warrensburg is $29,092, while median incomes of families and households are $81,205 and $54,535 respectively.
| Characteristic | Number | Measure |
| Per Capita Income | 19,317 | $29,092 |
| Median Family Income | 3,517 | $81,205 |
| Mean Family Income | 3,517 | $104,434 |
| Median Household Income | 7,246 | $54,535 |
| Mean Household Income | 7,246 | $74,003 |
| Income Deficit | 3,517 | $9,054 |
| Wage / Income Gap (%) | 19,317 | 37.71% |
| Wage / Income Gap ($) | 19,317 | 62.29¢ per $1 |
| Gini / Inequality Index | 19,317 | 0.45 |
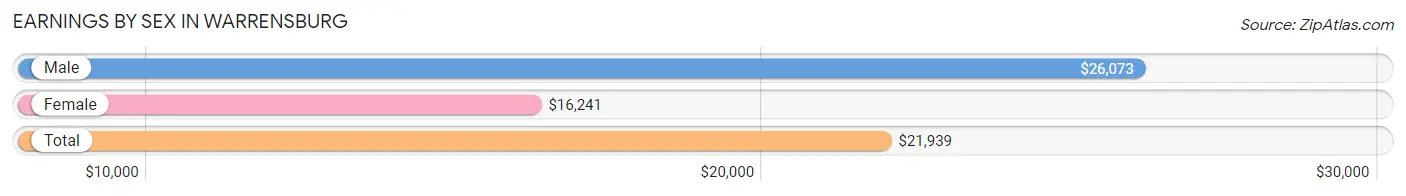
Earnings by Sex in Warrensburg
Average Earnings in Warrensburg are $21,939, $26,073 for men and $16,241 for women, a difference of 37.7%.
| Sex | Number | Average Earnings |
| Male | 6,265 (50.3%) | $26,073 |
| Female | 6,181 (49.7%) | $16,241 |
| Total | 12,446 (100.0%) | $21,939 |
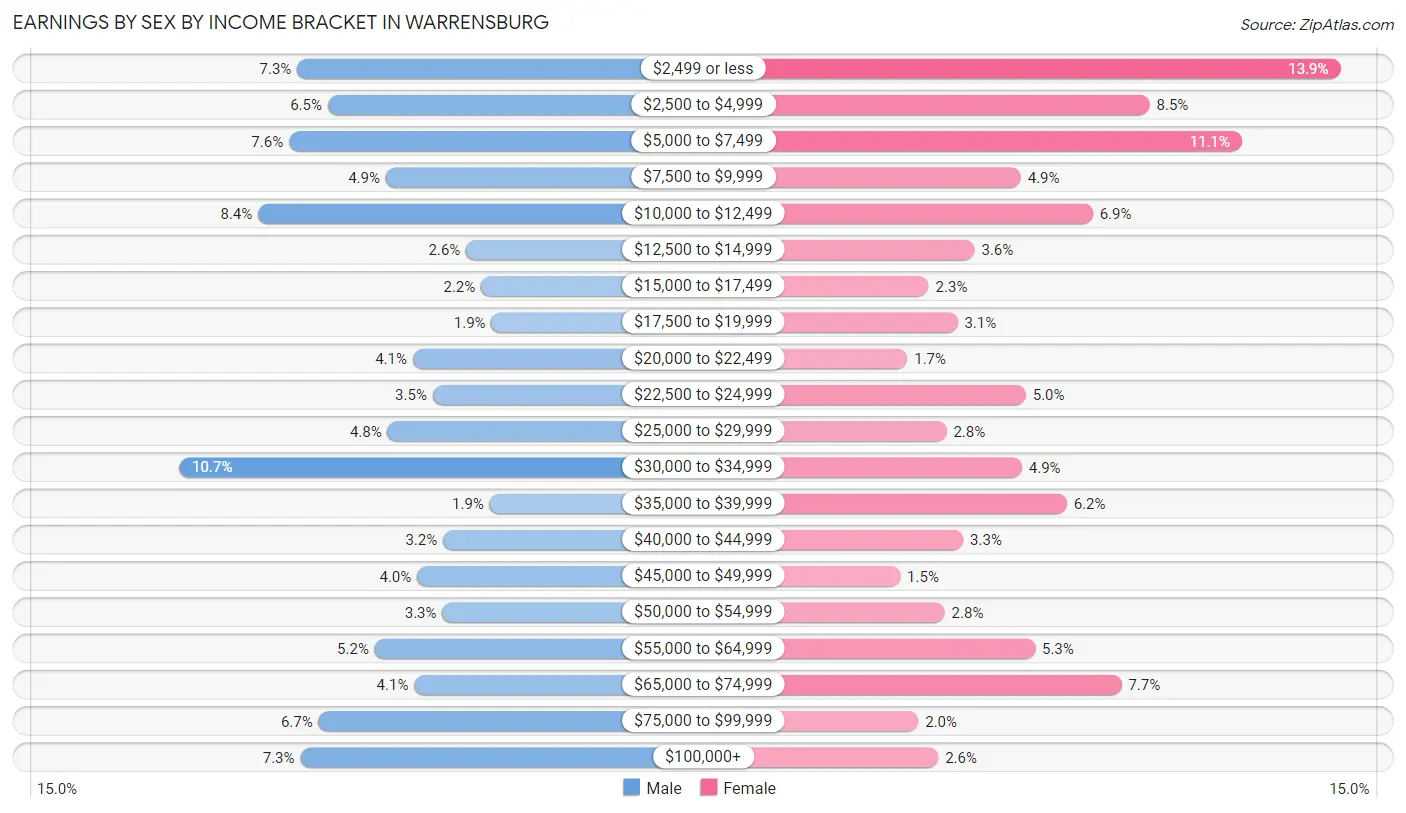
Earnings by Sex by Income Bracket in Warrensburg
The most common earnings brackets in Warrensburg are $30,000 to $34,999 for men (668 | 10.7%) and $2,499 or less for women (857 | 13.9%).
| Income | Male | Female |
| $2,499 or less | 460 (7.3%) | 857 (13.9%) |
| $2,500 to $4,999 | 406 (6.5%) | 526 (8.5%) |
| $5,000 to $7,499 | 474 (7.6%) | 686 (11.1%) |
| $7,500 to $9,999 | 304 (4.9%) | 302 (4.9%) |
| $10,000 to $12,499 | 529 (8.4%) | 427 (6.9%) |
| $12,500 to $14,999 | 162 (2.6%) | 222 (3.6%) |
| $15,000 to $17,499 | 136 (2.2%) | 142 (2.3%) |
| $17,500 to $19,999 | 118 (1.9%) | 192 (3.1%) |
| $20,000 to $22,499 | 256 (4.1%) | 105 (1.7%) |
| $22,500 to $24,999 | 221 (3.5%) | 311 (5.0%) |
| $25,000 to $29,999 | 301 (4.8%) | 173 (2.8%) |
| $30,000 to $34,999 | 668 (10.7%) | 304 (4.9%) |
| $35,000 to $39,999 | 121 (1.9%) | 382 (6.2%) |
| $40,000 to $44,999 | 203 (3.2%) | 202 (3.3%) |
| $45,000 to $49,999 | 249 (4.0%) | 93 (1.5%) |
| $50,000 to $54,999 | 204 (3.3%) | 170 (2.8%) |
| $55,000 to $64,999 | 323 (5.2%) | 327 (5.3%) |
| $65,000 to $74,999 | 254 (4.1%) | 477 (7.7%) |
| $75,000 to $99,999 | 422 (6.7%) | 124 (2.0%) |
| $100,000+ | 454 (7.2%) | 159 (2.6%) |
| Total | 6,265 (100.0%) | 6,181 (100.0%) |
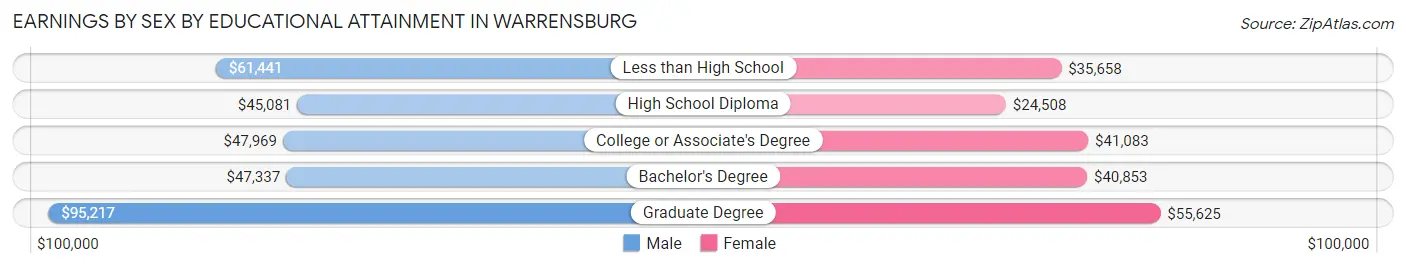
Earnings by Sex by Educational Attainment in Warrensburg
Average earnings in Warrensburg are $51,183 for men and $39,696 for women, a difference of 22.4%. Men with an educational attainment of graduate degree enjoy the highest average annual earnings of $95,217, while those with high school diploma education earn the least with $45,081. Women with an educational attainment of graduate degree earn the most with the average annual earnings of $55,625, while those with high school diploma education have the smallest earnings of $24,508.
| Educational Attainment | Male Income | Female Income |
| Less than High School | $61,441 | $35,658 |
| High School Diploma | $45,081 | $24,508 |
| College or Associate's Degree | $47,969 | $41,083 |
| Bachelor's Degree | $47,337 | $40,853 |
| Graduate Degree | $95,217 | $55,625 |
| Total | $51,183 | $39,696 |
Family Income in Warrensburg
Family Income Brackets in Warrensburg
According to the Warrensburg family income data, there are 834 families falling into the $100,000 to $149,999 income range, which is the most common income bracket and makes up 23.7% of all families. Conversely, the $10,000 to $14,999 income bracket is the least frequent group with only 63 families (1.8%) belonging to this category.
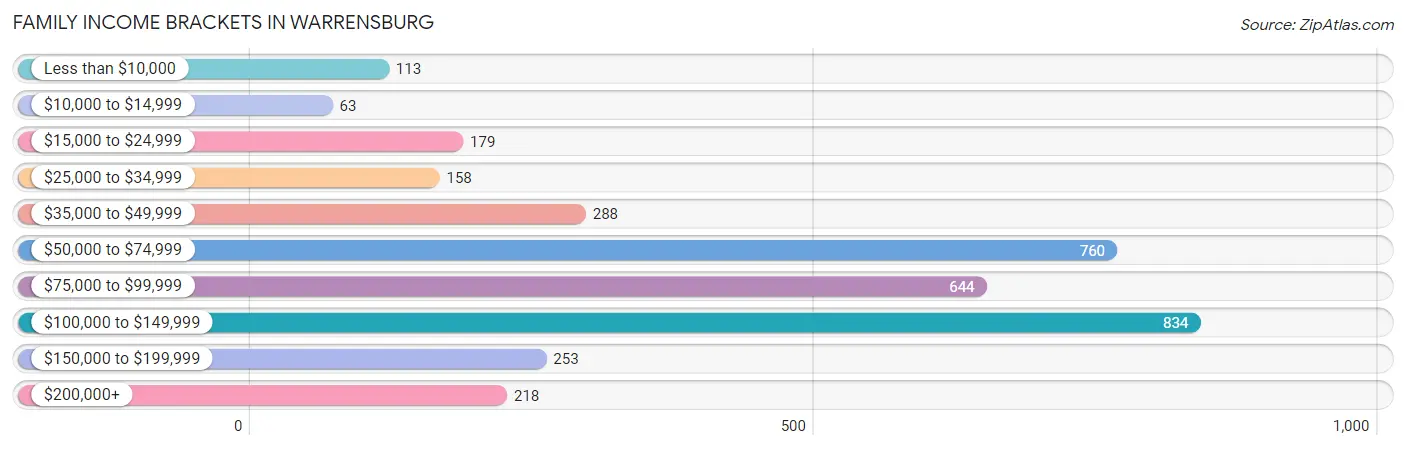
| Income Bracket | # Families | % Families |
| Less than $10,000 | 113 | 3.2% |
| $10,000 to $14,999 | 63 | 1.8% |
| $15,000 to $24,999 | 179 | 5.1% |
| $25,000 to $34,999 | 158 | 4.5% |
| $35,000 to $49,999 | 288 | 8.2% |
| $50,000 to $74,999 | 760 | 21.6% |
| $75,000 to $99,999 | 644 | 18.3% |
| $100,000 to $149,999 | 834 | 23.7% |
| $150,000 to $199,999 | 253 | 7.2% |
| $200,000+ | 218 | 6.2% |
Family Income by Famaliy Size in Warrensburg
6-person families (119 | 3.4%) account for the highest median family income in Warrensburg with $123,250 per family, while 2-person families (1,691 | 48.1%) have the highest median income of $34,058 per family member.
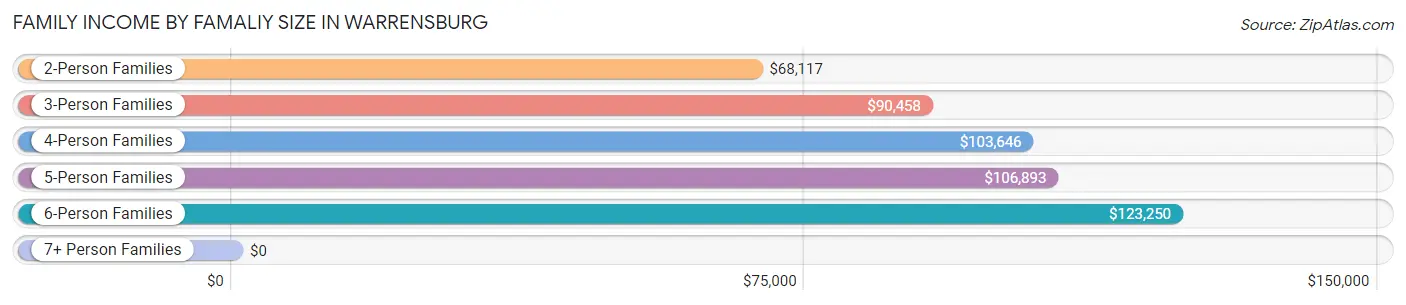
| Income Bracket | # Families | Median Income |
| 2-Person Families | 1,691 (48.1%) | $68,117 |
| 3-Person Families | 841 (23.9%) | $90,458 |
| 4-Person Families | 613 (17.4%) | $103,646 |
| 5-Person Families | 237 (6.7%) | $106,893 |
| 6-Person Families | 119 (3.4%) | $123,250 |
| 7+ Person Families | 16 (0.4%) | $0 |
| Total | 3,517 (100.0%) | $81,205 |
Family Income by Number of Earners in Warrensburg
The median family income in Warrensburg is $81,205, with families comprising 3+ earners (273) having the highest median family income of $106,321, while families with 1 earner (1,098) have the lowest median family income of $63,242, accounting for 7.8% and 31.2% of families, respectively.
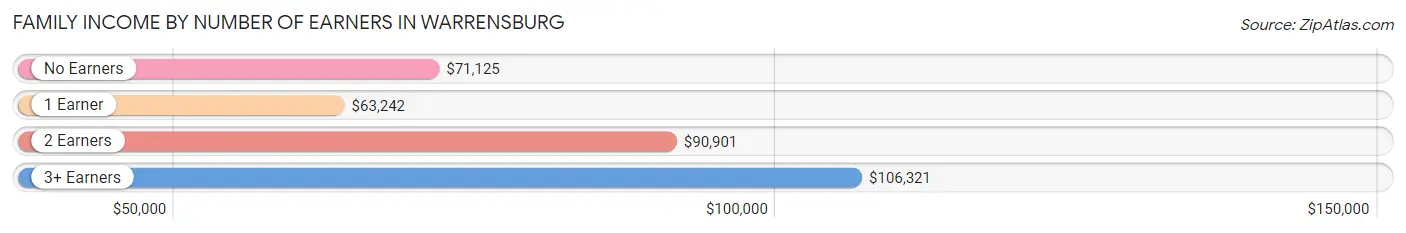
| Number of Earners | # Families | Median Income |
| No Earners | 383 (10.9%) | $71,125 |
| 1 Earner | 1,098 (31.2%) | $63,242 |
| 2 Earners | 1,763 (50.1%) | $90,901 |
| 3+ Earners | 273 (7.8%) | $106,321 |
| Total | 3,517 (100.0%) | $81,205 |
Household Income in Warrensburg
Household Income Brackets in Warrensburg
With 1,638 households falling in the category, the $50,000 to $74,999 income range is the most frequent in Warrensburg, accounting for 22.6% of all households. In contrast, only 225 households (3.1%) fall into the $200,000+ income bracket, making it the least populous group.
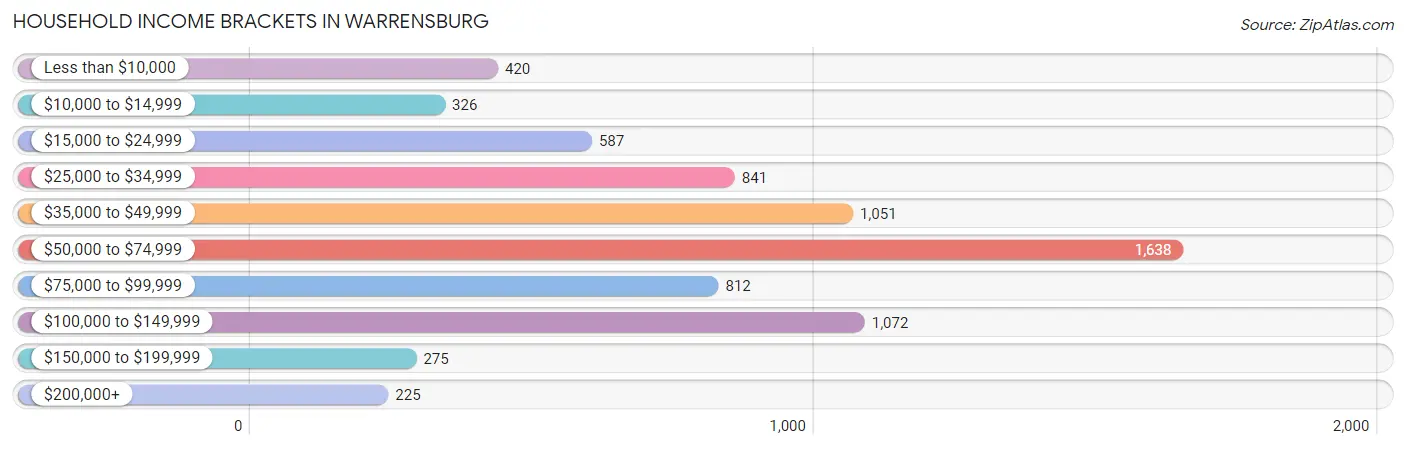
| Income Bracket | # Households | % Households |
| Less than $10,000 | 420 | 5.8% |
| $10,000 to $14,999 | 326 | 4.5% |
| $15,000 to $24,999 | 587 | 8.1% |
| $25,000 to $34,999 | 841 | 11.6% |
| $35,000 to $49,999 | 1,051 | 14.5% |
| $50,000 to $74,999 | 1,638 | 22.6% |
| $75,000 to $99,999 | 812 | 11.2% |
| $100,000 to $149,999 | 1,072 | 14.8% |
| $150,000 to $199,999 | 275 | 3.8% |
| $200,000+ | 225 | 3.1% |
Household Income by Householder Age in Warrensburg
The median household income in Warrensburg is $54,535, with the highest median household income of $78,839 found in the 45 to 64 years age bracket for the primary householder. A total of 1,844 households (25.5%) fall into this category. Meanwhile, the 15 to 24 years age bracket for the primary householder has the lowest median household income of $33,869, with 1,747 households (24.1%) in this group.
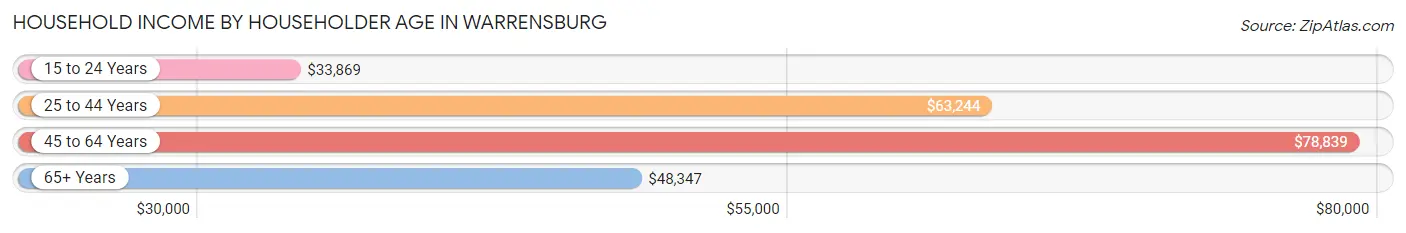
| Income Bracket | # Households | Median Income |
| 15 to 24 Years | 1,747 (24.1%) | $33,869 |
| 25 to 44 Years | 2,396 (33.1%) | $63,244 |
| 45 to 64 Years | 1,844 (25.5%) | $78,839 |
| 65+ Years | 1,259 (17.4%) | $48,347 |
| Total | 7,246 (100.0%) | $54,535 |
Poverty in Warrensburg
Income Below Poverty by Sex and Age in Warrensburg
With 17.1% poverty level for males and 22.4% for females among the residents of Warrensburg, 18 to 24 year old males and 18 to 24 year old females are the most vulnerable to poverty, with 880 males (40.9%) and 1,255 females (61.7%) in their respective age groups living below the poverty level.
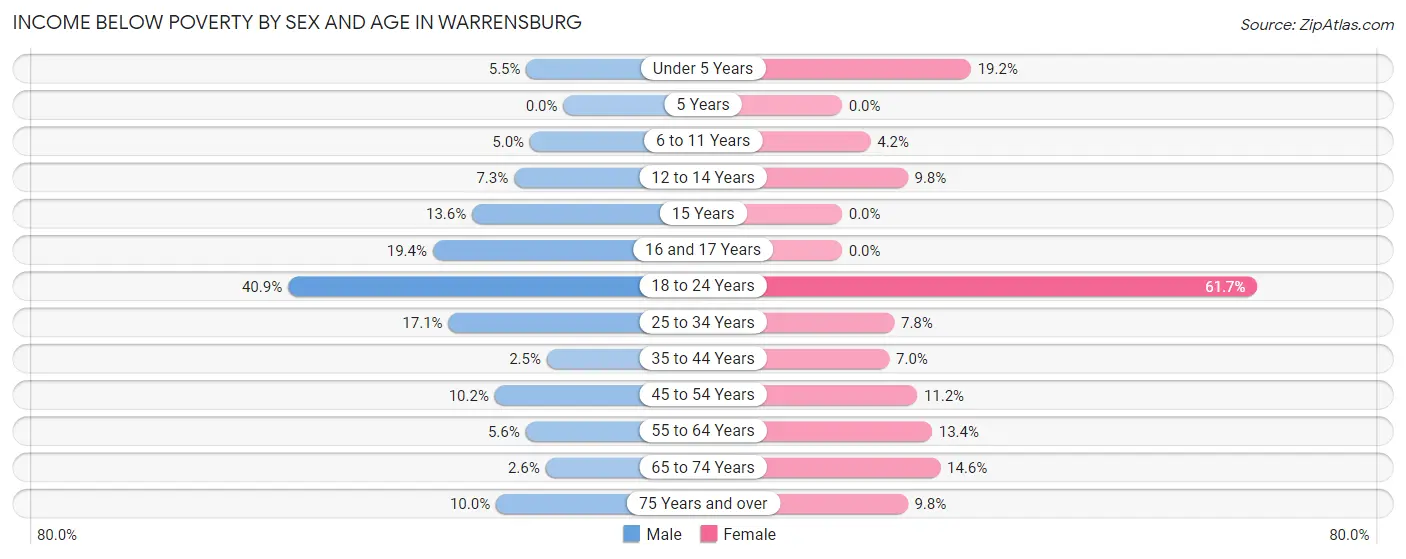
| Age Bracket | Male | Female |
| Under 5 Years | 25 (5.5%) | 81 (19.2%) |
| 5 Years | 0 (0.0%) | 0 (0.0%) |
| 6 to 11 Years | 25 (5.0%) | 23 (4.2%) |
| 12 to 14 Years | 23 (7.3%) | 36 (9.8%) |
| 15 Years | 8 (13.6%) | 0 (0.0%) |
| 16 and 17 Years | 31 (19.4%) | 0 (0.0%) |
| 18 to 24 Years | 880 (40.9%) | 1,255 (61.7%) |
| 25 to 34 Years | 218 (17.1%) | 83 (7.8%) |
| 35 to 44 Years | 23 (2.5%) | 71 (7.0%) |
| 45 to 54 Years | 70 (10.2%) | 79 (11.2%) |
| 55 to 64 Years | 25 (5.6%) | 118 (13.4%) |
| 65 to 74 Years | 17 (2.6%) | 59 (14.6%) |
| 75 Years and over | 19 (10.0%) | 50 (9.8%) |
| Total | 1,364 (17.1%) | 1,855 (22.4%) |
Income Above Poverty by Sex and Age in Warrensburg
According to the poverty statistics in Warrensburg, males aged 5 years and females aged 5 years are the age groups that are most secure financially, with 100.0% of males and 100.0% of females in these age groups living above the poverty line.

| Age Bracket | Male | Female |
| Under 5 Years | 430 (94.5%) | 342 (80.8%) |
| 5 Years | 157 (100.0%) | 79 (100.0%) |
| 6 to 11 Years | 479 (95.0%) | 521 (95.8%) |
| 12 to 14 Years | 291 (92.7%) | 333 (90.2%) |
| 15 Years | 51 (86.4%) | 55 (100.0%) |
| 16 and 17 Years | 129 (80.6%) | 183 (100.0%) |
| 18 to 24 Years | 1,272 (59.1%) | 779 (38.3%) |
| 25 to 34 Years | 1,059 (82.9%) | 987 (92.2%) |
| 35 to 44 Years | 912 (97.5%) | 939 (93.0%) |
| 45 to 54 Years | 617 (89.8%) | 629 (88.8%) |
| 55 to 64 Years | 421 (94.4%) | 765 (86.6%) |
| 65 to 74 Years | 628 (97.4%) | 345 (85.4%) |
| 75 Years and over | 171 (90.0%) | 463 (90.2%) |
| Total | 6,617 (82.9%) | 6,420 (77.6%) |
Income Below Poverty Among Married-Couple Families in Warrensburg
The poverty statistics for married-couple families in Warrensburg show that 3.2% or 77 of the total 2,415 families live below the poverty line. Families with 1 or 2 children have the highest poverty rate of 3.8%, comprising of 36 families. On the other hand, families with 3 or 4 children have the lowest poverty rate of 0.0%, which includes 0 families.
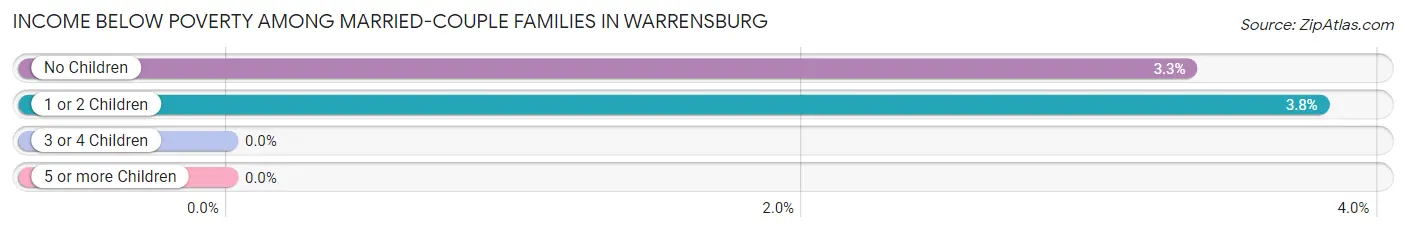
| Children | Above Poverty | Below Poverty |
| No Children | 1,188 (96.7%) | 41 (3.3%) |
| 1 or 2 Children | 911 (96.2%) | 36 (3.8%) |
| 3 or 4 Children | 223 (100.0%) | 0 (0.0%) |
| 5 or more Children | 16 (100.0%) | 0 (0.0%) |
| Total | 2,338 (96.8%) | 77 (3.2%) |
Income Below Poverty Among Single-Parent Households in Warrensburg
According to the poverty data in Warrensburg, 27.5% or 110 single-father households and 13.5% or 95 single-mother households are living below the poverty line. Among single-father households, those with no children have the highest poverty rate, with 77 households (50.3%) experiencing poverty. Likewise, among single-mother households, those with 3 or 4 children have the highest poverty rate, with 18 households (18.6%) falling below the poverty line.
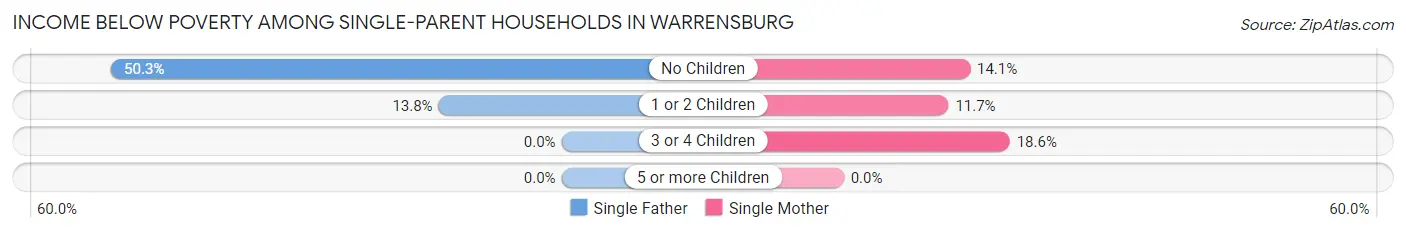
| Children | Single Father | Single Mother |
| No Children | 77 (50.3%) | 36 (14.1%) |
| 1 or 2 Children | 33 (13.8%) | 41 (11.7%) |
| 3 or 4 Children | 0 (0.0%) | 18 (18.6%) |
| 5 or more Children | 0 (0.0%) | 0 (0.0%) |
| Total | 110 (27.5%) | 95 (13.5%) |
Income Below Poverty Among Married-Couple vs Single-Parent Households in Warrensburg
The poverty data for Warrensburg shows that 77 of the married-couple family households (3.2%) and 205 of the single-parent households (18.6%) are living below the poverty level. Within the married-couple family households, those with 1 or 2 children have the highest poverty rate, with 36 households (3.8%) falling below the poverty line. Among the single-parent households, those with no children have the highest poverty rate, with 113 household (27.7%) living below poverty.
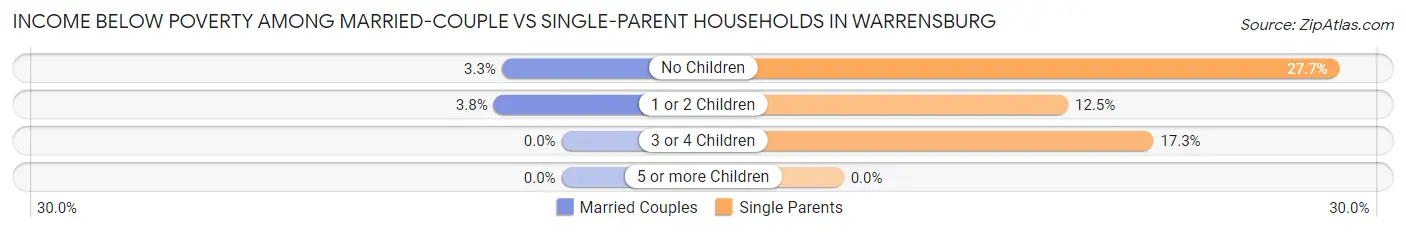
| Children | Married-Couple Families | Single-Parent Households |
| No Children | 41 (3.3%) | 113 (27.7%) |
| 1 or 2 Children | 36 (3.8%) | 74 (12.5%) |
| 3 or 4 Children | 0 (0.0%) | 18 (17.3%) |
| 5 or more Children | 0 (0.0%) | 0 (0.0%) |
| Total | 77 (3.2%) | 205 (18.6%) |
Race in Warrensburg
The most populous races in Warrensburg are White / Caucasian (16,314 | 84.5%), Two or more Races (1,356 | 7.0%), and Hispanic or Latino (1,099 | 5.7%).
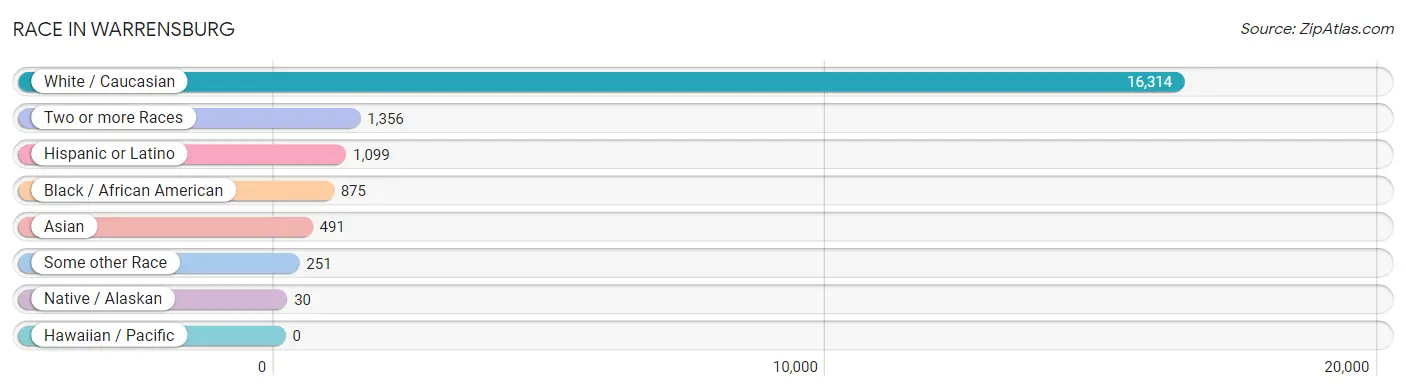
| Race | # Population | % Population |
| Asian | 491 | 2.5% |
| Black / African American | 875 | 4.5% |
| Hawaiian / Pacific | 0 | 0.0% |
| Hispanic or Latino | 1,099 | 5.7% |
| Native / Alaskan | 30 | 0.2% |
| White / Caucasian | 16,314 | 84.5% |
| Two or more Races | 1,356 | 7.0% |
| Some other Race | 251 | 1.3% |
| Total | 19,317 | 100.0% |
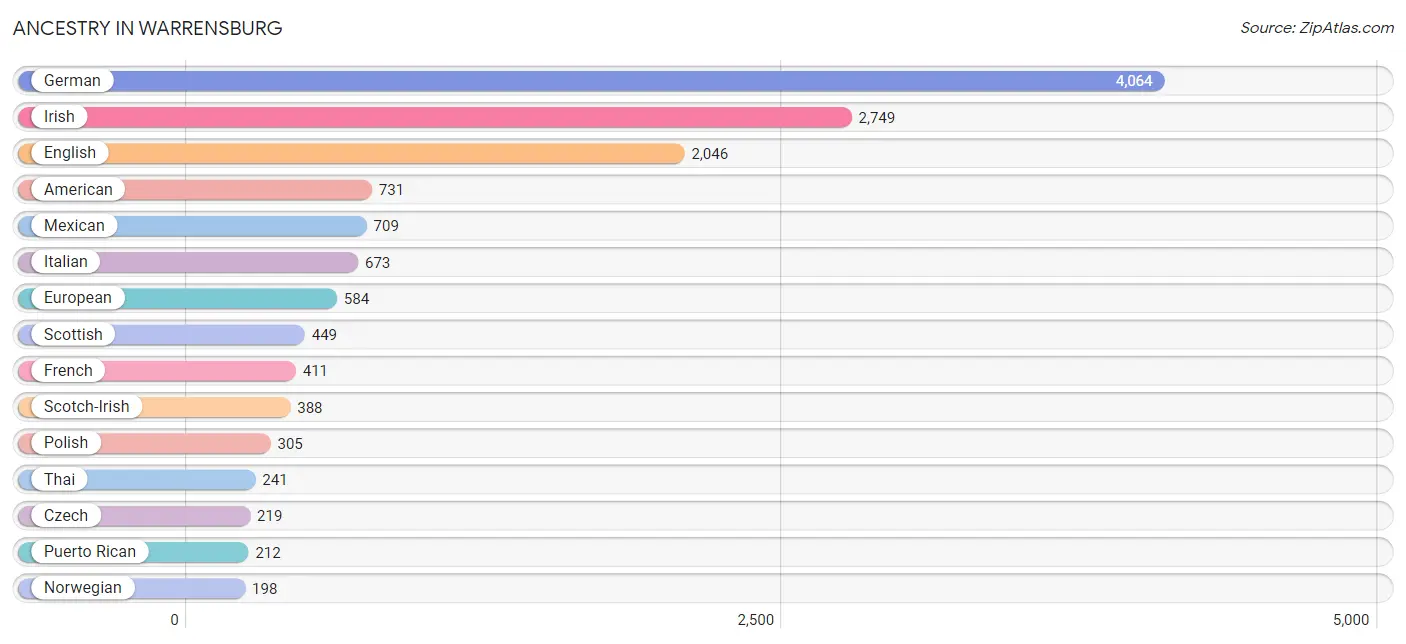
Ancestry in Warrensburg
The most populous ancestries reported in Warrensburg are German (4,064 | 21.0%), Irish (2,749 | 14.2%), English (2,046 | 10.6%), American (731 | 3.8%), and Mexican (709 | 3.7%), together accounting for 53.3% of all Warrensburg residents.
| Ancestry | # Population | % Population |
| African | 30 | 0.2% |
| American | 731 | 3.8% |
| Arab | 82 | 0.4% |
| Blackfeet | 13 | 0.1% |
| British | 102 | 0.5% |
| Bulgarian | 6 | 0.0% |
| Burmese | 184 | 0.9% |
| Carpatho Rusyn | 14 | 0.1% |
| Cherokee | 111 | 0.6% |
| Chickasaw | 33 | 0.2% |
| Choctaw | 13 | 0.1% |
| Colombian | 27 | 0.1% |
| Czech | 219 | 1.1% |
| Czechoslovakian | 37 | 0.2% |
| Danish | 19 | 0.1% |
| Dominican | 16 | 0.1% |
| Dutch | 123 | 0.6% |
| Eastern European | 20 | 0.1% |
| Ecuadorian | 7 | 0.0% |
| English | 2,046 | 10.6% |
| European | 584 | 3.0% |
| French | 411 | 2.1% |
| French Canadian | 56 | 0.3% |
| German | 4,064 | 21.0% |
| Ghanaian | 16 | 0.1% |
| Greek | 10 | 0.1% |
| Haitian | 32 | 0.2% |
| Hungarian | 18 | 0.1% |
| Indian (Asian) | 40 | 0.2% |
| Irish | 2,749 | 14.2% |
| Iroquois | 12 | 0.1% |
| Italian | 673 | 3.5% |
| Jamaican | 6 | 0.0% |
| Kenyan | 16 | 0.1% |
| Korean | 167 | 0.9% |
| Lebanese | 22 | 0.1% |
| Lithuanian | 17 | 0.1% |
| Malaysian | 16 | 0.1% |
| Mexican | 709 | 3.7% |
| Navajo | 35 | 0.2% |
| Norwegian | 198 | 1.0% |
| Pakistani | 48 | 0.3% |
| Polish | 305 | 1.6% |
| Puerto Rican | 212 | 1.1% |
| Romanian | 31 | 0.2% |
| Russian | 39 | 0.2% |
| Scandinavian | 122 | 0.6% |
| Scotch-Irish | 388 | 2.0% |
| Scottish | 449 | 2.3% |
| Seminole | 13 | 0.1% |
| Serbian | 20 | 0.1% |
| Sioux | 4 | 0.0% |
| Slovak | 15 | 0.1% |
| South American | 80 | 0.4% |
| Spaniard | 35 | 0.2% |
| Spanish | 41 | 0.2% |
| Sri Lankan | 16 | 0.1% |
| Subsaharan African | 62 | 0.3% |
| Swedish | 189 | 1.0% |
| Swiss | 33 | 0.2% |
| Thai | 241 | 1.3% |
| Uruguayan | 46 | 0.2% |
| Welsh | 42 | 0.2% |
| Yaqui | 35 | 0.2% | View All 64 Rows |
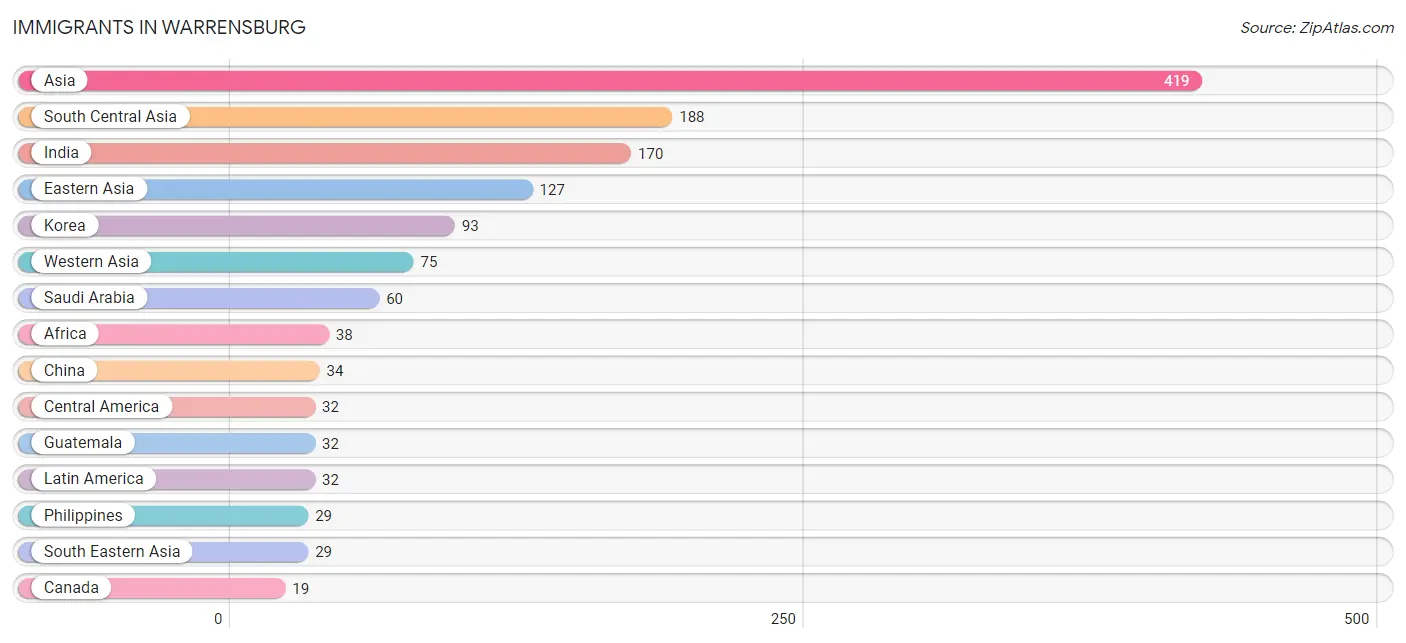
Immigrants in Warrensburg
The most numerous immigrant groups reported in Warrensburg came from Asia (419 | 2.2%), South Central Asia (188 | 1.0%), India (170 | 0.9%), Eastern Asia (127 | 0.7%), and Korea (93 | 0.5%), together accounting for 5.2% of all Warrensburg residents.
| Immigration Origin | # Population | % Population |
| Africa | 38 | 0.2% |
| Asia | 419 | 2.2% |
| Canada | 19 | 0.1% |
| Central America | 32 | 0.2% |
| China | 34 | 0.2% |
| Eastern Africa | 16 | 0.1% |
| Eastern Asia | 127 | 0.7% |
| Ghana | 16 | 0.1% |
| Guatemala | 32 | 0.2% |
| India | 170 | 0.9% |
| Jordan | 15 | 0.1% |
| Kenya | 16 | 0.1% |
| Korea | 93 | 0.5% |
| Latin America | 32 | 0.2% |
| Nepal | 18 | 0.1% |
| Philippines | 29 | 0.2% |
| Saudi Arabia | 60 | 0.3% |
| South Central Asia | 188 | 1.0% |
| South Eastern Asia | 29 | 0.2% |
| Western Africa | 16 | 0.1% |
| Western Asia | 75 | 0.4% | View All 21 Rows |
Sex and Age in Warrensburg
Sex and Age in Warrensburg
The most populous age groups in Warrensburg are 20 to 24 Years (2,261 | 23.6%) for men and 20 to 24 Years (2,115 | 21.8%) for women.
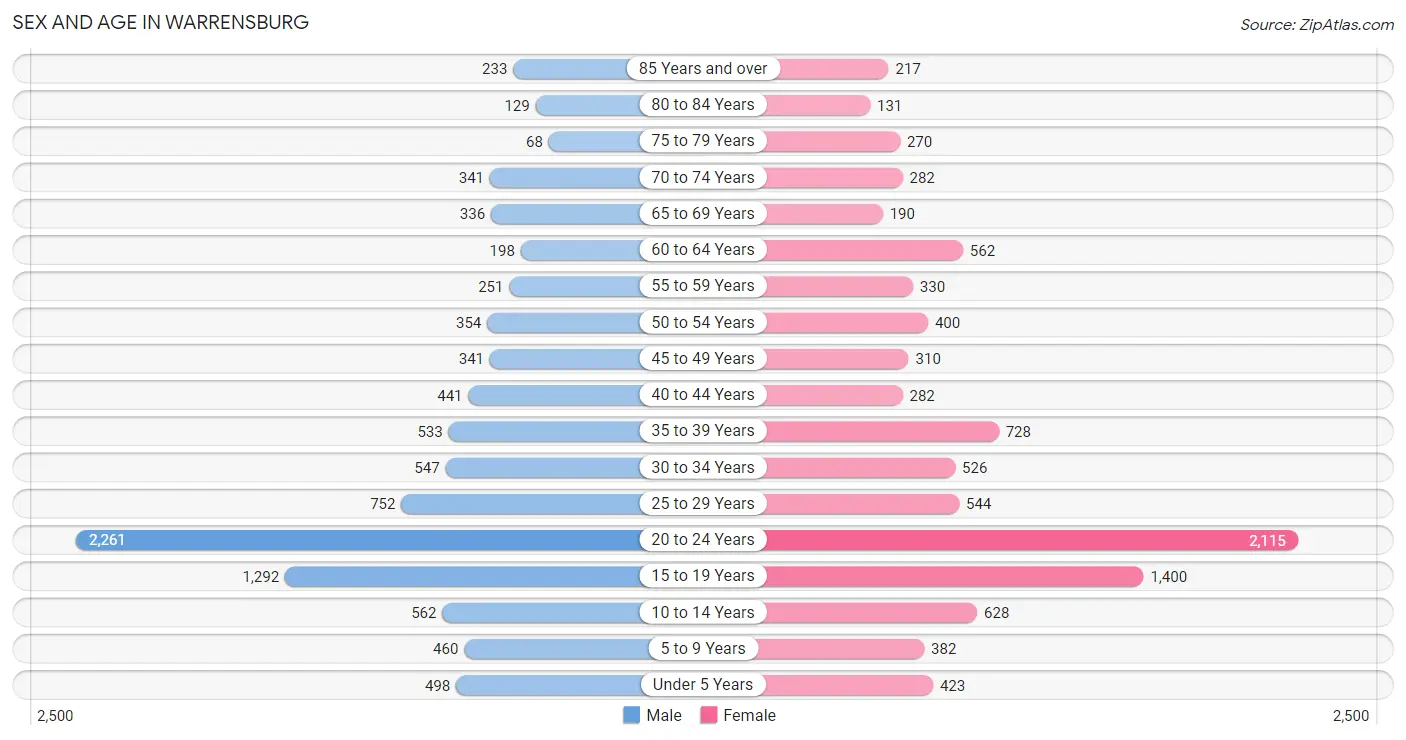
| Age Bracket | Male | Female |
| Under 5 Years | 498 (5.2%) | 423 (4.3%) |
| 5 to 9 Years | 460 (4.8%) | 382 (3.9%) |
| 10 to 14 Years | 562 (5.9%) | 628 (6.5%) |
| 15 to 19 Years | 1,292 (13.5%) | 1,400 (14.4%) |
| 20 to 24 Years | 2,261 (23.6%) | 2,115 (21.8%) |
| 25 to 29 Years | 752 (7.8%) | 544 (5.6%) |
| 30 to 34 Years | 547 (5.7%) | 526 (5.4%) |
| 35 to 39 Years | 533 (5.6%) | 728 (7.5%) |
| 40 to 44 Years | 441 (4.6%) | 282 (2.9%) |
| 45 to 49 Years | 341 (3.5%) | 310 (3.2%) |
| 50 to 54 Years | 354 (3.7%) | 400 (4.1%) |
| 55 to 59 Years | 251 (2.6%) | 330 (3.4%) |
| 60 to 64 Years | 198 (2.1%) | 562 (5.8%) |
| 65 to 69 Years | 336 (3.5%) | 190 (1.9%) |
| 70 to 74 Years | 341 (3.5%) | 282 (2.9%) |
| 75 to 79 Years | 68 (0.7%) | 270 (2.8%) |
| 80 to 84 Years | 129 (1.3%) | 131 (1.3%) |
| 85 Years and over | 233 (2.4%) | 217 (2.2%) |
| Total | 9,597 (100.0%) | 9,720 (100.0%) |
Families and Households in Warrensburg
Median Family Size in Warrensburg
The median family size in Warrensburg is 2.89 persons per family, with married-couple families (2,415 | 68.7%) accounting for the largest median family size of 3.12 persons per family. On the other hand, single male/father families (400 | 11.4%) represent the smallest median family size with 2.25 persons per family.
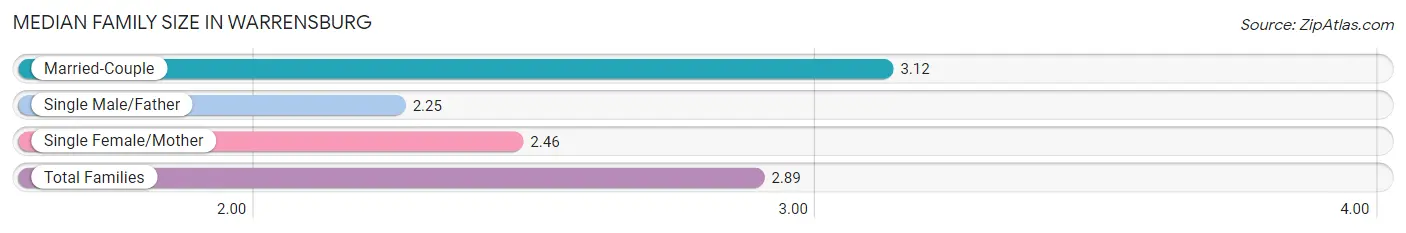
| Family Type | # Families | Family Size |
| Married-Couple | 2,415 (68.7%) | 3.12 |
| Single Male/Father | 400 (11.4%) | 2.25 |
| Single Female/Mother | 702 (20.0%) | 2.46 |
| Total Families | 3,517 (100.0%) | 2.89 |
Median Household Size in Warrensburg
The median household size in Warrensburg is 2.25 persons per household, with married-couple households (2,415 | 33.3%) accounting for the largest median household size of 3.15 persons per household. non-family households (3,729 | 51.5%) represent the smallest median household size with 1.51 persons per household.
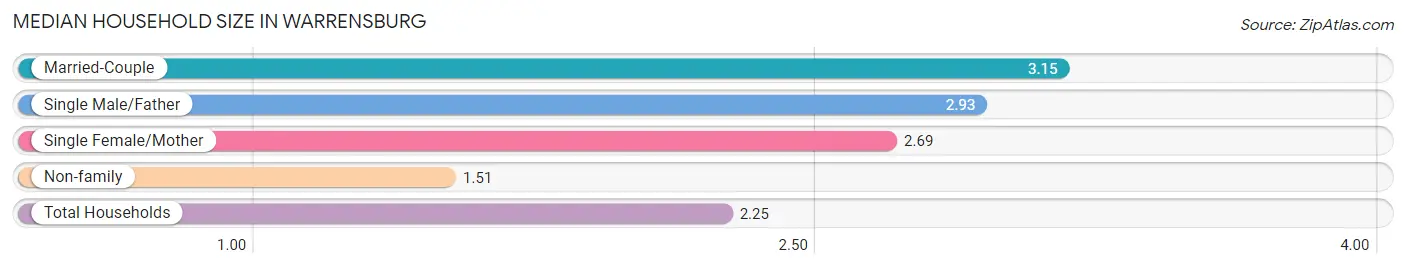
| Household Type | # Households | Household Size |
| Married-Couple | 2,415 (33.3%) | 3.15 |
| Single Male/Father | 400 (5.5%) | 2.93 |
| Single Female/Mother | 702 (9.7%) | 2.69 |
| Non-family | 3,729 (51.5%) | 1.51 |
| Total Households | 7,246 (100.0%) | 2.25 |
Household Size by Marriage Status in Warrensburg
Out of a total of 7,246 households in Warrensburg, 3,517 (48.5%) are family households, while 3,729 (51.5%) are nonfamily households. The most numerous type of family households are 2-person households, comprising 1,430, and the most common type of nonfamily households are 1-person households, comprising 2,386.
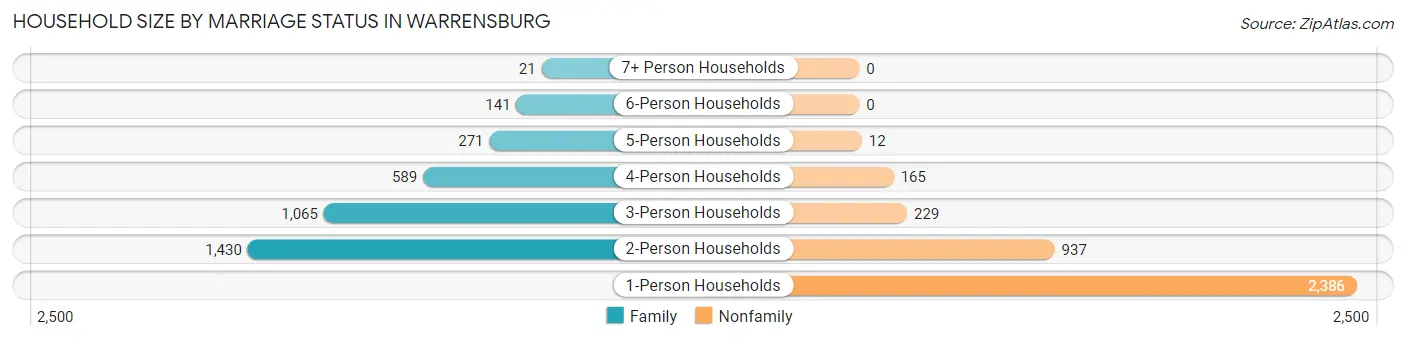
| Household Size | Family Households | Nonfamily Households |
| 1-Person Households | - | 2,386 (32.9%) |
| 2-Person Households | 1,430 (19.7%) | 937 (12.9%) |
| 3-Person Households | 1,065 (14.7%) | 229 (3.2%) |
| 4-Person Households | 589 (8.1%) | 165 (2.3%) |
| 5-Person Households | 271 (3.7%) | 12 (0.2%) |
| 6-Person Households | 141 (1.9%) | 0 (0.0%) |
| 7+ Person Households | 21 (0.3%) | 0 (0.0%) |
| Total | 3,517 (48.5%) | 3,729 (51.5%) |
Female Fertility in Warrensburg
Fertility by Age in Warrensburg
Average fertility rate in Warrensburg is 36.0 births per 1,000 women. Women in the age bracket of 35 to 50 years have the highest fertility rate with 97.0 births per 1,000 women. Women in the age bracket of 35 to 50 years acount for 61.9% of all women with births.
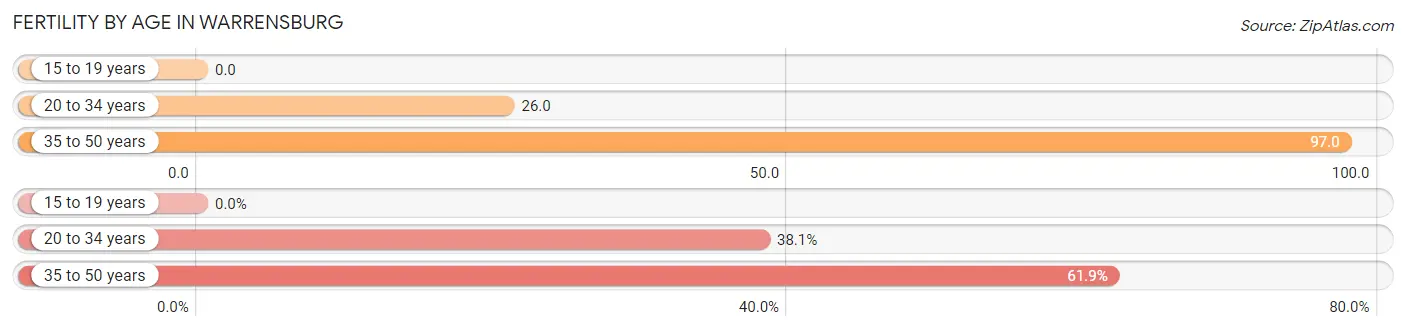
| Age Bracket | Women with Births | Births / 1,000 Women |
| 15 to 19 years | 0 (0.0%) | 0.0 |
| 20 to 34 years | 82 (38.1%) | 26.0 |
| 35 to 50 years | 133 (61.9%) | 97.0 |
| Total | 215 (100.0%) | 36.0 |
Fertility by Age by Marriage Status in Warrensburg
56.3% of women with births (215) in Warrensburg are married. The highest percentage of unmarried women with births falls into 35 to 50 years age bracket with 54.1% of them unmarried at the time of birth, while the lowest percentage of unmarried women with births belong to 20 to 34 years age bracket with 26.8% of them unmarried.
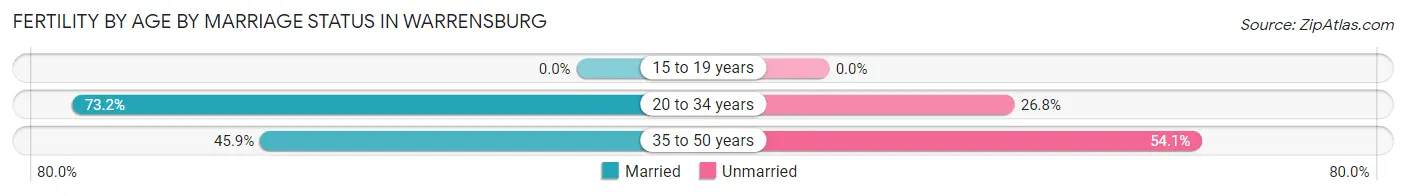
| Age Bracket | Married | Unmarried |
| 15 to 19 years | 0 (0.0%) | 0 (0.0%) |
| 20 to 34 years | 60 (73.2%) | 22 (26.8%) |
| 35 to 50 years | 61 (45.9%) | 72 (54.1%) |
| Total | 121 (56.3%) | 94 (43.7%) |
Fertility by Education in Warrensburg
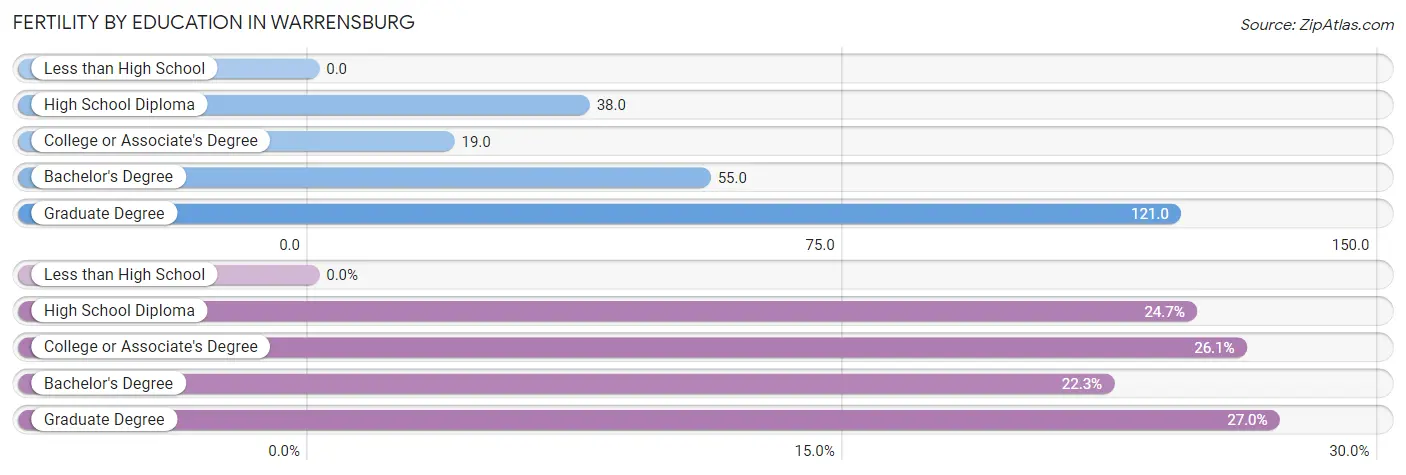
| Educational Attainment | Women with Births | Births / 1,000 Women |
| Less than High School | 0 (0.0%) | 0.0 |
| High School Diploma | 53 (24.6%) | 38.0 |
| College or Associate's Degree | 56 (26.1%) | 19.0 |
| Bachelor's Degree | 48 (22.3%) | 55.0 |
| Graduate Degree | 58 (27.0%) | 121.0 |
| Total | 215 (100.0%) | 36.0 |
Fertility by Education by Marriage Status in Warrensburg
43.7% of women with births in Warrensburg are unmarried. Women with the educational attainment of bachelor's degree are most likely to be married with 100.0% of them married at childbirth, while women with the educational attainment of high school diploma are least likely to be married with 100.0% of them unmarried at childbirth.
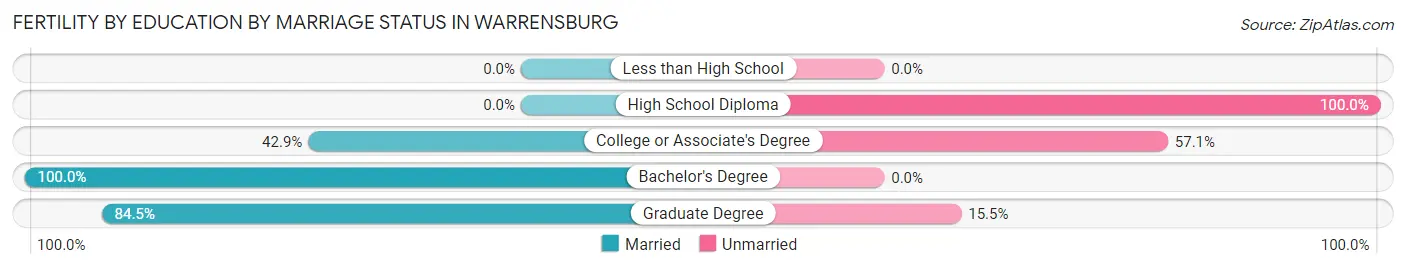
| Educational Attainment | Married | Unmarried |
| Less than High School | 0 (0.0%) | 0 (0.0%) |
| High School Diploma | 0 (0.0%) | 53 (100.0%) |
| College or Associate's Degree | 24 (42.9%) | 32 (57.1%) |
| Bachelor's Degree | 48 (100.0%) | 0 (0.0%) |
| Graduate Degree | 49 (84.5%) | 9 (15.5%) |
| Total | 121 (56.3%) | 94 (43.7%) |
Employment Characteristics in Warrensburg
Employment by Class of Employer in Warrensburg
Among the 9,450 employed individuals in Warrensburg, private company employees (5,210 | 55.1%), federal government employees (1,320 | 14.0%), and state government employees (771 | 8.2%) make up the most common classes of employment.
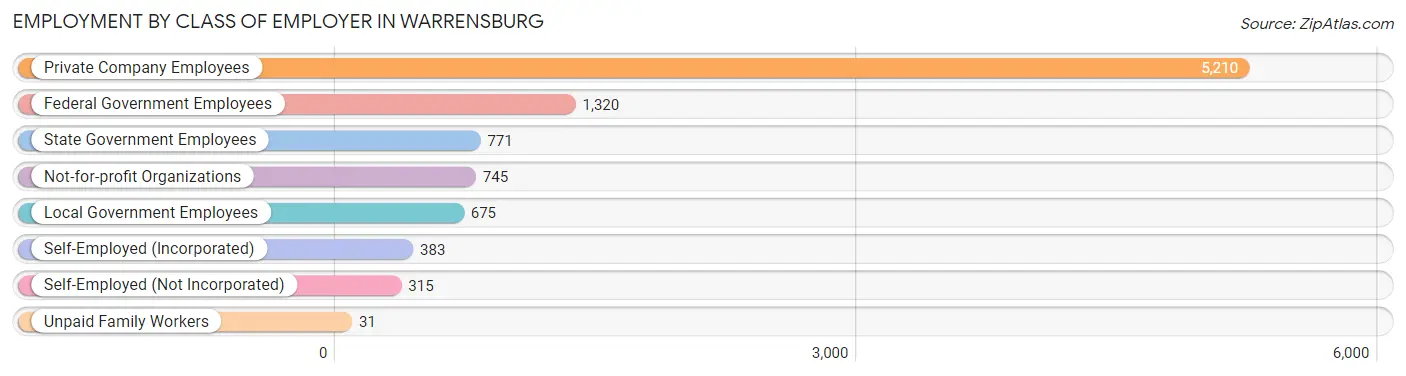
| Employer Class | # Employees | % Employees |
| Private Company Employees | 5,210 | 55.1% |
| Self-Employed (Incorporated) | 383 | 4.1% |
| Self-Employed (Not Incorporated) | 315 | 3.3% |
| Not-for-profit Organizations | 745 | 7.9% |
| Local Government Employees | 675 | 7.1% |
| State Government Employees | 771 | 8.2% |
| Federal Government Employees | 1,320 | 14.0% |
| Unpaid Family Workers | 31 | 0.3% |
| Total | 9,450 | 100.0% |
Employment Status by Age in Warrensburg
According to the labor force statistics for Warrensburg, out of the total population over 16 years of age (16,249), 64.8% or 10,529 individuals are in the labor force, with 6.8% or 716 of them unemployed. The age group with the highest labor force participation rate is 35 to 44 years, with 86.5% or 1,716 individuals in the labor force. Within the labor force, the 16 to 19 years age range has the highest percentage of unemployed individuals, with 22.0% or 209 of them being unemployed.
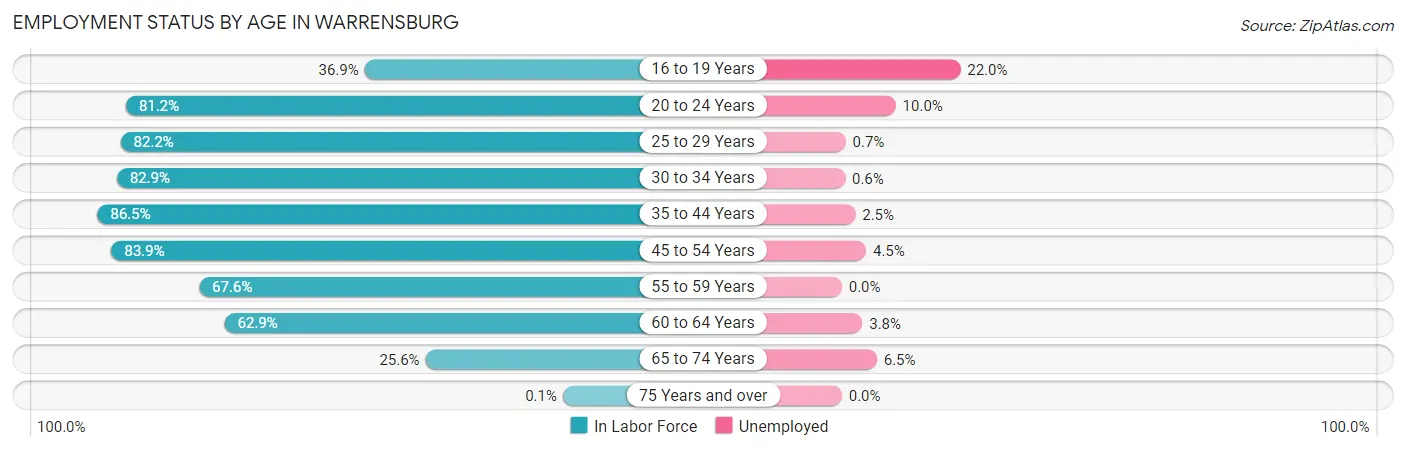
| Age Bracket | In Labor Force | Unemployed |
| 16 to 19 Years | 951 (36.9%) | 209 (22.0%) |
| 20 to 24 Years | 3,553 (81.2%) | 355 (10.0%) |
| 25 to 29 Years | 1,065 (82.2%) | 7 (0.7%) |
| 30 to 34 Years | 890 (82.9%) | 5 (0.6%) |
| 35 to 44 Years | 1,716 (86.5%) | 43 (2.5%) |
| 45 to 54 Years | 1,179 (83.9%) | 53 (4.5%) |
| 55 to 59 Years | 393 (67.6%) | 0 (0.0%) |
| 60 to 64 Years | 478 (62.9%) | 18 (3.8%) |
| 65 to 74 Years | 294 (25.6%) | 19 (6.5%) |
| 75 Years and over | 1 (0.1%) | 0 (0.0%) |
| Total | 10,529 (64.8%) | 716 (6.8%) |
Employment Status by Educational Attainment in Warrensburg
According to labor force statistics for Warrensburg, 80.6% of individuals (5,722) out of the total population between 25 and 64 years of age (7,099) are in the labor force, with 2.3% or 132 of them being unemployed. The group with the highest labor force participation rate are those with the educational attainment of bachelor's degree or higher, with 86.0% or 2,394 individuals in the labor force. Within the labor force, individuals with bachelor's degree or higher education have the highest percentage of unemployment, with 3.1% or 74 of them being unemployed.
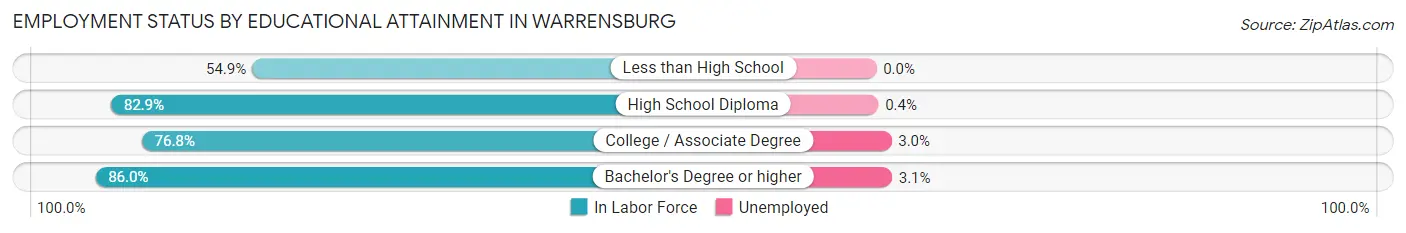
| Educational Attainment | In Labor Force | Unemployed |
| Less than High School | 220 (54.9%) | 0 (0.0%) |
| High School Diploma | 1,394 (82.9%) | 7 (0.4%) |
| College / Associate Degree | 1,715 (76.8%) | 67 (3.0%) |
| Bachelor's Degree or higher | 2,394 (86.0%) | 86 (3.1%) |
| Total | 5,722 (80.6%) | 163 (2.3%) |
Employment Occupations by Sex in Warrensburg
Management, Business, Science and Arts Occupations
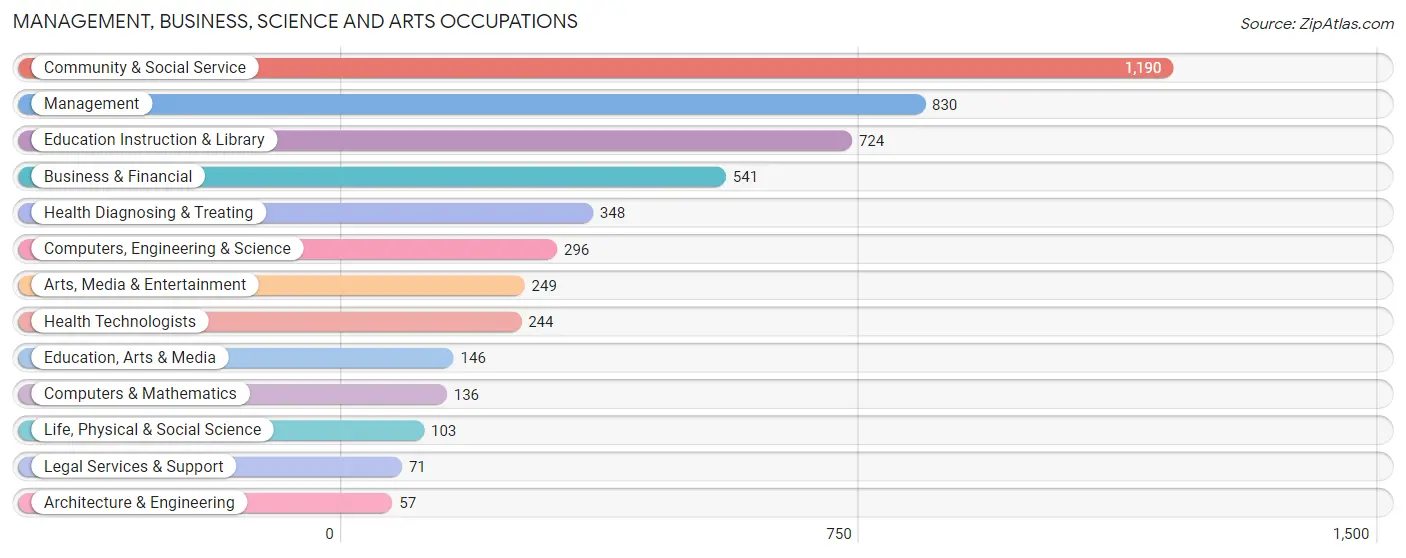
The most common Management, Business, Science and Arts occupations in Warrensburg are Community & Social Service (1,190 | 13.2%), Management (830 | 9.2%), Education Instruction & Library (724 | 8.0%), Business & Financial (541 | 6.0%), and Health Diagnosing & Treating (348 | 3.9%).
Management, Business, Science and Arts Occupations by Sex
Within the Management, Business, Science and Arts occupations in Warrensburg, the most male-oriented occupations are Architecture & Engineering (100.0%), Legal Services & Support (100.0%), and Computers & Mathematics (62.5%), while the most female-oriented occupations are Health Technologists (91.8%), Life, Physical & Social Science (87.4%), and Health Diagnosing & Treating (85.6%).
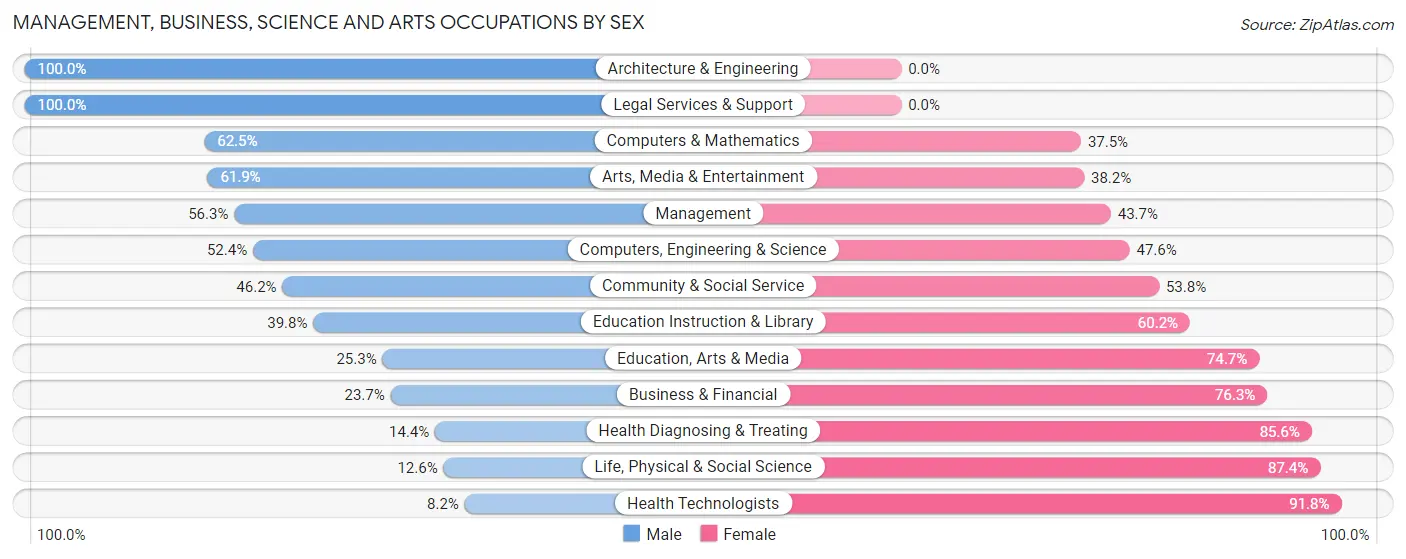
| Occupation | Male | Female |
| Management | 467 (56.3%) | 363 (43.7%) |
| Business & Financial | 128 (23.7%) | 413 (76.3%) |
| Computers, Engineering & Science | 155 (52.4%) | 141 (47.6%) |
| Computers & Mathematics | 85 (62.5%) | 51 (37.5%) |
| Architecture & Engineering | 57 (100.0%) | 0 (0.0%) |
| Life, Physical & Social Science | 13 (12.6%) | 90 (87.4%) |
| Community & Social Service | 550 (46.2%) | 640 (53.8%) |
| Education, Arts & Media | 37 (25.3%) | 109 (74.7%) |
| Legal Services & Support | 71 (100.0%) | 0 (0.0%) |
| Education Instruction & Library | 288 (39.8%) | 436 (60.2%) |
| Arts, Media & Entertainment | 154 (61.9%) | 95 (38.2%) |
| Health Diagnosing & Treating | 50 (14.4%) | 298 (85.6%) |
| Health Technologists | 20 (8.2%) | 224 (91.8%) |
| Total (Category) | 1,350 (42.1%) | 1,855 (57.9%) |
| Total (Overall) | 4,247 (47.1%) | 4,773 (52.9%) |
Services Occupations
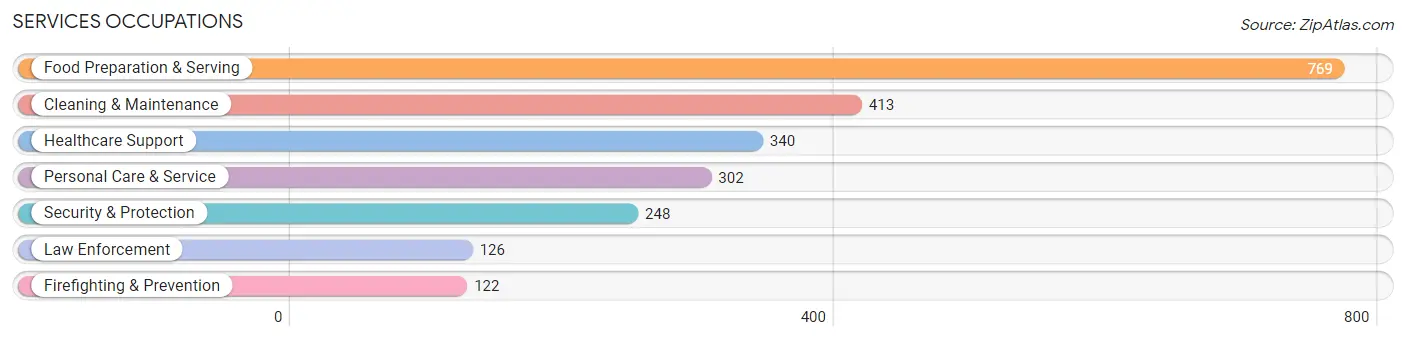
The most common Services occupations in Warrensburg are Food Preparation & Serving (769 | 8.5%), Cleaning & Maintenance (413 | 4.6%), Healthcare Support (340 | 3.8%), Personal Care & Service (302 | 3.4%), and Security & Protection (248 | 2.8%).
Services Occupations by Sex
Within the Services occupations in Warrensburg, the most male-oriented occupations are Firefighting & Prevention (75.4%), Cleaning & Maintenance (65.1%), and Security & Protection (57.3%), while the most female-oriented occupations are Healthcare Support (88.5%), Personal Care & Service (69.2%), and Law Enforcement (60.3%).
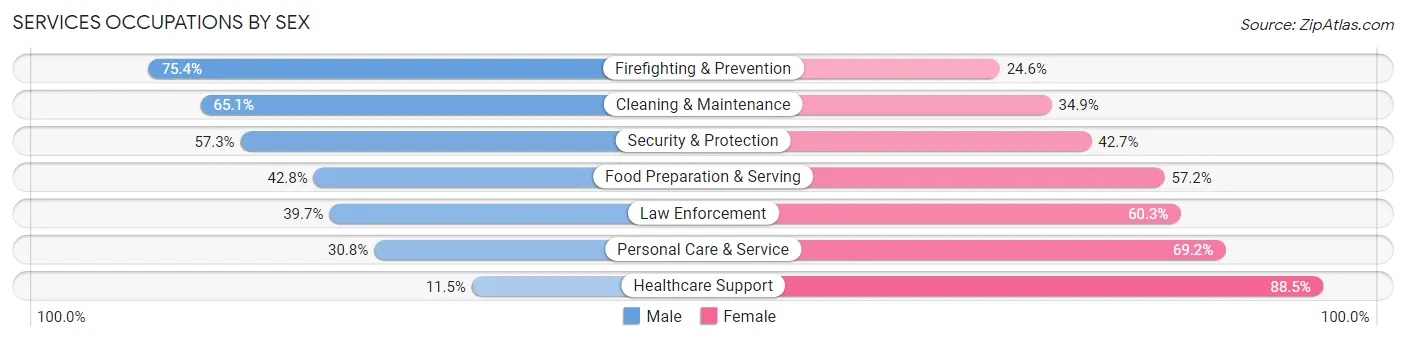
| Occupation | Male | Female |
| Healthcare Support | 39 (11.5%) | 301 (88.5%) |
| Security & Protection | 142 (57.3%) | 106 (42.7%) |
| Firefighting & Prevention | 92 (75.4%) | 30 (24.6%) |
| Law Enforcement | 50 (39.7%) | 76 (60.3%) |
| Food Preparation & Serving | 329 (42.8%) | 440 (57.2%) |
| Cleaning & Maintenance | 269 (65.1%) | 144 (34.9%) |
| Personal Care & Service | 93 (30.8%) | 209 (69.2%) |
| Total (Category) | 872 (42.1%) | 1,200 (57.9%) |
| Total (Overall) | 4,247 (47.1%) | 4,773 (52.9%) |
Sales and Office Occupations
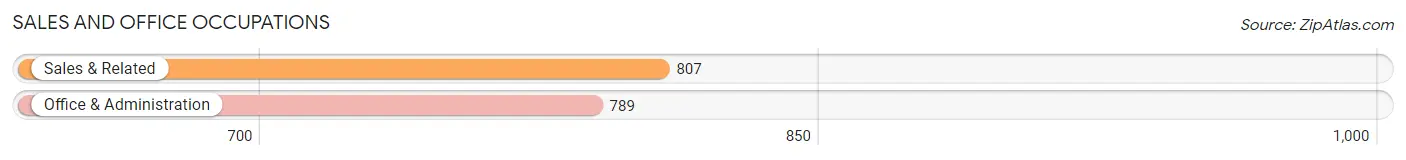
The most common Sales and Office occupations in Warrensburg are Sales & Related (807 | 8.9%), and Office & Administration (789 | 8.7%).
Sales and Office Occupations by Sex
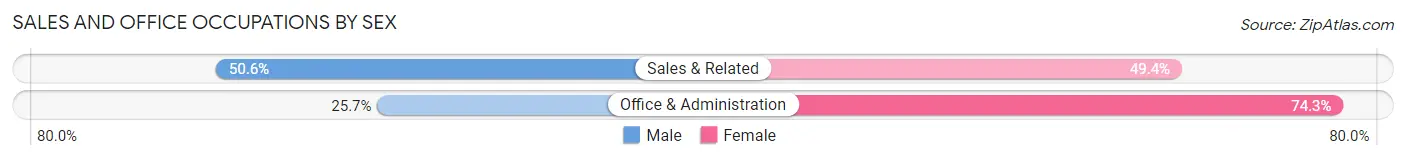
| Occupation | Male | Female |
| Sales & Related | 408 (50.6%) | 399 (49.4%) |
| Office & Administration | 203 (25.7%) | 586 (74.3%) |
| Total (Category) | 611 (38.3%) | 985 (61.7%) |
| Total (Overall) | 4,247 (47.1%) | 4,773 (52.9%) |
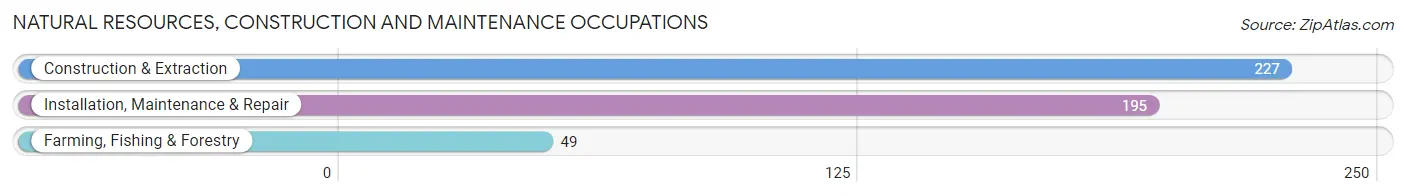
Natural Resources, Construction and Maintenance Occupations
The most common Natural Resources, Construction and Maintenance occupations in Warrensburg are Construction & Extraction (227 | 2.5%), Installation, Maintenance & Repair (195 | 2.2%), and Farming, Fishing & Forestry (49 | 0.5%).
Natural Resources, Construction and Maintenance Occupations by Sex
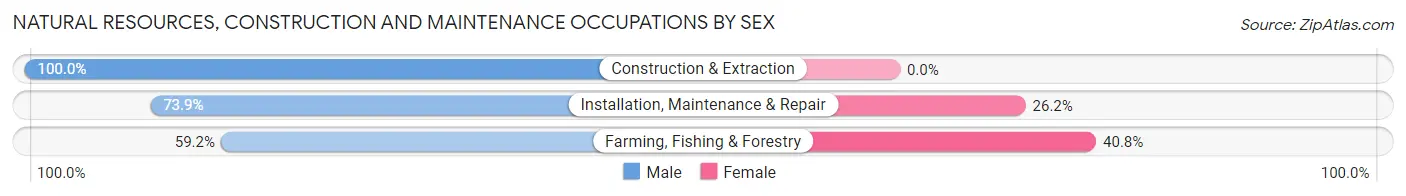
| Occupation | Male | Female |
| Farming, Fishing & Forestry | 29 (59.2%) | 20 (40.8%) |
| Construction & Extraction | 227 (100.0%) | 0 (0.0%) |
| Installation, Maintenance & Repair | 144 (73.9%) | 51 (26.2%) |
| Total (Category) | 400 (84.9%) | 71 (15.1%) |
| Total (Overall) | 4,247 (47.1%) | 4,773 (52.9%) |
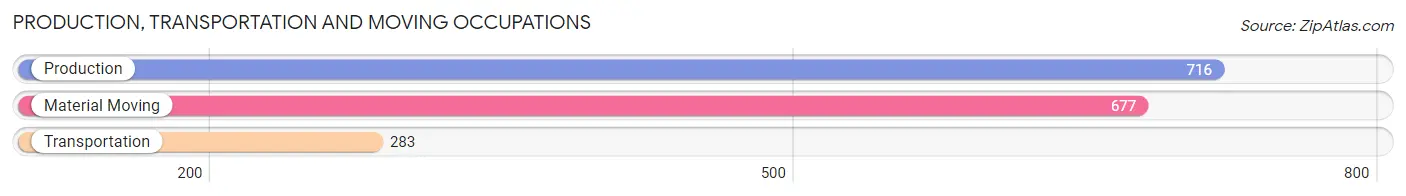
Production, Transportation and Moving Occupations
The most common Production, Transportation and Moving occupations in Warrensburg are Production (716 | 7.9%), Material Moving (677 | 7.5%), and Transportation (283 | 3.1%).
Production, Transportation and Moving Occupations by Sex
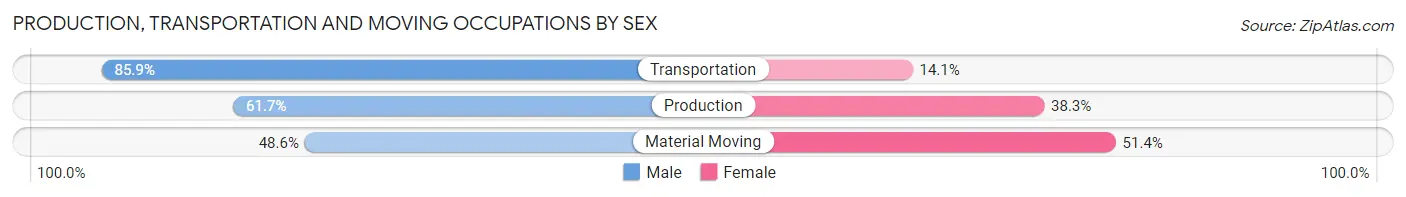
| Occupation | Male | Female |
| Production | 442 (61.7%) | 274 (38.3%) |
| Transportation | 243 (85.9%) | 40 (14.1%) |
| Material Moving | 329 (48.6%) | 348 (51.4%) |
| Total (Category) | 1,014 (60.5%) | 662 (39.5%) |
| Total (Overall) | 4,247 (47.1%) | 4,773 (52.9%) |
Employment Industries by Sex in Warrensburg
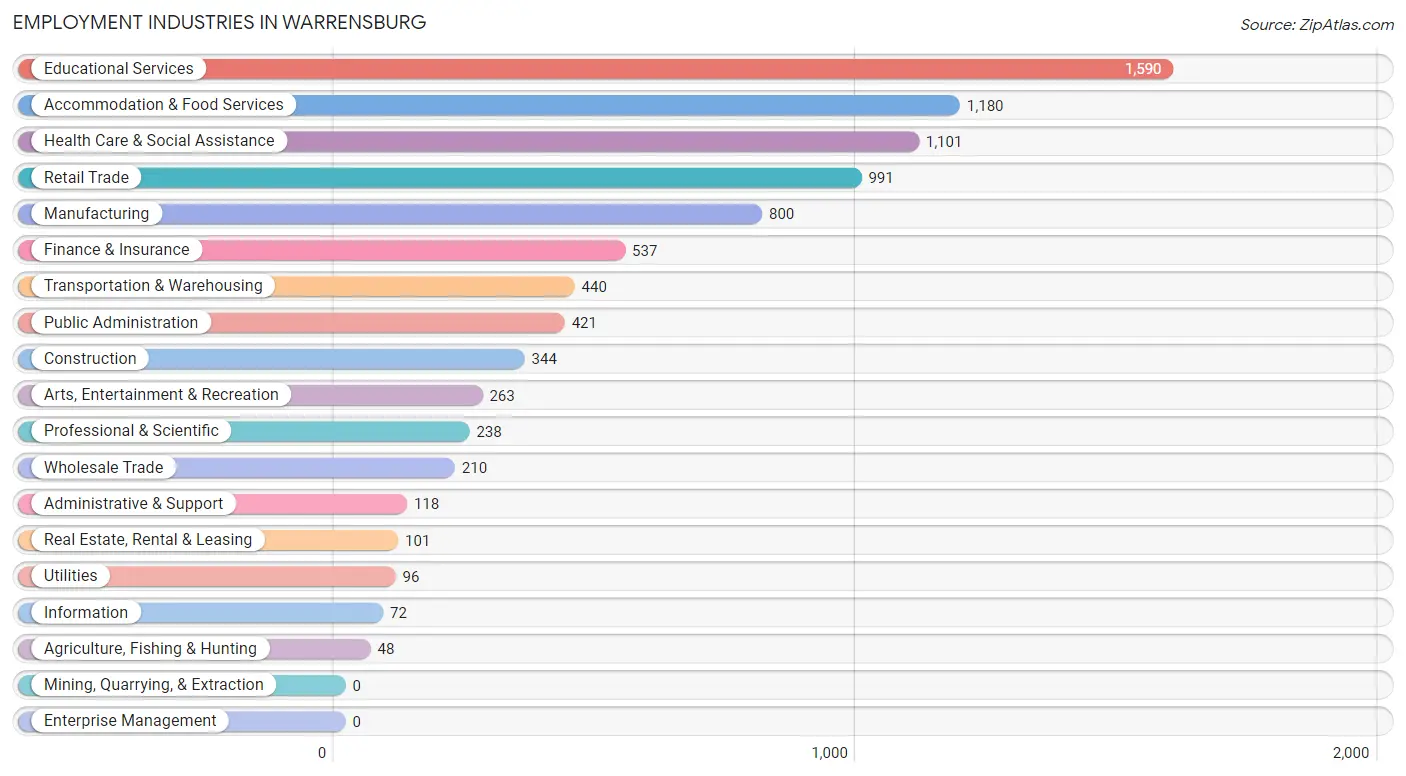
Employment Industries in Warrensburg
The major employment industries in Warrensburg include Educational Services (1,590 | 17.6%), Accommodation & Food Services (1,180 | 13.1%), Health Care & Social Assistance (1,101 | 12.2%), Retail Trade (991 | 11.0%), and Manufacturing (800 | 8.9%).
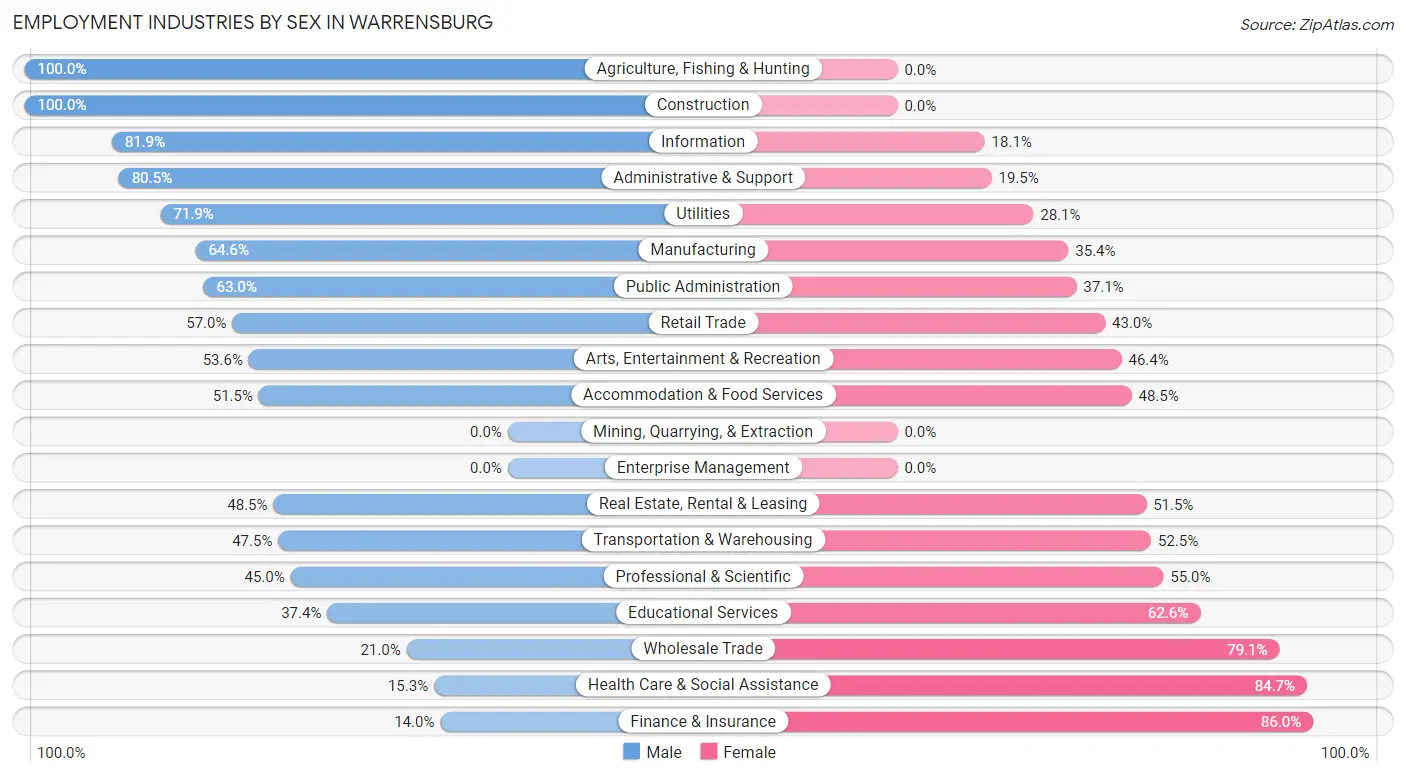
Employment Industries by Sex in Warrensburg
The Warrensburg industries that see more men than women are Agriculture, Fishing & Hunting (100.0%), Construction (100.0%), and Information (81.9%), whereas the industries that tend to have a higher number of women are Finance & Insurance (86.0%), Health Care & Social Assistance (84.7%), and Wholesale Trade (79.0%).
| Industry | Male | Female |
| Agriculture, Fishing & Hunting | 48 (100.0%) | 0 (0.0%) |
| Mining, Quarrying, & Extraction | 0 (0.0%) | 0 (0.0%) |
| Construction | 344 (100.0%) | 0 (0.0%) |
| Manufacturing | 517 (64.6%) | 283 (35.4%) |
| Wholesale Trade | 44 (20.9%) | 166 (79.0%) |
| Retail Trade | 565 (57.0%) | 426 (43.0%) |
| Transportation & Warehousing | 209 (47.5%) | 231 (52.5%) |
| Utilities | 69 (71.9%) | 27 (28.1%) |
| Information | 59 (81.9%) | 13 (18.1%) |
| Finance & Insurance | 75 (14.0%) | 462 (86.0%) |
| Real Estate, Rental & Leasing | 49 (48.5%) | 52 (51.5%) |
| Professional & Scientific | 107 (45.0%) | 131 (55.0%) |
| Enterprise Management | 0 (0.0%) | 0 (0.0%) |
| Administrative & Support | 95 (80.5%) | 23 (19.5%) |
| Educational Services | 594 (37.4%) | 996 (62.6%) |
| Health Care & Social Assistance | 168 (15.3%) | 933 (84.7%) |
| Arts, Entertainment & Recreation | 141 (53.6%) | 122 (46.4%) |
| Accommodation & Food Services | 608 (51.5%) | 572 (48.5%) |
| Public Administration | 265 (62.9%) | 156 (37.0%) |
| Total | 4,247 (47.1%) | 4,773 (52.9%) |
Education in Warrensburg
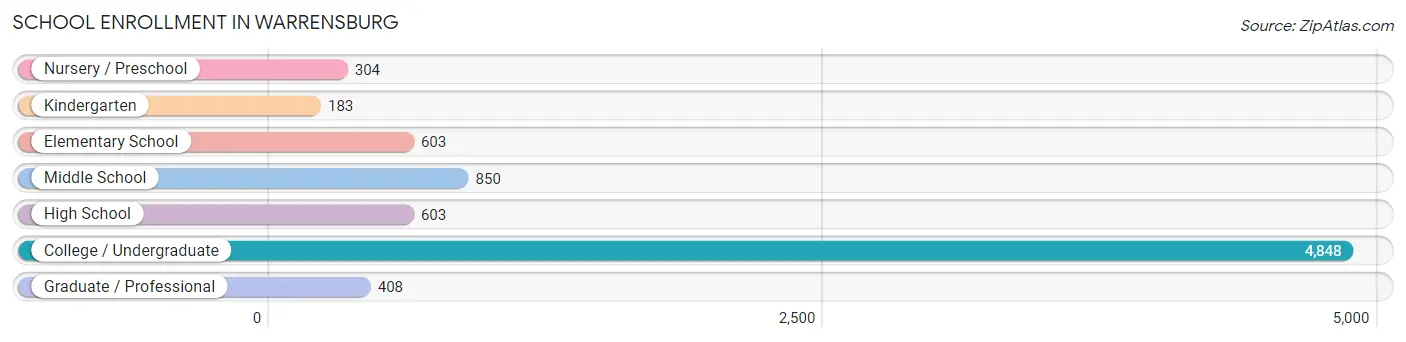
School Enrollment in Warrensburg
The most common levels of schooling among the 7,799 students in Warrensburg are college / undergraduate (4,848 | 62.2%), middle school (850 | 10.9%), and elementary school (603 | 7.7%).
| School Level | # Students | % Students |
| Nursery / Preschool | 304 | 3.9% |
| Kindergarten | 183 | 2.4% |
| Elementary School | 603 | 7.7% |
| Middle School | 850 | 10.9% |
| High School | 603 | 7.7% |
| College / Undergraduate | 4,848 | 62.2% |
| Graduate / Professional | 408 | 5.2% |
| Total | 7,799 | 100.0% |
School Enrollment by Age by Funding Source in Warrensburg
Out of a total of 7,799 students who are enrolled in schools in Warrensburg, 429 (5.5%) attend a private institution, while the remaining 7,370 (94.5%) are enrolled in public schools. The age group of 3 to 4 year olds has the highest likelihood of being enrolled in private schools, with 102 (42.1% in the age bracket) enrolled. Conversely, the age group of 18 to 19 year olds has the lowest likelihood of being enrolled in a private school, with 2,092 (100.0% in the age bracket) attending a public institution.
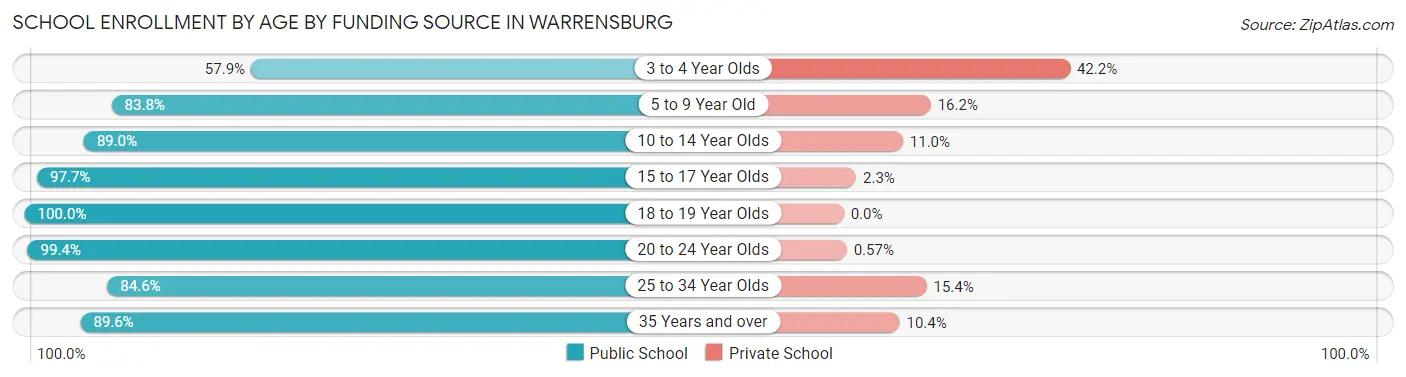
| Age Bracket | Public School | Private School |
| 3 to 4 Year Olds | 140 (57.9%) | 102 (42.1%) |
| 5 to 9 Year Old | 599 (83.8%) | 116 (16.2%) |
| 10 to 14 Year Olds | 937 (89.0%) | 116 (11.0%) |
| 15 to 17 Year Olds | 337 (97.7%) | 8 (2.3%) |
| 18 to 19 Year Olds | 2,092 (100.0%) | 0 (0.0%) |
| 20 to 24 Year Olds | 2,791 (99.4%) | 16 (0.6%) |
| 25 to 34 Year Olds | 274 (84.6%) | 50 (15.4%) |
| 35 Years and over | 198 (89.6%) | 23 (10.4%) |
| Total | 7,370 (94.5%) | 429 (5.5%) |
Educational Attainment by Field of Study in Warrensburg
Education (580 | 14.8%), arts & humanities (542 | 13.9%), business (514 | 13.2%), science & technology (365 | 9.3%), and engineering (256 | 6.6%) are the most common fields of study among 3,906 individuals in Warrensburg who have obtained a bachelor's degree or higher.
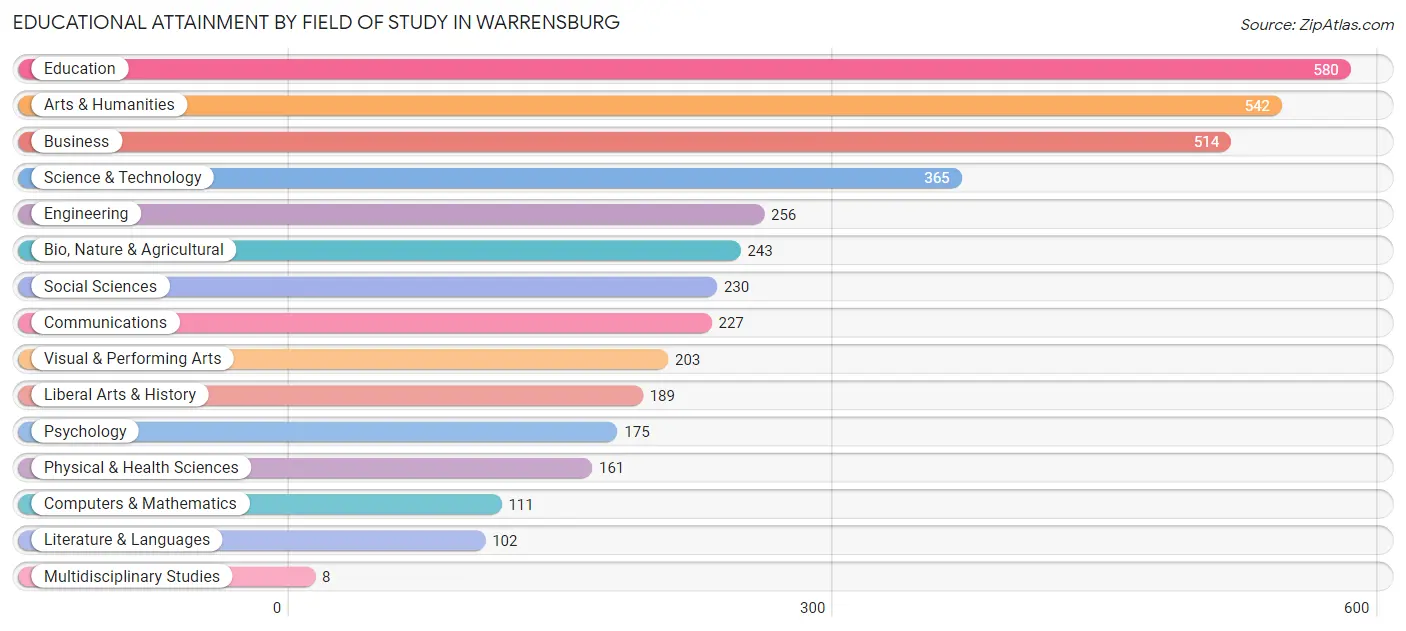
| Field of Study | # Graduates | % Graduates |
| Computers & Mathematics | 111 | 2.8% |
| Bio, Nature & Agricultural | 243 | 6.2% |
| Physical & Health Sciences | 161 | 4.1% |
| Psychology | 175 | 4.5% |
| Social Sciences | 230 | 5.9% |
| Engineering | 256 | 6.6% |
| Multidisciplinary Studies | 8 | 0.2% |
| Science & Technology | 365 | 9.3% |
| Business | 514 | 13.2% |
| Education | 580 | 14.8% |
| Literature & Languages | 102 | 2.6% |
| Liberal Arts & History | 189 | 4.8% |
| Visual & Performing Arts | 203 | 5.2% |
| Communications | 227 | 5.8% |
| Arts & Humanities | 542 | 13.9% |
| Total | 3,906 | 100.0% |
Transportation & Commute in Warrensburg
Vehicle Availability by Sex in Warrensburg
The most prevalent vehicle ownership categories in Warrensburg are males with 2 vehicles (2,187, accounting for 49.7%) and females with 2 vehicles (2,127, making up 50.7%).
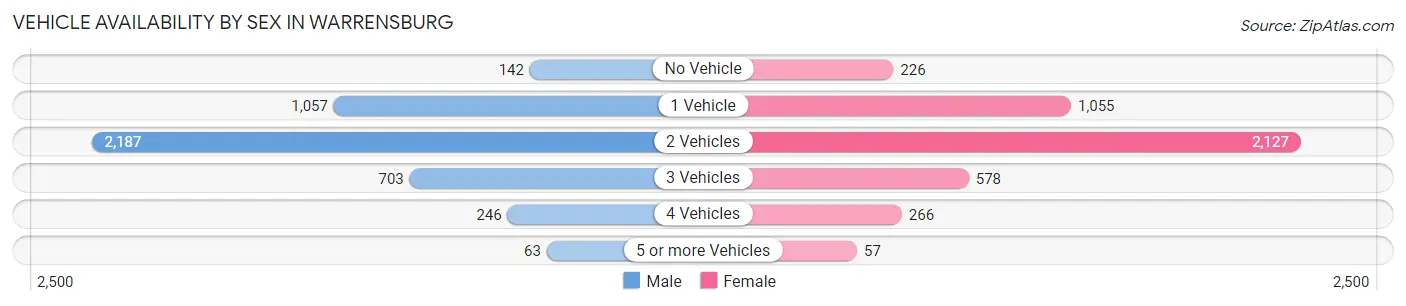
| Vehicles Available | Male | Female |
| No Vehicle | 142 (3.2%) | 226 (5.2%) |
| 1 Vehicle | 1,057 (24.0%) | 1,055 (24.5%) |
| 2 Vehicles | 2,187 (49.7%) | 2,127 (49.4%) |
| 3 Vehicles | 703 (16.0%) | 578 (13.4%) |
| 4 Vehicles | 246 (5.6%) | 266 (6.2%) |
| 5 or more Vehicles | 63 (1.4%) | 57 (1.3%) |
| Total | 4,398 (100.0%) | 4,309 (100.0%) |
Commute Time in Warrensburg
The most frequently occuring commute durations in Warrensburg are 5 to 9 minutes (2,157 commuters, 23.5%), 10 to 14 minutes (2,025 commuters, 22.1%), and 15 to 19 minutes (1,427 commuters, 15.6%).
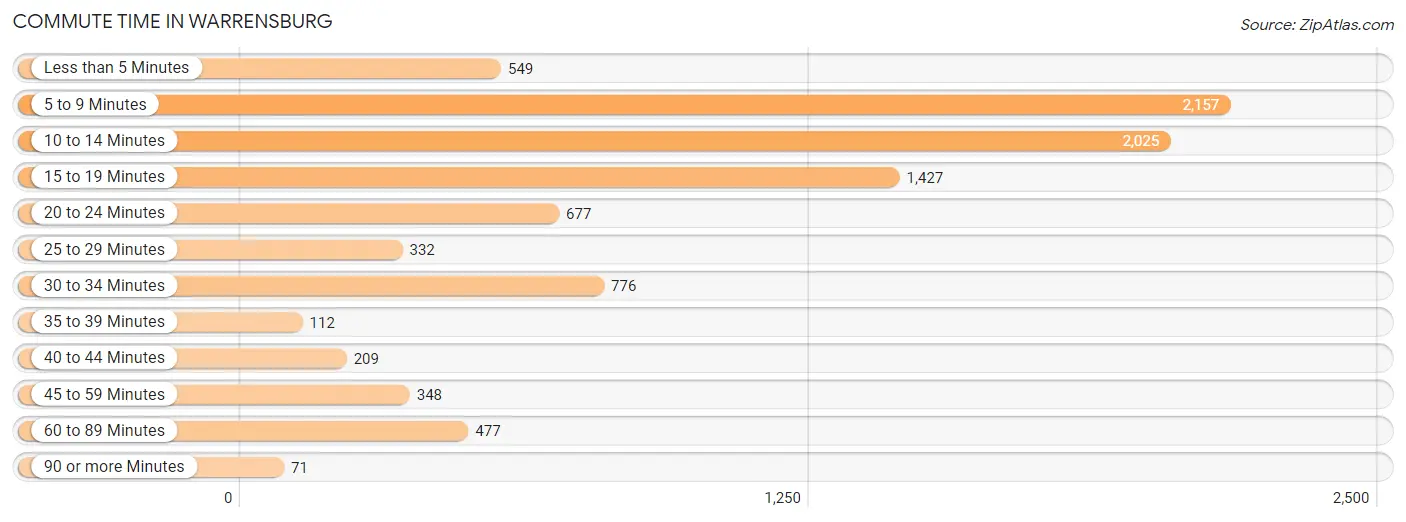
| Commute Time | # Commuters | % Commuters |
| Less than 5 Minutes | 549 | 6.0% |
| 5 to 9 Minutes | 2,157 | 23.5% |
| 10 to 14 Minutes | 2,025 | 22.1% |
| 15 to 19 Minutes | 1,427 | 15.6% |
| 20 to 24 Minutes | 677 | 7.4% |
| 25 to 29 Minutes | 332 | 3.6% |
| 30 to 34 Minutes | 776 | 8.5% |
| 35 to 39 Minutes | 112 | 1.2% |
| 40 to 44 Minutes | 209 | 2.3% |
| 45 to 59 Minutes | 348 | 3.8% |
| 60 to 89 Minutes | 477 | 5.2% |
| 90 or more Minutes | 71 | 0.8% |
Commute Time by Sex in Warrensburg
The most common commute times in Warrensburg are 5 to 9 minutes (937 commuters, 20.0%) for males and 5 to 9 minutes (1,220 commuters, 27.3%) for females.
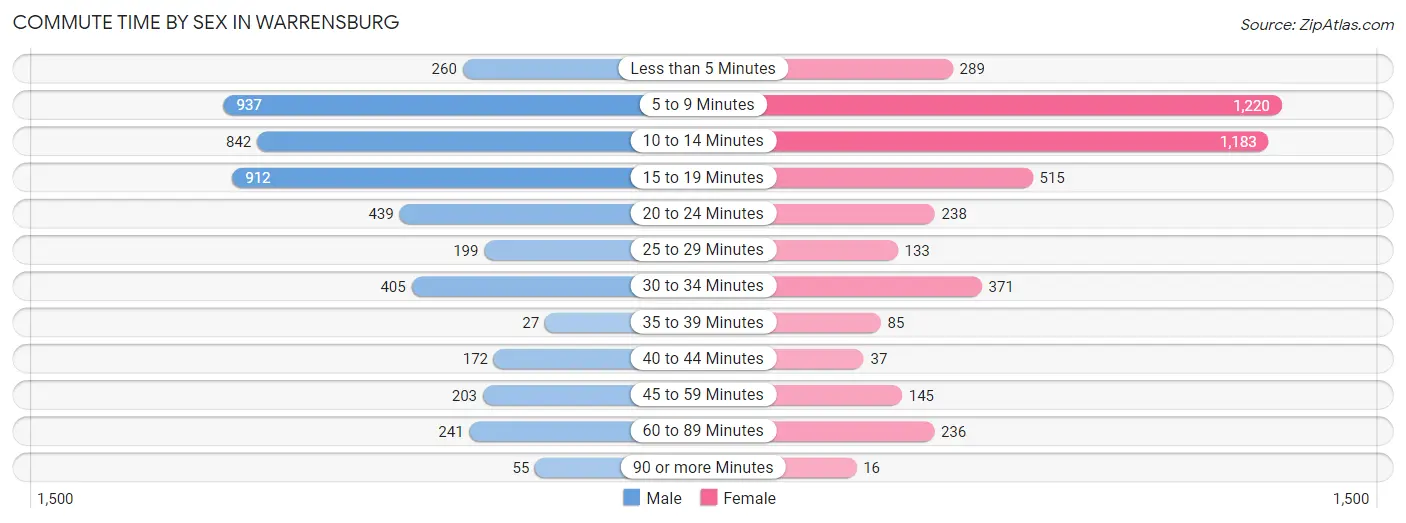
| Commute Time | Male | Female |
| Less than 5 Minutes | 260 (5.5%) | 289 (6.5%) |
| 5 to 9 Minutes | 937 (20.0%) | 1,220 (27.3%) |
| 10 to 14 Minutes | 842 (17.9%) | 1,183 (26.5%) |
| 15 to 19 Minutes | 912 (19.4%) | 515 (11.5%) |
| 20 to 24 Minutes | 439 (9.4%) | 238 (5.3%) |
| 25 to 29 Minutes | 199 (4.2%) | 133 (3.0%) |
| 30 to 34 Minutes | 405 (8.6%) | 371 (8.3%) |
| 35 to 39 Minutes | 27 (0.6%) | 85 (1.9%) |
| 40 to 44 Minutes | 172 (3.7%) | 37 (0.8%) |
| 45 to 59 Minutes | 203 (4.3%) | 145 (3.3%) |
| 60 to 89 Minutes | 241 (5.1%) | 236 (5.3%) |
| 90 or more Minutes | 55 (1.2%) | 16 (0.4%) |
Time of Departure to Work by Sex in Warrensburg
The most frequent times of departure to work in Warrensburg are 7:00 AM to 7:29 AM (683, 14.6%) for males and 7:30 AM to 7:59 AM (903, 20.2%) for females.
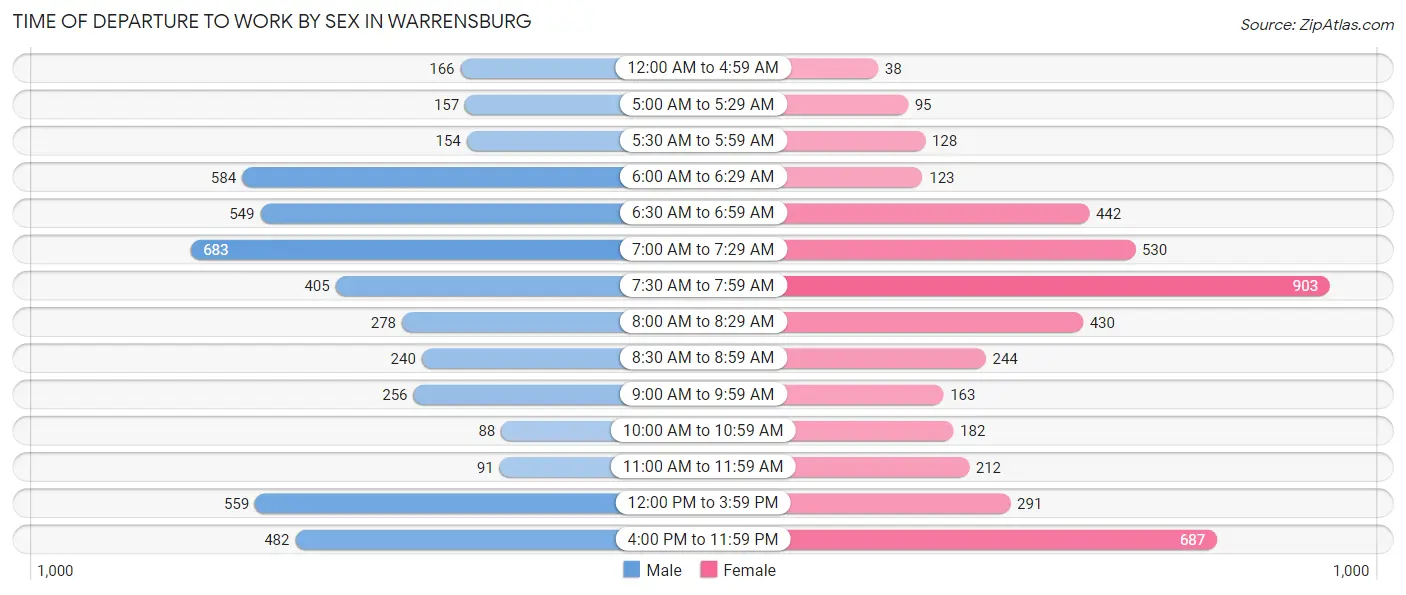
| Time of Departure | Male | Female |
| 12:00 AM to 4:59 AM | 166 (3.5%) | 38 (0.9%) |
| 5:00 AM to 5:29 AM | 157 (3.4%) | 95 (2.1%) |
| 5:30 AM to 5:59 AM | 154 (3.3%) | 128 (2.9%) |
| 6:00 AM to 6:29 AM | 584 (12.4%) | 123 (2.8%) |
| 6:30 AM to 6:59 AM | 549 (11.7%) | 442 (9.9%) |
| 7:00 AM to 7:29 AM | 683 (14.6%) | 530 (11.9%) |
| 7:30 AM to 7:59 AM | 405 (8.6%) | 903 (20.2%) |
| 8:00 AM to 8:29 AM | 278 (5.9%) | 430 (9.6%) |
| 8:30 AM to 8:59 AM | 240 (5.1%) | 244 (5.5%) |
| 9:00 AM to 9:59 AM | 256 (5.5%) | 163 (3.6%) |
| 10:00 AM to 10:59 AM | 88 (1.9%) | 182 (4.1%) |
| 11:00 AM to 11:59 AM | 91 (1.9%) | 212 (4.7%) |
| 12:00 PM to 3:59 PM | 559 (11.9%) | 291 (6.5%) |
| 4:00 PM to 11:59 PM | 482 (10.3%) | 687 (15.4%) |
| Total | 4,692 (100.0%) | 4,468 (100.0%) |
Housing Occupancy in Warrensburg
Occupancy by Ownership in Warrensburg
Of the total 7,246 dwellings in Warrensburg, owner-occupied units account for 3,401 (46.9%), while renter-occupied units make up 3,845 (53.1%).
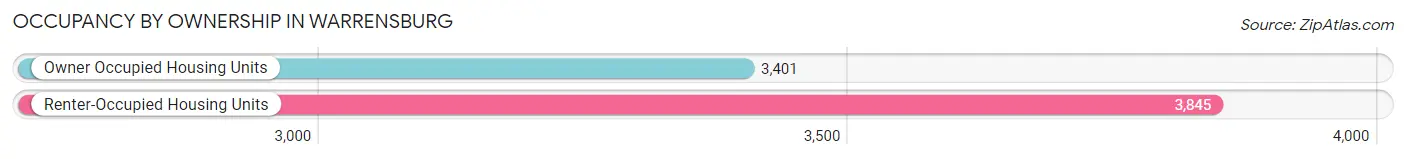
| Occupancy | # Housing Units | % Housing Units |
| Owner Occupied Housing Units | 3,401 | 46.9% |
| Renter-Occupied Housing Units | 3,845 | 53.1% |
| Total Occupied Housing Units | 7,246 | 100.0% |
Occupancy by Household Size in Warrensburg
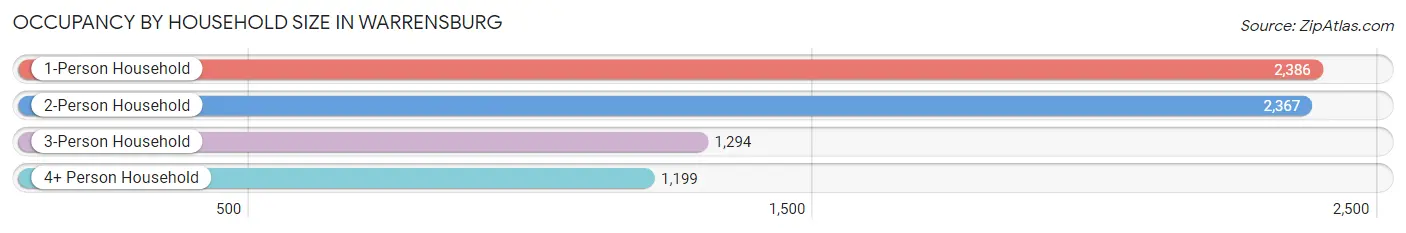
| Household Size | # Housing Units | % Housing Units |
| 1-Person Household | 2,386 | 32.9% |
| 2-Person Household | 2,367 | 32.7% |
| 3-Person Household | 1,294 | 17.9% |
| 4+ Person Household | 1,199 | 16.6% |
| Total Housing Units | 7,246 | 100.0% |
Occupancy by Ownership by Household Size in Warrensburg
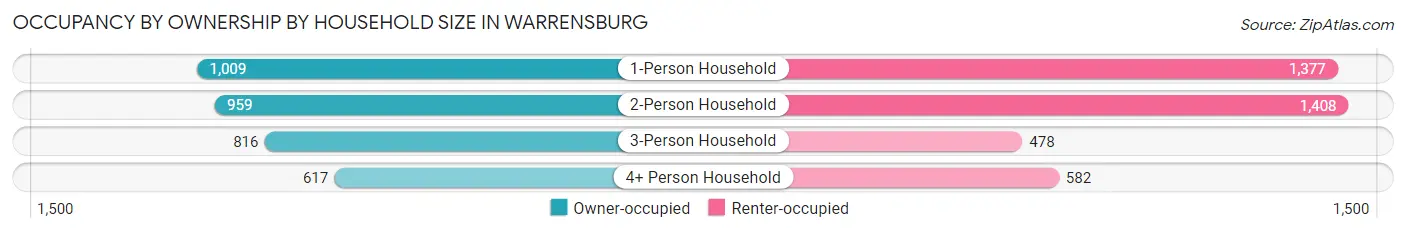
| Household Size | Owner-occupied | Renter-occupied |
| 1-Person Household | 1,009 (42.3%) | 1,377 (57.7%) |
| 2-Person Household | 959 (40.5%) | 1,408 (59.5%) |
| 3-Person Household | 816 (63.1%) | 478 (36.9%) |
| 4+ Person Household | 617 (51.5%) | 582 (48.5%) |
| Total Housing Units | 3,401 (46.9%) | 3,845 (53.1%) |
Occupancy by Educational Attainment in Warrensburg
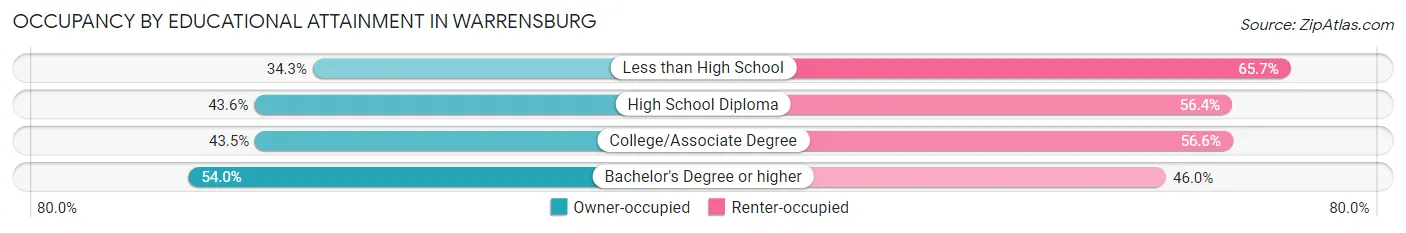
| Household Size | Owner-occupied | Renter-occupied |
| Less than High School | 107 (34.3%) | 205 (65.7%) |
| High School Diploma | 699 (43.6%) | 905 (56.4%) |
| College/Associate Degree | 1,168 (43.4%) | 1,520 (56.6%) |
| Bachelor's Degree or higher | 1,427 (54.0%) | 1,215 (46.0%) |
Occupancy by Age of Householder in Warrensburg
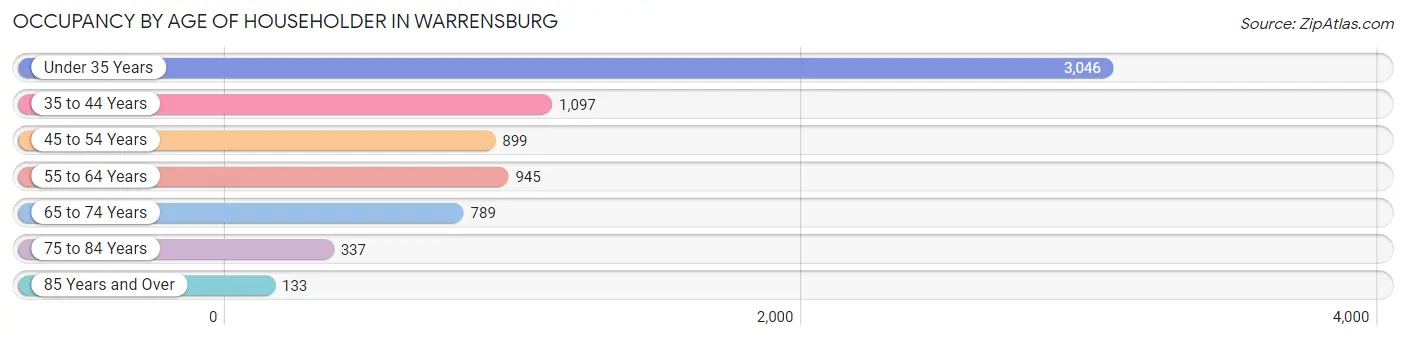
| Age Bracket | # Households | % Households |
| Under 35 Years | 3,046 | 42.0% |
| 35 to 44 Years | 1,097 | 15.1% |
| 45 to 54 Years | 899 | 12.4% |
| 55 to 64 Years | 945 | 13.0% |
| 65 to 74 Years | 789 | 10.9% |
| 75 to 84 Years | 337 | 4.6% |
| 85 Years and Over | 133 | 1.8% |
| Total | 7,246 | 100.0% |
Housing Finances in Warrensburg
Median Income by Occupancy in Warrensburg
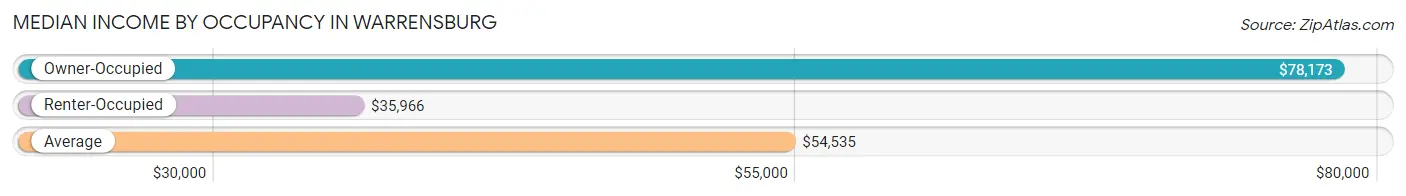
| Occupancy Type | # Households | Median Income |
| Owner-Occupied | 3,401 (46.9%) | $78,173 |
| Renter-Occupied | 3,845 (53.1%) | $35,966 |
| Average | 7,246 (100.0%) | $54,535 |
Occupancy by Householder Income Bracket in Warrensburg
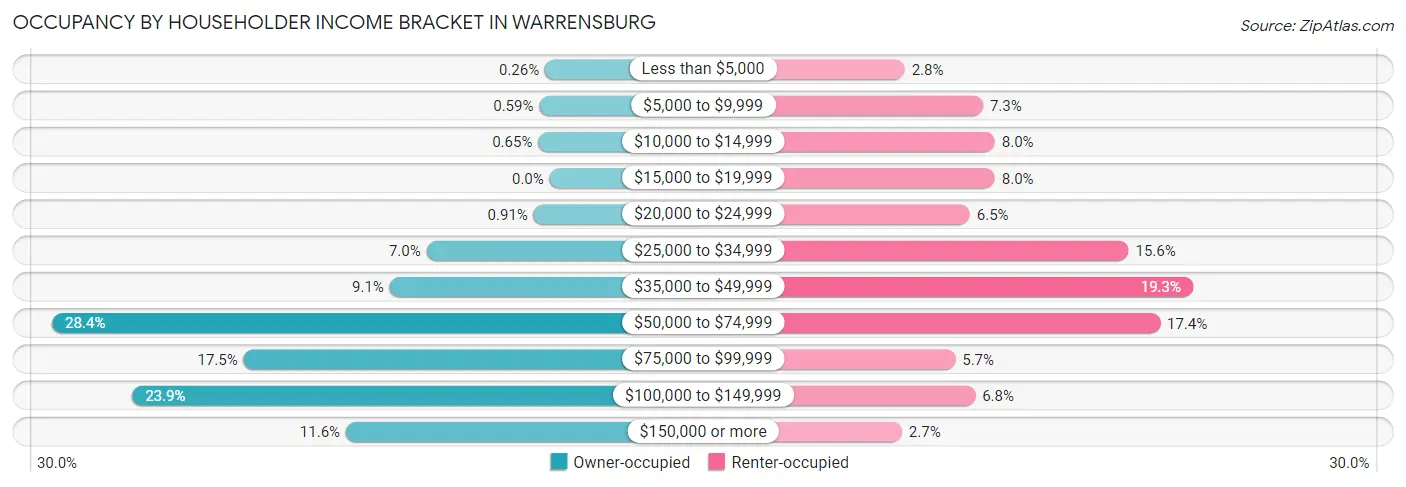
| Income Bracket | Owner-occupied | Renter-occupied |
| Less than $5,000 | 9 (0.3%) | 108 (2.8%) |
| $5,000 to $9,999 | 20 (0.6%) | 280 (7.3%) |
| $10,000 to $14,999 | 22 (0.6%) | 306 (8.0%) |
| $15,000 to $19,999 | 0 (0.0%) | 306 (8.0%) |
| $20,000 to $24,999 | 31 (0.9%) | 251 (6.5%) |
| $25,000 to $34,999 | 239 (7.0%) | 600 (15.6%) |
| $35,000 to $49,999 | 311 (9.1%) | 741 (19.3%) |
| $50,000 to $74,999 | 967 (28.4%) | 669 (17.4%) |
| $75,000 to $99,999 | 595 (17.5%) | 219 (5.7%) |
| $100,000 to $149,999 | 811 (23.8%) | 263 (6.8%) |
| $150,000 or more | 396 (11.6%) | 102 (2.6%) |
| Total | 3,401 (100.0%) | 3,845 (100.0%) |
Monthly Housing Cost Tiers in Warrensburg
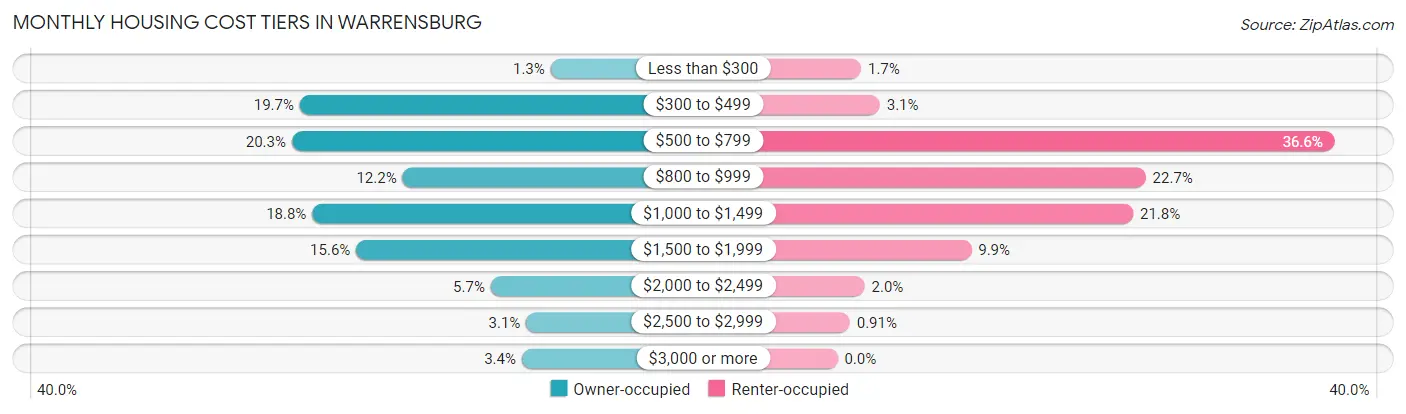
| Monthly Cost | Owner-occupied | Renter-occupied |
| Less than $300 | 43 (1.3%) | 67 (1.7%) |
| $300 to $499 | 671 (19.7%) | 120 (3.1%) |
| $500 to $799 | 691 (20.3%) | 1,408 (36.6%) |
| $800 to $999 | 414 (12.2%) | 873 (22.7%) |
| $1,000 to $1,499 | 640 (18.8%) | 837 (21.8%) |
| $1,500 to $1,999 | 530 (15.6%) | 379 (9.9%) |
| $2,000 to $2,499 | 193 (5.7%) | 77 (2.0%) |
| $2,500 to $2,999 | 104 (3.1%) | 35 (0.9%) |
| $3,000 or more | 115 (3.4%) | 0 (0.0%) |
| Total | 3,401 (100.0%) | 3,845 (100.0%) |
Physical Housing Characteristics in Warrensburg
Housing Structures in Warrensburg
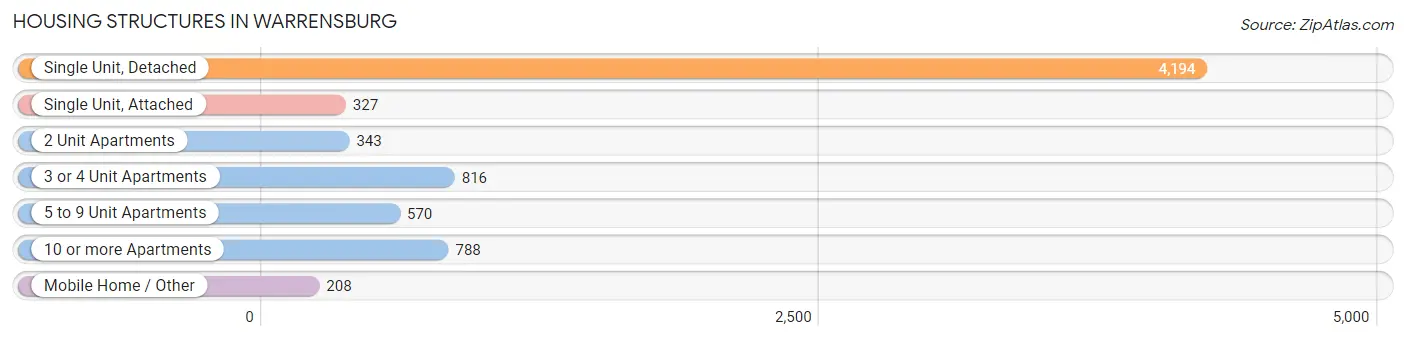
| Structure Type | # Housing Units | % Housing Units |
| Single Unit, Detached | 4,194 | 57.9% |
| Single Unit, Attached | 327 | 4.5% |
| 2 Unit Apartments | 343 | 4.7% |
| 3 or 4 Unit Apartments | 816 | 11.3% |
| 5 to 9 Unit Apartments | 570 | 7.9% |
| 10 or more Apartments | 788 | 10.9% |
| Mobile Home / Other | 208 | 2.9% |
| Total | 7,246 | 100.0% |
Housing Structures by Occupancy in Warrensburg
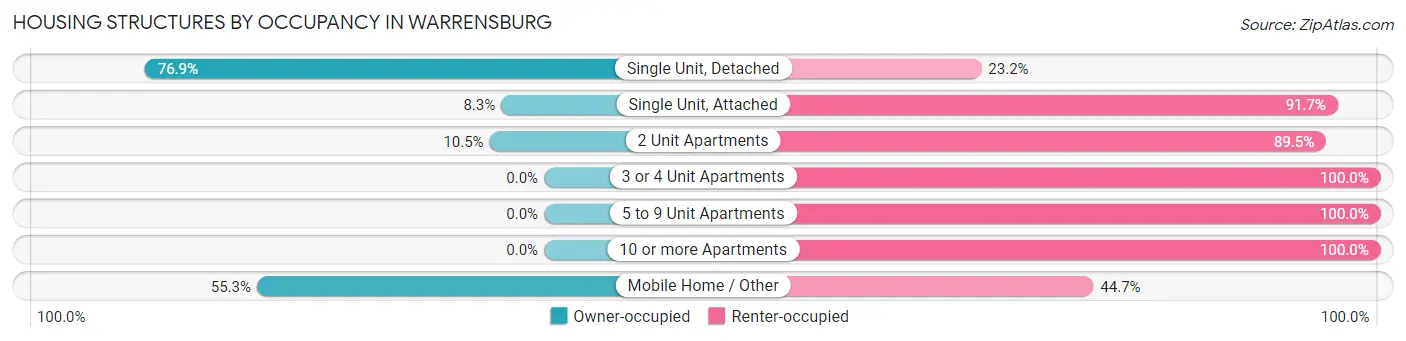
| Structure Type | Owner-occupied | Renter-occupied |
| Single Unit, Detached | 3,223 (76.8%) | 971 (23.2%) |
| Single Unit, Attached | 27 (8.3%) | 300 (91.7%) |
| 2 Unit Apartments | 36 (10.5%) | 307 (89.5%) |
| 3 or 4 Unit Apartments | 0 (0.0%) | 816 (100.0%) |
| 5 to 9 Unit Apartments | 0 (0.0%) | 570 (100.0%) |
| 10 or more Apartments | 0 (0.0%) | 788 (100.0%) |
| Mobile Home / Other | 115 (55.3%) | 93 (44.7%) |
| Total | 3,401 (46.9%) | 3,845 (53.1%) |
Housing Structures by Number of Rooms in Warrensburg
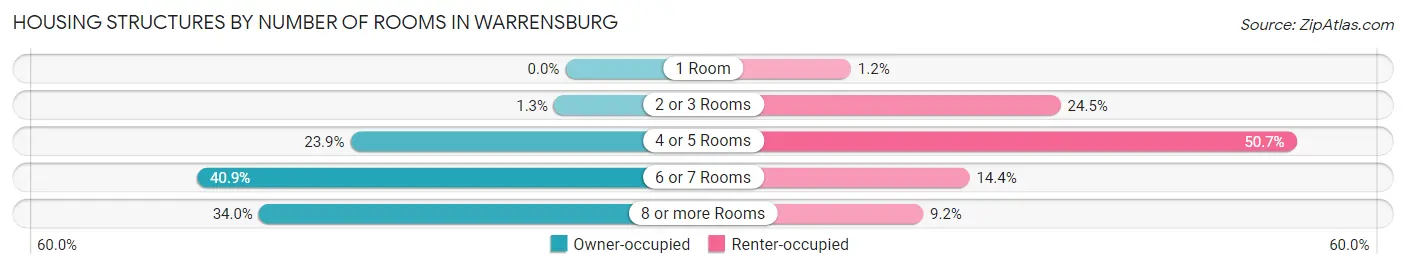
| Number of Rooms | Owner-occupied | Renter-occupied |
| 1 Room | 0 (0.0%) | 47 (1.2%) |
| 2 or 3 Rooms | 43 (1.3%) | 942 (24.5%) |
| 4 or 5 Rooms | 811 (23.8%) | 1,948 (50.7%) |
| 6 or 7 Rooms | 1,390 (40.9%) | 553 (14.4%) |
| 8 or more Rooms | 1,157 (34.0%) | 355 (9.2%) |
| Total | 3,401 (100.0%) | 3,845 (100.0%) |
Housing Structure by Heating Type in Warrensburg
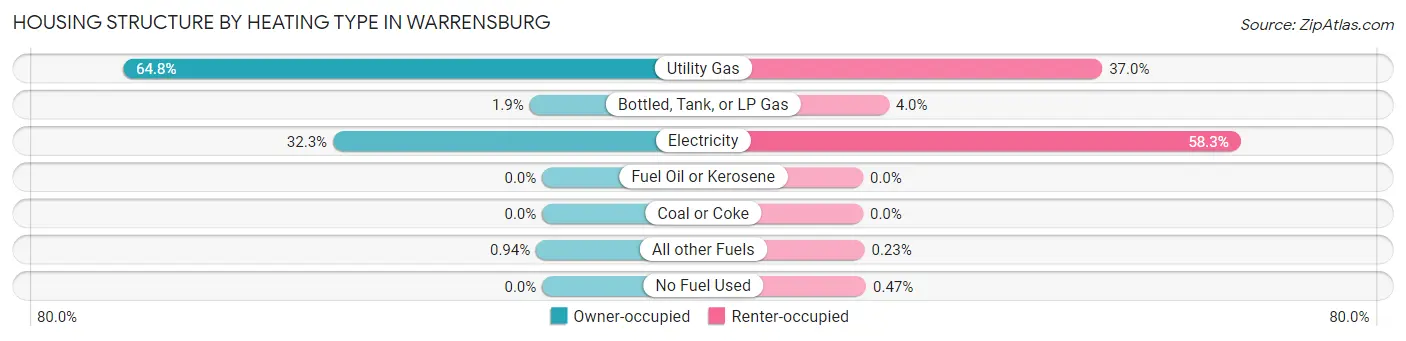
| Heating Type | Owner-occupied | Renter-occupied |
| Utility Gas | 2,203 (64.8%) | 1,422 (37.0%) |
| Bottled, Tank, or LP Gas | 66 (1.9%) | 153 (4.0%) |
| Electricity | 1,100 (32.3%) | 2,243 (58.3%) |
| Fuel Oil or Kerosene | 0 (0.0%) | 0 (0.0%) |
| Coal or Coke | 0 (0.0%) | 0 (0.0%) |
| All other Fuels | 32 (0.9%) | 9 (0.2%) |
| No Fuel Used | 0 (0.0%) | 18 (0.5%) |
| Total | 3,401 (100.0%) | 3,845 (100.0%) |
Household Vehicle Usage in Warrensburg
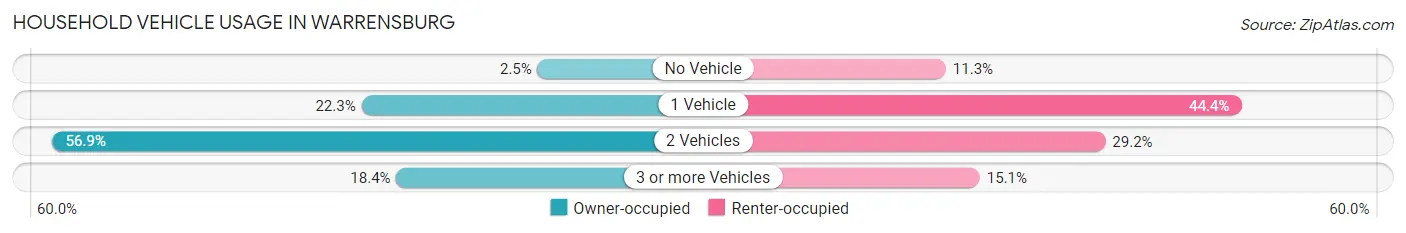
| Vehicles per Household | Owner-occupied | Renter-occupied |
| No Vehicle | 86 (2.5%) | 435 (11.3%) |
| 1 Vehicle | 757 (22.3%) | 1,707 (44.4%) |
| 2 Vehicles | 1,934 (56.9%) | 1,122 (29.2%) |
| 3 or more Vehicles | 624 (18.3%) | 581 (15.1%) |
| Total | 3,401 (100.0%) | 3,845 (100.0%) |
Real Estate & Mortgages in Warrensburg
Real Estate and Mortgage Overview in Warrensburg
| Characteristic | Without Mortgage | With Mortgage |
| Housing Units | 1,253 | 2,148 |
| Median Property Value | $174,300 | $205,500 |
| Median Household Income | $71,011 | $279 |
| Monthly Housing Costs | $474 | $93 |
| Real Estate Taxes | $1,484 | $77 |
Property Value by Mortgage Status in Warrensburg
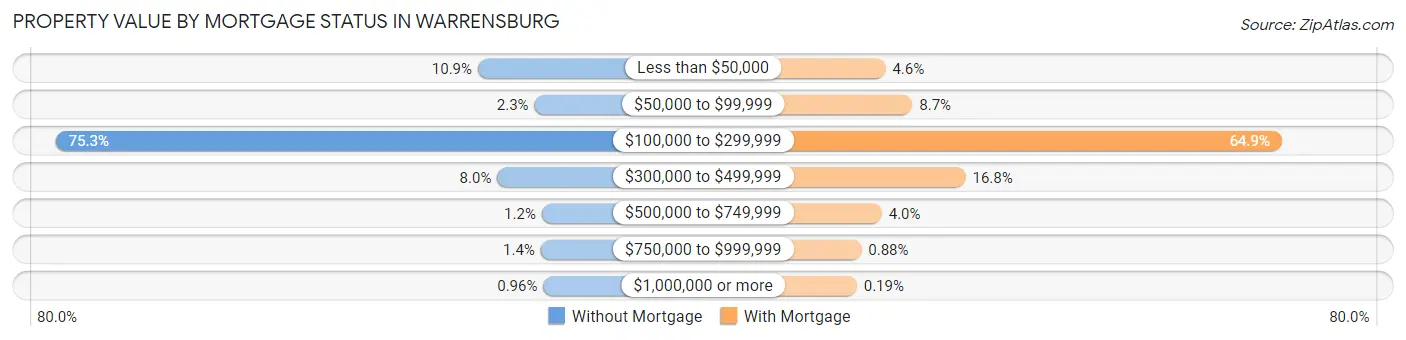
| Property Value | Without Mortgage | With Mortgage |
| Less than $50,000 | 137 (10.9%) | 98 (4.6%) |
| $50,000 to $99,999 | 29 (2.3%) | 186 (8.7%) |
| $100,000 to $299,999 | 943 (75.3%) | 1,395 (64.9%) |
| $300,000 to $499,999 | 100 (8.0%) | 360 (16.8%) |
| $500,000 to $749,999 | 15 (1.2%) | 86 (4.0%) |
| $750,000 to $999,999 | 17 (1.4%) | 19 (0.9%) |
| $1,000,000 or more | 12 (1.0%) | 4 (0.2%) |
| Total | 1,253 (100.0%) | 2,148 (100.0%) |
Household Income by Mortgage Status in Warrensburg
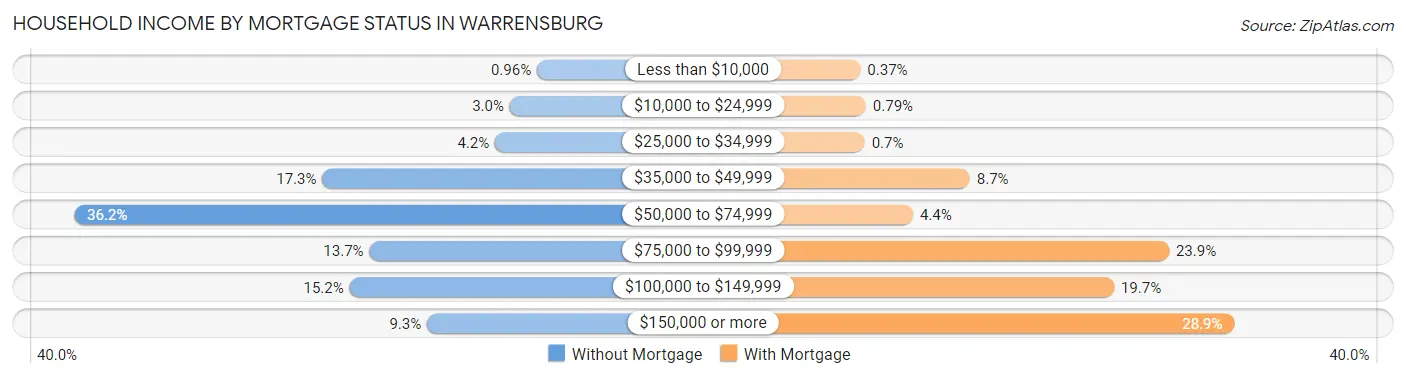
| Household Income | Without Mortgage | With Mortgage |
| Less than $10,000 | 12 (1.0%) | 8 (0.4%) |
| $10,000 to $24,999 | 38 (3.0%) | 17 (0.8%) |
| $25,000 to $34,999 | 52 (4.2%) | 15 (0.7%) |
| $35,000 to $49,999 | 217 (17.3%) | 187 (8.7%) |
| $50,000 to $74,999 | 454 (36.2%) | 94 (4.4%) |
| $75,000 to $99,999 | 172 (13.7%) | 513 (23.9%) |
| $100,000 to $149,999 | 191 (15.2%) | 423 (19.7%) |
| $150,000 or more | 117 (9.3%) | 620 (28.9%) |
| Total | 1,253 (100.0%) | 2,148 (100.0%) |
Property Value to Household Income Ratio in Warrensburg
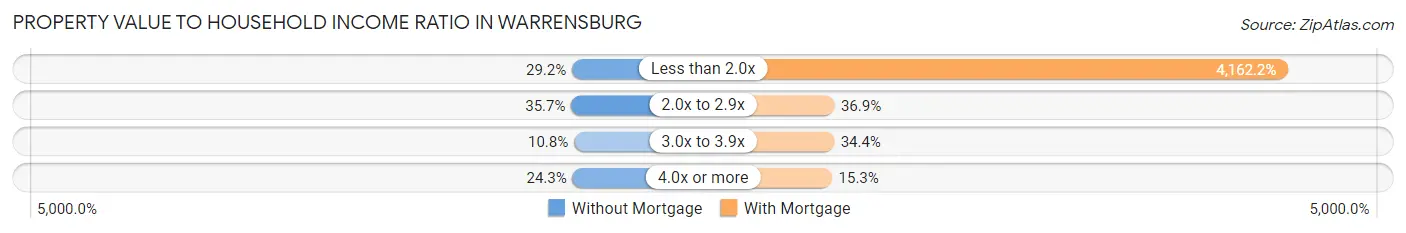
| Value-to-Income Ratio | Without Mortgage | With Mortgage |
| Less than 2.0x | 366 (29.2%) | 89,405 (4,162.2%) |
| 2.0x to 2.9x | 447 (35.7%) | 793 (36.9%) |
| 3.0x to 3.9x | 135 (10.8%) | 738 (34.4%) |
| 4.0x or more | 305 (24.3%) | 329 (15.3%) |
| Total | 1,253 (100.0%) | 2,148 (100.0%) |
Real Estate Taxes by Mortgage Status in Warrensburg
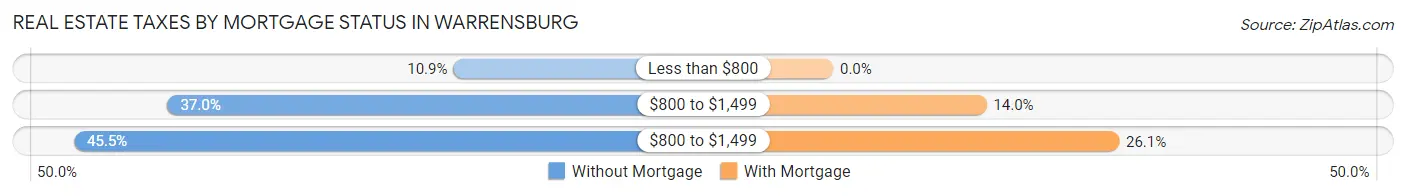
| Property Taxes | Without Mortgage | With Mortgage |
| Less than $800 | 136 (10.8%) | 0 (0.0%) |
| $800 to $1,499 | 463 (36.9%) | 301 (14.0%) |
| $800 to $1,499 | 570 (45.5%) | 561 (26.1%) |
| Total | 1,253 (100.0%) | 2,148 (100.0%) |
Health & Disability in Warrensburg
Health Insurance Coverage by Age in Warrensburg
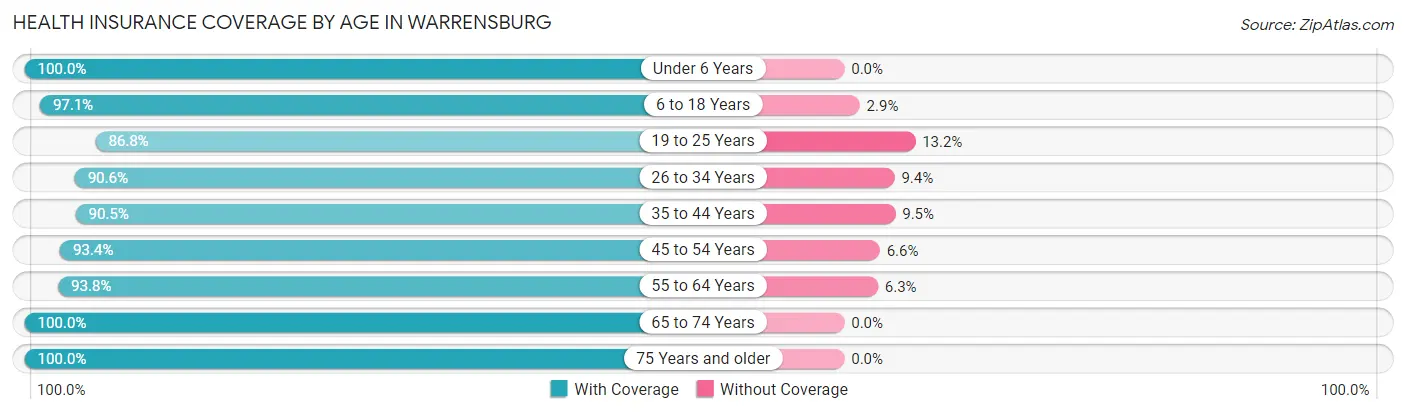
| Age Bracket | With Coverage | Without Coverage |
| Under 6 Years | 1,157 (100.0%) | 0 (0.0%) |
| 6 to 18 Years | 3,116 (97.1%) | 92 (2.9%) |
| 19 to 25 Years | 4,853 (86.8%) | 739 (13.2%) |
| 26 to 34 Years | 1,511 (90.6%) | 156 (9.4%) |
| 35 to 44 Years | 1,675 (90.5%) | 176 (9.5%) |
| 45 to 54 Years | 1,285 (93.4%) | 91 (6.6%) |
| 55 to 64 Years | 1,246 (93.8%) | 83 (6.2%) |
| 65 to 74 Years | 1,049 (100.0%) | 0 (0.0%) |
| 75 Years and older | 703 (100.0%) | 0 (0.0%) |
| Total | 16,595 (92.5%) | 1,337 (7.5%) |
Health Insurance Coverage by Citizenship Status in Warrensburg
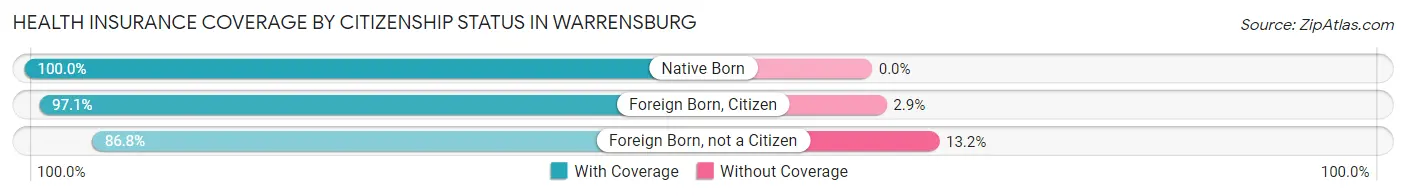
| Citizenship Status | With Coverage | Without Coverage |
| Native Born | 1,157 (100.0%) | 0 (0.0%) |
| Foreign Born, Citizen | 3,116 (97.1%) | 92 (2.9%) |
| Foreign Born, not a Citizen | 4,853 (86.8%) | 739 (13.2%) |
Health Insurance Coverage by Household Income in Warrensburg
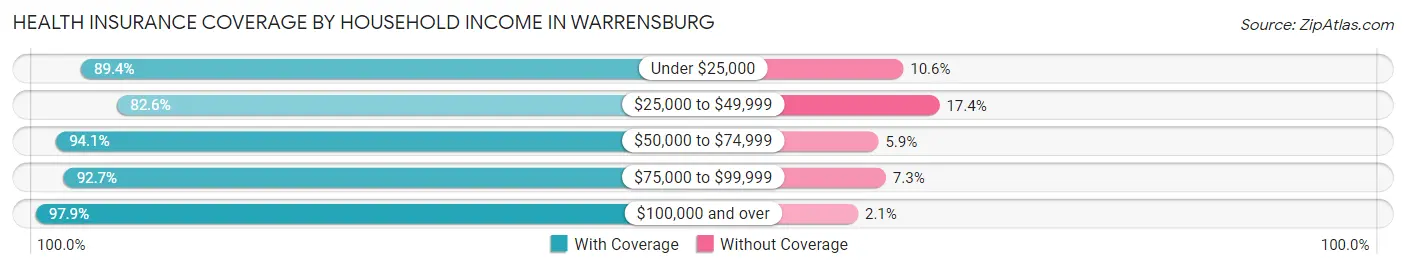
| Household Income | With Coverage | Without Coverage |
| Under $25,000 | 1,891 (89.4%) | 224 (10.6%) |
| $25,000 to $49,999 | 2,774 (82.6%) | 583 (17.4%) |
| $50,000 to $74,999 | 3,234 (94.1%) | 204 (5.9%) |
| $75,000 to $99,999 | 1,795 (92.7%) | 142 (7.3%) |
| $100,000 and over | 4,511 (97.9%) | 97 (2.1%) |
Public vs Private Health Insurance Coverage by Age in Warrensburg
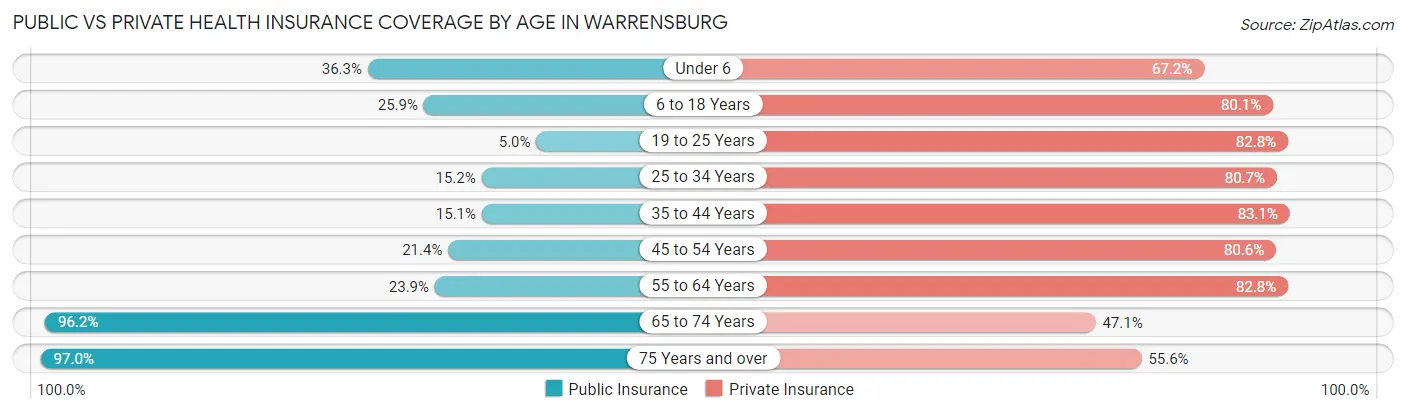
| Age Bracket | Public Insurance | Private Insurance |
| Under 6 | 420 (36.3%) | 778 (67.2%) |
| 6 to 18 Years | 831 (25.9%) | 2,568 (80.0%) |
| 19 to 25 Years | 280 (5.0%) | 4,630 (82.8%) |
| 25 to 34 Years | 253 (15.2%) | 1,346 (80.7%) |
| 35 to 44 Years | 280 (15.1%) | 1,539 (83.1%) |
| 45 to 54 Years | 294 (21.4%) | 1,109 (80.6%) |
| 55 to 64 Years | 317 (23.8%) | 1,101 (82.8%) |
| 65 to 74 Years | 1,009 (96.2%) | 494 (47.1%) |
| 75 Years and over | 682 (97.0%) | 391 (55.6%) |
| Total | 4,366 (24.3%) | 13,956 (77.8%) |
Disability Status by Sex by Age in Warrensburg
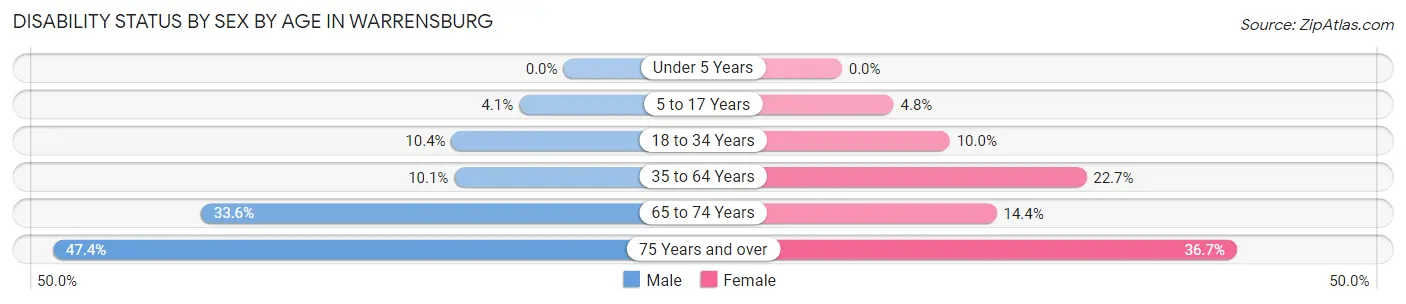
| Age Bracket | Male | Female |
| Under 5 Years | 0 (0.0%) | 0 (0.0%) |
| 5 to 17 Years | 51 (4.1%) | 60 (4.8%) |
| 18 to 34 Years | 419 (10.4%) | 419 (10.0%) |
| 35 to 64 Years | 199 (10.1%) | 588 (22.7%) |
| 65 to 74 Years | 217 (33.6%) | 58 (14.4%) |
| 75 Years and over | 90 (47.4%) | 188 (36.6%) |
Disability Class by Sex by Age in Warrensburg
Disability Class: Hearing Difficulty
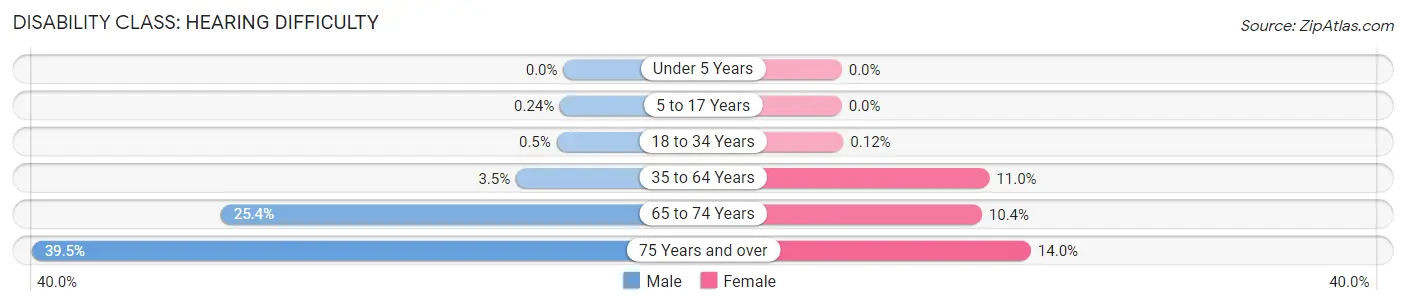
| Age Bracket | Male | Female |
| Under 5 Years | 0 (0.0%) | 0 (0.0%) |
| 5 to 17 Years | 3 (0.2%) | 0 (0.0%) |
| 18 to 34 Years | 20 (0.5%) | 5 (0.1%) |
| 35 to 64 Years | 69 (3.5%) | 284 (11.0%) |
| 65 to 74 Years | 164 (25.4%) | 42 (10.4%) |
| 75 Years and over | 75 (39.5%) | 72 (14.0%) |
Disability Class: Vision Difficulty
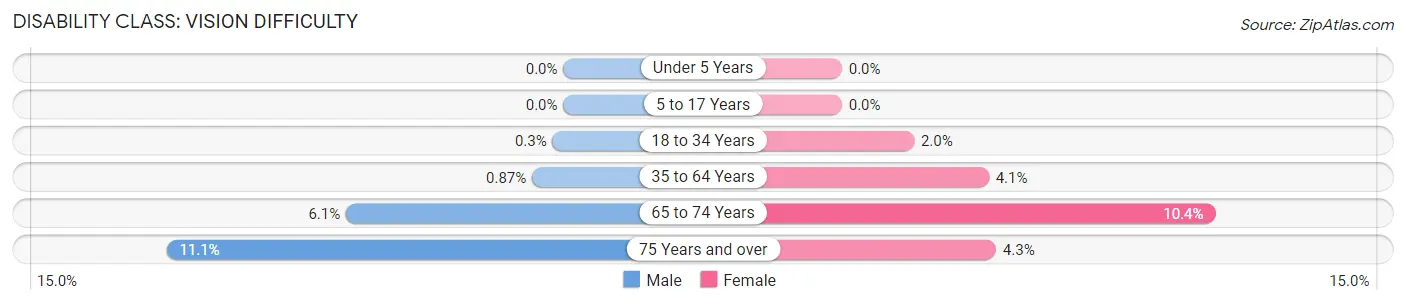
| Age Bracket | Male | Female |
| Under 5 Years | 0 (0.0%) | 0 (0.0%) |
| 5 to 17 Years | 0 (0.0%) | 0 (0.0%) |
| 18 to 34 Years | 12 (0.3%) | 84 (2.0%) |
| 35 to 64 Years | 17 (0.9%) | 106 (4.1%) |
| 65 to 74 Years | 39 (6.0%) | 42 (10.4%) |
| 75 Years and over | 21 (11.1%) | 22 (4.3%) |
Disability Class: Cognitive Difficulty
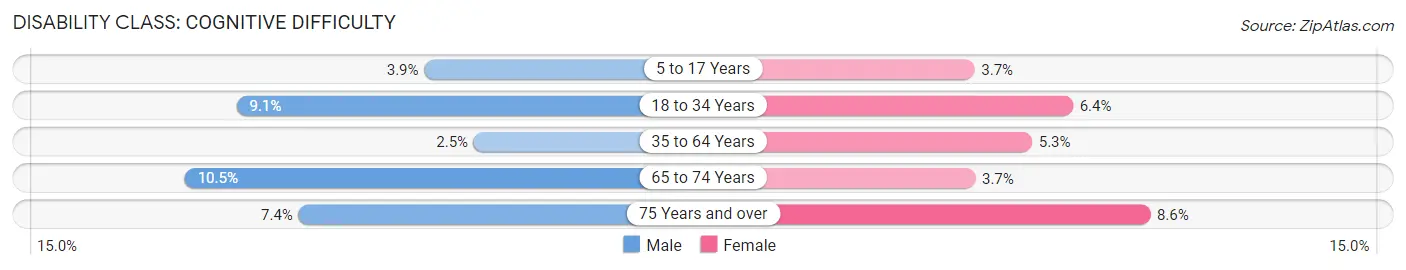
| Age Bracket | Male | Female |
| 5 to 17 Years | 48 (3.9%) | 46 (3.7%) |
| 18 to 34 Years | 367 (9.1%) | 269 (6.4%) |
| 35 to 64 Years | 49 (2.5%) | 137 (5.3%) |
| 65 to 74 Years | 68 (10.5%) | 15 (3.7%) |
| 75 Years and over | 14 (7.4%) | 44 (8.6%) |
Disability Class: Ambulatory Difficulty
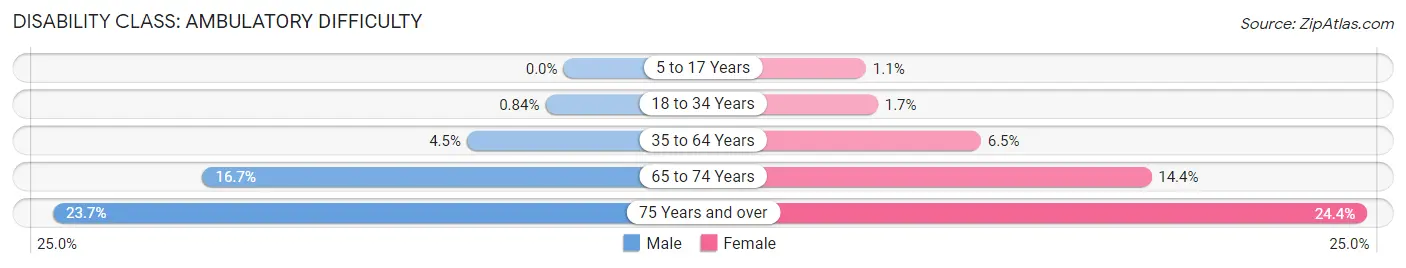
| Age Bracket | Male | Female |
| 5 to 17 Years | 0 (0.0%) | 14 (1.1%) |
| 18 to 34 Years | 34 (0.8%) | 70 (1.7%) |
| 35 to 64 Years | 88 (4.5%) | 167 (6.5%) |
| 65 to 74 Years | 108 (16.7%) | 58 (14.4%) |
| 75 Years and over | 45 (23.7%) | 125 (24.4%) |
Disability Class: Self-Care Difficulty
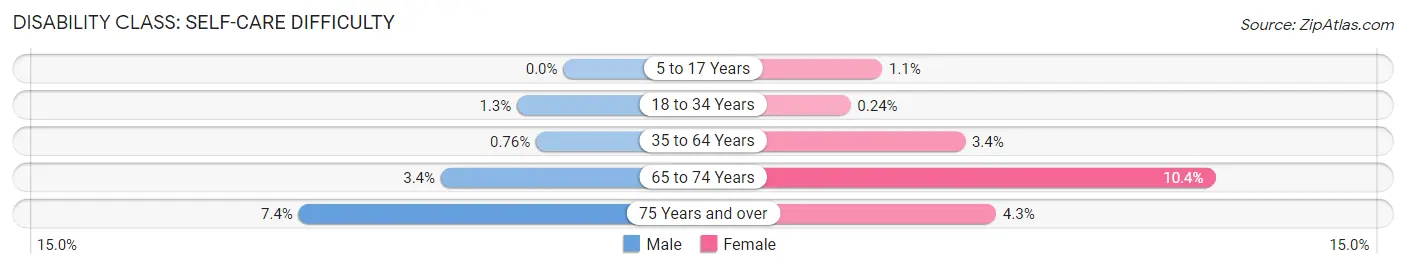
| Age Bracket | Male | Female |
| 5 to 17 Years | 0 (0.0%) | 14 (1.1%) |
| 18 to 34 Years | 52 (1.3%) | 10 (0.2%) |
| 35 to 64 Years | 15 (0.8%) | 89 (3.4%) |
| 65 to 74 Years | 22 (3.4%) | 42 (10.4%) |
| 75 Years and over | 14 (7.4%) | 22 (4.3%) |
Technology Access in Warrensburg
Computing Device Access in Warrensburg
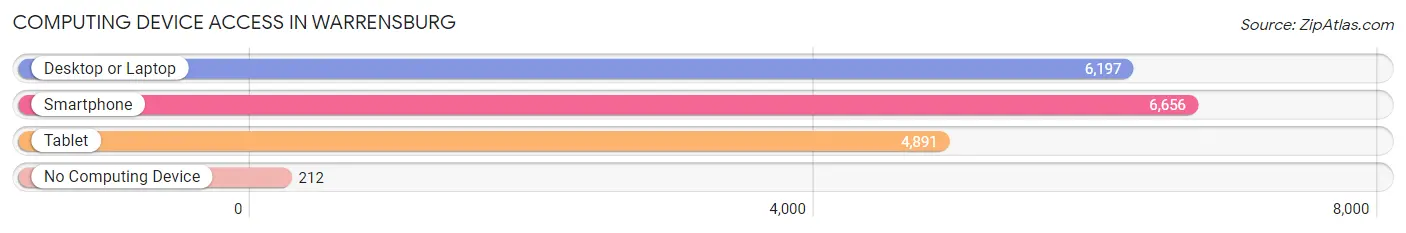
| Device Type | # Households | % Households |
| Desktop or Laptop | 6,197 | 85.5% |
| Smartphone | 6,656 | 91.9% |
| Tablet | 4,891 | 67.5% |
| No Computing Device | 212 | 2.9% |
| Total | 7,246 | 100.0% |
Internet Access in Warrensburg
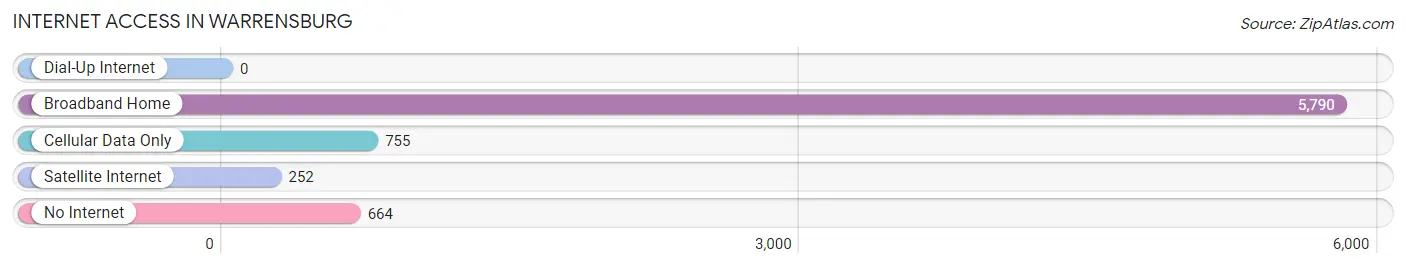
| Internet Type | # Households | % Households |
| Dial-Up Internet | 0 | 0.0% |
| Broadband Home | 5,790 | 79.9% |
| Cellular Data Only | 755 | 10.4% |
| Satellite Internet | 252 | 3.5% |
| No Internet | 664 | 9.2% |
| Total | 7,246 | 100.0% |
Warrensburg Summary
Warrensburg, Missouri is a city located in Johnson County, Missouri, United States. The city is the county seat of Johnson County and is located approximately 50 miles southeast of Kansas City. As of the 2010 census, the city had a population of 19,935.
History
The area that is now Warrensburg was first settled in 1835 by a group of settlers from Kentucky. The settlement was originally known as “Hickory Point” and was located near the present-day intersection of Main Street and Maguire Street. In 1837, the settlement was renamed “Warrensburg” in honor of the first settler, Warren S. Maguire.
In 1838, the first post office was established in Warrensburg and the town was officially incorporated in 1855. During the Civil War, Warrensburg was a major supply center for the Union Army. After the war, the town experienced a period of growth and prosperity. In 1871, the Missouri Pacific Railroad arrived in Warrensburg, connecting the town to the rest of the state and nation.
Geography
Warrensburg is located at 38°45'25" North, 93°45'25" West (38.756944, -93.756944). The city is situated in the rolling hills of central Missouri, approximately 50 miles southeast of Kansas City. The city is located in the Osage Plains region of Missouri and is surrounded by farmland and wooded areas.
The city has a total area of 8.7 square miles, all of which is land. The city is located at an elevation of 1,068 feet above sea level. The city is located in the Central Time Zone and observes Daylight Saving Time.
Economy
The economy of Warrensburg is largely based on agriculture and manufacturing. The city is home to several large employers, including Central Missouri State University, Warrensburg R-VI School District, and the Warrensburg Medical Center.
The city is also home to several small businesses, including restaurants, retail stores, and service providers. The city is also home to several industrial parks, which provide employment opportunities for local residents.
Demographics
As of the 2010 census, there were 19,935 people, 7,845 households, and 4,845 families residing in the city. The population density was 2,288.3 people per square mile. The racial makeup of the city was 87.2% White, 8.2% African American, 0.5% Native American, 1.2% Asian, 0.1% Pacific Islander, 0.7% from other races, and 2.1% from two or more races. Hispanic or Latino of any race were 2.7% of the population.
The median income for a household in the city was $37,945, and the median income for a family was $50,945. The per capita income for the city was $20,845. About 11.2% of families and 16.2% of the population were below the poverty line, including 22.2% of those under age 18 and 8.2% of those age 65 or over.
Common Questions
What is Per Capita Income in Warrensburg?
Per Capita income in Warrensburg is $29,092.
What is the Median Family Income in Warrensburg?
Median Family Income in Warrensburg is $81,205.
What is the Median Household income in Warrensburg?
Median Household Income in Warrensburg is $54,535.
What is Income or Wage Gap in Warrensburg?
Income or Wage Gap in Warrensburg is 37.7%.
Women in Warrensburg earn 62.3 cents for every dollar earned by a man.
What is Family Income Deficit in Warrensburg?
Family Income Deficit in Warrensburg is $9,054.
Families that are below poverty line in Warrensburg earn $9,054 less on average than the poverty threshold level.
What is Inequality or Gini Index in Warrensburg?
Inequality or Gini Index in Warrensburg is 0.45.
What is the Total Population of Warrensburg?
Total Population of Warrensburg is 19,317.
What is the Total Male Population of Warrensburg?
Total Male Population of Warrensburg is 9,597.
What is the Total Female Population of Warrensburg?
Total Female Population of Warrensburg is 9,720.
What is the Ratio of Males per 100 Females in Warrensburg?
There are 98.73 Males per 100 Females in Warrensburg.
What is the Ratio of Females per 100 Males in Warrensburg?
There are 101.28 Females per 100 Males in Warrensburg.
What is the Median Population Age in Warrensburg?
Median Population Age in Warrensburg is 24.4 Years.
What is the Average Family Size in Warrensburg
Average Family Size in Warrensburg is 2.9 People.
What is the Average Household Size in Warrensburg
Average Household Size in Warrensburg is 2.2 People.
How Large is the Labor Force in Warrensburg?
There are 10,529 People in the Labor Forcein in Warrensburg.
What is the Percentage of People in the Labor Force in Warrensburg?
64.8% of People are in the Labor Force in Warrensburg.
What is the Unemployment Rate in Warrensburg?
Unemployment Rate in Warrensburg is 6.8%.