Lathrop, MO Map & Demographics
Lathrop Map
Lathrop Overview
$25,427
PER CAPITA INCOME
$88,150
AVG FAMILY INCOME
$72,804
AVG HOUSEHOLD INCOME
29.5%
WAGE / INCOME GAP [ % ]
70.5¢/ $1
WAGE / INCOME GAP [ $ ]
0.35
INEQUALITY / GINI INDEX
2,546
TOTAL POPULATION
1,157
MALE POPULATION
1,389
FEMALE POPULATION
83.30
MALES / 100 FEMALES
120.05
FEMALES / 100 MALES
34.3
MEDIAN AGE
3.5
AVG FAMILY SIZE
3.0
AVG HOUSEHOLD SIZE
1,250
LABOR FORCE [ PEOPLE ]
63.3%
PERCENT IN LABOR FORCE
6.0%
UNEMPLOYMENT RATE
Lathrop Zip Codes
Lathrop Area Codes
Income in Lathrop
Income Overview in Lathrop
Per Capita Income in Lathrop is $25,427, while median incomes of families and households are $88,150 and $72,804 respectively.
| Characteristic | Number | Measure |
| Per Capita Income | 2,546 | $25,427 |
| Median Family Income | 581 | $88,150 |
| Mean Family Income | 581 | $87,664 |
| Median Household Income | 837 | $72,804 |
| Mean Household Income | 837 | $76,959 |
| Income Deficit | 581 | $0 |
| Wage / Income Gap (%) | 2,546 | 29.46% |
| Wage / Income Gap ($) | 2,546 | 70.54¢ per $1 |
| Gini / Inequality Index | 2,546 | 0.35 |
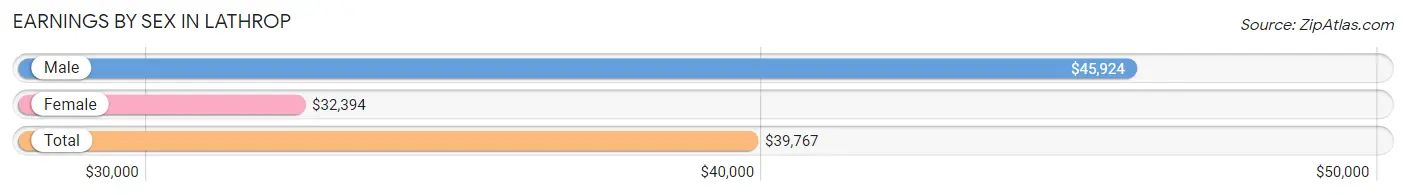
Earnings by Sex in Lathrop
Average Earnings in Lathrop are $39,767, $45,924 for men and $32,394 for women, a difference of 29.5%.
| Sex | Number | Average Earnings |
| Male | 588 (46.2%) | $45,924 |
| Female | 684 (53.8%) | $32,394 |
| Total | 1,272 (100.0%) | $39,767 |
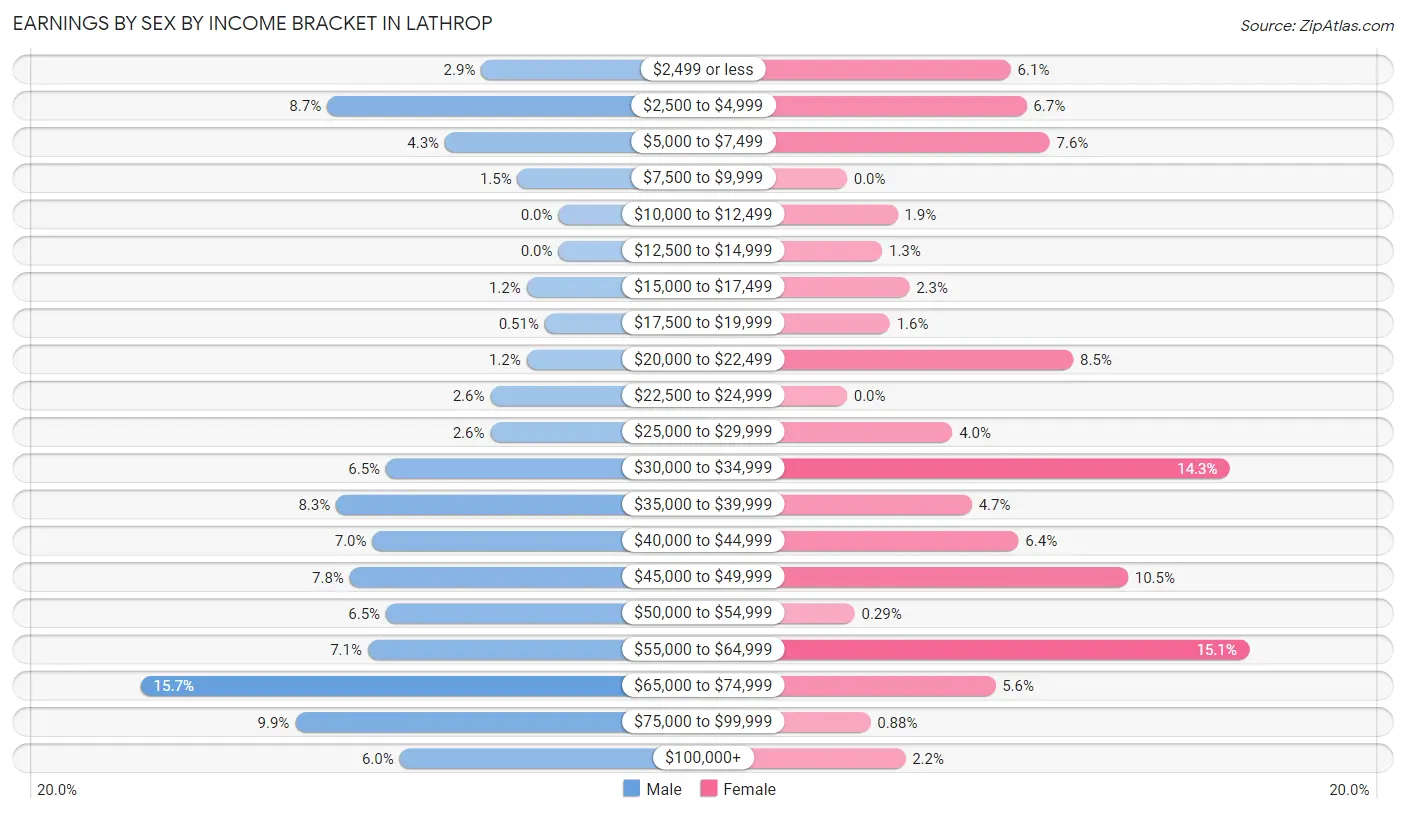
Earnings by Sex by Income Bracket in Lathrop
The most common earnings brackets in Lathrop are $65,000 to $74,999 for men (92 | 15.7%) and $55,000 to $64,999 for women (103 | 15.1%).
| Income | Male | Female |
| $2,499 or less | 17 (2.9%) | 42 (6.1%) |
| $2,500 to $4,999 | 51 (8.7%) | 46 (6.7%) |
| $5,000 to $7,499 | 25 (4.3%) | 52 (7.6%) |
| $7,500 to $9,999 | 9 (1.5%) | 0 (0.0%) |
| $10,000 to $12,499 | 0 (0.0%) | 13 (1.9%) |
| $12,500 to $14,999 | 0 (0.0%) | 9 (1.3%) |
| $15,000 to $17,499 | 7 (1.2%) | 16 (2.3%) |
| $17,500 to $19,999 | 3 (0.5%) | 11 (1.6%) |
| $20,000 to $22,499 | 7 (1.2%) | 58 (8.5%) |
| $22,500 to $24,999 | 15 (2.5%) | 0 (0.0%) |
| $25,000 to $29,999 | 15 (2.5%) | 27 (4.0%) |
| $30,000 to $34,999 | 38 (6.5%) | 98 (14.3%) |
| $35,000 to $39,999 | 49 (8.3%) | 32 (4.7%) |
| $40,000 to $44,999 | 41 (7.0%) | 44 (6.4%) |
| $45,000 to $49,999 | 46 (7.8%) | 72 (10.5%) |
| $50,000 to $54,999 | 38 (6.5%) | 2 (0.3%) |
| $55,000 to $64,999 | 42 (7.1%) | 103 (15.1%) |
| $65,000 to $74,999 | 92 (15.7%) | 38 (5.6%) |
| $75,000 to $99,999 | 58 (9.9%) | 6 (0.9%) |
| $100,000+ | 35 (5.9%) | 15 (2.2%) |
| Total | 588 (100.0%) | 684 (100.0%) |
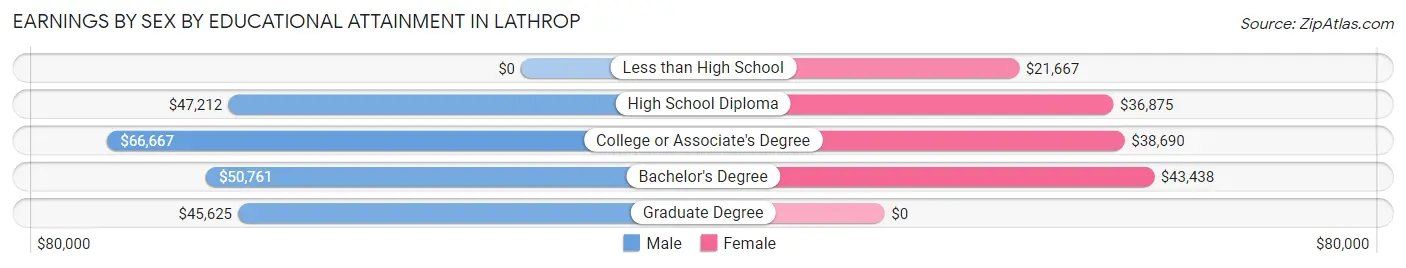
Earnings by Sex by Educational Attainment in Lathrop
Average earnings in Lathrop are $51,620 for men and $39,167 for women, a difference of 24.1%. Men with an educational attainment of college or associate's degree enjoy the highest average annual earnings of $66,667, while those with graduate degree education earn the least with $45,625. Women with an educational attainment of bachelor's degree earn the most with the average annual earnings of $43,438, while those with less than high school education have the smallest earnings of $21,667.
| Educational Attainment | Male Income | Female Income |
| Less than High School | - | - |
| High School Diploma | $47,212 | $36,875 |
| College or Associate's Degree | $66,667 | $38,690 |
| Bachelor's Degree | $50,761 | $43,438 |
| Graduate Degree | $45,625 | $0 |
| Total | $51,620 | $39,167 |
Family Income in Lathrop
Family Income Brackets in Lathrop
According to the Lathrop family income data, there are 170 families falling into the $100,000 to $149,999 income range, which is the most common income bracket and makes up 29.3% of all families.
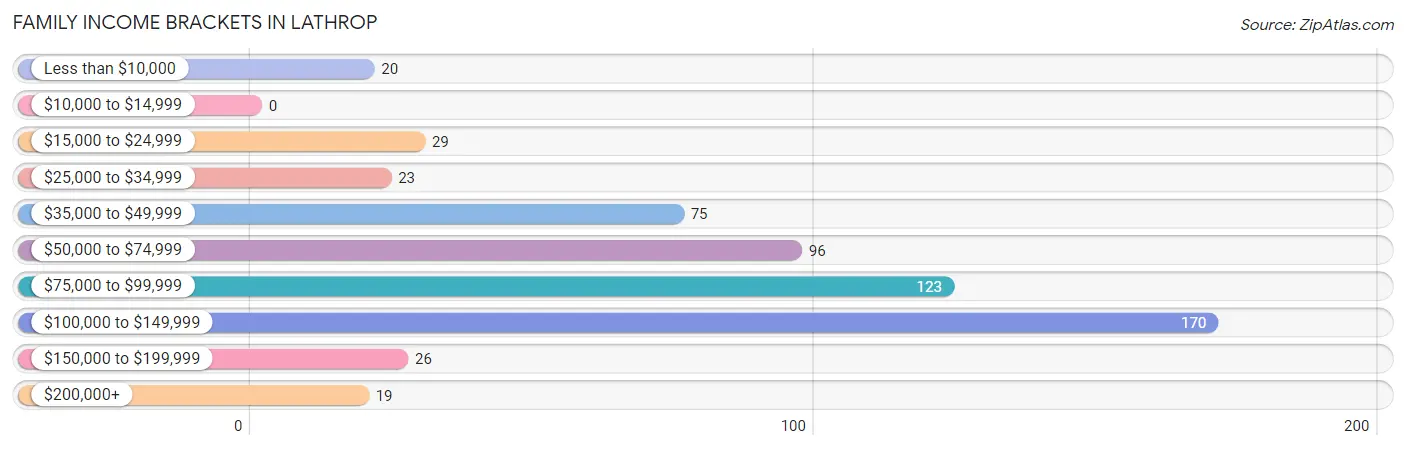
| Income Bracket | # Families | % Families |
| Less than $10,000 | 20 | 3.4% |
| $10,000 to $14,999 | 0 | 0.0% |
| $15,000 to $24,999 | 29 | 5.0% |
| $25,000 to $34,999 | 23 | 4.0% |
| $35,000 to $49,999 | 75 | 12.9% |
| $50,000 to $74,999 | 96 | 16.5% |
| $75,000 to $99,999 | 123 | 21.2% |
| $100,000 to $149,999 | 170 | 29.3% |
| $150,000 to $199,999 | 26 | 4.5% |
| $200,000+ | 19 | 3.3% |
Family Income by Famaliy Size in Lathrop
6-person families (54 | 9.3%) account for the highest median family income in Lathrop with $141,026 per family, while 2-person families (228 | 39.2%) have the highest median income of $32,096 per family member.
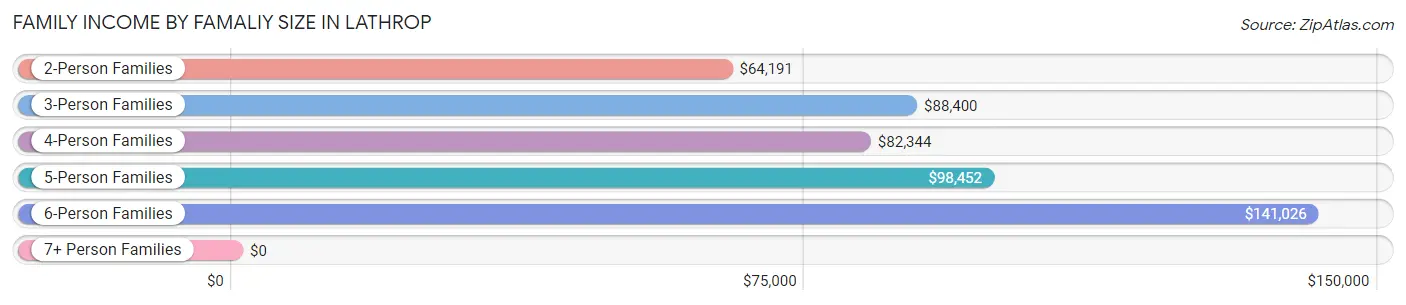
| Income Bracket | # Families | Median Income |
| 2-Person Families | 228 (39.2%) | $64,191 |
| 3-Person Families | 138 (23.7%) | $88,400 |
| 4-Person Families | 93 (16.0%) | $82,344 |
| 5-Person Families | 68 (11.7%) | $98,452 |
| 6-Person Families | 54 (9.3%) | $141,026 |
| 7+ Person Families | 0 (0.0%) | $0 |
| Total | 581 (100.0%) | $88,150 |
Family Income by Number of Earners in Lathrop
The median family income in Lathrop is $88,150, with families comprising 3+ earners (96) having the highest median family income of $140,064, while families with no earners (71) have the lowest median family income of $28,942, accounting for 16.5% and 12.2% of families, respectively.
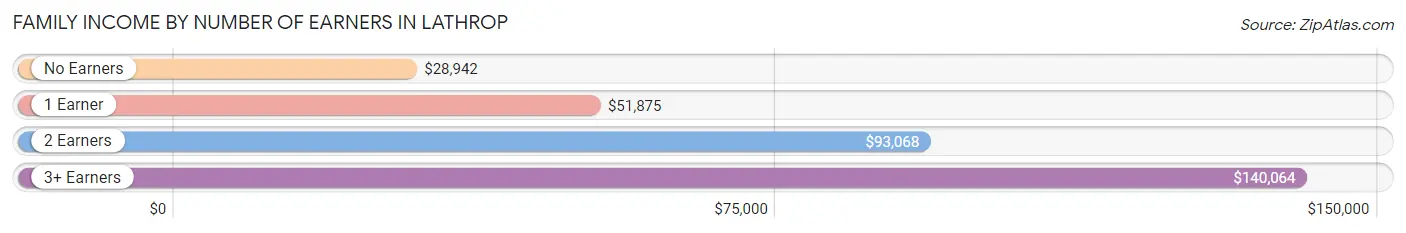
| Number of Earners | # Families | Median Income |
| No Earners | 71 (12.2%) | $28,942 |
| 1 Earner | 141 (24.3%) | $51,875 |
| 2 Earners | 273 (47.0%) | $93,068 |
| 3+ Earners | 96 (16.5%) | $140,064 |
| Total | 581 (100.0%) | $88,150 |
Household Income in Lathrop
Household Income Brackets in Lathrop
With 203 households falling in the category, the $100,000 to $149,999 income range is the most frequent in Lathrop, accounting for 24.2% of all households. In contrast, only 2 households (0.2%) fall into the $10,000 to $14,999 income bracket, making it the least populous group.
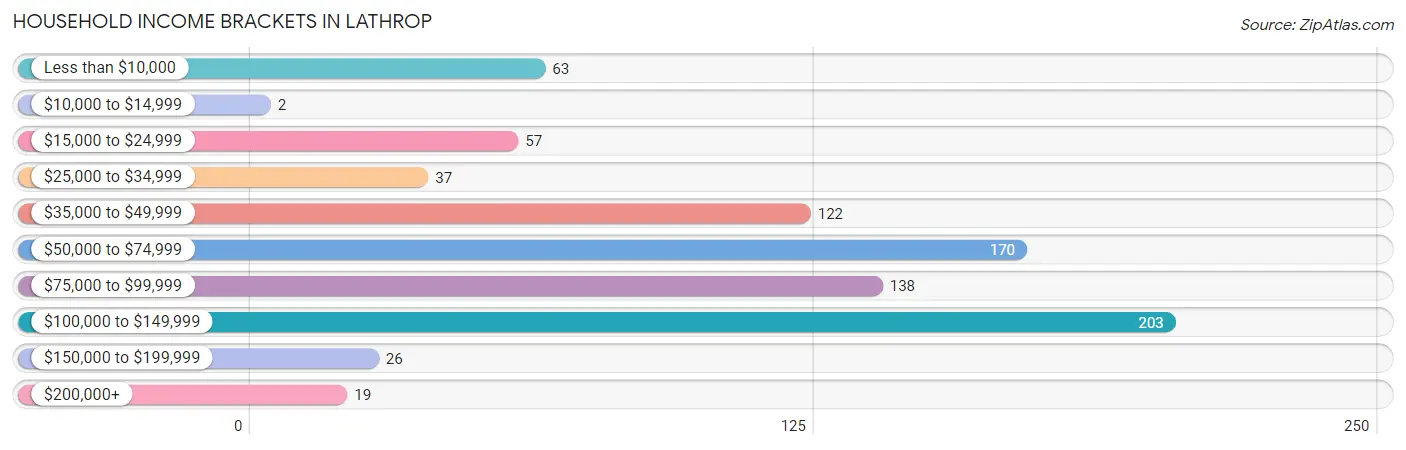
| Income Bracket | # Households | % Households |
| Less than $10,000 | 63 | 7.5% |
| $10,000 to $14,999 | 2 | 0.2% |
| $15,000 to $24,999 | 57 | 6.8% |
| $25,000 to $34,999 | 37 | 4.4% |
| $35,000 to $49,999 | 122 | 14.6% |
| $50,000 to $74,999 | 170 | 20.3% |
| $75,000 to $99,999 | 138 | 16.5% |
| $100,000 to $149,999 | 203 | 24.3% |
| $150,000 to $199,999 | 26 | 3.1% |
| $200,000+ | 19 | 2.3% |
Household Income by Householder Age in Lathrop
The median household income in Lathrop is $72,804, with the highest median household income of $98,452 found in the 25 to 44 years age bracket for the primary householder. A total of 290 households (34.6%) fall into this category. Meanwhile, the 65+ years age bracket for the primary householder has the lowest median household income of $37,000, with 216 households (25.8%) in this group.
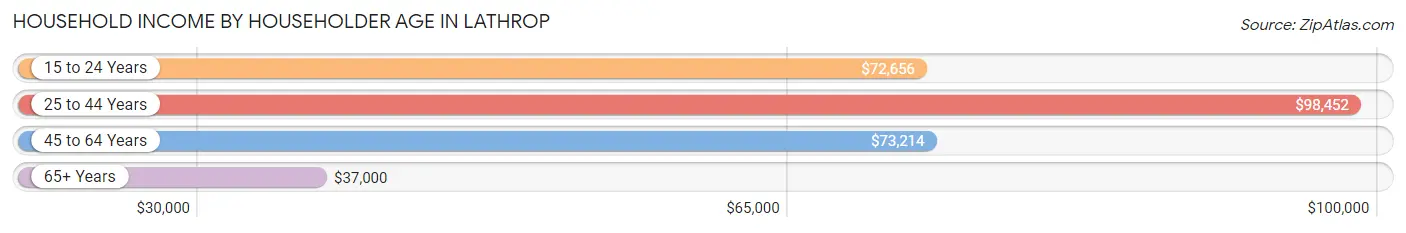
| Income Bracket | # Households | Median Income |
| 15 to 24 Years | 15 (1.8%) | $72,656 |
| 25 to 44 Years | 290 (34.6%) | $98,452 |
| 45 to 64 Years | 316 (37.8%) | $73,214 |
| 65+ Years | 216 (25.8%) | $37,000 |
| Total | 837 (100.0%) | $72,804 |
Poverty in Lathrop
Income Below Poverty by Sex and Age in Lathrop
With 15.7% poverty level for males and 19.2% for females among the residents of Lathrop, 15 year old males and 16 and 17 year old females are the most vulnerable to poverty, with 11 males (100.0%) and 39 females (54.9%) in their respective age groups living below the poverty level.
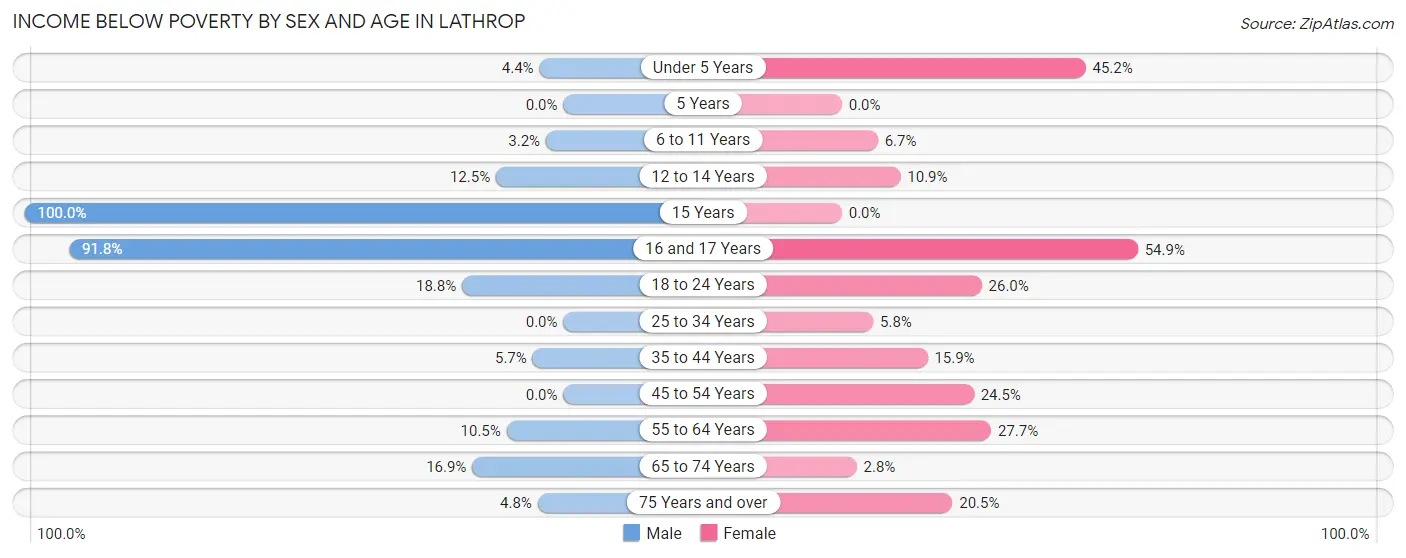
| Age Bracket | Male | Female |
| Under 5 Years | 2 (4.4%) | 19 (45.2%) |
| 5 Years | 0 (0.0%) | 0 (0.0%) |
| 6 to 11 Years | 4 (3.2%) | 8 (6.7%) |
| 12 to 14 Years | 14 (12.5%) | 5 (10.9%) |
| 15 Years | 11 (100.0%) | 0 (0.0%) |
| 16 and 17 Years | 89 (91.7%) | 39 (54.9%) |
| 18 to 24 Years | 25 (18.8%) | 41 (26.0%) |
| 25 to 34 Years | 0 (0.0%) | 9 (5.8%) |
| 35 to 44 Years | 9 (5.7%) | 31 (15.9%) |
| 45 to 54 Years | 0 (0.0%) | 47 (24.5%) |
| 55 to 64 Years | 14 (10.5%) | 41 (27.7%) |
| 65 to 74 Years | 11 (16.9%) | 3 (2.8%) |
| 75 Years and over | 2 (4.8%) | 24 (20.5%) |
| Total | 181 (15.7%) | 267 (19.2%) |
Income Above Poverty by Sex and Age in Lathrop
According to the poverty statistics in Lathrop, males aged 5 years and females aged 5 years are the age groups that are most secure financially, with 100.0% of males and 100.0% of females in these age groups living above the poverty line.
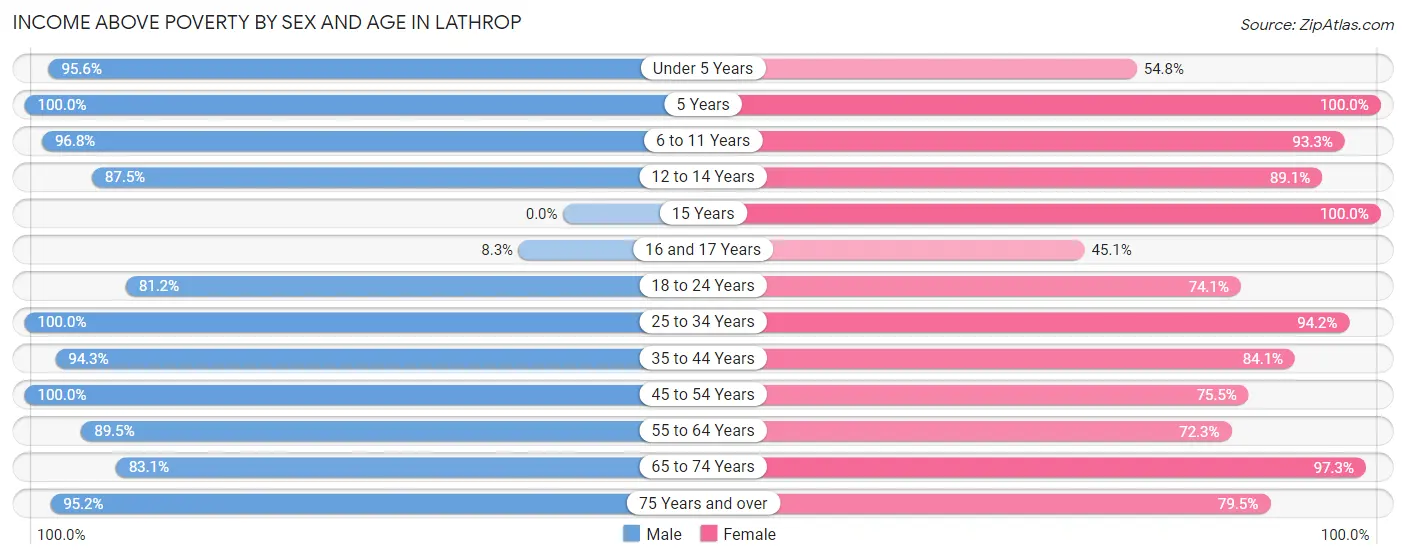
| Age Bracket | Male | Female |
| Under 5 Years | 43 (95.6%) | 23 (54.8%) |
| 5 Years | 31 (100.0%) | 6 (100.0%) |
| 6 to 11 Years | 120 (96.8%) | 112 (93.3%) |
| 12 to 14 Years | 98 (87.5%) | 41 (89.1%) |
| 15 Years | 0 (0.0%) | 30 (100.0%) |
| 16 and 17 Years | 8 (8.3%) | 32 (45.1%) |
| 18 to 24 Years | 108 (81.2%) | 117 (74.1%) |
| 25 to 34 Years | 114 (100.0%) | 146 (94.2%) |
| 35 to 44 Years | 149 (94.3%) | 164 (84.1%) |
| 45 to 54 Years | 87 (100.0%) | 145 (75.5%) |
| 55 to 64 Years | 119 (89.5%) | 107 (72.3%) |
| 65 to 74 Years | 54 (83.1%) | 106 (97.3%) |
| 75 Years and over | 40 (95.2%) | 93 (79.5%) |
| Total | 971 (84.3%) | 1,122 (80.8%) |
Income Below Poverty Among Married-Couple Families in Lathrop
The poverty statistics for married-couple families in Lathrop show that 2.1% or 9 of the total 428 families live below the poverty line. Families with 1 or 2 children have the highest poverty rate of 4.3%, comprising of 9 families. On the other hand, families with no children have the lowest poverty rate of 0.0%, which includes 0 families.
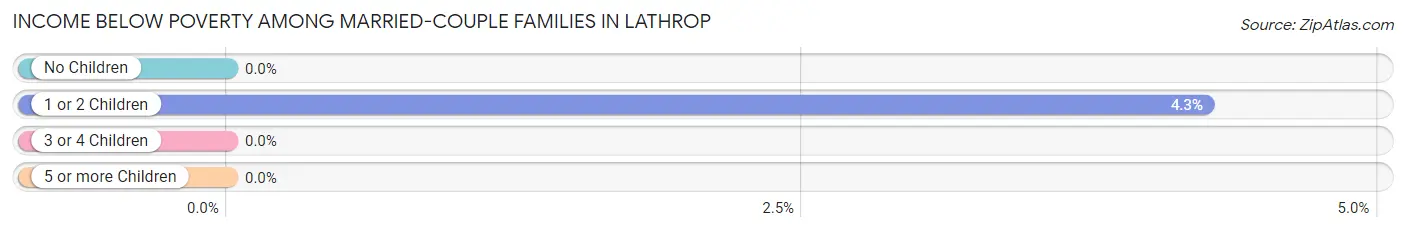
| Children | Above Poverty | Below Poverty |
| No Children | 202 (100.0%) | 0 (0.0%) |
| 1 or 2 Children | 203 (95.8%) | 9 (4.3%) |
| 3 or 4 Children | 14 (100.0%) | 0 (0.0%) |
| 5 or more Children | 0 (0.0%) | 0 (0.0%) |
| Total | 419 (97.9%) | 9 (2.1%) |
Income Below Poverty Among Single-Parent Households in Lathrop
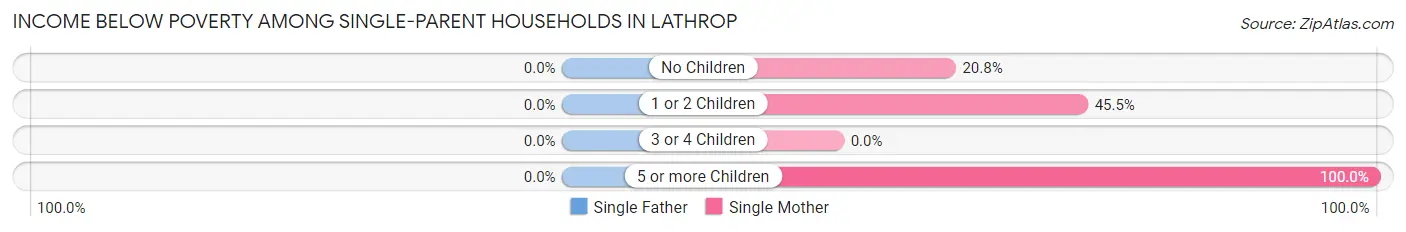
| Children | Single Father | Single Mother |
| No Children | 0 (0.0%) | 15 (20.8%) |
| 1 or 2 Children | 0 (0.0%) | 20 (45.5%) |
| 3 or 4 Children | 0 (0.0%) | 0 (0.0%) |
| 5 or more Children | 0 (0.0%) | 5 (100.0%) |
| Total | 0 (0.0%) | 40 (30.8%) |
Income Below Poverty Among Married-Couple vs Single-Parent Households in Lathrop
The poverty data for Lathrop shows that 9 of the married-couple family households (2.1%) and 40 of the single-parent households (26.1%) are living below the poverty level. Within the married-couple family households, those with 1 or 2 children have the highest poverty rate, with 9 households (4.3%) falling below the poverty line. Among the single-parent households, those with 5 or more children have the highest poverty rate, with 5 household (100.0%) living below poverty.
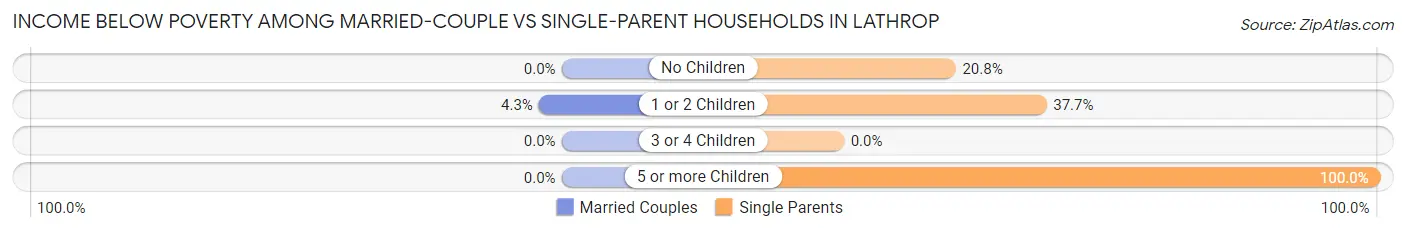
| Children | Married-Couple Families | Single-Parent Households |
| No Children | 0 (0.0%) | 15 (20.8%) |
| 1 or 2 Children | 9 (4.3%) | 20 (37.7%) |
| 3 or 4 Children | 0 (0.0%) | 0 (0.0%) |
| 5 or more Children | 0 (0.0%) | 5 (100.0%) |
| Total | 9 (2.1%) | 40 (26.1%) |
Race in Lathrop
The most populous races in Lathrop are White / Caucasian (2,374 | 93.2%), Hispanic or Latino (269 | 10.6%), and Two or more Races (87 | 3.4%).
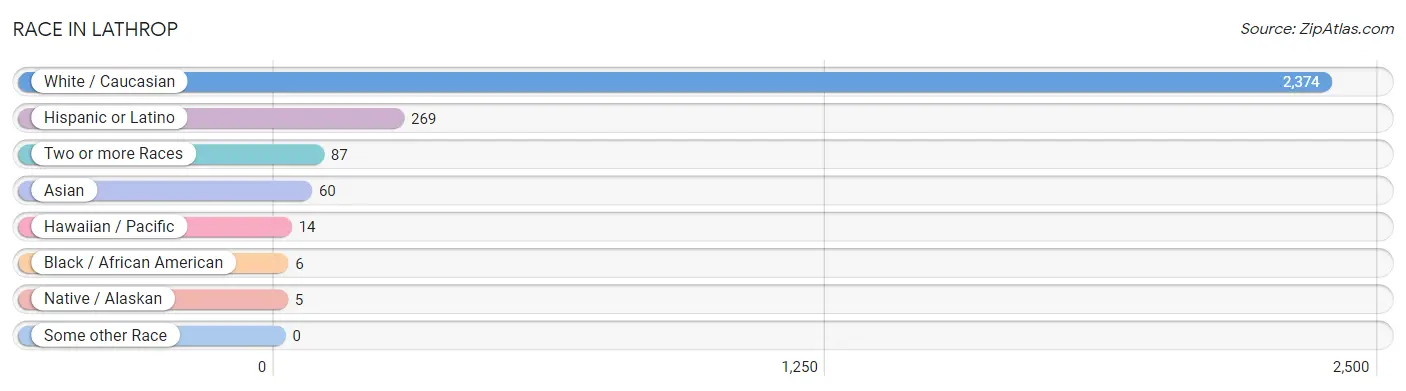
| Race | # Population | % Population |
| Asian | 60 | 2.4% |
| Black / African American | 6 | 0.2% |
| Hawaiian / Pacific | 14 | 0.5% |
| Hispanic or Latino | 269 | 10.6% |
| Native / Alaskan | 5 | 0.2% |
| White / Caucasian | 2,374 | 93.2% |
| Two or more Races | 87 | 3.4% |
| Some other Race | 0 | 0.0% |
| Total | 2,546 | 100.0% |
Ancestry in Lathrop
The most populous ancestries reported in Lathrop are German (366 | 14.4%), Irish (320 | 12.6%), English (286 | 11.2%), Mexican (269 | 10.6%), and American (187 | 7.3%), together accounting for 56.1% of all Lathrop residents.
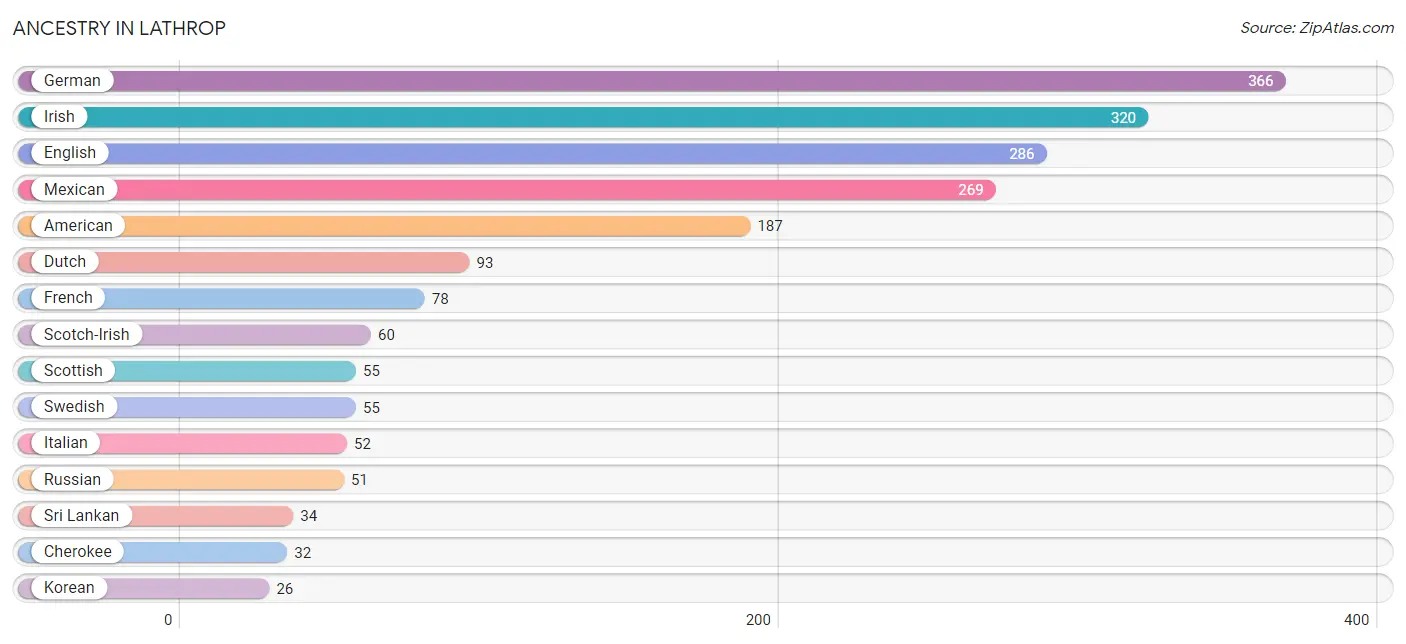
| Ancestry | # Population | % Population |
| American | 187 | 7.3% |
| Armenian | 12 | 0.5% |
| British | 17 | 0.7% |
| Canadian | 8 | 0.3% |
| Cherokee | 32 | 1.3% |
| Choctaw | 6 | 0.2% |
| Creek | 4 | 0.2% |
| Danish | 8 | 0.3% |
| Dutch | 93 | 3.6% |
| English | 286 | 11.2% |
| European | 10 | 0.4% |
| French | 78 | 3.1% |
| German | 366 | 14.4% |
| Irish | 320 | 12.6% |
| Italian | 52 | 2.0% |
| Korean | 26 | 1.0% |
| Mexican | 269 | 10.6% |
| Norwegian | 10 | 0.4% |
| Russian | 51 | 2.0% |
| Scandinavian | 8 | 0.3% |
| Scotch-Irish | 60 | 2.4% |
| Scottish | 55 | 2.2% |
| Sri Lankan | 34 | 1.3% |
| Swedish | 55 | 2.2% |
| Ukrainian | 9 | 0.4% |
| Welsh | 13 | 0.5% | View All 26 Rows |
Immigrants in Lathrop
The most numerous immigrant groups reported in Lathrop came from Asia (53 | 2.1%), South Eastern Asia (48 | 1.9%), Philippines (26 | 1.0%), Vietnam (22 | 0.9%), and Eastern Europe (14 | 0.5%), together accounting for 6.4% of all Lathrop residents.
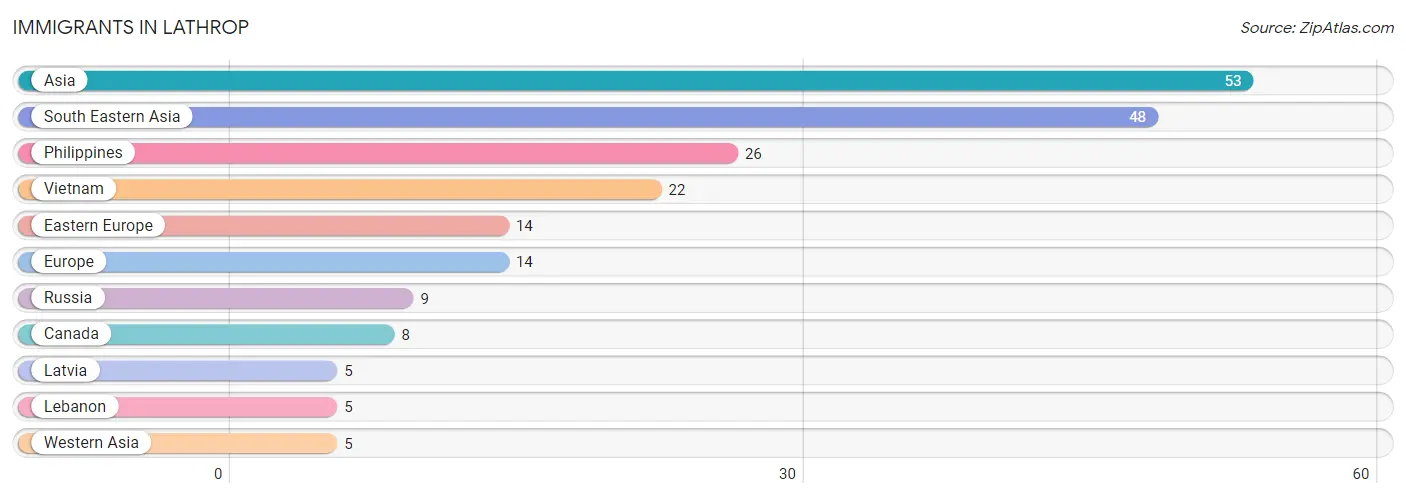
| Immigration Origin | # Population | % Population |
| Asia | 53 | 2.1% |
| Canada | 8 | 0.3% |
| Eastern Europe | 14 | 0.5% |
| Europe | 14 | 0.5% |
| Latvia | 5 | 0.2% |
| Lebanon | 5 | 0.2% |
| Philippines | 26 | 1.0% |
| Russia | 9 | 0.4% |
| South Eastern Asia | 48 | 1.9% |
| Vietnam | 22 | 0.9% |
| Western Asia | 5 | 0.2% | View All 11 Rows |
Sex and Age in Lathrop
Sex and Age in Lathrop
The most populous age groups in Lathrop are 15 to 19 Years (166 | 14.3%) for men and 15 to 19 Years (208 | 15.0%) for women.
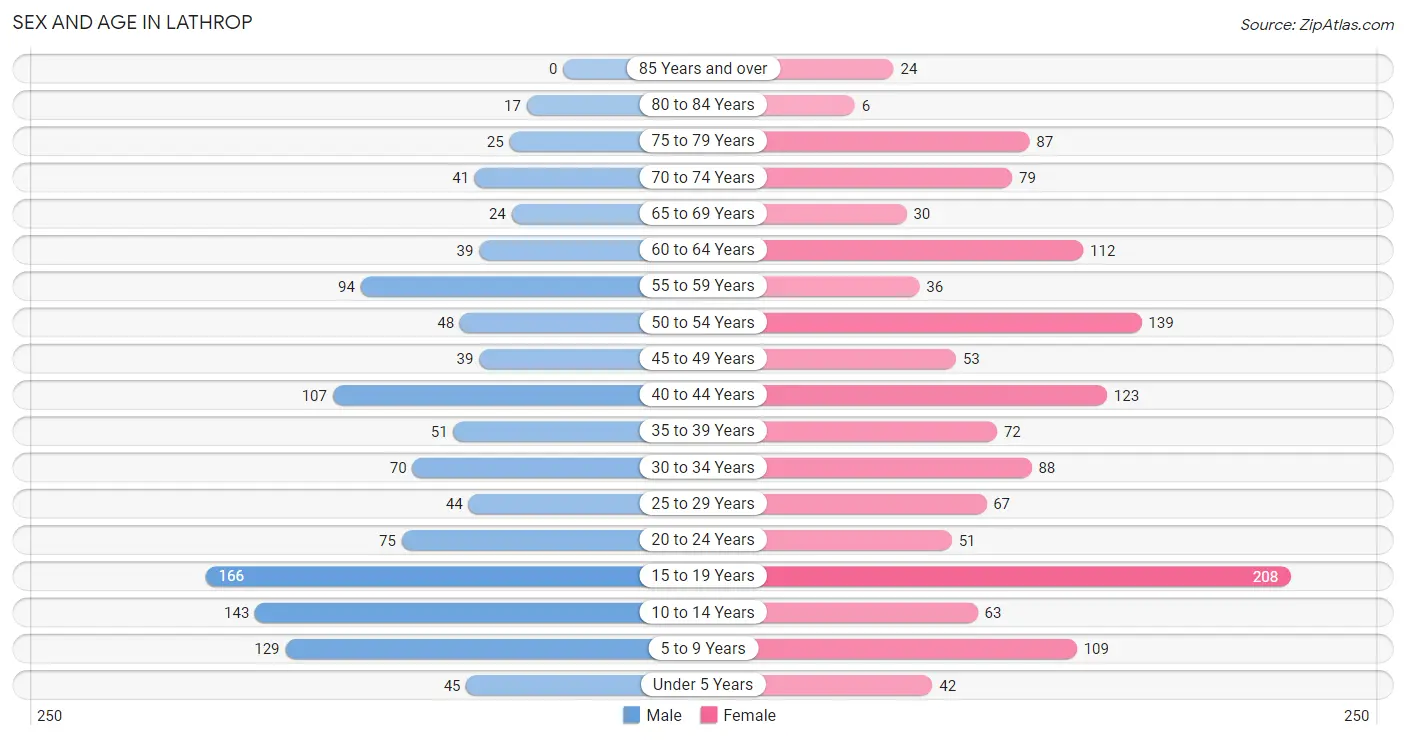
| Age Bracket | Male | Female |
| Under 5 Years | 45 (3.9%) | 42 (3.0%) |
| 5 to 9 Years | 129 (11.2%) | 109 (7.9%) |
| 10 to 14 Years | 143 (12.4%) | 63 (4.5%) |
| 15 to 19 Years | 166 (14.3%) | 208 (15.0%) |
| 20 to 24 Years | 75 (6.5%) | 51 (3.7%) |
| 25 to 29 Years | 44 (3.8%) | 67 (4.8%) |
| 30 to 34 Years | 70 (6.0%) | 88 (6.3%) |
| 35 to 39 Years | 51 (4.4%) | 72 (5.2%) |
| 40 to 44 Years | 107 (9.2%) | 123 (8.9%) |
| 45 to 49 Years | 39 (3.4%) | 53 (3.8%) |
| 50 to 54 Years | 48 (4.2%) | 139 (10.0%) |
| 55 to 59 Years | 94 (8.1%) | 36 (2.6%) |
| 60 to 64 Years | 39 (3.4%) | 112 (8.1%) |
| 65 to 69 Years | 24 (2.1%) | 30 (2.2%) |
| 70 to 74 Years | 41 (3.5%) | 79 (5.7%) |
| 75 to 79 Years | 25 (2.2%) | 87 (6.3%) |
| 80 to 84 Years | 17 (1.5%) | 6 (0.4%) |
| 85 Years and over | 0 (0.0%) | 24 (1.7%) |
| Total | 1,157 (100.0%) | 1,389 (100.0%) |
Families and Households in Lathrop
Median Family Size in Lathrop
The median family size in Lathrop is 3.47 persons per family, with married-couple families (428 | 73.7%) accounting for the largest median family size of 3.52 persons per family. On the other hand, single female/mother families (130 | 22.4%) represent the smallest median family size with 3.30 persons per family.
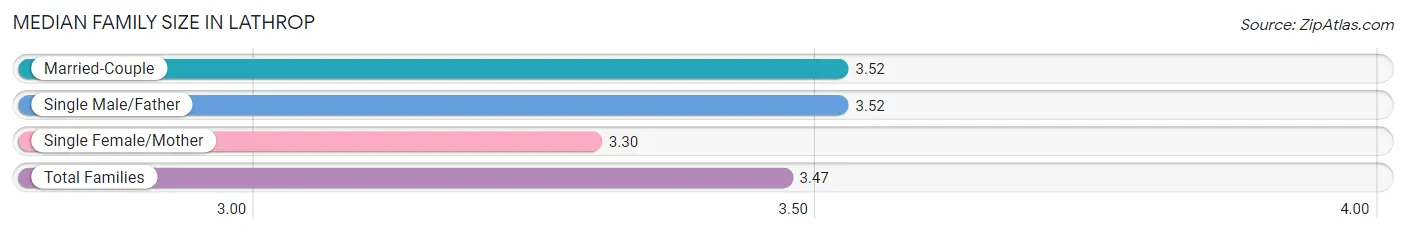
| Family Type | # Families | Family Size |
| Married-Couple | 428 (73.7%) | 3.52 |
| Single Male/Father | 23 (4.0%) | 3.52 |
| Single Female/Mother | 130 (22.4%) | 3.30 |
| Total Families | 581 (100.0%) | 3.47 |
Median Household Size in Lathrop
The median household size in Lathrop is 3.04 persons per household, with single male/father households (23 | 2.8%) accounting for the largest median household size of 4.83 persons per household. non-family households (256 | 30.6%) represent the smallest median household size with 1.81 persons per household.
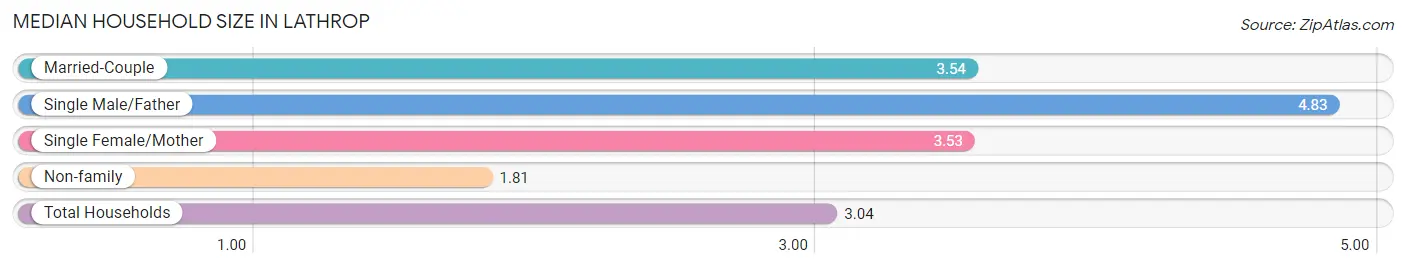
| Household Type | # Households | Household Size |
| Married-Couple | 428 (51.1%) | 3.54 |
| Single Male/Father | 23 (2.8%) | 4.83 |
| Single Female/Mother | 130 (15.5%) | 3.53 |
| Non-family | 256 (30.6%) | 1.81 |
| Total Households | 837 (100.0%) | 3.04 |
Household Size by Marriage Status in Lathrop
Out of a total of 837 households in Lathrop, 581 (69.4%) are family households, while 256 (30.6%) are nonfamily households. The most numerous type of family households are 2-person households, comprising 219, and the most common type of nonfamily households are 1-person households, comprising 186.
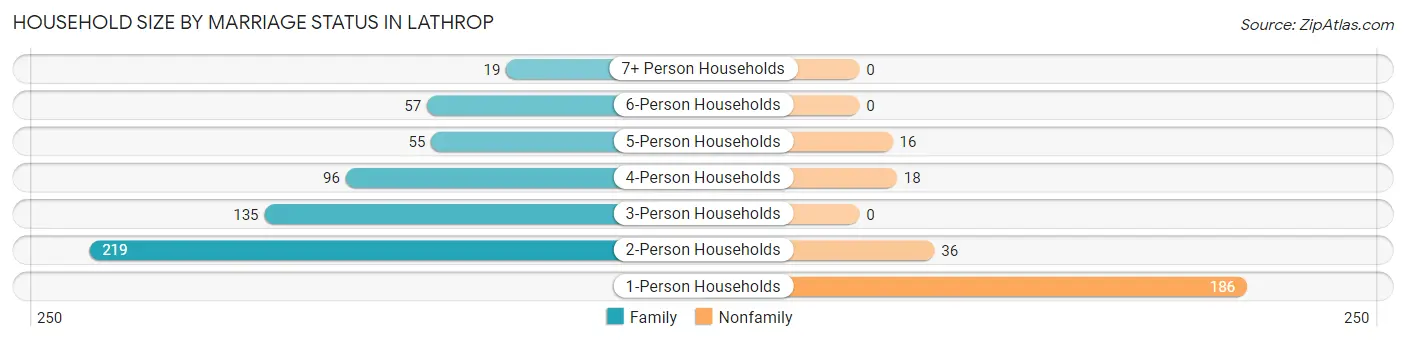
| Household Size | Family Households | Nonfamily Households |
| 1-Person Households | - | 186 (22.2%) |
| 2-Person Households | 219 (26.2%) | 36 (4.3%) |
| 3-Person Households | 135 (16.1%) | 0 (0.0%) |
| 4-Person Households | 96 (11.5%) | 18 (2.1%) |
| 5-Person Households | 55 (6.6%) | 16 (1.9%) |
| 6-Person Households | 57 (6.8%) | 0 (0.0%) |
| 7+ Person Households | 19 (2.3%) | 0 (0.0%) |
| Total | 581 (69.4%) | 256 (30.6%) |
Female Fertility in Lathrop
Fertility by Age in Lathrop
Average fertility rate in Lathrop is 117.0 births per 1,000 women. Women in the age bracket of 35 to 50 years have the highest fertility rate with 223.0 births per 1,000 women. Women in the age bracket of 35 to 50 years acount for 74.7% of all women with births.
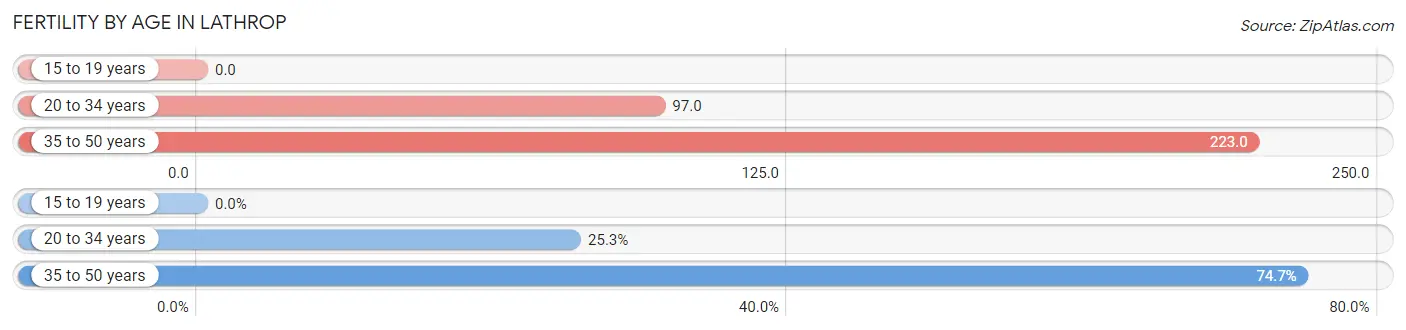
| Age Bracket | Women with Births | Births / 1,000 Women |
| 15 to 19 years | 0 (0.0%) | 0.0 |
| 20 to 34 years | 20 (25.3%) | 97.0 |
| 35 to 50 years | 59 (74.7%) | 223.0 |
| Total | 79 (100.0%) | 117.0 |
Fertility by Age by Marriage Status in Lathrop
82.3% of women with births (79) in Lathrop are married. The highest percentage of unmarried women with births falls into 20 to 34 years age bracket with 45.0% of them unmarried at the time of birth, while the lowest percentage of unmarried women with births belong to 35 to 50 years age bracket with 8.5% of them unmarried.
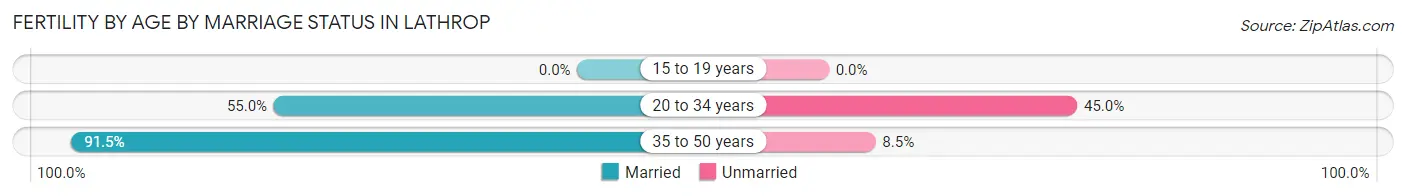
| Age Bracket | Married | Unmarried |
| 15 to 19 years | 0 (0.0%) | 0 (0.0%) |
| 20 to 34 years | 11 (55.0%) | 9 (45.0%) |
| 35 to 50 years | 54 (91.5%) | 5 (8.5%) |
| Total | 65 (82.3%) | 14 (17.7%) |
Fertility by Education in Lathrop
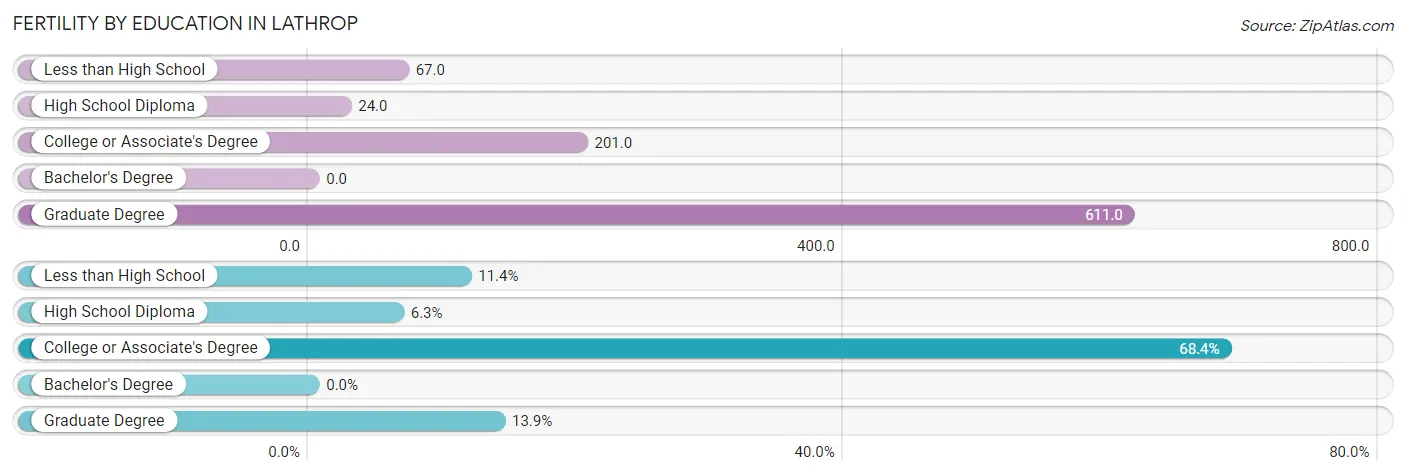
| Educational Attainment | Women with Births | Births / 1,000 Women |
| Less than High School | 9 (11.4%) | 67.0 |
| High School Diploma | 5 (6.3%) | 24.0 |
| College or Associate's Degree | 54 (68.3%) | 201.0 |
| Bachelor's Degree | 0 (0.0%) | 0.0 |
| Graduate Degree | 11 (13.9%) | 611.0 |
| Total | 79 (100.0%) | 117.0 |
Fertility by Education by Marriage Status in Lathrop
17.7% of women with births in Lathrop are unmarried. Women with the educational attainment of college or associate's degree are most likely to be married with 100.0% of them married at childbirth, while women with the educational attainment of less than high school are least likely to be married with 100.0% of them unmarried at childbirth.
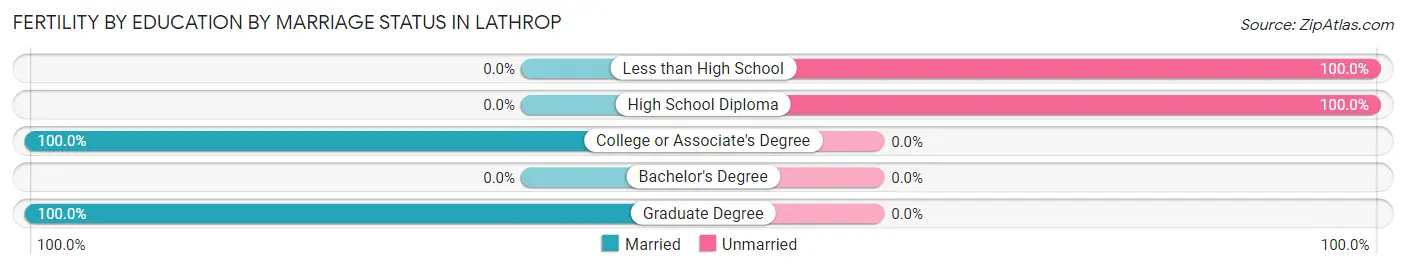
| Educational Attainment | Married | Unmarried |
| Less than High School | 0 (0.0%) | 9 (100.0%) |
| High School Diploma | 0 (0.0%) | 5 (100.0%) |
| College or Associate's Degree | 54 (100.0%) | 0 (0.0%) |
| Bachelor's Degree | 0 (0.0%) | 0 (0.0%) |
| Graduate Degree | 11 (100.0%) | 0 (0.0%) |
| Total | 65 (82.3%) | 14 (17.7%) |
Employment Characteristics in Lathrop
Employment by Class of Employer in Lathrop
Among the 1,174 employed individuals in Lathrop, private company employees (832 | 70.9%), not-for-profit organizations (115 | 9.8%), and local government employees (78 | 6.6%) make up the most common classes of employment.
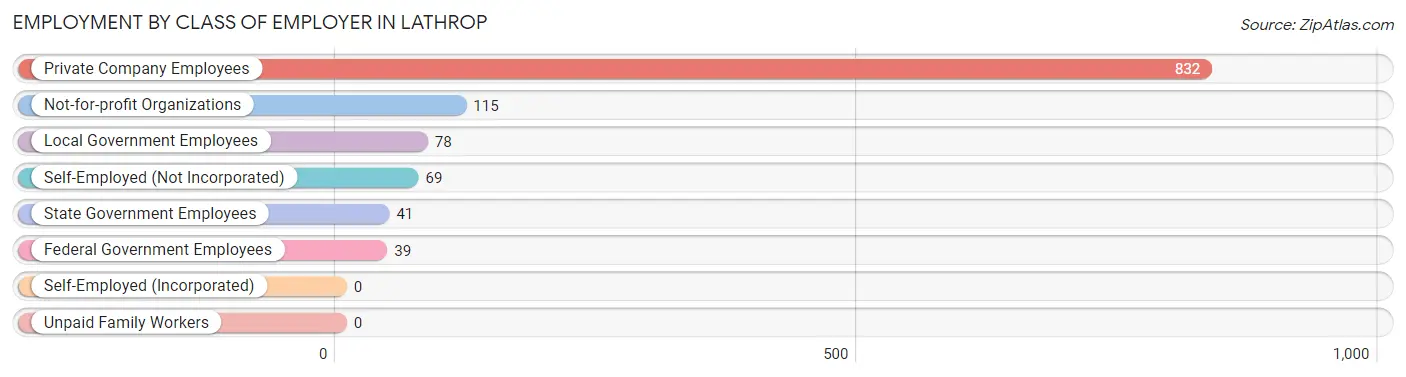
| Employer Class | # Employees | % Employees |
| Private Company Employees | 832 | 70.9% |
| Self-Employed (Incorporated) | 0 | 0.0% |
| Self-Employed (Not Incorporated) | 69 | 5.9% |
| Not-for-profit Organizations | 115 | 9.8% |
| Local Government Employees | 78 | 6.6% |
| State Government Employees | 41 | 3.5% |
| Federal Government Employees | 39 | 3.3% |
| Unpaid Family Workers | 0 | 0.0% |
| Total | 1,174 | 100.0% |
Employment Status by Age in Lathrop
According to the labor force statistics for Lathrop, out of the total population over 16 years of age (1,974), 63.3% or 1,250 individuals are in the labor force, with 6.0% or 75 of them unemployed. The age group with the highest labor force participation rate is 45 to 54 years, with 92.5% or 258 individuals in the labor force. Within the labor force, the 16 to 19 years age range has the highest percentage of unemployed individuals, with 41.1% or 51 of them being unemployed.
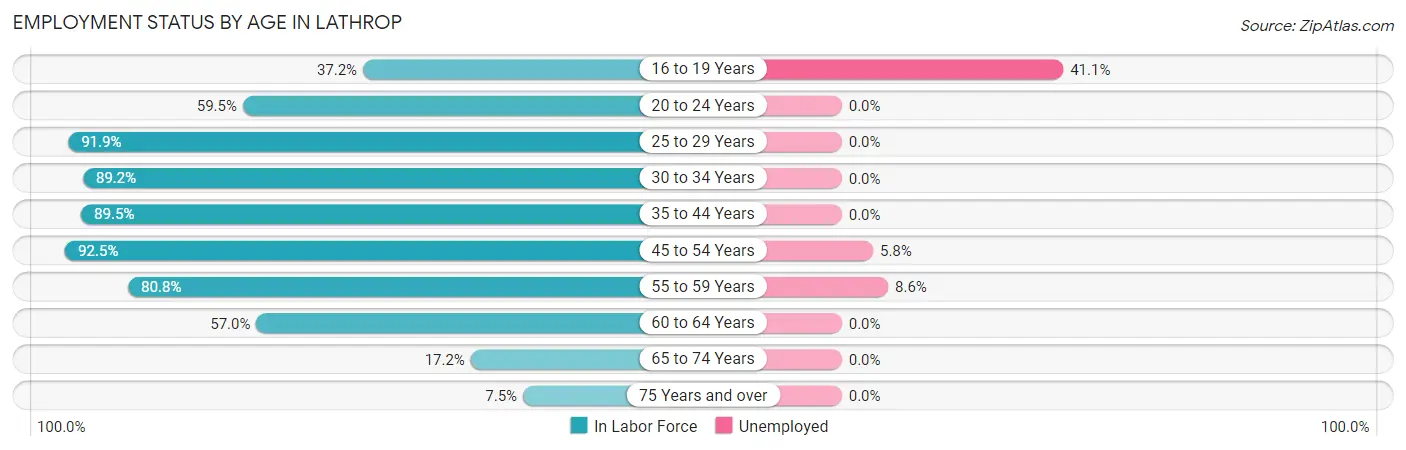
| Age Bracket | In Labor Force | Unemployed |
| 16 to 19 Years | 124 (37.2%) | 51 (41.1%) |
| 20 to 24 Years | 75 (59.5%) | 0 (0.0%) |
| 25 to 29 Years | 102 (91.9%) | 0 (0.0%) |
| 30 to 34 Years | 141 (89.2%) | 0 (0.0%) |
| 35 to 44 Years | 316 (89.5%) | 0 (0.0%) |
| 45 to 54 Years | 258 (92.5%) | 15 (5.8%) |
| 55 to 59 Years | 105 (80.8%) | 9 (8.6%) |
| 60 to 64 Years | 86 (57.0%) | 0 (0.0%) |
| 65 to 74 Years | 30 (17.2%) | 0 (0.0%) |
| 75 Years and over | 12 (7.5%) | 0 (0.0%) |
| Total | 1,250 (63.3%) | 75 (6.0%) |
Employment Status by Educational Attainment in Lathrop
According to labor force statistics for Lathrop, 85.3% of individuals (1,008) out of the total population between 25 and 64 years of age (1,182) are in the labor force, with 2.4% or 24 of them being unemployed. The group with the highest labor force participation rate are those with the educational attainment of college / associate degree, with 93.5% or 459 individuals in the labor force. Within the labor force, individuals with bachelor's degree or higher education have the highest percentage of unemployment, with 4.0% or 9 of them being unemployed.
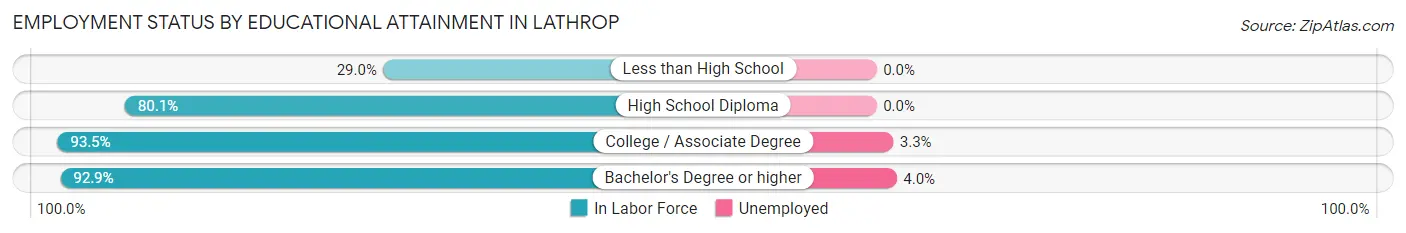
| Educational Attainment | In Labor Force | Unemployed |
| Less than High School | 20 (29.0%) | 0 (0.0%) |
| High School Diploma | 306 (80.1%) | 0 (0.0%) |
| College / Associate Degree | 459 (93.5%) | 16 (3.3%) |
| Bachelor's Degree or higher | 223 (92.9%) | 10 (4.0%) |
| Total | 1,008 (85.3%) | 28 (2.4%) |
Employment Occupations by Sex in Lathrop
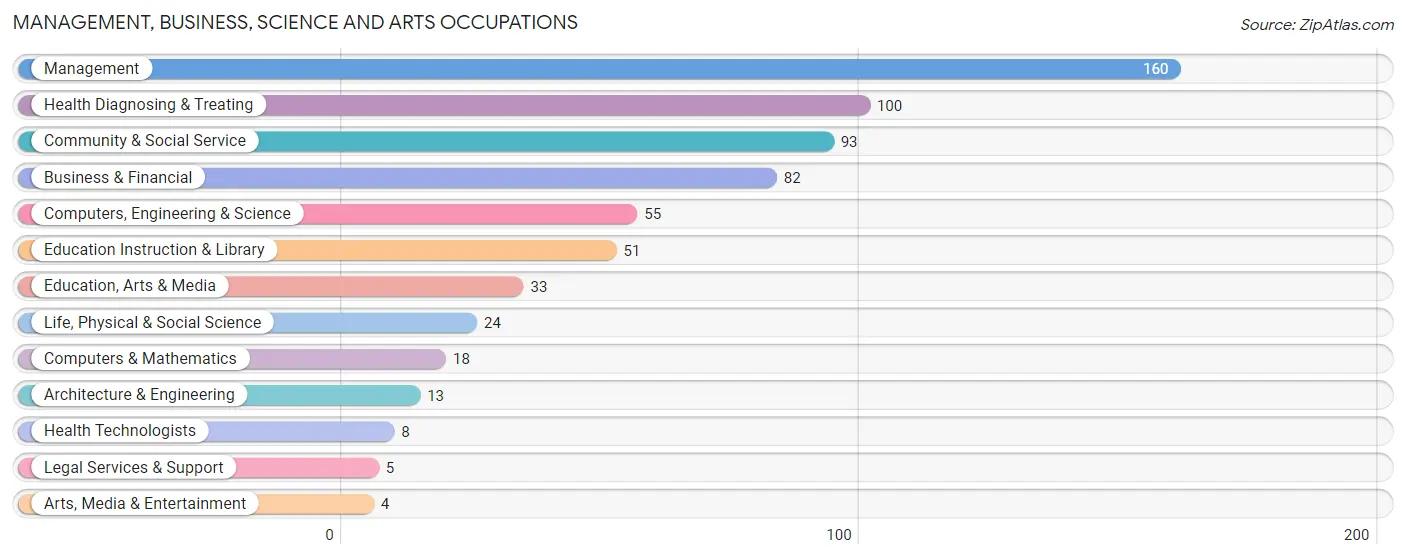
Management, Business, Science and Arts Occupations
The most common Management, Business, Science and Arts occupations in Lathrop are Management (160 | 13.6%), Health Diagnosing & Treating (100 | 8.5%), Community & Social Service (93 | 7.9%), Business & Financial (82 | 7.0%), and Computers, Engineering & Science (55 | 4.7%).
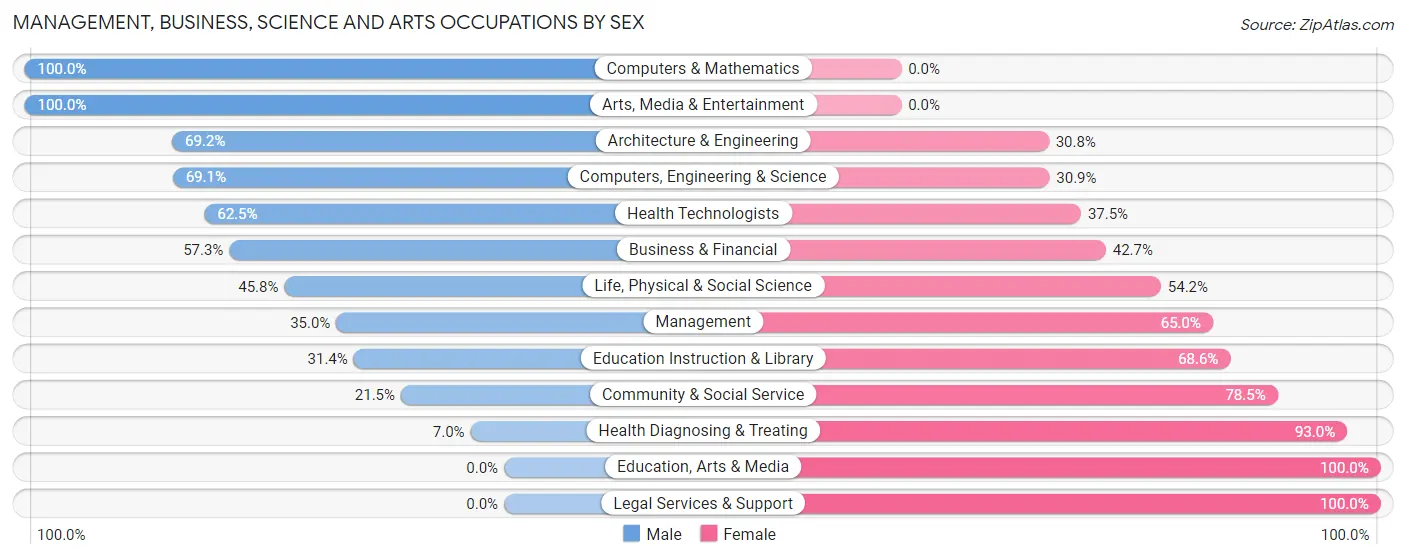
Management, Business, Science and Arts Occupations by Sex
Within the Management, Business, Science and Arts occupations in Lathrop, the most male-oriented occupations are Computers & Mathematics (100.0%), Arts, Media & Entertainment (100.0%), and Architecture & Engineering (69.2%), while the most female-oriented occupations are Education, Arts & Media (100.0%), Legal Services & Support (100.0%), and Health Diagnosing & Treating (93.0%).
| Occupation | Male | Female |
| Management | 56 (35.0%) | 104 (65.0%) |
| Business & Financial | 47 (57.3%) | 35 (42.7%) |
| Computers, Engineering & Science | 38 (69.1%) | 17 (30.9%) |
| Computers & Mathematics | 18 (100.0%) | 0 (0.0%) |
| Architecture & Engineering | 9 (69.2%) | 4 (30.8%) |
| Life, Physical & Social Science | 11 (45.8%) | 13 (54.2%) |
| Community & Social Service | 20 (21.5%) | 73 (78.5%) |
| Education, Arts & Media | 0 (0.0%) | 33 (100.0%) |
| Legal Services & Support | 0 (0.0%) | 5 (100.0%) |
| Education Instruction & Library | 16 (31.4%) | 35 (68.6%) |
| Arts, Media & Entertainment | 4 (100.0%) | 0 (0.0%) |
| Health Diagnosing & Treating | 7 (7.0%) | 93 (93.0%) |
| Health Technologists | 5 (62.5%) | 3 (37.5%) |
| Total (Category) | 168 (34.3%) | 322 (65.7%) |
| Total (Overall) | 515 (43.9%) | 659 (56.1%) |
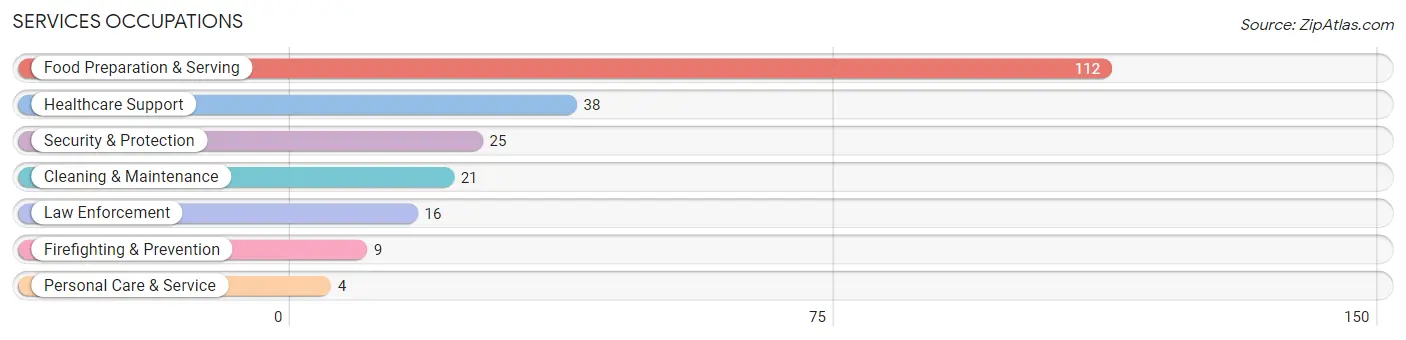
Services Occupations
The most common Services occupations in Lathrop are Food Preparation & Serving (112 | 9.5%), Healthcare Support (38 | 3.2%), Security & Protection (25 | 2.1%), Cleaning & Maintenance (21 | 1.8%), and Law Enforcement (16 | 1.4%).
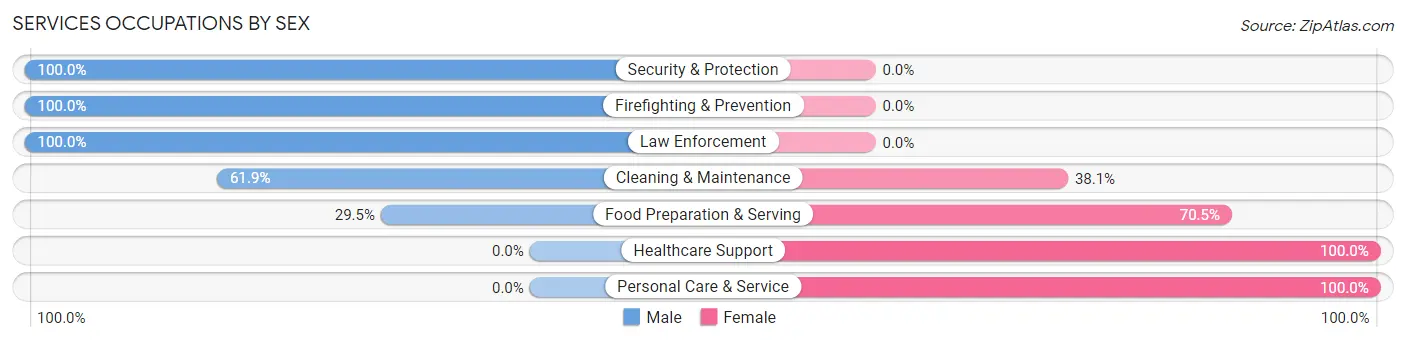
Services Occupations by Sex
Within the Services occupations in Lathrop, the most male-oriented occupations are Security & Protection (100.0%), Firefighting & Prevention (100.0%), and Law Enforcement (100.0%), while the most female-oriented occupations are Healthcare Support (100.0%), Personal Care & Service (100.0%), and Food Preparation & Serving (70.5%).
| Occupation | Male | Female |
| Healthcare Support | 0 (0.0%) | 38 (100.0%) |
| Security & Protection | 25 (100.0%) | 0 (0.0%) |
| Firefighting & Prevention | 9 (100.0%) | 0 (0.0%) |
| Law Enforcement | 16 (100.0%) | 0 (0.0%) |
| Food Preparation & Serving | 33 (29.5%) | 79 (70.5%) |
| Cleaning & Maintenance | 13 (61.9%) | 8 (38.1%) |
| Personal Care & Service | 0 (0.0%) | 4 (100.0%) |
| Total (Category) | 71 (35.5%) | 129 (64.5%) |
| Total (Overall) | 515 (43.9%) | 659 (56.1%) |
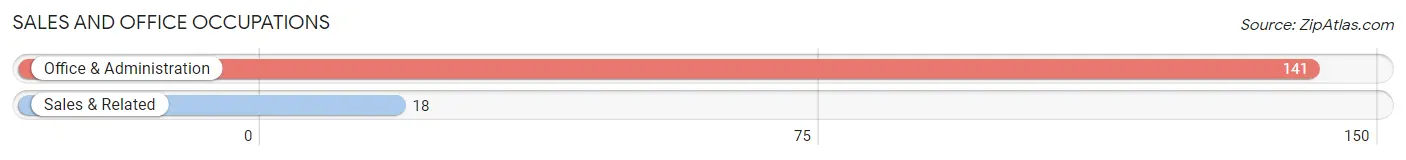
Sales and Office Occupations
The most common Sales and Office occupations in Lathrop are Office & Administration (141 | 12.0%), and Sales & Related (18 | 1.5%).
Sales and Office Occupations by Sex
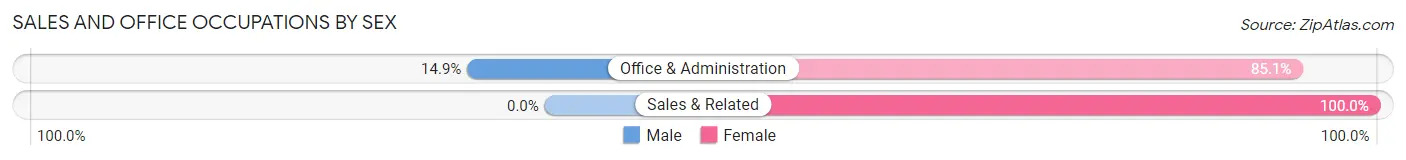
| Occupation | Male | Female |
| Sales & Related | 0 (0.0%) | 18 (100.0%) |
| Office & Administration | 21 (14.9%) | 120 (85.1%) |
| Total (Category) | 21 (13.2%) | 138 (86.8%) |
| Total (Overall) | 515 (43.9%) | 659 (56.1%) |
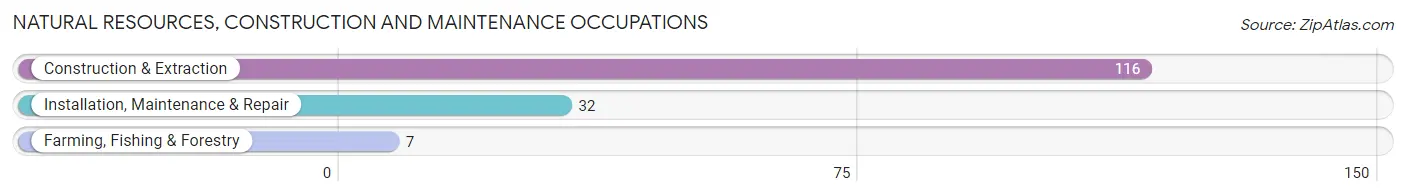
Natural Resources, Construction and Maintenance Occupations
The most common Natural Resources, Construction and Maintenance occupations in Lathrop are Construction & Extraction (116 | 9.9%), Installation, Maintenance & Repair (32 | 2.7%), and Farming, Fishing & Forestry (7 | 0.6%).
Natural Resources, Construction and Maintenance Occupations by Sex
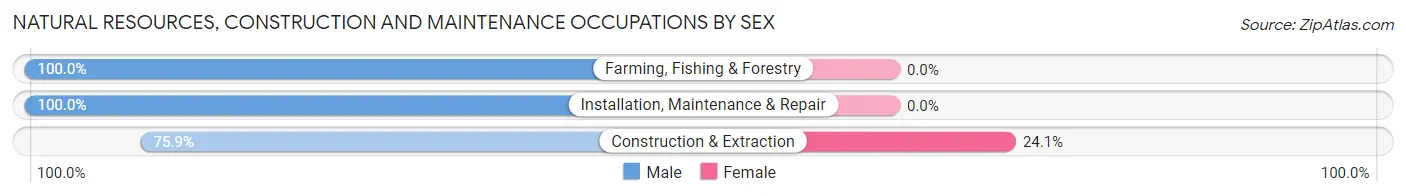
| Occupation | Male | Female |
| Farming, Fishing & Forestry | 7 (100.0%) | 0 (0.0%) |
| Construction & Extraction | 88 (75.9%) | 28 (24.1%) |
| Installation, Maintenance & Repair | 32 (100.0%) | 0 (0.0%) |
| Total (Category) | 127 (81.9%) | 28 (18.1%) |
| Total (Overall) | 515 (43.9%) | 659 (56.1%) |
Production, Transportation and Moving Occupations
The most common Production, Transportation and Moving occupations in Lathrop are Production (102 | 8.7%), Transportation (34 | 2.9%), and Material Moving (34 | 2.9%).
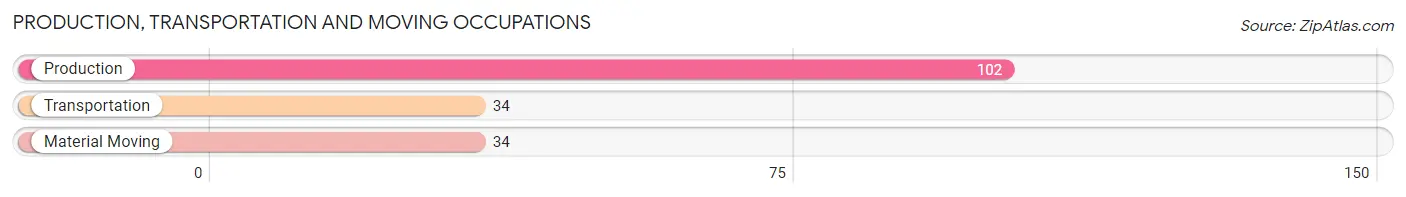
Production, Transportation and Moving Occupations by Sex
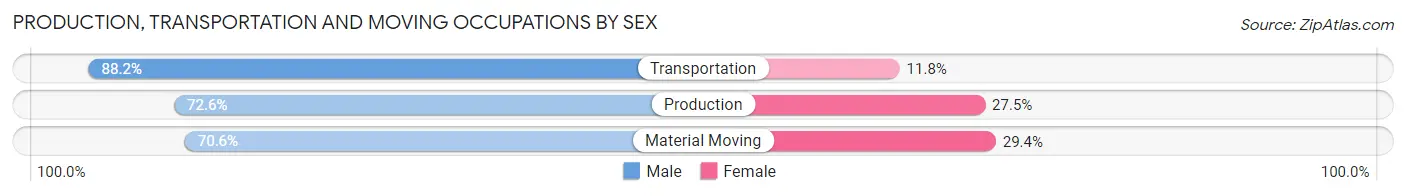
| Occupation | Male | Female |
| Production | 74 (72.6%) | 28 (27.5%) |
| Transportation | 30 (88.2%) | 4 (11.8%) |
| Material Moving | 24 (70.6%) | 10 (29.4%) |
| Total (Category) | 128 (75.3%) | 42 (24.7%) |
| Total (Overall) | 515 (43.9%) | 659 (56.1%) |
Employment Industries by Sex in Lathrop
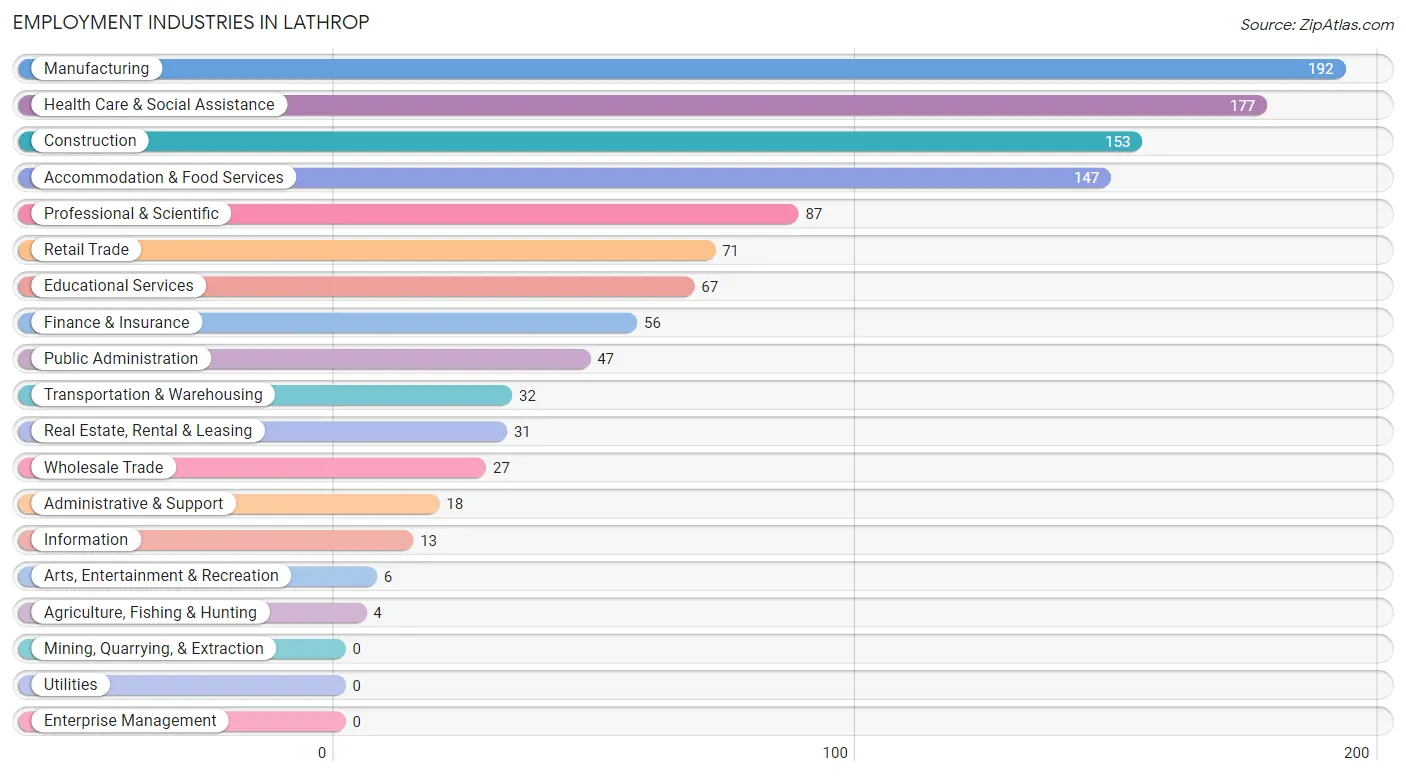
Employment Industries in Lathrop
The major employment industries in Lathrop include Manufacturing (192 | 16.4%), Health Care & Social Assistance (177 | 15.1%), Construction (153 | 13.0%), Accommodation & Food Services (147 | 12.5%), and Professional & Scientific (87 | 7.4%).
Employment Industries by Sex in Lathrop
The Lathrop industries that see more men than women are Agriculture, Fishing & Hunting (100.0%), Administrative & Support (100.0%), and Arts, Entertainment & Recreation (100.0%), whereas the industries that tend to have a higher number of women are Wholesale Trade (92.6%), Professional & Scientific (89.7%), and Finance & Insurance (85.7%).
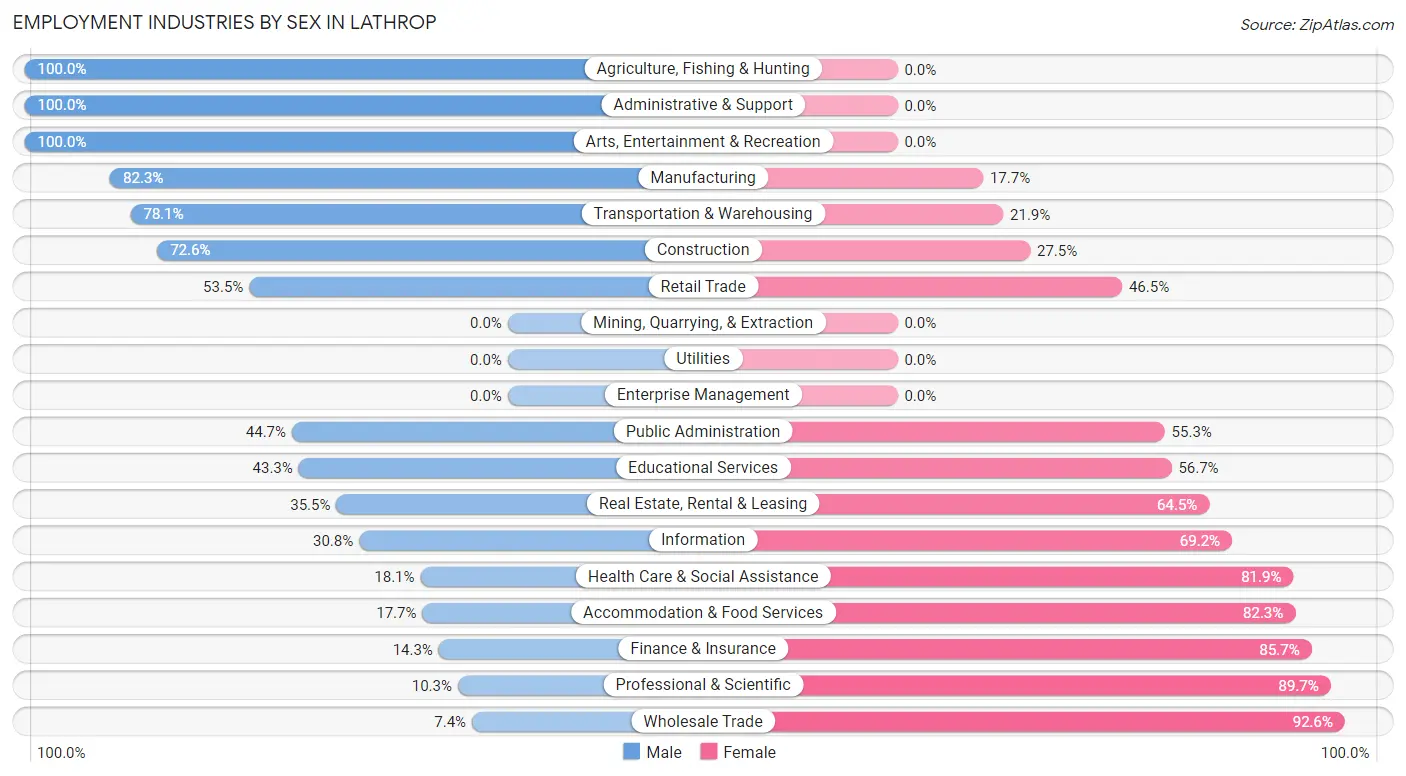
| Industry | Male | Female |
| Agriculture, Fishing & Hunting | 4 (100.0%) | 0 (0.0%) |
| Mining, Quarrying, & Extraction | 0 (0.0%) | 0 (0.0%) |
| Construction | 111 (72.6%) | 42 (27.5%) |
| Manufacturing | 158 (82.3%) | 34 (17.7%) |
| Wholesale Trade | 2 (7.4%) | 25 (92.6%) |
| Retail Trade | 38 (53.5%) | 33 (46.5%) |
| Transportation & Warehousing | 25 (78.1%) | 7 (21.9%) |
| Utilities | 0 (0.0%) | 0 (0.0%) |
| Information | 4 (30.8%) | 9 (69.2%) |
| Finance & Insurance | 8 (14.3%) | 48 (85.7%) |
| Real Estate, Rental & Leasing | 11 (35.5%) | 20 (64.5%) |
| Professional & Scientific | 9 (10.3%) | 78 (89.7%) |
| Enterprise Management | 0 (0.0%) | 0 (0.0%) |
| Administrative & Support | 18 (100.0%) | 0 (0.0%) |
| Educational Services | 29 (43.3%) | 38 (56.7%) |
| Health Care & Social Assistance | 32 (18.1%) | 145 (81.9%) |
| Arts, Entertainment & Recreation | 6 (100.0%) | 0 (0.0%) |
| Accommodation & Food Services | 26 (17.7%) | 121 (82.3%) |
| Public Administration | 21 (44.7%) | 26 (55.3%) |
| Total | 515 (43.9%) | 659 (56.1%) |
Education in Lathrop
School Enrollment in Lathrop
The most common levels of schooling among the 763 students in Lathrop are high school (283 | 37.1%), middle school (196 | 25.7%), and kindergarten (133 | 17.4%).
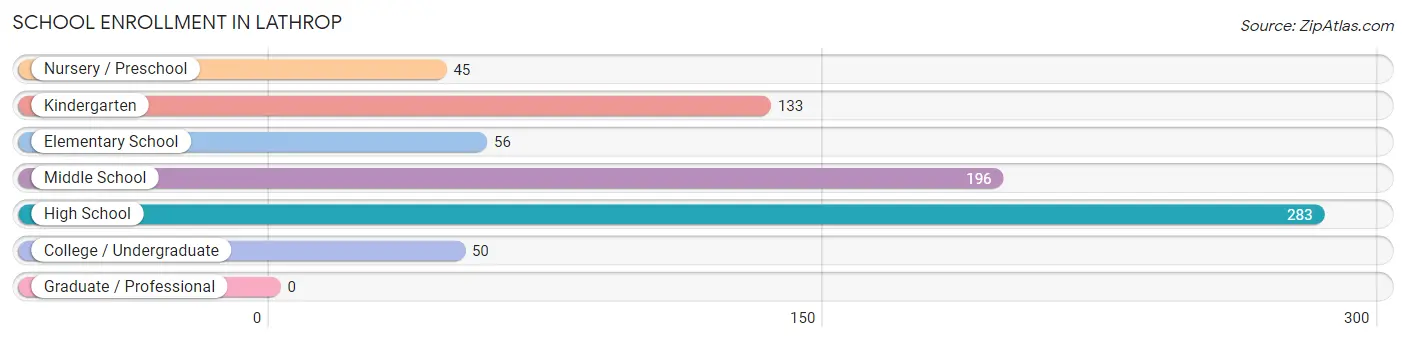
| School Level | # Students | % Students |
| Nursery / Preschool | 45 | 5.9% |
| Kindergarten | 133 | 17.4% |
| Elementary School | 56 | 7.3% |
| Middle School | 196 | 25.7% |
| High School | 283 | 37.1% |
| College / Undergraduate | 50 | 6.6% |
| Graduate / Professional | 0 | 0.0% |
| Total | 763 | 100.0% |
School Enrollment by Age by Funding Source in Lathrop
Out of a total of 763 students who are enrolled in schools in Lathrop, 122 (16.0%) attend a private institution, while the remaining 641 (84.0%) are enrolled in public schools. The age group of 35 years and over has the highest likelihood of being enrolled in private schools, with 6 (54.5% in the age bracket) enrolled. Conversely, the age group of 3 to 4 year olds has the lowest likelihood of being enrolled in a private school, with 13 (100.0% in the age bracket) attending a public institution.
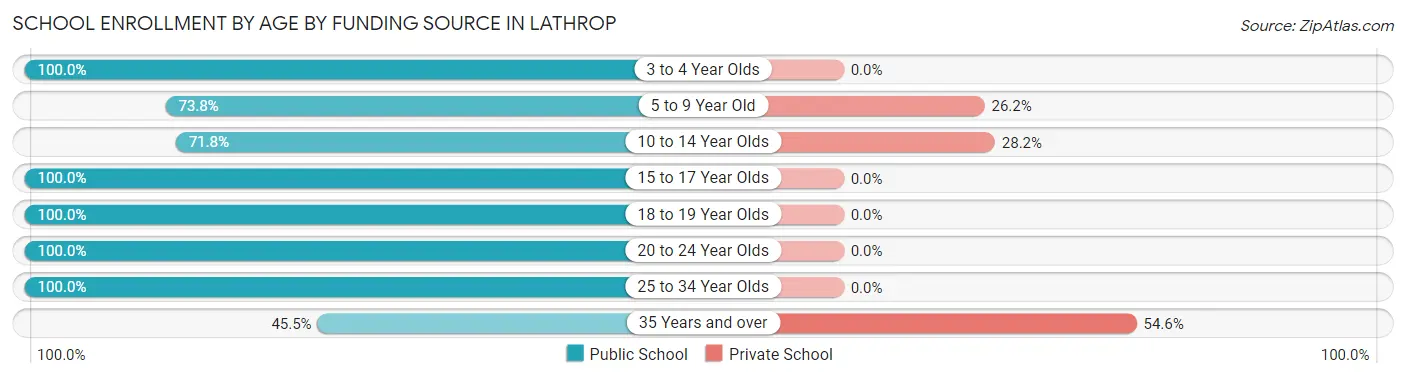
| Age Bracket | Public School | Private School |
| 3 to 4 Year Olds | 13 (100.0%) | 0 (0.0%) |
| 5 to 9 Year Old | 163 (73.8%) | 58 (26.2%) |
| 10 to 14 Year Olds | 148 (71.8%) | 58 (28.2%) |
| 15 to 17 Year Olds | 209 (100.0%) | 0 (0.0%) |
| 18 to 19 Year Olds | 80 (100.0%) | 0 (0.0%) |
| 20 to 24 Year Olds | 11 (100.0%) | 0 (0.0%) |
| 25 to 34 Year Olds | 12 (100.0%) | 0 (0.0%) |
| 35 Years and over | 5 (45.5%) | 6 (54.5%) |
| Total | 641 (84.0%) | 122 (16.0%) |
Educational Attainment by Field of Study in Lathrop
Education (50 | 16.8%), business (49 | 16.4%), bio, nature & agricultural (36 | 12.1%), arts & humanities (32 | 10.7%), and computers & mathematics (28 | 9.4%) are the most common fields of study among 298 individuals in Lathrop who have obtained a bachelor's degree or higher.
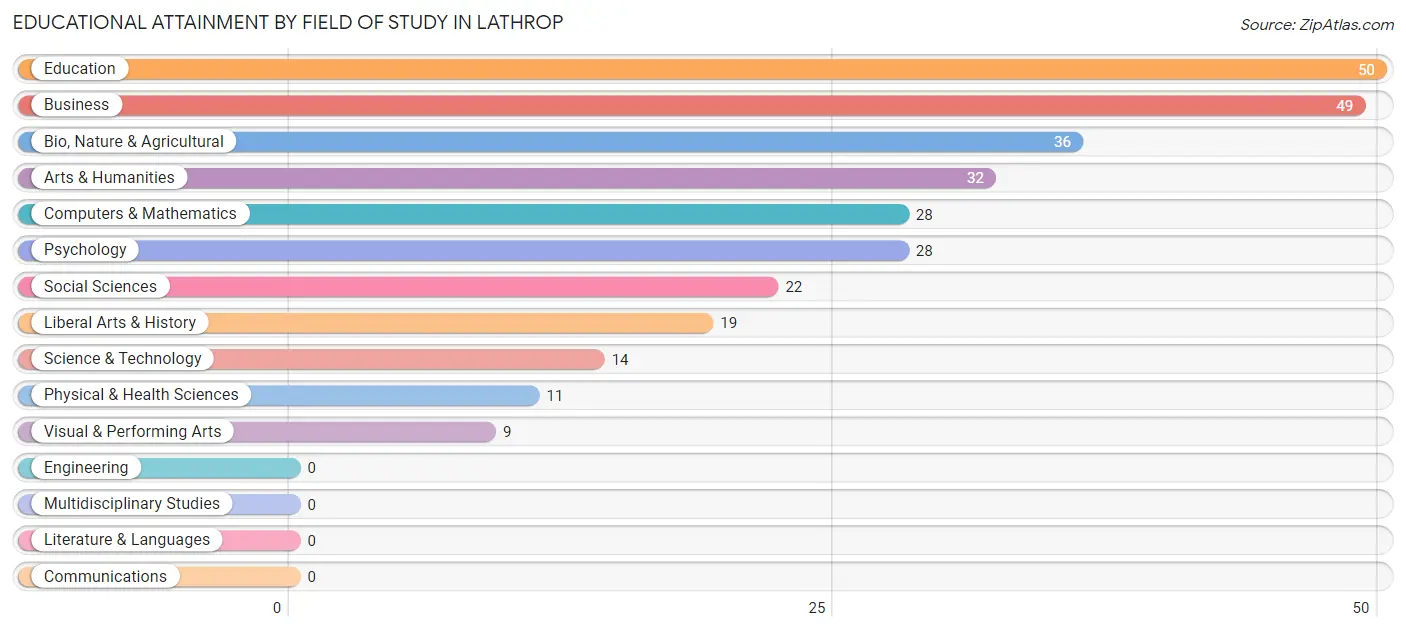
| Field of Study | # Graduates | % Graduates |
| Computers & Mathematics | 28 | 9.4% |
| Bio, Nature & Agricultural | 36 | 12.1% |
| Physical & Health Sciences | 11 | 3.7% |
| Psychology | 28 | 9.4% |
| Social Sciences | 22 | 7.4% |
| Engineering | 0 | 0.0% |
| Multidisciplinary Studies | 0 | 0.0% |
| Science & Technology | 14 | 4.7% |
| Business | 49 | 16.4% |
| Education | 50 | 16.8% |
| Literature & Languages | 0 | 0.0% |
| Liberal Arts & History | 19 | 6.4% |
| Visual & Performing Arts | 9 | 3.0% |
| Communications | 0 | 0.0% |
| Arts & Humanities | 32 | 10.7% |
| Total | 298 | 100.0% |
Transportation & Commute in Lathrop
Vehicle Availability by Sex in Lathrop
The most prevalent vehicle ownership categories in Lathrop are males with 2 vehicles (196, accounting for 38.1%) and females with 2 vehicles (236, making up 29.7%).
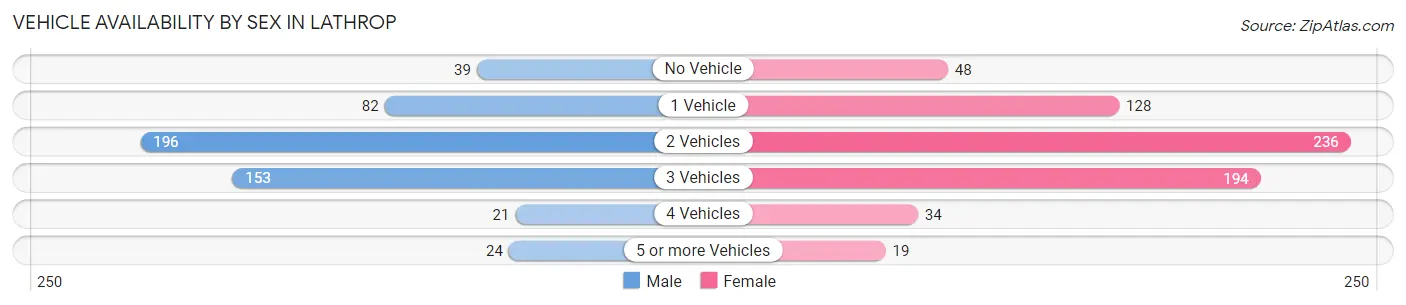
| Vehicles Available | Male | Female |
| No Vehicle | 39 (7.6%) | 48 (7.3%) |
| 1 Vehicle | 82 (15.9%) | 128 (19.4%) |
| 2 Vehicles | 196 (38.1%) | 236 (35.8%) |
| 3 Vehicles | 153 (29.7%) | 194 (29.4%) |
| 4 Vehicles | 21 (4.1%) | 34 (5.2%) |
| 5 or more Vehicles | 24 (4.7%) | 19 (2.9%) |
| Total | 515 (100.0%) | 659 (100.0%) |
Commute Time in Lathrop
The most frequently occuring commute durations in Lathrop are 20 to 24 minutes (220 commuters, 20.2%), 45 to 59 minutes (207 commuters, 19.0%), and 30 to 34 minutes (118 commuters, 10.8%).
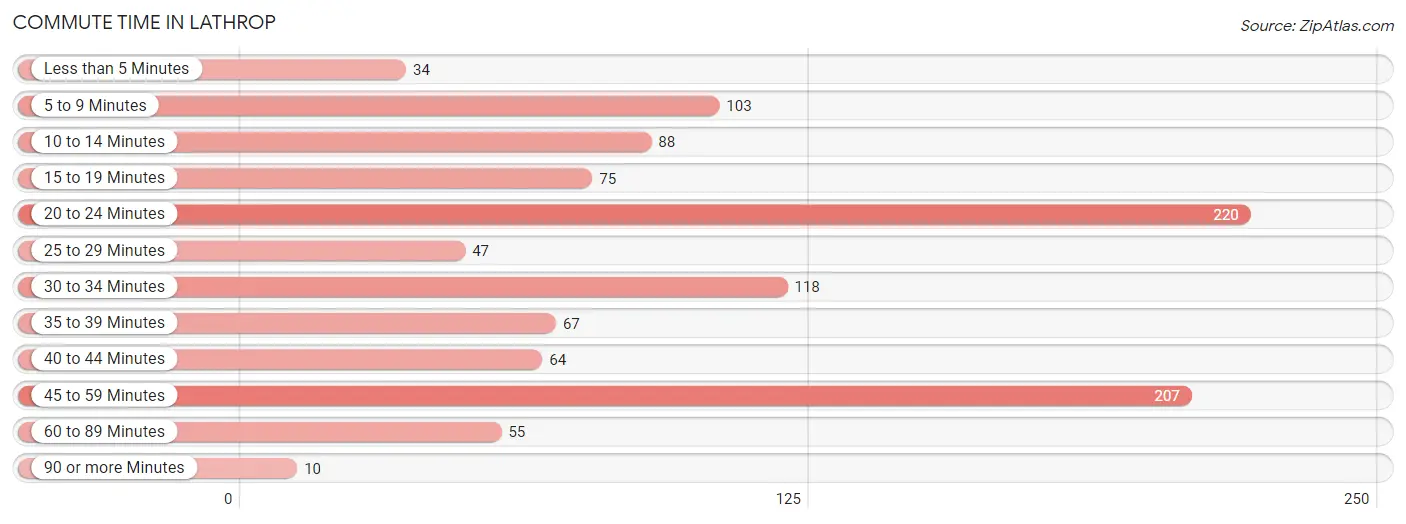
| Commute Time | # Commuters | % Commuters |
| Less than 5 Minutes | 34 | 3.1% |
| 5 to 9 Minutes | 103 | 9.5% |
| 10 to 14 Minutes | 88 | 8.1% |
| 15 to 19 Minutes | 75 | 6.9% |
| 20 to 24 Minutes | 220 | 20.2% |
| 25 to 29 Minutes | 47 | 4.3% |
| 30 to 34 Minutes | 118 | 10.8% |
| 35 to 39 Minutes | 67 | 6.2% |
| 40 to 44 Minutes | 64 | 5.9% |
| 45 to 59 Minutes | 207 | 19.0% |
| 60 to 89 Minutes | 55 | 5.1% |
| 90 or more Minutes | 10 | 0.9% |
Commute Time by Sex in Lathrop
The most common commute times in Lathrop are 45 to 59 minutes (139 commuters, 27.9%) for males and 20 to 24 minutes (189 commuters, 32.1%) for females.
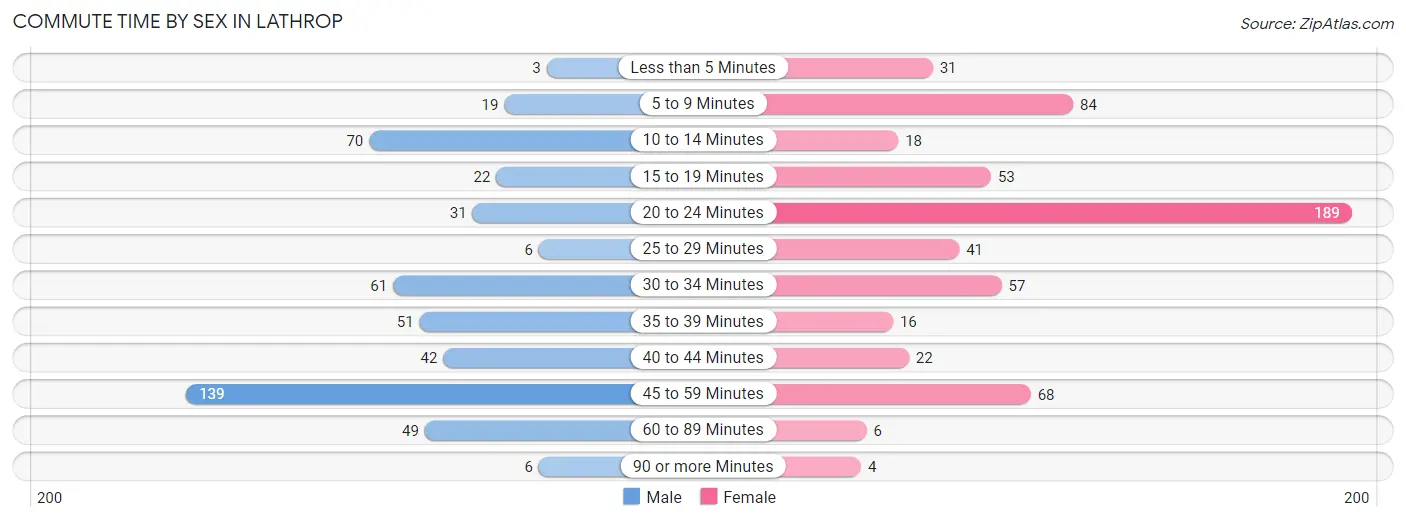
| Commute Time | Male | Female |
| Less than 5 Minutes | 3 (0.6%) | 31 (5.3%) |
| 5 to 9 Minutes | 19 (3.8%) | 84 (14.3%) |
| 10 to 14 Minutes | 70 (14.0%) | 18 (3.1%) |
| 15 to 19 Minutes | 22 (4.4%) | 53 (9.0%) |
| 20 to 24 Minutes | 31 (6.2%) | 189 (32.1%) |
| 25 to 29 Minutes | 6 (1.2%) | 41 (7.0%) |
| 30 to 34 Minutes | 61 (12.2%) | 57 (9.7%) |
| 35 to 39 Minutes | 51 (10.2%) | 16 (2.7%) |
| 40 to 44 Minutes | 42 (8.4%) | 22 (3.7%) |
| 45 to 59 Minutes | 139 (27.9%) | 68 (11.5%) |
| 60 to 89 Minutes | 49 (9.8%) | 6 (1.0%) |
| 90 or more Minutes | 6 (1.2%) | 4 (0.7%) |
Time of Departure to Work by Sex in Lathrop
The most frequent times of departure to work in Lathrop are 6:30 AM to 6:59 AM (106, 21.2%) for males and 7:30 AM to 7:59 AM (125, 21.2%) for females.
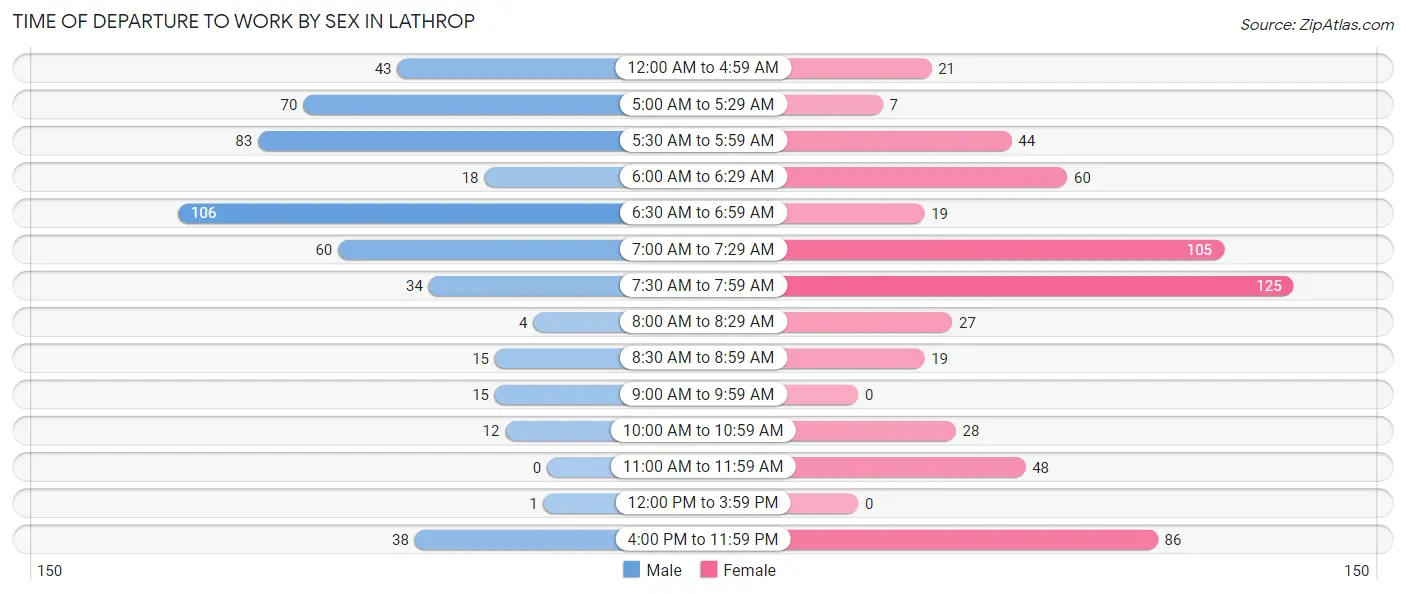
| Time of Departure | Male | Female |
| 12:00 AM to 4:59 AM | 43 (8.6%) | 21 (3.6%) |
| 5:00 AM to 5:29 AM | 70 (14.0%) | 7 (1.2%) |
| 5:30 AM to 5:59 AM | 83 (16.6%) | 44 (7.5%) |
| 6:00 AM to 6:29 AM | 18 (3.6%) | 60 (10.2%) |
| 6:30 AM to 6:59 AM | 106 (21.2%) | 19 (3.2%) |
| 7:00 AM to 7:29 AM | 60 (12.0%) | 105 (17.8%) |
| 7:30 AM to 7:59 AM | 34 (6.8%) | 125 (21.2%) |
| 8:00 AM to 8:29 AM | 4 (0.8%) | 27 (4.6%) |
| 8:30 AM to 8:59 AM | 15 (3.0%) | 19 (3.2%) |
| 9:00 AM to 9:59 AM | 15 (3.0%) | 0 (0.0%) |
| 10:00 AM to 10:59 AM | 12 (2.4%) | 28 (4.8%) |
| 11:00 AM to 11:59 AM | 0 (0.0%) | 48 (8.2%) |
| 12:00 PM to 3:59 PM | 1 (0.2%) | 0 (0.0%) |
| 4:00 PM to 11:59 PM | 38 (7.6%) | 86 (14.6%) |
| Total | 499 (100.0%) | 589 (100.0%) |
Housing Occupancy in Lathrop
Occupancy by Ownership in Lathrop
Of the total 837 dwellings in Lathrop, owner-occupied units account for 613 (73.2%), while renter-occupied units make up 224 (26.8%).
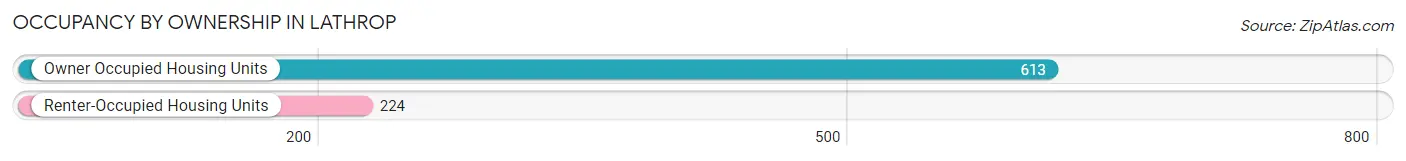
| Occupancy | # Housing Units | % Housing Units |
| Owner Occupied Housing Units | 613 | 73.2% |
| Renter-Occupied Housing Units | 224 | 26.8% |
| Total Occupied Housing Units | 837 | 100.0% |
Occupancy by Household Size in Lathrop
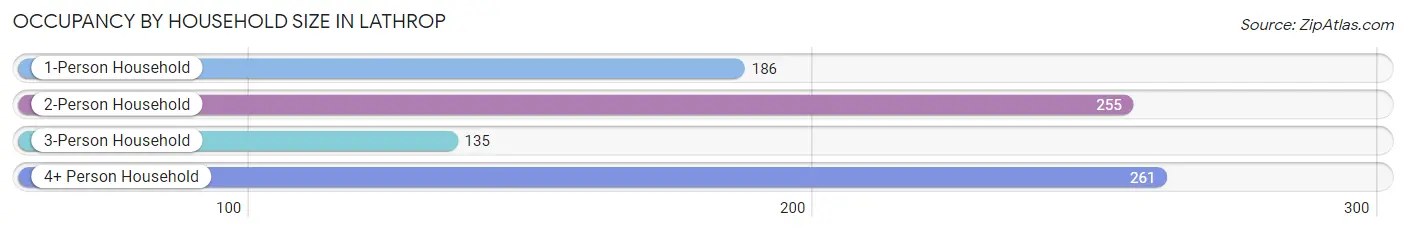
| Household Size | # Housing Units | % Housing Units |
| 1-Person Household | 186 | 22.2% |
| 2-Person Household | 255 | 30.5% |
| 3-Person Household | 135 | 16.1% |
| 4+ Person Household | 261 | 31.2% |
| Total Housing Units | 837 | 100.0% |
Occupancy by Ownership by Household Size in Lathrop
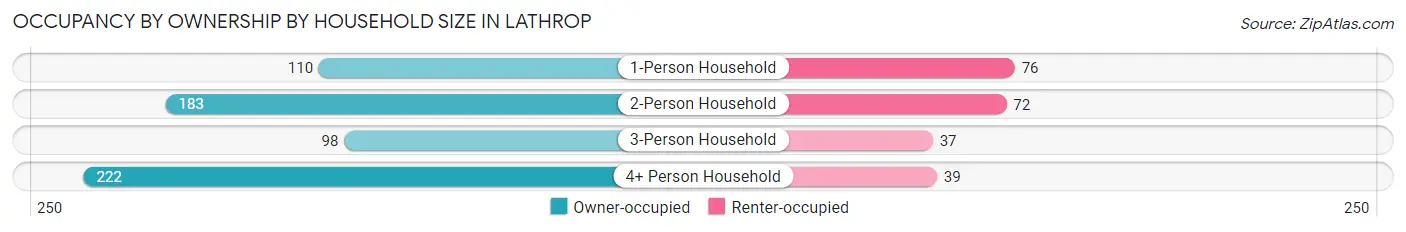
| Household Size | Owner-occupied | Renter-occupied |
| 1-Person Household | 110 (59.1%) | 76 (40.9%) |
| 2-Person Household | 183 (71.8%) | 72 (28.2%) |
| 3-Person Household | 98 (72.6%) | 37 (27.4%) |
| 4+ Person Household | 222 (85.1%) | 39 (14.9%) |
| Total Housing Units | 613 (73.2%) | 224 (26.8%) |
Occupancy by Educational Attainment in Lathrop
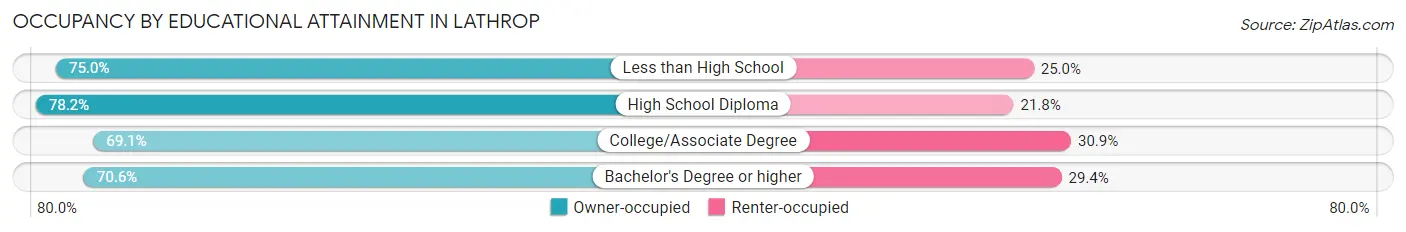
| Household Size | Owner-occupied | Renter-occupied |
| Less than High School | 54 (75.0%) | 18 (25.0%) |
| High School Diploma | 244 (78.2%) | 68 (21.8%) |
| College/Associate Degree | 219 (69.1%) | 98 (30.9%) |
| Bachelor's Degree or higher | 96 (70.6%) | 40 (29.4%) |
Occupancy by Age of Householder in Lathrop
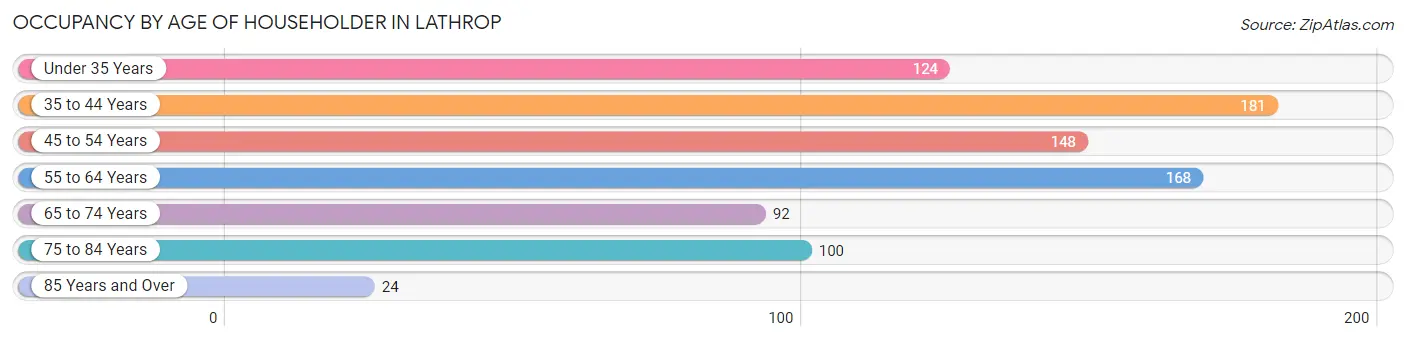
| Age Bracket | # Households | % Households |
| Under 35 Years | 124 | 14.8% |
| 35 to 44 Years | 181 | 21.6% |
| 45 to 54 Years | 148 | 17.7% |
| 55 to 64 Years | 168 | 20.1% |
| 65 to 74 Years | 92 | 11.0% |
| 75 to 84 Years | 100 | 11.9% |
| 85 Years and Over | 24 | 2.9% |
| Total | 837 | 100.0% |
Housing Finances in Lathrop
Median Income by Occupancy in Lathrop
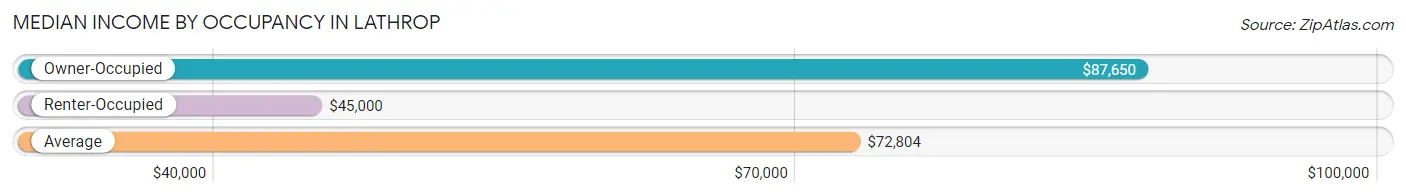
| Occupancy Type | # Households | Median Income |
| Owner-Occupied | 613 (73.2%) | $87,650 |
| Renter-Occupied | 224 (26.8%) | $45,000 |
| Average | 837 (100.0%) | $72,804 |
Occupancy by Householder Income Bracket in Lathrop
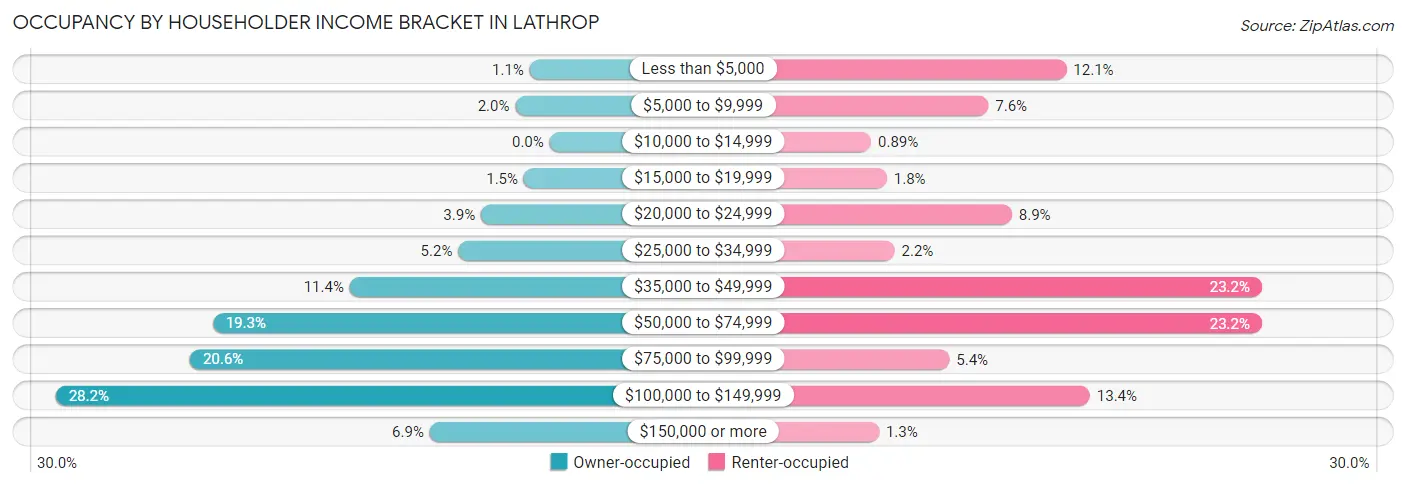
| Income Bracket | Owner-occupied | Renter-occupied |
| Less than $5,000 | 7 (1.1%) | 27 (12.0%) |
| $5,000 to $9,999 | 12 (2.0%) | 17 (7.6%) |
| $10,000 to $14,999 | 0 (0.0%) | 2 (0.9%) |
| $15,000 to $19,999 | 9 (1.5%) | 4 (1.8%) |
| $20,000 to $24,999 | 24 (3.9%) | 20 (8.9%) |
| $25,000 to $34,999 | 32 (5.2%) | 5 (2.2%) |
| $35,000 to $49,999 | 70 (11.4%) | 52 (23.2%) |
| $50,000 to $74,999 | 118 (19.3%) | 52 (23.2%) |
| $75,000 to $99,999 | 126 (20.5%) | 12 (5.4%) |
| $100,000 to $149,999 | 173 (28.2%) | 30 (13.4%) |
| $150,000 or more | 42 (6.9%) | 3 (1.3%) |
| Total | 613 (100.0%) | 224 (100.0%) |
Monthly Housing Cost Tiers in Lathrop
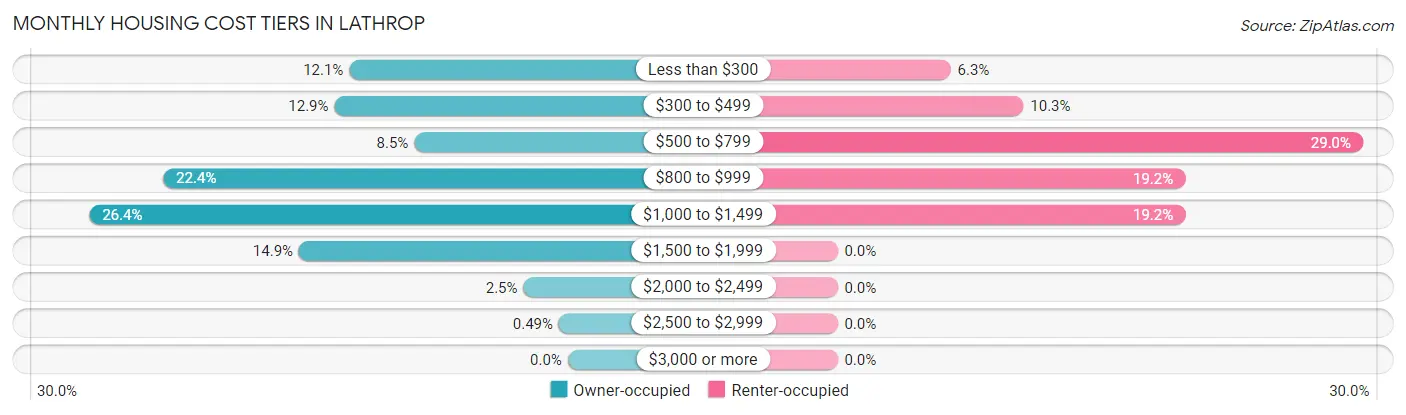
| Monthly Cost | Owner-occupied | Renter-occupied |
| Less than $300 | 74 (12.1%) | 14 (6.2%) |
| $300 to $499 | 79 (12.9%) | 23 (10.3%) |
| $500 to $799 | 52 (8.5%) | 65 (29.0%) |
| $800 to $999 | 137 (22.4%) | 43 (19.2%) |
| $1,000 to $1,499 | 162 (26.4%) | 43 (19.2%) |
| $1,500 to $1,999 | 91 (14.8%) | 0 (0.0%) |
| $2,000 to $2,499 | 15 (2.5%) | 0 (0.0%) |
| $2,500 to $2,999 | 3 (0.5%) | 0 (0.0%) |
| $3,000 or more | 0 (0.0%) | 0 (0.0%) |
| Total | 613 (100.0%) | 224 (100.0%) |
Physical Housing Characteristics in Lathrop
Housing Structures in Lathrop
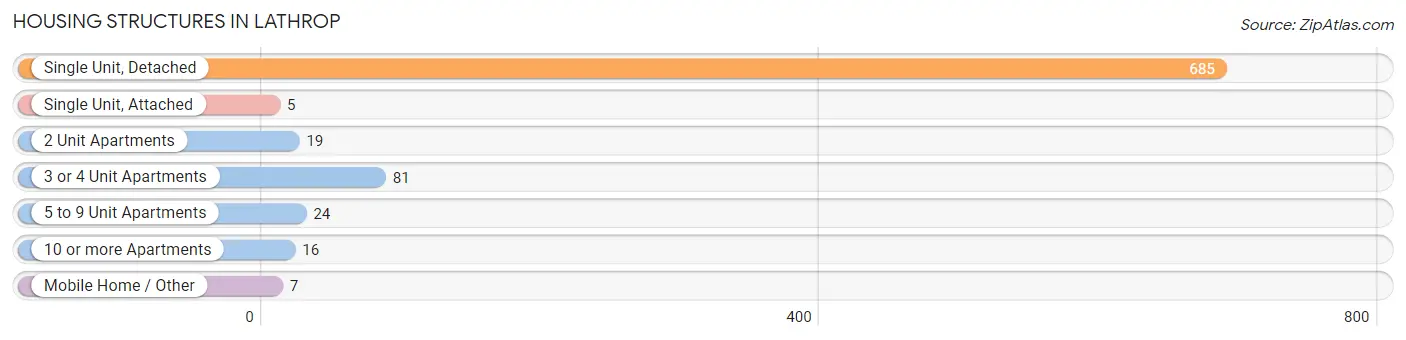
| Structure Type | # Housing Units | % Housing Units |
| Single Unit, Detached | 685 | 81.8% |
| Single Unit, Attached | 5 | 0.6% |
| 2 Unit Apartments | 19 | 2.3% |
| 3 or 4 Unit Apartments | 81 | 9.7% |
| 5 to 9 Unit Apartments | 24 | 2.9% |
| 10 or more Apartments | 16 | 1.9% |
| Mobile Home / Other | 7 | 0.8% |
| Total | 837 | 100.0% |
Housing Structures by Occupancy in Lathrop
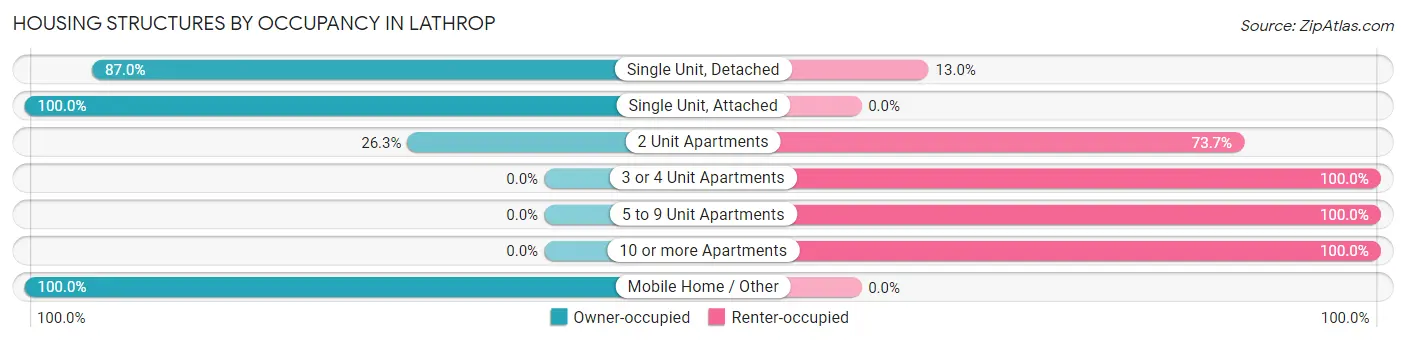
| Structure Type | Owner-occupied | Renter-occupied |
| Single Unit, Detached | 596 (87.0%) | 89 (13.0%) |
| Single Unit, Attached | 5 (100.0%) | 0 (0.0%) |
| 2 Unit Apartments | 5 (26.3%) | 14 (73.7%) |
| 3 or 4 Unit Apartments | 0 (0.0%) | 81 (100.0%) |
| 5 to 9 Unit Apartments | 0 (0.0%) | 24 (100.0%) |
| 10 or more Apartments | 0 (0.0%) | 16 (100.0%) |
| Mobile Home / Other | 7 (100.0%) | 0 (0.0%) |
| Total | 613 (73.2%) | 224 (26.8%) |
Housing Structures by Number of Rooms in Lathrop
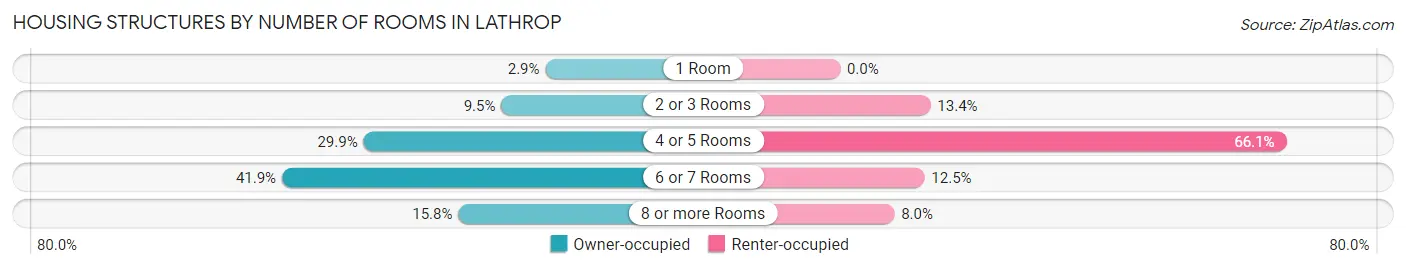
| Number of Rooms | Owner-occupied | Renter-occupied |
| 1 Room | 18 (2.9%) | 0 (0.0%) |
| 2 or 3 Rooms | 58 (9.5%) | 30 (13.4%) |
| 4 or 5 Rooms | 183 (29.8%) | 148 (66.1%) |
| 6 or 7 Rooms | 257 (41.9%) | 28 (12.5%) |
| 8 or more Rooms | 97 (15.8%) | 18 (8.0%) |
| Total | 613 (100.0%) | 224 (100.0%) |
Housing Structure by Heating Type in Lathrop
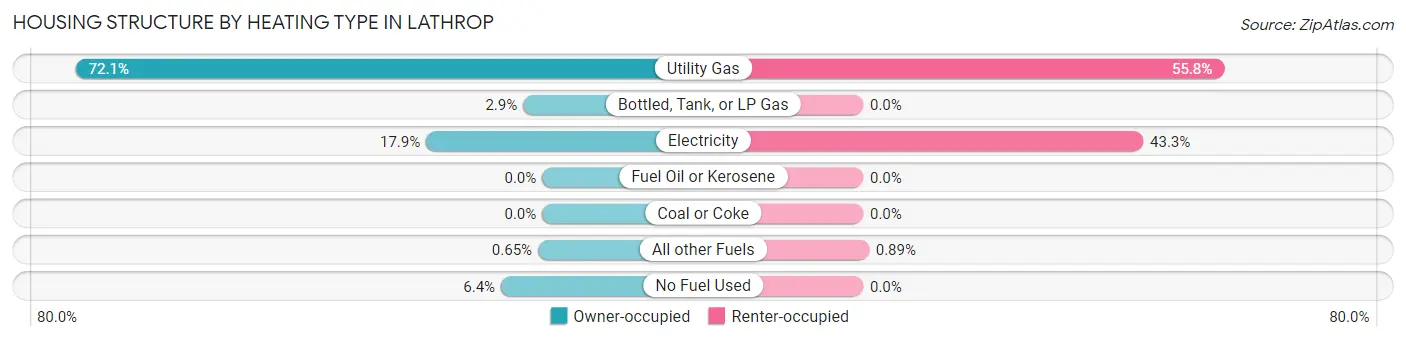
| Heating Type | Owner-occupied | Renter-occupied |
| Utility Gas | 442 (72.1%) | 125 (55.8%) |
| Bottled, Tank, or LP Gas | 18 (2.9%) | 0 (0.0%) |
| Electricity | 110 (17.9%) | 97 (43.3%) |
| Fuel Oil or Kerosene | 0 (0.0%) | 0 (0.0%) |
| Coal or Coke | 0 (0.0%) | 0 (0.0%) |
| All other Fuels | 4 (0.6%) | 2 (0.9%) |
| No Fuel Used | 39 (6.4%) | 0 (0.0%) |
| Total | 613 (100.0%) | 224 (100.0%) |
Household Vehicle Usage in Lathrop
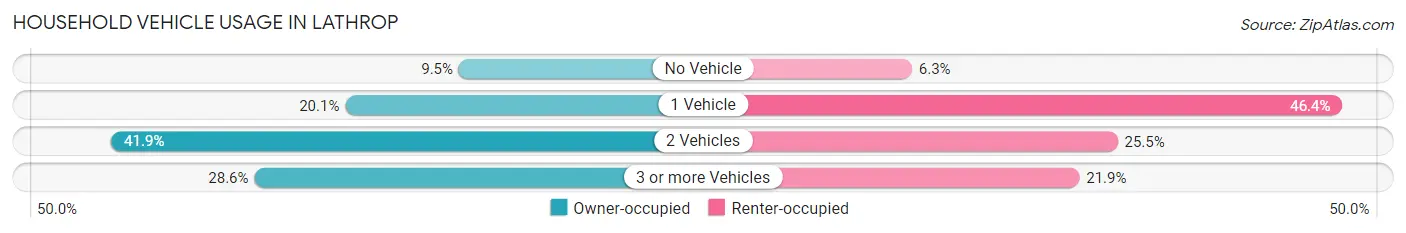
| Vehicles per Household | Owner-occupied | Renter-occupied |
| No Vehicle | 58 (9.5%) | 14 (6.2%) |
| 1 Vehicle | 123 (20.1%) | 104 (46.4%) |
| 2 Vehicles | 257 (41.9%) | 57 (25.5%) |
| 3 or more Vehicles | 175 (28.5%) | 49 (21.9%) |
| Total | 613 (100.0%) | 224 (100.0%) |
Real Estate & Mortgages in Lathrop
Real Estate and Mortgage Overview in Lathrop
| Characteristic | Without Mortgage | With Mortgage |
| Housing Units | 221 | 392 |
| Median Property Value | $90,300 | $158,500 |
| Median Household Income | $60,982 | $38 |
| Monthly Housing Costs | $429 | $0 |
| Real Estate Taxes | $1,282 | $8 |
Property Value by Mortgage Status in Lathrop
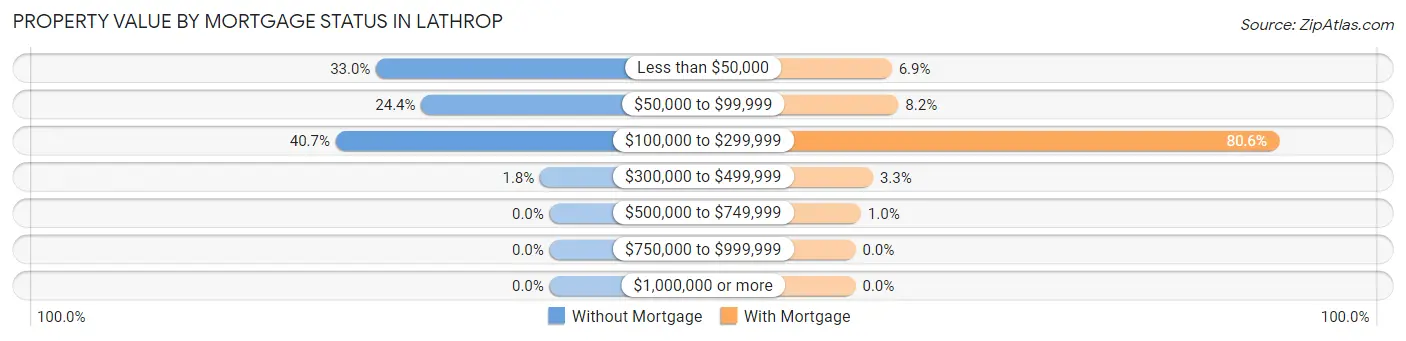
| Property Value | Without Mortgage | With Mortgage |
| Less than $50,000 | 73 (33.0%) | 27 (6.9%) |
| $50,000 to $99,999 | 54 (24.4%) | 32 (8.2%) |
| $100,000 to $299,999 | 90 (40.7%) | 316 (80.6%) |
| $300,000 to $499,999 | 4 (1.8%) | 13 (3.3%) |
| $500,000 to $749,999 | 0 (0.0%) | 4 (1.0%) |
| $750,000 to $999,999 | 0 (0.0%) | 0 (0.0%) |
| $1,000,000 or more | 0 (0.0%) | 0 (0.0%) |
| Total | 221 (100.0%) | 392 (100.0%) |
Household Income by Mortgage Status in Lathrop
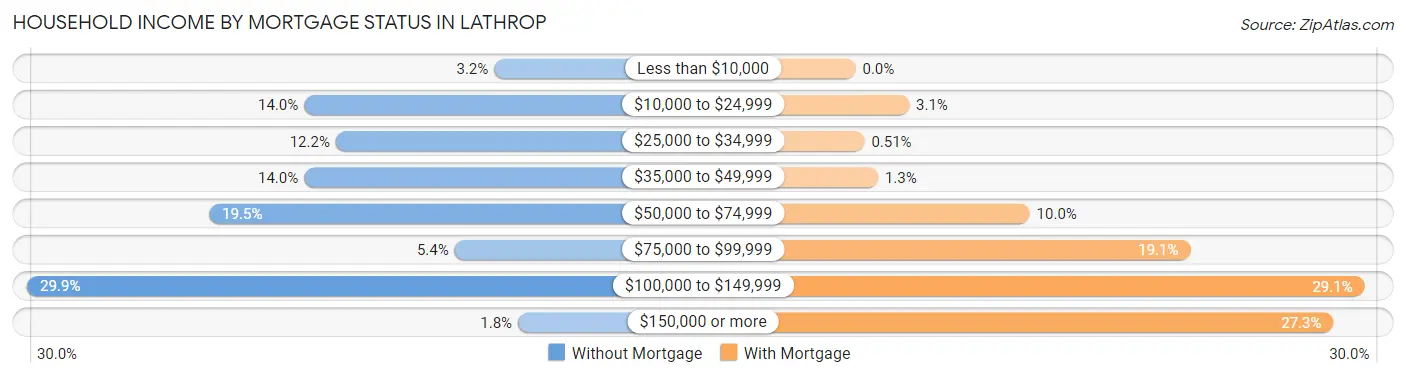
| Household Income | Without Mortgage | With Mortgage |
| Less than $10,000 | 7 (3.2%) | 0 (0.0%) |
| $10,000 to $24,999 | 31 (14.0%) | 12 (3.1%) |
| $25,000 to $34,999 | 27 (12.2%) | 2 (0.5%) |
| $35,000 to $49,999 | 31 (14.0%) | 5 (1.3%) |
| $50,000 to $74,999 | 43 (19.5%) | 39 (10.0%) |
| $75,000 to $99,999 | 12 (5.4%) | 75 (19.1%) |
| $100,000 to $149,999 | 66 (29.9%) | 114 (29.1%) |
| $150,000 or more | 4 (1.8%) | 107 (27.3%) |
| Total | 221 (100.0%) | 392 (100.0%) |
Property Value to Household Income Ratio in Lathrop
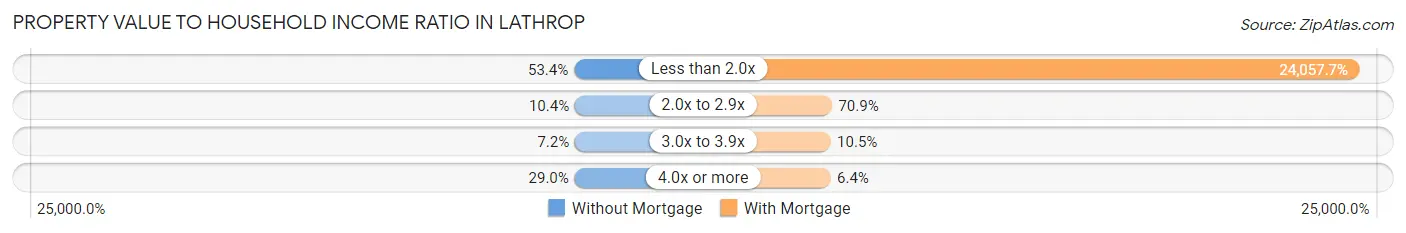
| Value-to-Income Ratio | Without Mortgage | With Mortgage |
| Less than 2.0x | 118 (53.4%) | 94,306 (24,057.7%) |
| 2.0x to 2.9x | 23 (10.4%) | 278 (70.9%) |
| 3.0x to 3.9x | 16 (7.2%) | 41 (10.5%) |
| 4.0x or more | 64 (29.0%) | 25 (6.4%) |
| Total | 221 (100.0%) | 392 (100.0%) |
Real Estate Taxes by Mortgage Status in Lathrop
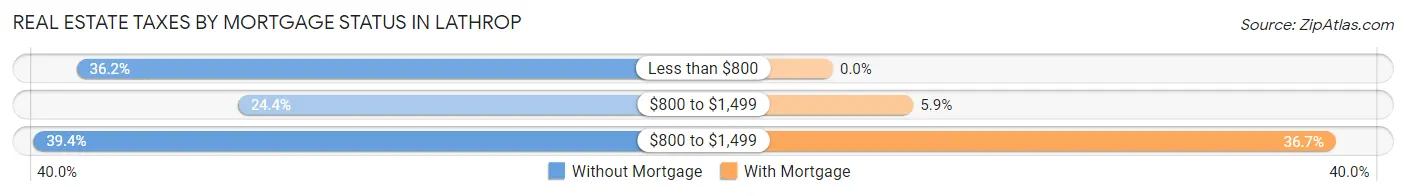
| Property Taxes | Without Mortgage | With Mortgage |
| Less than $800 | 80 (36.2%) | 0 (0.0%) |
| $800 to $1,499 | 54 (24.4%) | 23 (5.9%) |
| $800 to $1,499 | 87 (39.4%) | 144 (36.7%) |
| Total | 221 (100.0%) | 392 (100.0%) |
Health & Disability in Lathrop
Health Insurance Coverage by Age in Lathrop
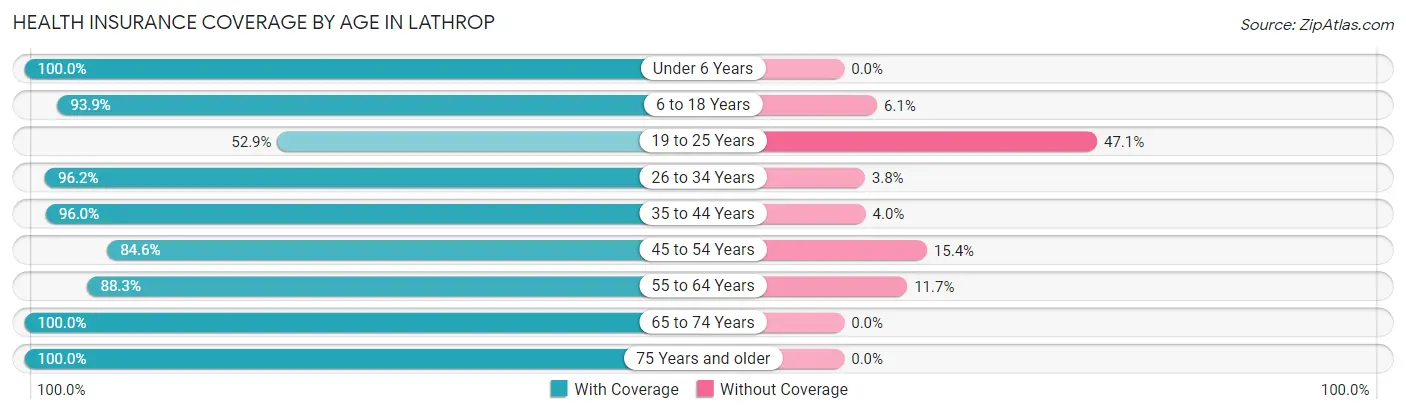
| Age Bracket | With Coverage | Without Coverage |
| Under 6 Years | 124 (100.0%) | 0 (0.0%) |
| 6 to 18 Years | 614 (93.9%) | 40 (6.1%) |
| 19 to 25 Years | 138 (52.9%) | 123 (47.1%) |
| 26 to 34 Years | 251 (96.2%) | 10 (3.8%) |
| 35 to 44 Years | 339 (96.0%) | 14 (4.0%) |
| 45 to 54 Years | 236 (84.6%) | 43 (15.4%) |
| 55 to 64 Years | 248 (88.3%) | 33 (11.7%) |
| 65 to 74 Years | 174 (100.0%) | 0 (0.0%) |
| 75 Years and older | 159 (100.0%) | 0 (0.0%) |
| Total | 2,283 (89.7%) | 263 (10.3%) |
Health Insurance Coverage by Citizenship Status in Lathrop
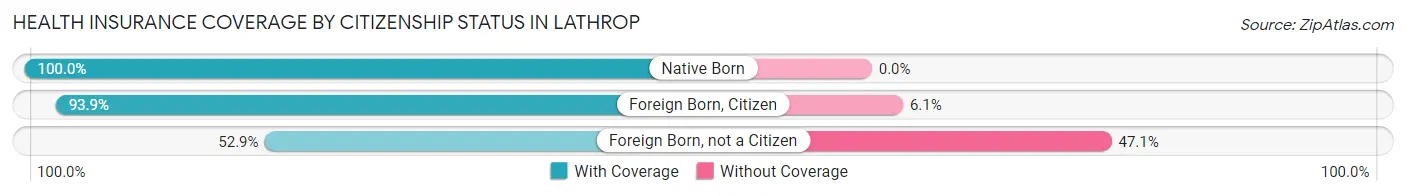
| Citizenship Status | With Coverage | Without Coverage |
| Native Born | 124 (100.0%) | 0 (0.0%) |
| Foreign Born, Citizen | 614 (93.9%) | 40 (6.1%) |
| Foreign Born, not a Citizen | 138 (52.9%) | 123 (47.1%) |
Health Insurance Coverage by Household Income in Lathrop
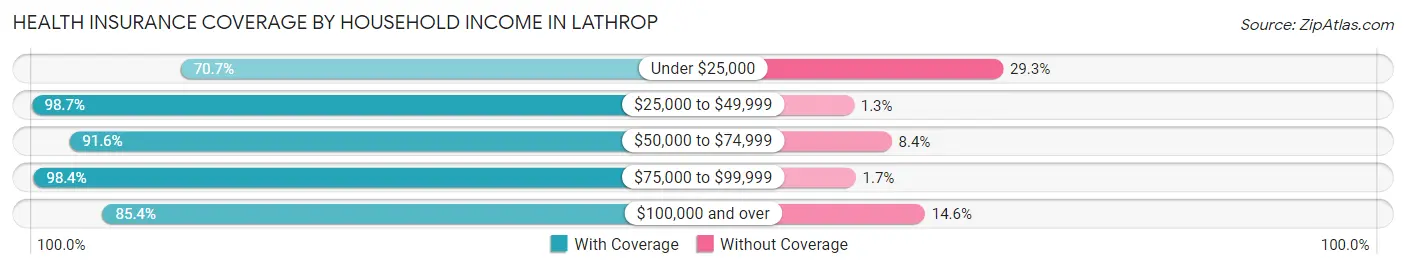
| Household Income | With Coverage | Without Coverage |
| Under $25,000 | 162 (70.7%) | 67 (29.3%) |
| $25,000 to $49,999 | 376 (98.7%) | 5 (1.3%) |
| $50,000 to $74,999 | 426 (91.6%) | 39 (8.4%) |
| $75,000 to $99,999 | 478 (98.4%) | 8 (1.7%) |
| $100,000 and over | 841 (85.4%) | 144 (14.6%) |
Public vs Private Health Insurance Coverage by Age in Lathrop
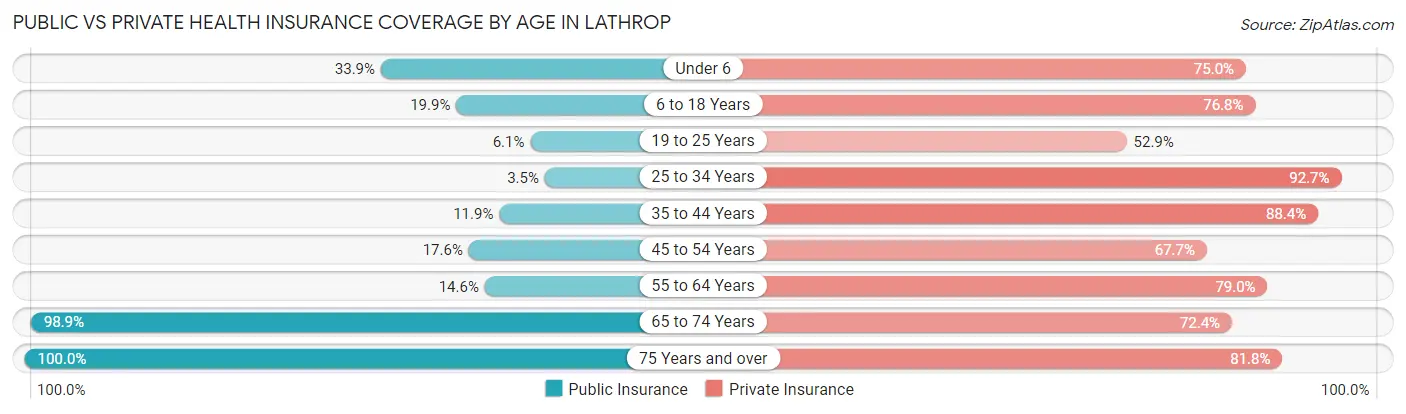
| Age Bracket | Public Insurance | Private Insurance |
| Under 6 | 42 (33.9%) | 93 (75.0%) |
| 6 to 18 Years | 130 (19.9%) | 502 (76.8%) |
| 19 to 25 Years | 16 (6.1%) | 138 (52.9%) |
| 25 to 34 Years | 9 (3.5%) | 242 (92.7%) |
| 35 to 44 Years | 42 (11.9%) | 312 (88.4%) |
| 45 to 54 Years | 49 (17.6%) | 189 (67.7%) |
| 55 to 64 Years | 41 (14.6%) | 222 (79.0%) |
| 65 to 74 Years | 172 (98.9%) | 126 (72.4%) |
| 75 Years and over | 159 (100.0%) | 130 (81.8%) |
| Total | 660 (25.9%) | 1,954 (76.7%) |
Disability Status by Sex by Age in Lathrop
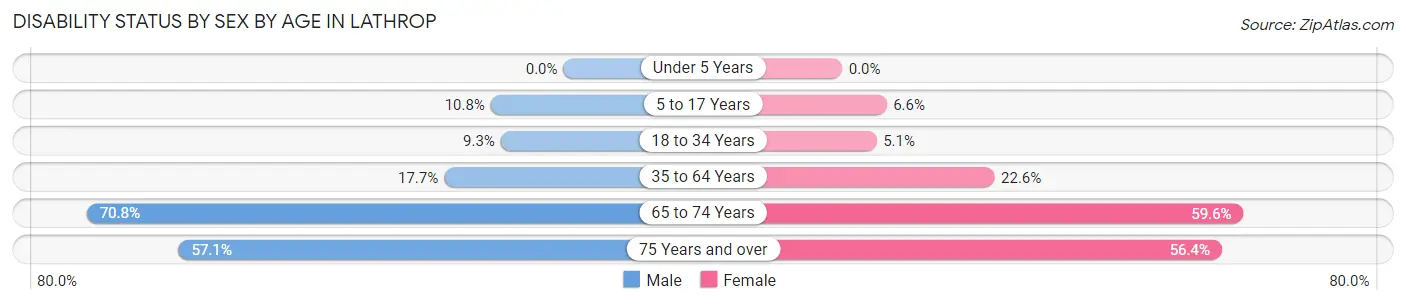
| Age Bracket | Male | Female |
| Under 5 Years | 0 (0.0%) | 0 (0.0%) |
| 5 to 17 Years | 41 (10.8%) | 18 (6.6%) |
| 18 to 34 Years | 23 (9.3%) | 16 (5.1%) |
| 35 to 64 Years | 67 (17.7%) | 121 (22.6%) |
| 65 to 74 Years | 46 (70.8%) | 65 (59.6%) |
| 75 Years and over | 24 (57.1%) | 66 (56.4%) |
Disability Class by Sex by Age in Lathrop
Disability Class: Hearing Difficulty
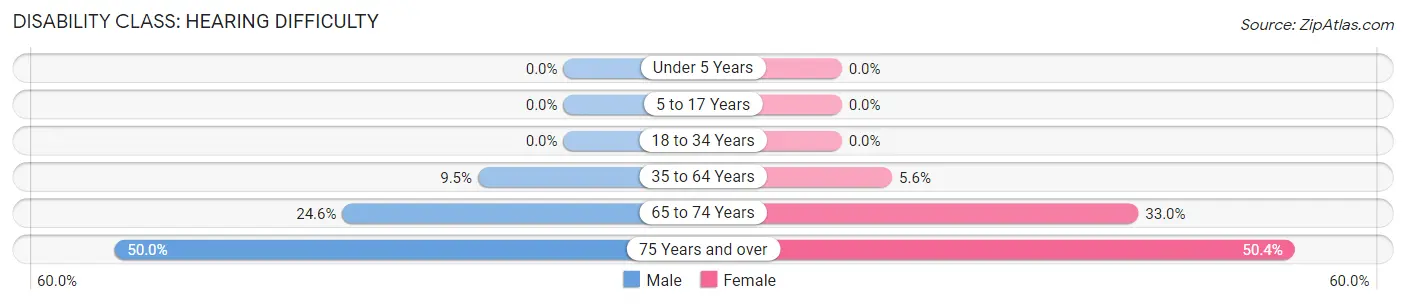
| Age Bracket | Male | Female |
| Under 5 Years | 0 (0.0%) | 0 (0.0%) |
| 5 to 17 Years | 0 (0.0%) | 0 (0.0%) |
| 18 to 34 Years | 0 (0.0%) | 0 (0.0%) |
| 35 to 64 Years | 36 (9.5%) | 30 (5.6%) |
| 65 to 74 Years | 16 (24.6%) | 36 (33.0%) |
| 75 Years and over | 21 (50.0%) | 59 (50.4%) |
Disability Class: Vision Difficulty
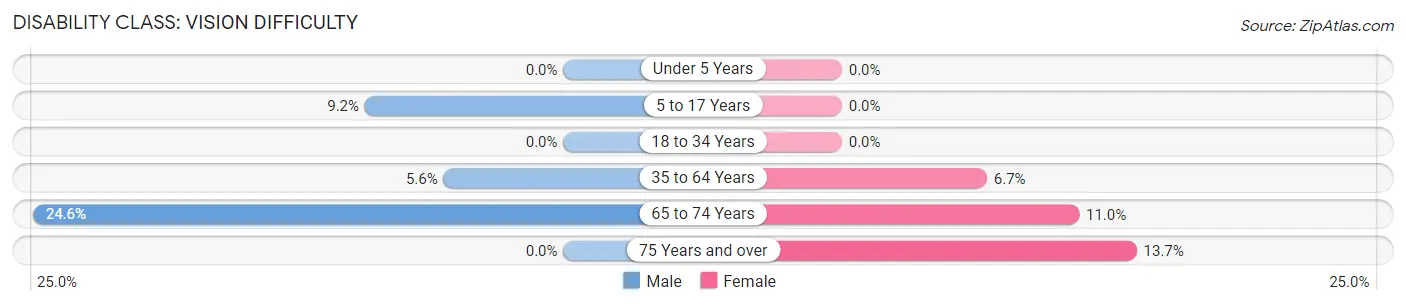
| Age Bracket | Male | Female |
| Under 5 Years | 0 (0.0%) | 0 (0.0%) |
| 5 to 17 Years | 35 (9.2%) | 0 (0.0%) |
| 18 to 34 Years | 0 (0.0%) | 0 (0.0%) |
| 35 to 64 Years | 21 (5.6%) | 36 (6.7%) |
| 65 to 74 Years | 16 (24.6%) | 12 (11.0%) |
| 75 Years and over | 0 (0.0%) | 16 (13.7%) |
Disability Class: Cognitive Difficulty
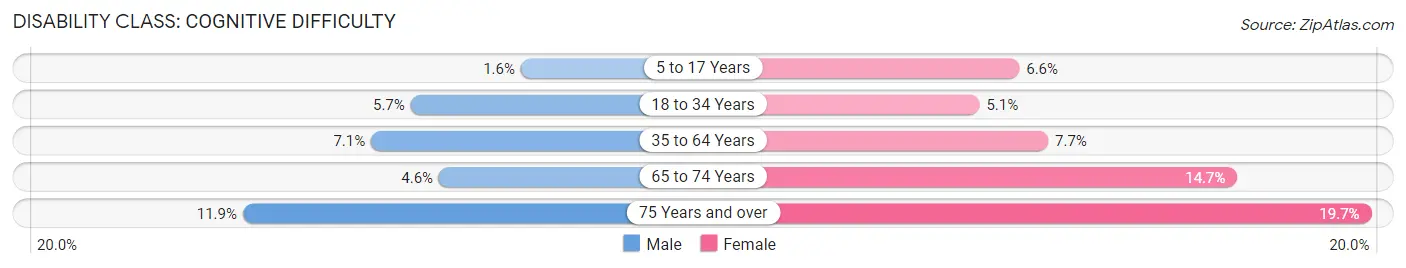
| Age Bracket | Male | Female |
| 5 to 17 Years | 6 (1.6%) | 18 (6.6%) |
| 18 to 34 Years | 14 (5.7%) | 16 (5.1%) |
| 35 to 64 Years | 27 (7.1%) | 41 (7.7%) |
| 65 to 74 Years | 3 (4.6%) | 16 (14.7%) |
| 75 Years and over | 5 (11.9%) | 23 (19.7%) |
Disability Class: Ambulatory Difficulty
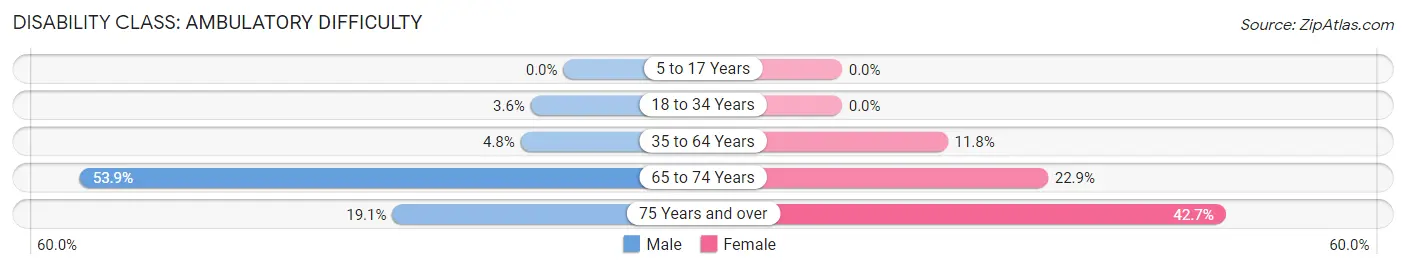
| Age Bracket | Male | Female |
| 5 to 17 Years | 0 (0.0%) | 0 (0.0%) |
| 18 to 34 Years | 9 (3.6%) | 0 (0.0%) |
| 35 to 64 Years | 18 (4.8%) | 63 (11.8%) |
| 65 to 74 Years | 35 (53.8%) | 25 (22.9%) |
| 75 Years and over | 8 (19.1%) | 50 (42.7%) |
Disability Class: Self-Care Difficulty
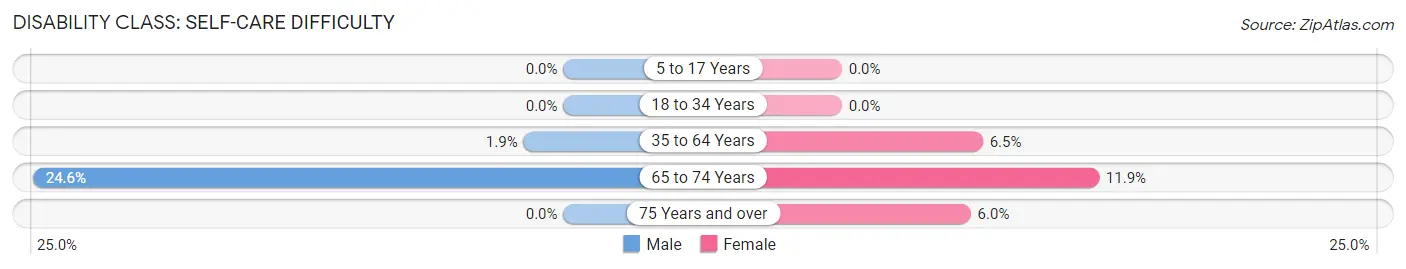
| Age Bracket | Male | Female |
| 5 to 17 Years | 0 (0.0%) | 0 (0.0%) |
| 18 to 34 Years | 0 (0.0%) | 0 (0.0%) |
| 35 to 64 Years | 7 (1.8%) | 35 (6.5%) |
| 65 to 74 Years | 16 (24.6%) | 13 (11.9%) |
| 75 Years and over | 0 (0.0%) | 7 (6.0%) |
Technology Access in Lathrop
Computing Device Access in Lathrop
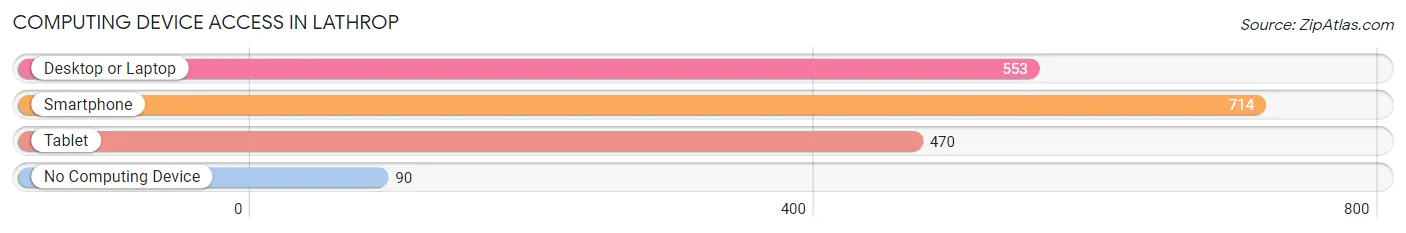
| Device Type | # Households | % Households |
| Desktop or Laptop | 553 | 66.1% |
| Smartphone | 714 | 85.3% |
| Tablet | 470 | 56.1% |
| No Computing Device | 90 | 10.7% |
| Total | 837 | 100.0% |
Internet Access in Lathrop
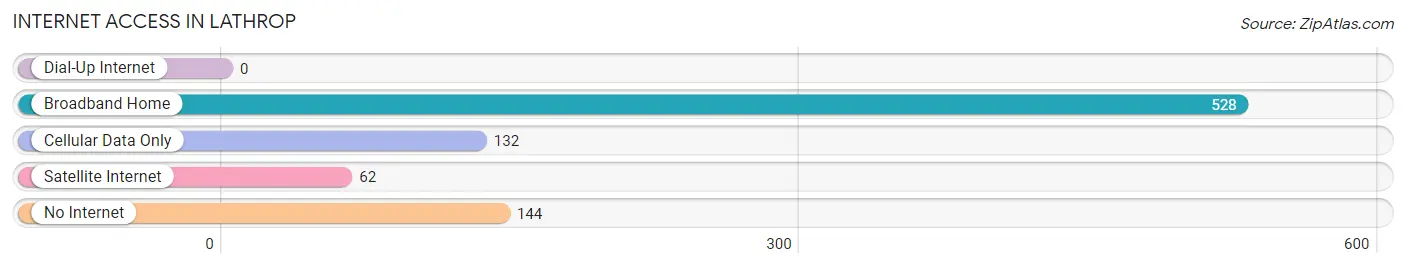
| Internet Type | # Households | % Households |
| Dial-Up Internet | 0 | 0.0% |
| Broadband Home | 528 | 63.1% |
| Cellular Data Only | 132 | 15.8% |
| Satellite Internet | 62 | 7.4% |
| No Internet | 144 | 17.2% |
| Total | 837 | 100.0% |
Lathrop Summary
Lathrop, Missouri is a small city located in Clinton County, Missouri. It is situated on the banks of the Missouri River, approximately 30 miles north of Kansas City. The city has a population of 1,845 people, according to the 2010 census.
History
Lathrop was founded in 1837 by William Lathrop, a settler from New York. He purchased the land from the government and began to develop the area. The town was originally called Lathropville, but the name was changed to Lathrop in 1845.
The city was incorporated in 1867 and was a thriving agricultural community. The town was home to several businesses, including a flour mill, a sawmill, a blacksmith shop, and a general store.
In the late 19th century, the railroad came to Lathrop, bringing with it new opportunities for growth. The city became a hub for the surrounding agricultural communities, and the population began to grow.
In the early 20th century, the city experienced a period of decline. The Great Depression hit the area hard, and many businesses closed. The population decreased, and the city struggled to survive.
In the 1950s, the city began to experience a resurgence. The economy began to improve, and the population began to grow. The city was revitalized, and new businesses opened.
Geography
Lathrop is located in the northwest corner of Clinton County, Missouri. It is situated on the banks of the Missouri River, approximately 30 miles north of Kansas City. The city has a total area of 1.2 square miles, all of which is land.
The city is located in the Missouri River Valley, and the terrain is mostly flat. The climate is humid continental, with hot summers and cold winters.
Economy
The economy of Lathrop is largely based on agriculture. The city is home to several farms, and the surrounding area is known for its production of corn, soybeans, and wheat.
The city is also home to several small businesses, including restaurants, retail stores, and service providers. The city is also home to a few manufacturing companies, including a plastics factory and a metal fabrication plant.
Demographics
According to the 2010 census, the population of Lathrop was 1,845 people. The racial makeup of the city was 95.3% White, 0.7% African American, 0.3% Native American, 0.2% Asian, 0.1% Pacific Islander, 1.2% from other races, and 2.4% from two or more races. Hispanic or Latino of any race were 3.2% of the population.
The median household income in Lathrop was $41,250, and the median family income was $48,750. The per capita income was $19,945. About 11.2% of families and 14.2% of the population were below the poverty line, including 19.2% of those under age 18 and 8.3% of those age 65 or over.
Lathrop is a small city with a rich history and a bright future. The city is home to a diverse population and a thriving economy. The city is a great place to live, work, and raise a family.
Common Questions
What is Per Capita Income in Lathrop?
Per Capita income in Lathrop is $25,427.
What is the Median Family Income in Lathrop?
Median Family Income in Lathrop is $88,150.
What is the Median Household income in Lathrop?
Median Household Income in Lathrop is $72,804.
What is Income or Wage Gap in Lathrop?
Income or Wage Gap in Lathrop is 29.5%.
Women in Lathrop earn 70.5 cents for every dollar earned by a man.
What is Inequality or Gini Index in Lathrop?
Inequality or Gini Index in Lathrop is 0.35.
What is the Total Population of Lathrop?
Total Population of Lathrop is 2,546.
What is the Total Male Population of Lathrop?
Total Male Population of Lathrop is 1,157.
What is the Total Female Population of Lathrop?
Total Female Population of Lathrop is 1,389.
What is the Ratio of Males per 100 Females in Lathrop?
There are 83.30 Males per 100 Females in Lathrop.
What is the Ratio of Females per 100 Males in Lathrop?
There are 120.05 Females per 100 Males in Lathrop.
What is the Median Population Age in Lathrop?
Median Population Age in Lathrop is 34.3 Years.
What is the Average Family Size in Lathrop
Average Family Size in Lathrop is 3.5 People.
What is the Average Household Size in Lathrop
Average Household Size in Lathrop is 3.0 People.
How Large is the Labor Force in Lathrop?
There are 1,250 People in the Labor Forcein in Lathrop.
What is the Percentage of People in the Labor Force in Lathrop?
63.3% of People are in the Labor Force in Lathrop.
What is the Unemployment Rate in Lathrop?
Unemployment Rate in Lathrop is 6.0%.