Weatherby Lake, MO Map & Demographics
Weatherby Lake Map
Weatherby Lake Overview
$72,467
PER CAPITA INCOME
$175,750
AVG FAMILY INCOME
$164,444
AVG HOUSEHOLD INCOME
47.6%
WAGE / INCOME GAP [ % ]
52.4¢/ $1
WAGE / INCOME GAP [ $ ]
$9,289
FAMILY INCOME DEFICIT
0.40
INEQUALITY / GINI INDEX
2,422
TOTAL POPULATION
1,176
MALE POPULATION
1,246
FEMALE POPULATION
94.38
MALES / 100 FEMALES
105.95
FEMALES / 100 MALES
49.3
MEDIAN AGE
2.9
AVG FAMILY SIZE
2.6
AVG HOUSEHOLD SIZE
1,229
LABOR FORCE [ PEOPLE ]
63.4%
PERCENT IN LABOR FORCE
1.9%
UNEMPLOYMENT RATE
Weatherby Lake Area Codes
Income in Weatherby Lake
Income Overview in Weatherby Lake
Per Capita Income in Weatherby Lake is $72,467, while median incomes of families and households are $175,750 and $164,444 respectively.
| Characteristic | Number | Measure |
| Per Capita Income | 2,422 | $72,467 |
| Median Family Income | 759 | $175,750 |
| Mean Family Income | 759 | $204,382 |
| Median Household Income | 940 | $164,444 |
| Mean Household Income | 940 | $188,428 |
| Income Deficit | 759 | $9,289 |
| Wage / Income Gap (%) | 2,422 | 47.61% |
| Wage / Income Gap ($) | 2,422 | 52.39¢ per $1 |
| Gini / Inequality Index | 2,422 | 0.40 |
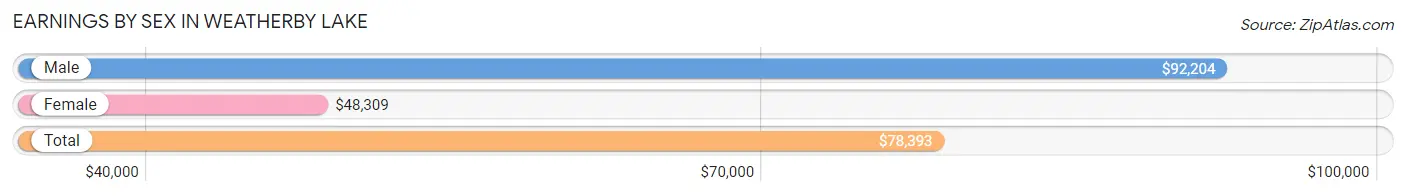
Earnings by Sex in Weatherby Lake
Average Earnings in Weatherby Lake are $78,393, $92,204 for men and $48,309 for women, a difference of 47.6%.
| Sex | Number | Average Earnings |
| Male | 709 (54.2%) | $92,204 |
| Female | 599 (45.8%) | $48,309 |
| Total | 1,308 (100.0%) | $78,393 |
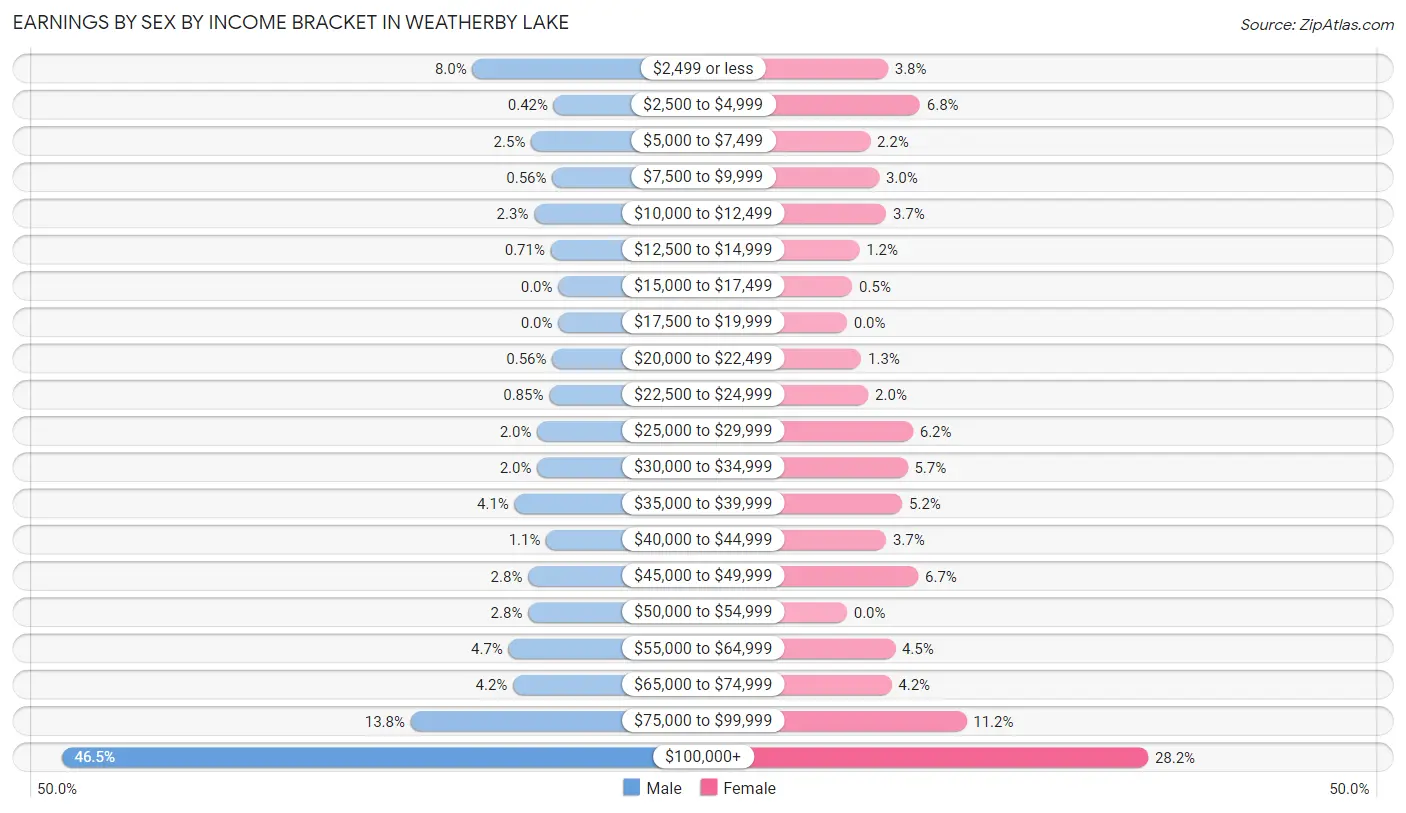
Earnings by Sex by Income Bracket in Weatherby Lake
The most common earnings brackets in Weatherby Lake are $100,000+ for men (330 | 46.5%) and $100,000+ for women (169 | 28.2%).
| Income | Male | Female |
| $2,499 or less | 57 (8.0%) | 23 (3.8%) |
| $2,500 to $4,999 | 3 (0.4%) | 41 (6.8%) |
| $5,000 to $7,499 | 18 (2.5%) | 13 (2.2%) |
| $7,500 to $9,999 | 4 (0.6%) | 18 (3.0%) |
| $10,000 to $12,499 | 16 (2.3%) | 22 (3.7%) |
| $12,500 to $14,999 | 5 (0.7%) | 7 (1.2%) |
| $15,000 to $17,499 | 0 (0.0%) | 3 (0.5%) |
| $17,500 to $19,999 | 0 (0.0%) | 0 (0.0%) |
| $20,000 to $22,499 | 4 (0.6%) | 8 (1.3%) |
| $22,500 to $24,999 | 6 (0.9%) | 12 (2.0%) |
| $25,000 to $29,999 | 14 (2.0%) | 37 (6.2%) |
| $30,000 to $34,999 | 14 (2.0%) | 34 (5.7%) |
| $35,000 to $39,999 | 29 (4.1%) | 31 (5.2%) |
| $40,000 to $44,999 | 8 (1.1%) | 22 (3.7%) |
| $45,000 to $49,999 | 20 (2.8%) | 40 (6.7%) |
| $50,000 to $54,999 | 20 (2.8%) | 0 (0.0%) |
| $55,000 to $64,999 | 33 (4.6%) | 27 (4.5%) |
| $65,000 to $74,999 | 30 (4.2%) | 25 (4.2%) |
| $75,000 to $99,999 | 98 (13.8%) | 67 (11.2%) |
| $100,000+ | 330 (46.5%) | 169 (28.2%) |
| Total | 709 (100.0%) | 599 (100.0%) |
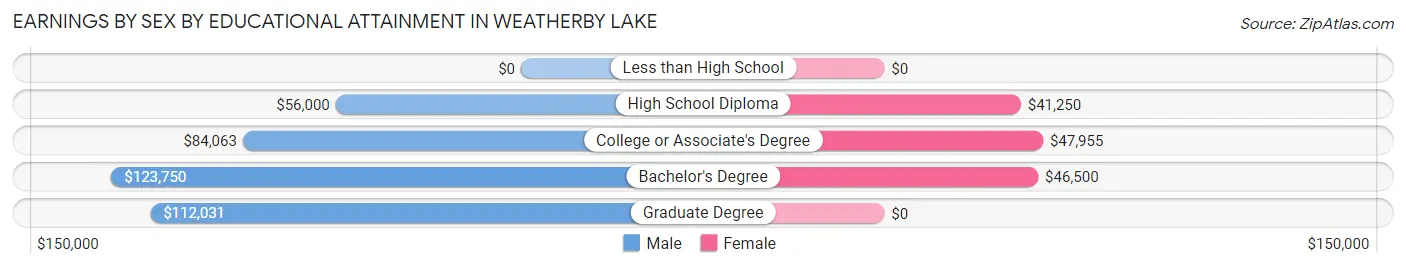
Earnings by Sex by Educational Attainment in Weatherby Lake
Average earnings in Weatherby Lake are $105,000 for men and $62,969 for women, a difference of 40.0%. Men with an educational attainment of bachelor's degree enjoy the highest average annual earnings of $123,750, while those with high school diploma education earn the least with $56,000. Women with an educational attainment of college or associate's degree earn the most with the average annual earnings of $47,955, while those with high school diploma education have the smallest earnings of $41,250.
| Educational Attainment | Male Income | Female Income |
| Less than High School | - | - |
| High School Diploma | $56,000 | $41,250 |
| College or Associate's Degree | $84,063 | $47,955 |
| Bachelor's Degree | $123,750 | $46,500 |
| Graduate Degree | $112,031 | $0 |
| Total | $105,000 | $62,969 |
Family Income in Weatherby Lake
Family Income Brackets in Weatherby Lake
According to the Weatherby Lake family income data, there are 305 families falling into the $200,000+ income range, which is the most common income bracket and makes up 40.2% of all families.
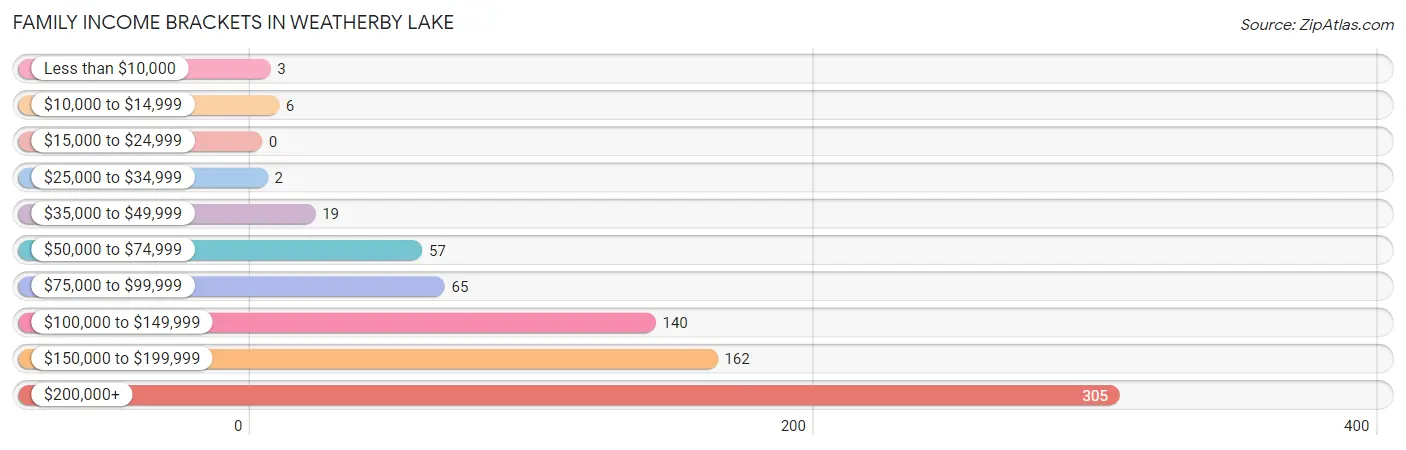
| Income Bracket | # Families | % Families |
| Less than $10,000 | 3 | 0.4% |
| $10,000 to $14,999 | 6 | 0.8% |
| $15,000 to $24,999 | 0 | 0.0% |
| $25,000 to $34,999 | 2 | 0.3% |
| $35,000 to $49,999 | 19 | 2.5% |
| $50,000 to $74,999 | 57 | 7.5% |
| $75,000 to $99,999 | 65 | 8.6% |
| $100,000 to $149,999 | 140 | 18.4% |
| $150,000 to $199,999 | 162 | 21.3% |
| $200,000+ | 305 | 40.2% |
Family Income by Famaliy Size in Weatherby Lake
5-person families (74 | 9.8%) account for the highest median family income in Weatherby Lake with $250,001 per family, while 2-person families (405 | 53.4%) have the highest median income of $76,771 per family member.
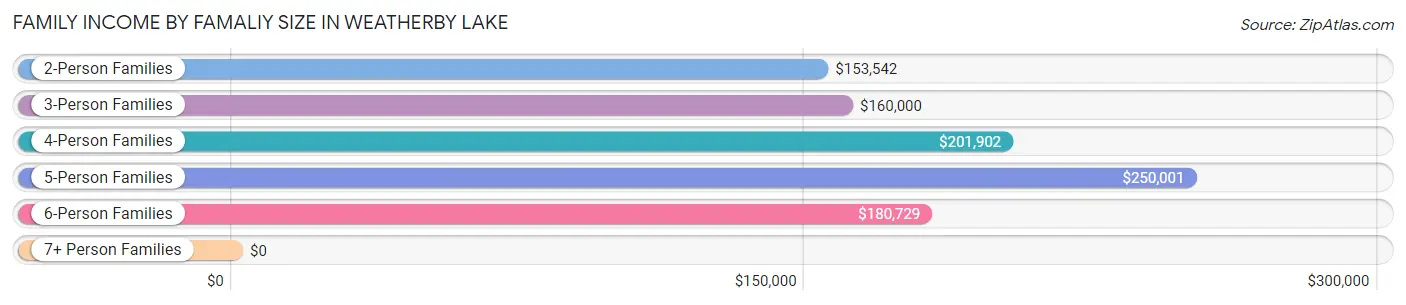
| Income Bracket | # Families | Median Income |
| 2-Person Families | 405 (53.4%) | $153,542 |
| 3-Person Families | 110 (14.5%) | $160,000 |
| 4-Person Families | 141 (18.6%) | $201,902 |
| 5-Person Families | 74 (9.8%) | $250,001 |
| 6-Person Families | 17 (2.2%) | $180,729 |
| 7+ Person Families | 12 (1.6%) | $0 |
| Total | 759 (100.0%) | $175,750 |
Family Income by Number of Earners in Weatherby Lake
The median family income in Weatherby Lake is $175,750, with families comprising 3+ earners (116) having the highest median family income of $250,001, while families with no earners (122) have the lowest median family income of $91,250, accounting for 15.3% and 16.1% of families, respectively.
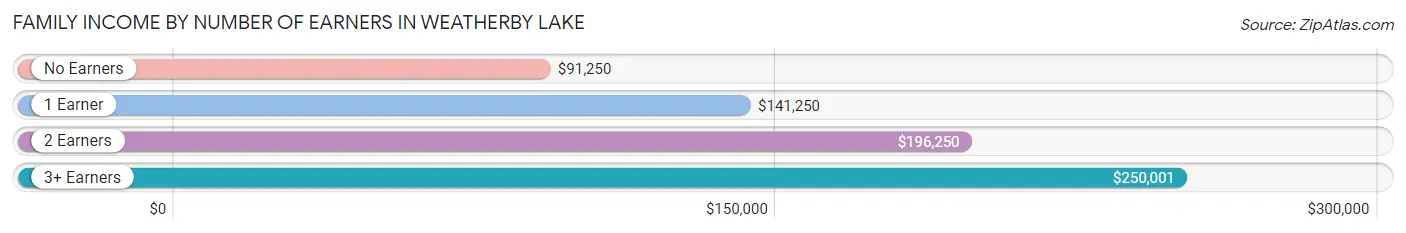
| Number of Earners | # Families | Median Income |
| No Earners | 122 (16.1%) | $91,250 |
| 1 Earner | 200 (26.4%) | $141,250 |
| 2 Earners | 321 (42.3%) | $196,250 |
| 3+ Earners | 116 (15.3%) | $250,001 |
| Total | 759 (100.0%) | $175,750 |
Household Income in Weatherby Lake
Household Income Brackets in Weatherby Lake
With 343 households falling in the category, the $200,000+ income range is the most frequent in Weatherby Lake, accounting for 36.5% of all households. In contrast, only 6 households (0.6%) fall into the $10,000 to $14,999 income bracket, making it the least populous group.
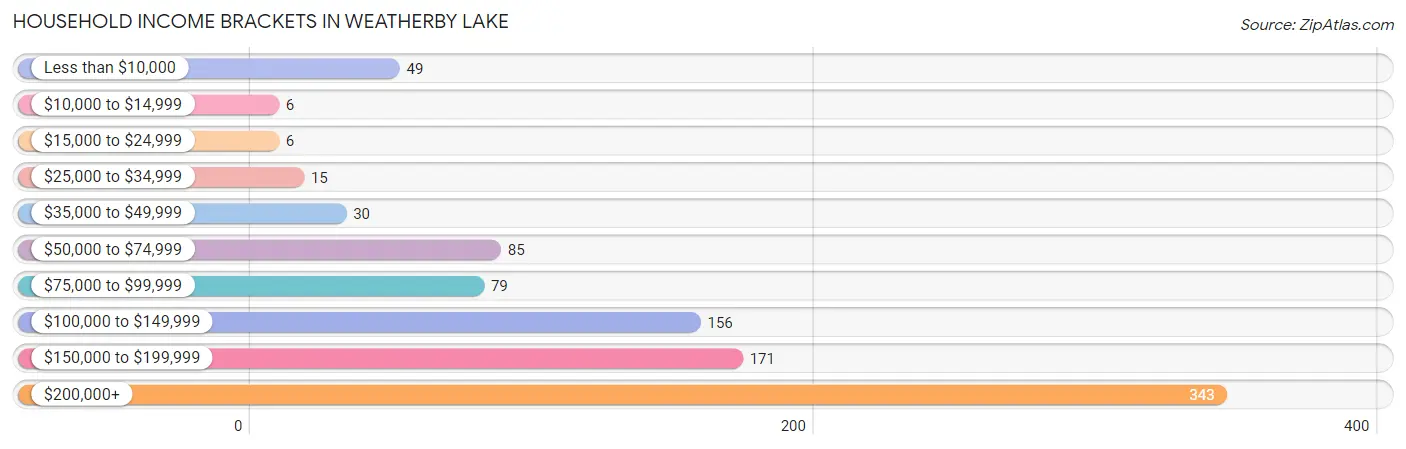
| Income Bracket | # Households | % Households |
| Less than $10,000 | 49 | 5.2% |
| $10,000 to $14,999 | 6 | 0.6% |
| $15,000 to $24,999 | 6 | 0.6% |
| $25,000 to $34,999 | 15 | 1.6% |
| $35,000 to $49,999 | 30 | 3.2% |
| $50,000 to $74,999 | 85 | 9.0% |
| $75,000 to $99,999 | 79 | 8.4% |
| $100,000 to $149,999 | 156 | 16.6% |
| $150,000 to $199,999 | 171 | 18.2% |
| $200,000+ | 343 | 36.5% |
Household Income by Householder Age in Weatherby Lake
The median household income in Weatherby Lake is $164,444, with the highest median household income of $219,583 found in the 45 to 64 years age bracket for the primary householder. A total of 401 households (42.7%) fall into this category.
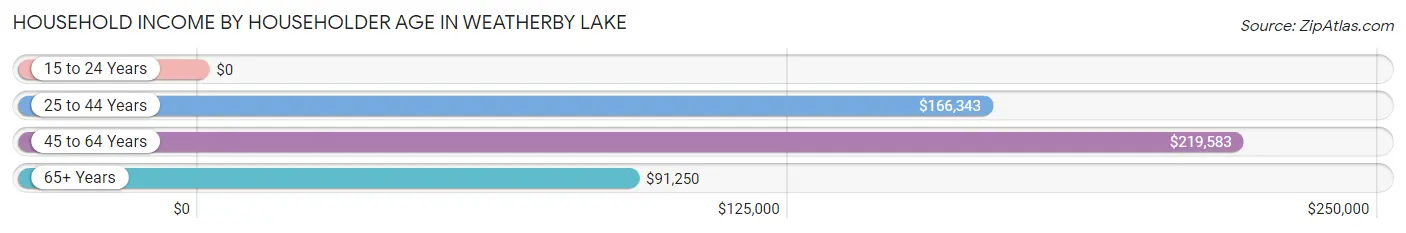
| Income Bracket | # Households | Median Income |
| 15 to 24 Years | 0 (0.0%) | $0 |
| 25 to 44 Years | 167 (17.8%) | $166,343 |
| 45 to 64 Years | 401 (42.7%) | $219,583 |
| 65+ Years | 372 (39.6%) | $91,250 |
| Total | 940 (100.0%) | $164,444 |
Poverty in Weatherby Lake
Income Below Poverty by Sex and Age in Weatherby Lake
With 1.6% poverty level for males and 5.3% for females among the residents of Weatherby Lake, 25 to 34 year old males and 75 year old and over females are the most vulnerable to poverty, with 2 males (4.9%) and 41 females (29.3%) in their respective age groups living below the poverty level.
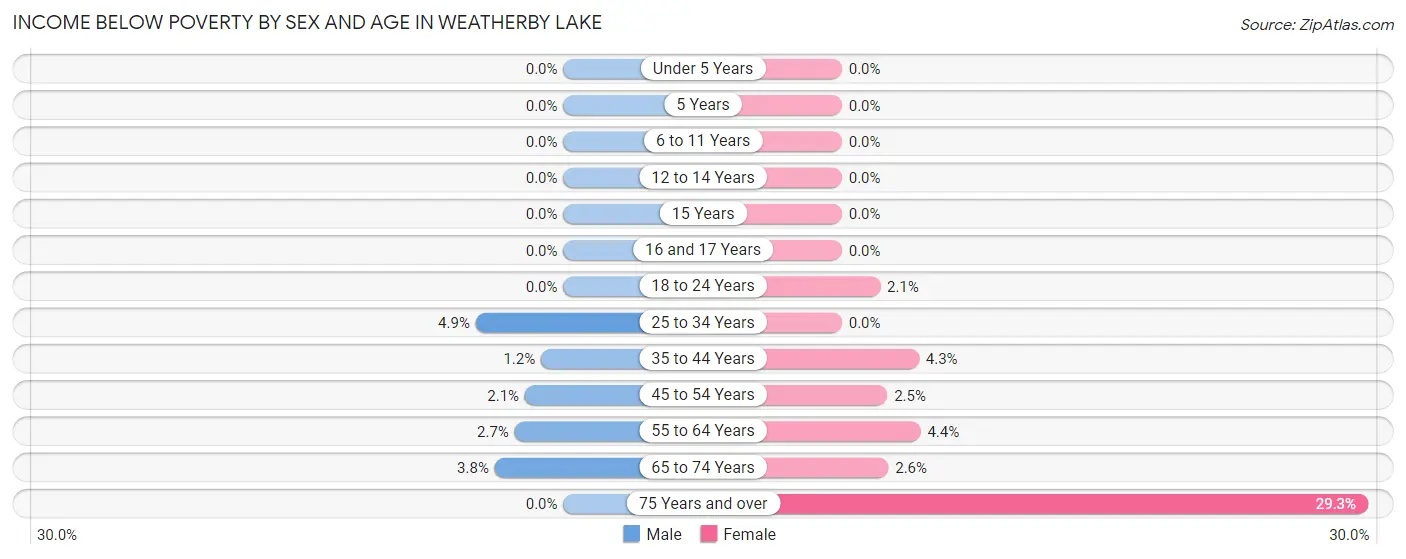
| Age Bracket | Male | Female |
| Under 5 Years | 0 (0.0%) | 0 (0.0%) |
| 5 Years | 0 (0.0%) | 0 (0.0%) |
| 6 to 11 Years | 0 (0.0%) | 0 (0.0%) |
| 12 to 14 Years | 0 (0.0%) | 0 (0.0%) |
| 15 Years | 0 (0.0%) | 0 (0.0%) |
| 16 and 17 Years | 0 (0.0%) | 0 (0.0%) |
| 18 to 24 Years | 0 (0.0%) | 1 (2.1%) |
| 25 to 34 Years | 2 (4.9%) | 0 (0.0%) |
| 35 to 44 Years | 2 (1.2%) | 6 (4.3%) |
| 45 to 54 Years | 3 (2.1%) | 5 (2.5%) |
| 55 to 64 Years | 6 (2.7%) | 7 (4.4%) |
| 65 to 74 Years | 6 (3.8%) | 6 (2.6%) |
| 75 Years and over | 0 (0.0%) | 41 (29.3%) |
| Total | 19 (1.6%) | 66 (5.3%) |
Income Above Poverty by Sex and Age in Weatherby Lake
According to the poverty statistics in Weatherby Lake, males aged under 5 years and females aged under 5 years are the age groups that are most secure financially, with 100.0% of males and 100.0% of females in these age groups living above the poverty line.
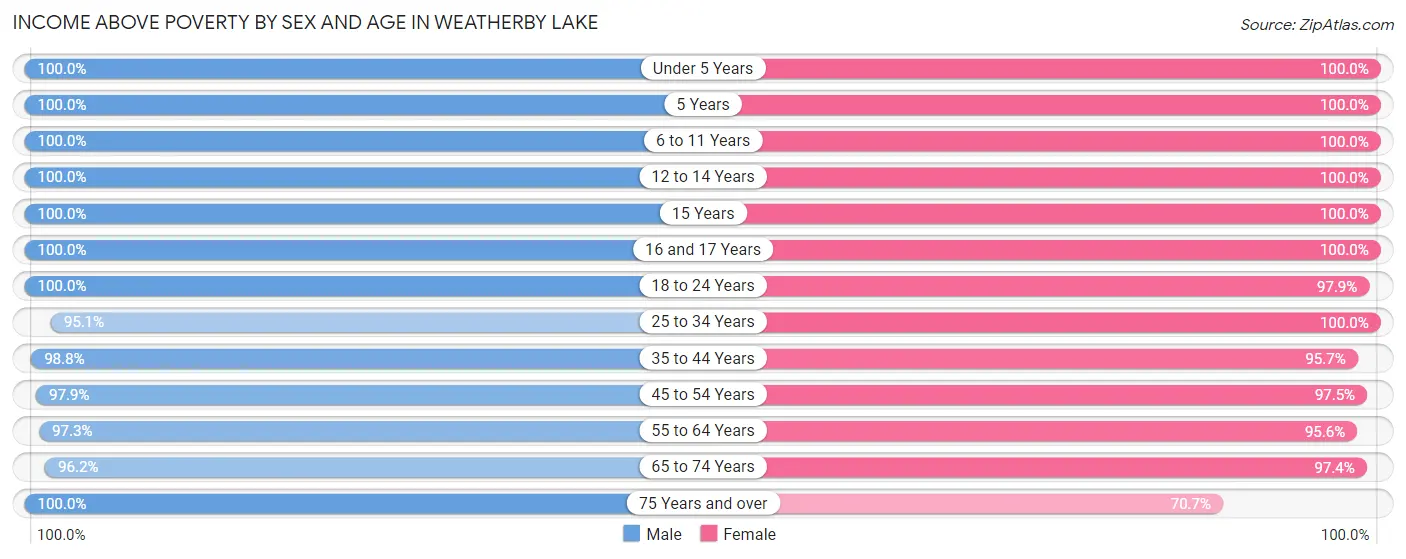
| Age Bracket | Male | Female |
| Under 5 Years | 31 (100.0%) | 23 (100.0%) |
| 5 Years | 14 (100.0%) | 5 (100.0%) |
| 6 to 11 Years | 118 (100.0%) | 116 (100.0%) |
| 12 to 14 Years | 68 (100.0%) | 43 (100.0%) |
| 15 Years | 20 (100.0%) | 37 (100.0%) |
| 16 and 17 Years | 66 (100.0%) | 42 (100.0%) |
| 18 to 24 Years | 29 (100.0%) | 46 (97.9%) |
| 25 to 34 Years | 39 (95.1%) | 59 (100.0%) |
| 35 to 44 Years | 159 (98.8%) | 134 (95.7%) |
| 45 to 54 Years | 137 (97.9%) | 193 (97.5%) |
| 55 to 64 Years | 215 (97.3%) | 153 (95.6%) |
| 65 to 74 Years | 151 (96.2%) | 226 (97.4%) |
| 75 Years and over | 106 (100.0%) | 99 (70.7%) |
| Total | 1,153 (98.4%) | 1,176 (94.7%) |
Income Below Poverty Among Married-Couple Families in Weatherby Lake
The poverty statistics for married-couple families in Weatherby Lake show that 1.3% or 9 of the total 708 families live below the poverty line. Families with no children have the highest poverty rate of 2.1%, comprising of 9 families. On the other hand, families with 1 or 2 children have the lowest poverty rate of 0.0%, which includes 0 families.
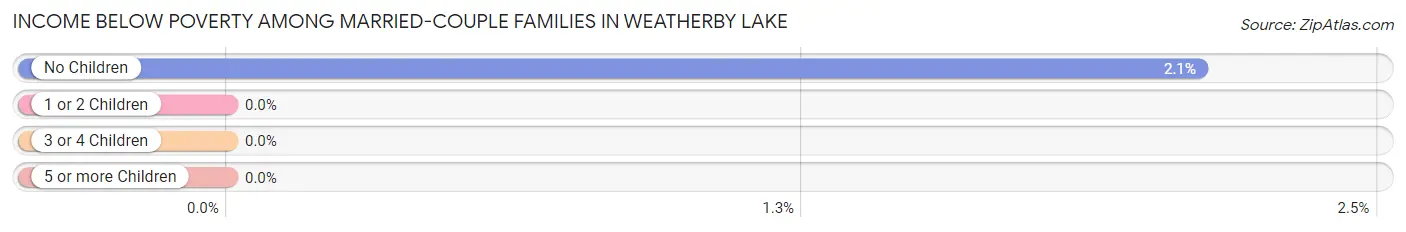
| Children | Above Poverty | Below Poverty |
| No Children | 418 (97.9%) | 9 (2.1%) |
| 1 or 2 Children | 205 (100.0%) | 0 (0.0%) |
| 3 or 4 Children | 64 (100.0%) | 0 (0.0%) |
| 5 or more Children | 12 (100.0%) | 0 (0.0%) |
| Total | 699 (98.7%) | 9 (1.3%) |
Income Below Poverty Among Single-Parent Households in Weatherby Lake
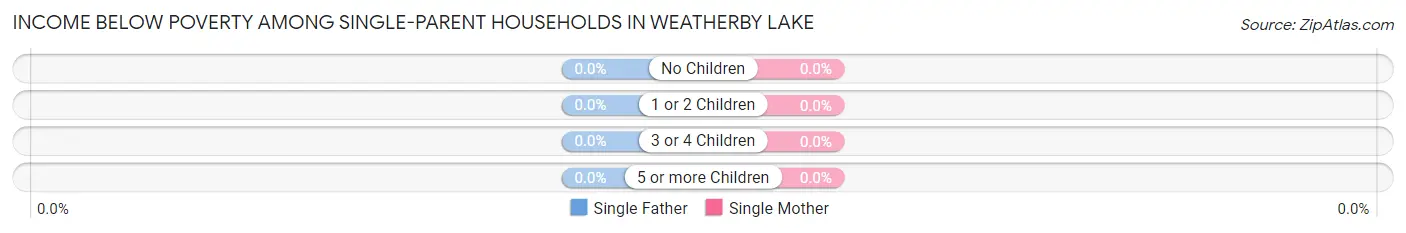
| Children | Single Father | Single Mother |
| No Children | 0 (0.0%) | 0 (0.0%) |
| 1 or 2 Children | 0 (0.0%) | 0 (0.0%) |
| 3 or 4 Children | 0 (0.0%) | 0 (0.0%) |
| 5 or more Children | 0 (0.0%) | 0 (0.0%) |
| Total | 0 (0.0%) | 0 (0.0%) |
Income Below Poverty Among Married-Couple vs Single-Parent Households in Weatherby Lake
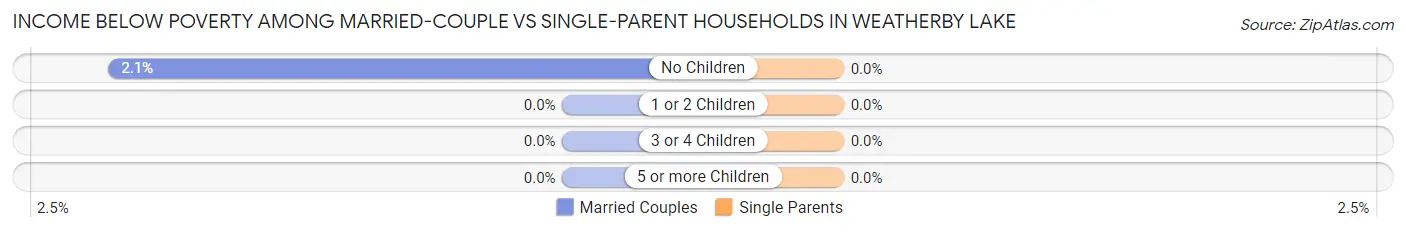
| Children | Married-Couple Families | Single-Parent Households |
| No Children | 9 (2.1%) | 0 (0.0%) |
| 1 or 2 Children | 0 (0.0%) | 0 (0.0%) |
| 3 or 4 Children | 0 (0.0%) | 0 (0.0%) |
| 5 or more Children | 0 (0.0%) | 0 (0.0%) |
| Total | 9 (1.3%) | 0 (0.0%) |
Race in Weatherby Lake
The most populous races in Weatherby Lake are White / Caucasian (2,183 | 90.1%), Two or more Races (115 | 4.8%), and Asian (76 | 3.1%).
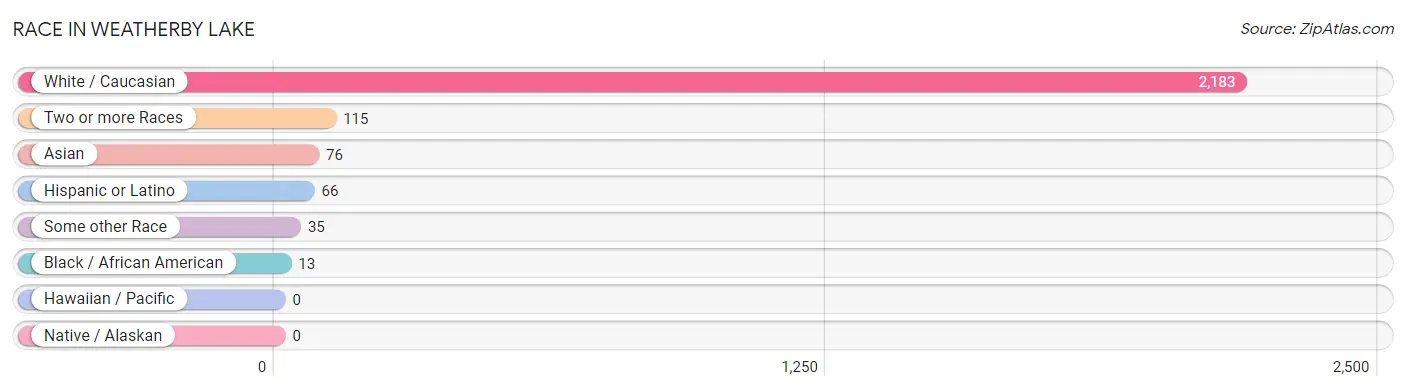
| Race | # Population | % Population |
| Asian | 76 | 3.1% |
| Black / African American | 13 | 0.5% |
| Hawaiian / Pacific | 0 | 0.0% |
| Hispanic or Latino | 66 | 2.7% |
| Native / Alaskan | 0 | 0.0% |
| White / Caucasian | 2,183 | 90.1% |
| Two or more Races | 115 | 4.8% |
| Some other Race | 35 | 1.5% |
| Total | 2,422 | 100.0% |
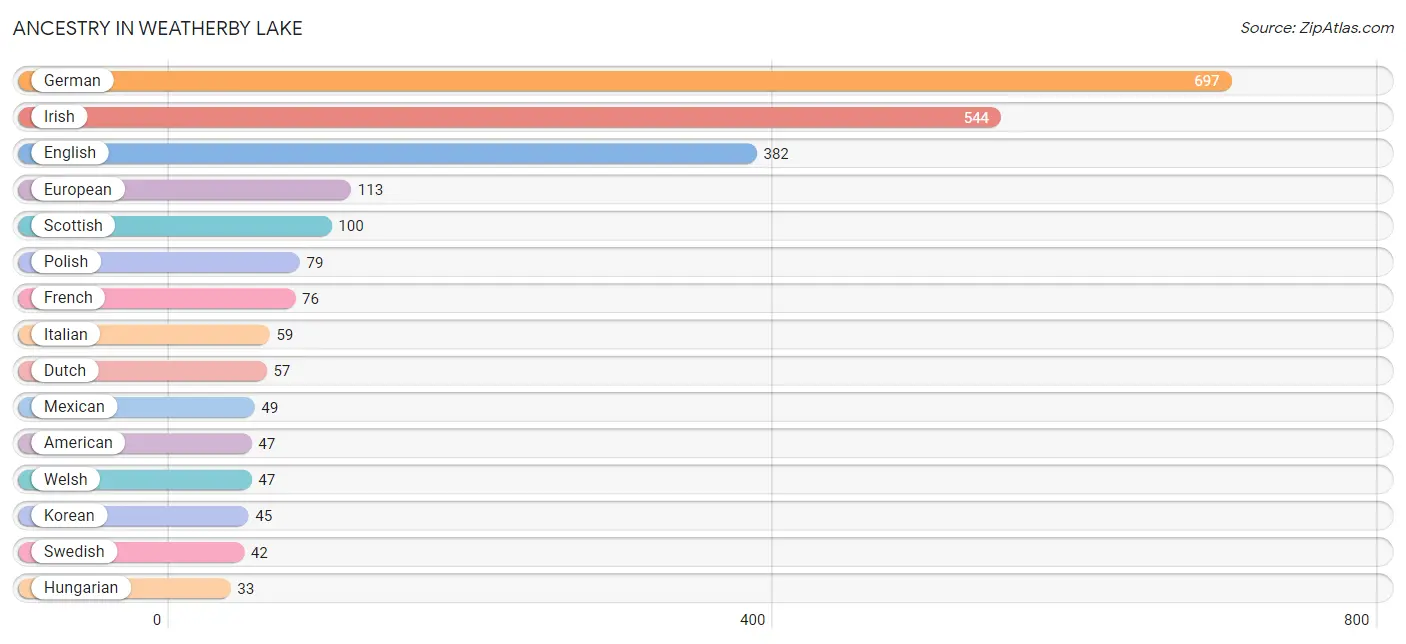
Ancestry in Weatherby Lake
The most populous ancestries reported in Weatherby Lake are German (697 | 28.8%), Irish (544 | 22.5%), English (382 | 15.8%), European (113 | 4.7%), and Scottish (100 | 4.1%), together accounting for 75.8% of all Weatherby Lake residents.
| Ancestry | # Population | % Population |
| American | 47 | 1.9% |
| Armenian | 3 | 0.1% |
| Belgian | 10 | 0.4% |
| Bhutanese | 8 | 0.3% |
| British | 28 | 1.2% |
| Burmese | 3 | 0.1% |
| Canadian | 3 | 0.1% |
| Central American Indian | 8 | 0.3% |
| Cherokee | 2 | 0.1% |
| Choctaw | 2 | 0.1% |
| Croatian | 6 | 0.3% |
| Czechoslovakian | 3 | 0.1% |
| Danish | 17 | 0.7% |
| Dutch | 57 | 2.4% |
| Eastern European | 5 | 0.2% |
| English | 382 | 15.8% |
| European | 113 | 4.7% |
| French | 76 | 3.1% |
| French Canadian | 19 | 0.8% |
| German | 697 | 28.8% |
| Greek | 6 | 0.3% |
| Guamanian / Chamorro | 6 | 0.3% |
| Hungarian | 33 | 1.4% |
| Indian (Asian) | 6 | 0.3% |
| Irish | 544 | 22.5% |
| Italian | 59 | 2.4% |
| Korean | 45 | 1.9% |
| Latvian | 3 | 0.1% |
| Mexican | 49 | 2.0% |
| Northern European | 14 | 0.6% |
| Norwegian | 26 | 1.1% |
| Polish | 79 | 3.3% |
| Puerto Rican | 11 | 0.4% |
| Scandinavian | 8 | 0.3% |
| Scotch-Irish | 31 | 1.3% |
| Scottish | 100 | 4.1% |
| Serbian | 6 | 0.3% |
| Slovene | 9 | 0.4% |
| South American | 6 | 0.3% |
| Sri Lankan | 14 | 0.6% |
| Subsaharan African | 2 | 0.1% |
| Swedish | 42 | 1.7% |
| Swiss | 3 | 0.1% |
| Thai | 27 | 1.1% |
| Venezuelan | 6 | 0.3% |
| Welsh | 47 | 1.9% |
| Yugoslavian | 10 | 0.4% | View All 47 Rows |
Immigrants in Weatherby Lake
The most numerous immigrant groups reported in Weatherby Lake came from Asia (66 | 2.7%), South Eastern Asia (41 | 1.7%), Philippines (35 | 1.5%), South Central Asia (25 | 1.0%), and India (22 | 0.9%), together accounting for 7.8% of all Weatherby Lake residents.
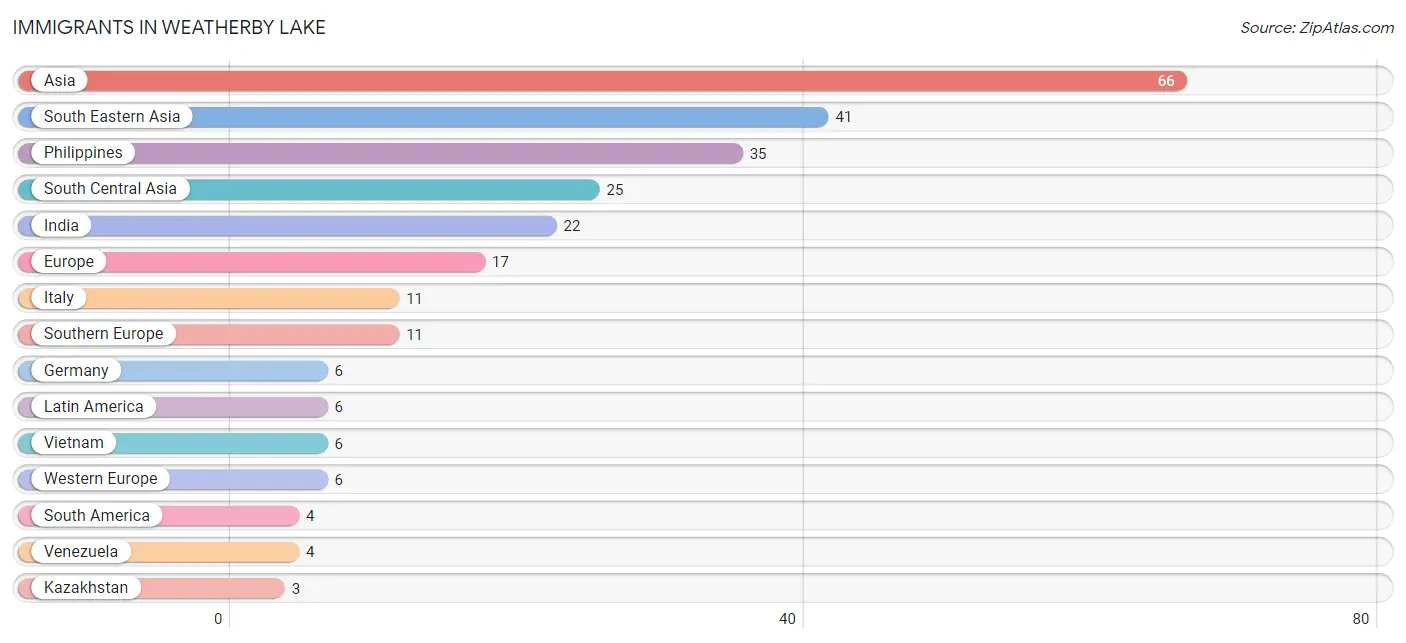
| Immigration Origin | # Population | % Population |
| Africa | 2 | 0.1% |
| Asia | 66 | 2.7% |
| Central America | 2 | 0.1% |
| Congo | 2 | 0.1% |
| Europe | 17 | 0.7% |
| Germany | 6 | 0.3% |
| India | 22 | 0.9% |
| Italy | 11 | 0.4% |
| Kazakhstan | 3 | 0.1% |
| Latin America | 6 | 0.3% |
| Mexico | 2 | 0.1% |
| Middle Africa | 2 | 0.1% |
| Philippines | 35 | 1.5% |
| South America | 4 | 0.2% |
| South Central Asia | 25 | 1.0% |
| South Eastern Asia | 41 | 1.7% |
| Southern Europe | 11 | 0.4% |
| Venezuela | 4 | 0.2% |
| Vietnam | 6 | 0.3% |
| Western Europe | 6 | 0.3% | View All 20 Rows |
Sex and Age in Weatherby Lake
Sex and Age in Weatherby Lake
The most populous age groups in Weatherby Lake are 55 to 59 Years (142 | 12.1%) for men and 65 to 69 Years (118 | 9.5%) for women.
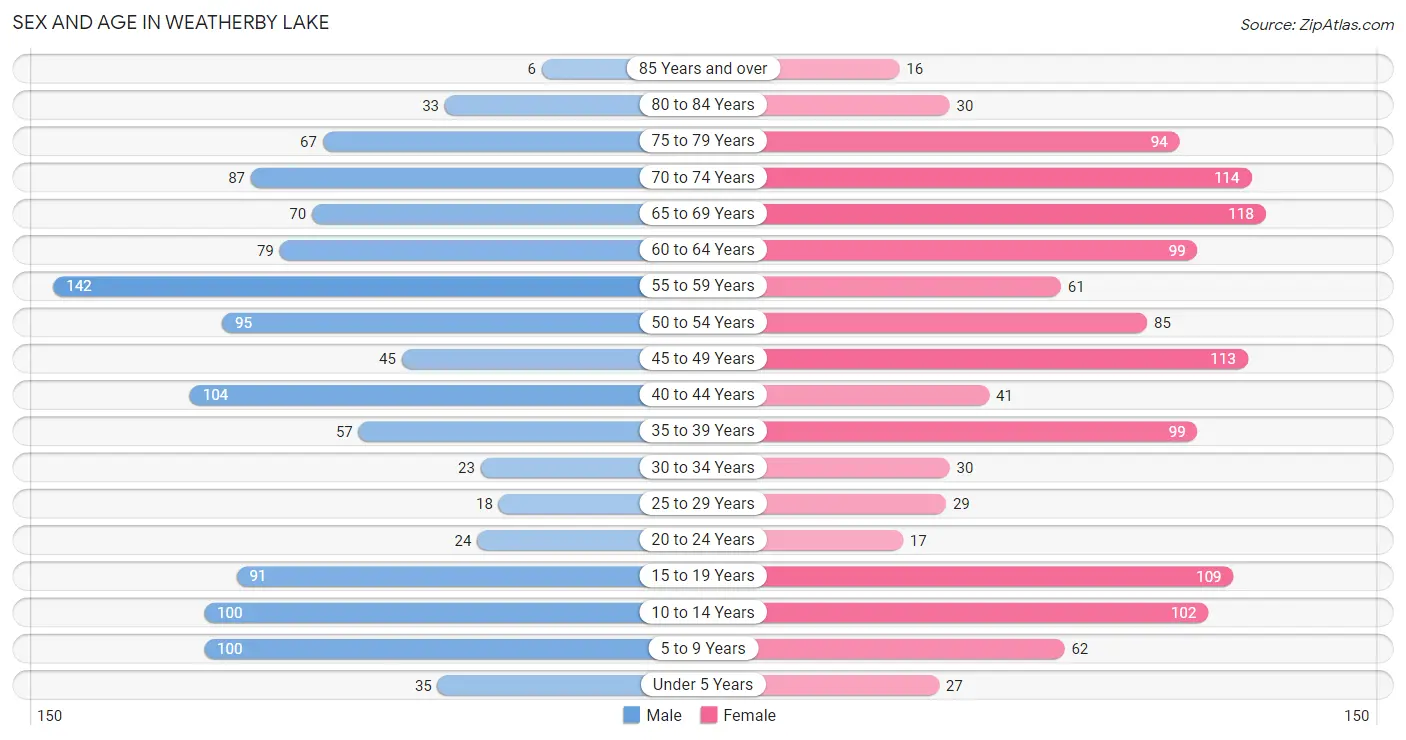
| Age Bracket | Male | Female |
| Under 5 Years | 35 (3.0%) | 27 (2.2%) |
| 5 to 9 Years | 100 (8.5%) | 62 (5.0%) |
| 10 to 14 Years | 100 (8.5%) | 102 (8.2%) |
| 15 to 19 Years | 91 (7.7%) | 109 (8.7%) |
| 20 to 24 Years | 24 (2.0%) | 17 (1.4%) |
| 25 to 29 Years | 18 (1.5%) | 29 (2.3%) |
| 30 to 34 Years | 23 (2.0%) | 30 (2.4%) |
| 35 to 39 Years | 57 (4.9%) | 99 (8.0%) |
| 40 to 44 Years | 104 (8.8%) | 41 (3.3%) |
| 45 to 49 Years | 45 (3.8%) | 113 (9.1%) |
| 50 to 54 Years | 95 (8.1%) | 85 (6.8%) |
| 55 to 59 Years | 142 (12.1%) | 61 (4.9%) |
| 60 to 64 Years | 79 (6.7%) | 99 (8.0%) |
| 65 to 69 Years | 70 (5.9%) | 118 (9.5%) |
| 70 to 74 Years | 87 (7.4%) | 114 (9.1%) |
| 75 to 79 Years | 67 (5.7%) | 94 (7.5%) |
| 80 to 84 Years | 33 (2.8%) | 30 (2.4%) |
| 85 Years and over | 6 (0.5%) | 16 (1.3%) |
| Total | 1,176 (100.0%) | 1,246 (100.0%) |
Families and Households in Weatherby Lake
Median Family Size in Weatherby Lake
The median family size in Weatherby Lake is 2.90 persons per family, with married-couple families (708 | 93.3%) accounting for the largest median family size of 2.93 persons per family. On the other hand, single male/father families (21 | 2.8%) represent the smallest median family size with 2.43 persons per family.
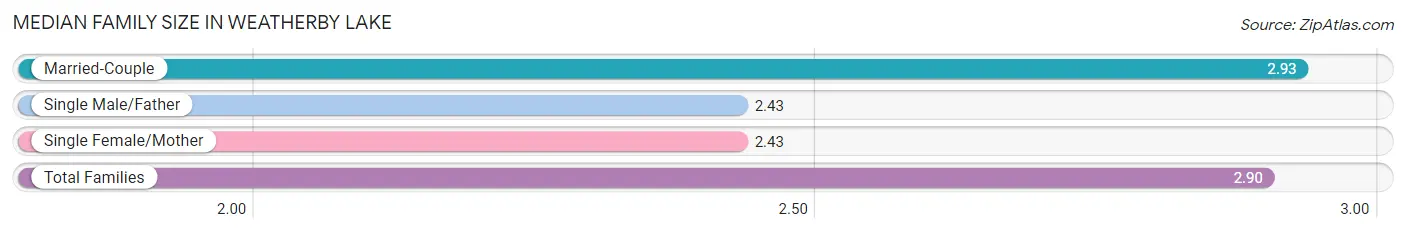
| Family Type | # Families | Family Size |
| Married-Couple | 708 (93.3%) | 2.93 |
| Single Male/Father | 21 (2.8%) | 2.43 |
| Single Female/Mother | 30 (4.0%) | 2.43 |
| Total Families | 759 (100.0%) | 2.90 |
Median Household Size in Weatherby Lake
The median household size in Weatherby Lake is 2.57 persons per household, with married-couple households (708 | 75.3%) accounting for the largest median household size of 2.95 persons per household. non-family households (181 | 19.3%) represent the smallest median household size with 1.08 persons per household.
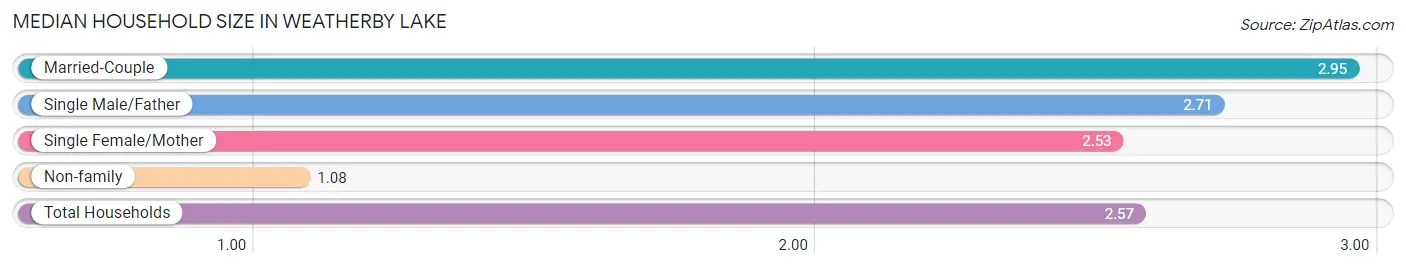
| Household Type | # Households | Household Size |
| Married-Couple | 708 (75.3%) | 2.95 |
| Single Male/Father | 21 (2.2%) | 2.71 |
| Single Female/Mother | 30 (3.2%) | 2.53 |
| Non-family | 181 (19.3%) | 1.08 |
| Total Households | 940 (100.0%) | 2.57 |
Household Size by Marriage Status in Weatherby Lake
Out of a total of 940 households in Weatherby Lake, 759 (80.7%) are family households, while 181 (19.3%) are nonfamily households. The most numerous type of family households are 2-person households, comprising 397, and the most common type of nonfamily households are 1-person households, comprising 167.
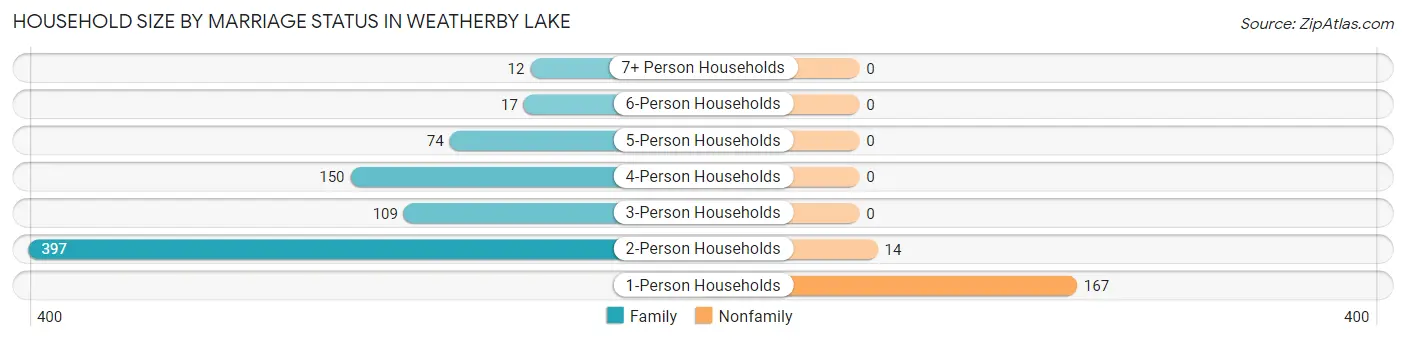
| Household Size | Family Households | Nonfamily Households |
| 1-Person Households | - | 167 (17.8%) |
| 2-Person Households | 397 (42.2%) | 14 (1.5%) |
| 3-Person Households | 109 (11.6%) | 0 (0.0%) |
| 4-Person Households | 150 (16.0%) | 0 (0.0%) |
| 5-Person Households | 74 (7.9%) | 0 (0.0%) |
| 6-Person Households | 17 (1.8%) | 0 (0.0%) |
| 7+ Person Households | 12 (1.3%) | 0 (0.0%) |
| Total | 759 (80.7%) | 181 (19.3%) |
Female Fertility in Weatherby Lake
Fertility by Age in Weatherby Lake
| Age Bracket | Women with Births | Births / 1,000 Women |
| 15 to 19 years | 0 (0.0%) | 0.0 |
| 20 to 34 years | 0 (0.0%) | 0.0 |
| 35 to 50 years | 0 (0.0%) | 0.0 |
| Total | 0 (0.0%) | 0.0 |
Fertility by Age by Marriage Status in Weatherby Lake
| Age Bracket | Married | Unmarried |
| 15 to 19 years | 0 (0.0%) | 0 (0.0%) |
| 20 to 34 years | 0 (0.0%) | 0 (0.0%) |
| 35 to 50 years | 0 (0.0%) | 0 (0.0%) |
| Total | 0 (0.0%) | 0 (0.0%) |
Fertility by Education in Weatherby Lake
| Educational Attainment | Women with Births | Births / 1,000 Women |
| Less than High School | 0 (0.0%) | 0.0 |
| High School Diploma | 0 (0.0%) | 0.0 |
| College or Associate's Degree | 0 (0.0%) | 0.0 |
| Bachelor's Degree | 0 (0.0%) | 0.0 |
| Graduate Degree | 0 (0.0%) | 0.0 |
| Total | 0 (0.0%) | 0.0 |
Fertility by Education by Marriage Status in Weatherby Lake
| Educational Attainment | Married | Unmarried |
| Less than High School | 0 (0.0%) | 0 (0.0%) |
| High School Diploma | 0 (0.0%) | 0 (0.0%) |
| College or Associate's Degree | 0 (0.0%) | 0 (0.0%) |
| Bachelor's Degree | 0 (0.0%) | 0 (0.0%) |
| Graduate Degree | 0 (0.0%) | 0 (0.0%) |
| Total | 0 (0.0%) | 0 (0.0%) |
Employment Characteristics in Weatherby Lake
Employment by Class of Employer in Weatherby Lake
Among the 1,192 employed individuals in Weatherby Lake, private company employees (733 | 61.5%), self-employed (incorporated) (143 | 12.0%), and not-for-profit organizations (108 | 9.1%) make up the most common classes of employment.
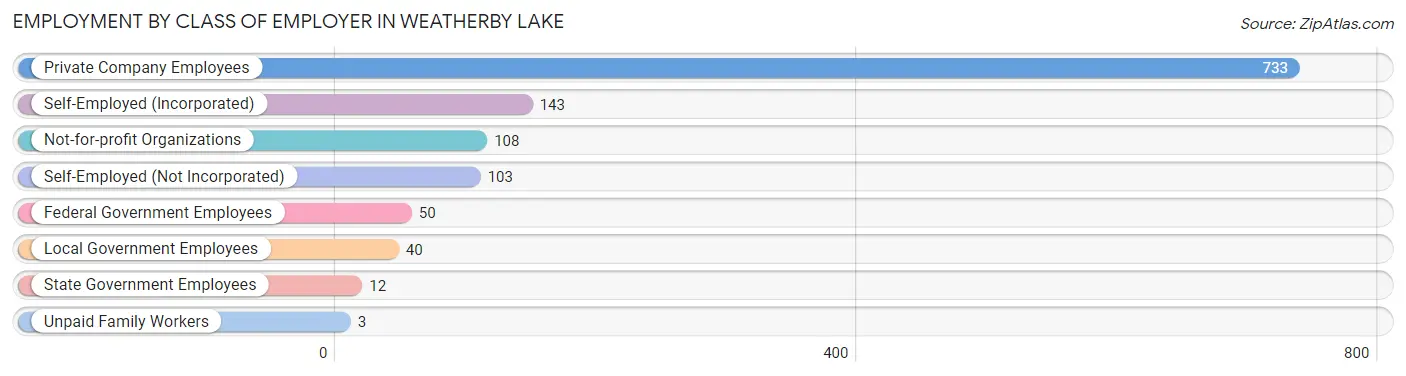
| Employer Class | # Employees | % Employees |
| Private Company Employees | 733 | 61.5% |
| Self-Employed (Incorporated) | 143 | 12.0% |
| Self-Employed (Not Incorporated) | 103 | 8.6% |
| Not-for-profit Organizations | 108 | 9.1% |
| Local Government Employees | 40 | 3.4% |
| State Government Employees | 12 | 1.0% |
| Federal Government Employees | 50 | 4.2% |
| Unpaid Family Workers | 3 | 0.3% |
| Total | 1,192 | 100.0% |
Employment Status by Age in Weatherby Lake
According to the labor force statistics for Weatherby Lake, out of the total population over 16 years of age (1,939), 63.4% or 1,229 individuals are in the labor force, with 1.9% or 23 of them unemployed. The age group with the highest labor force participation rate is 35 to 44 years, with 94.7% or 285 individuals in the labor force. Within the labor force, the 25 to 29 years age range has the highest percentage of unemployed individuals, with 12.0% or 3 of them being unemployed.
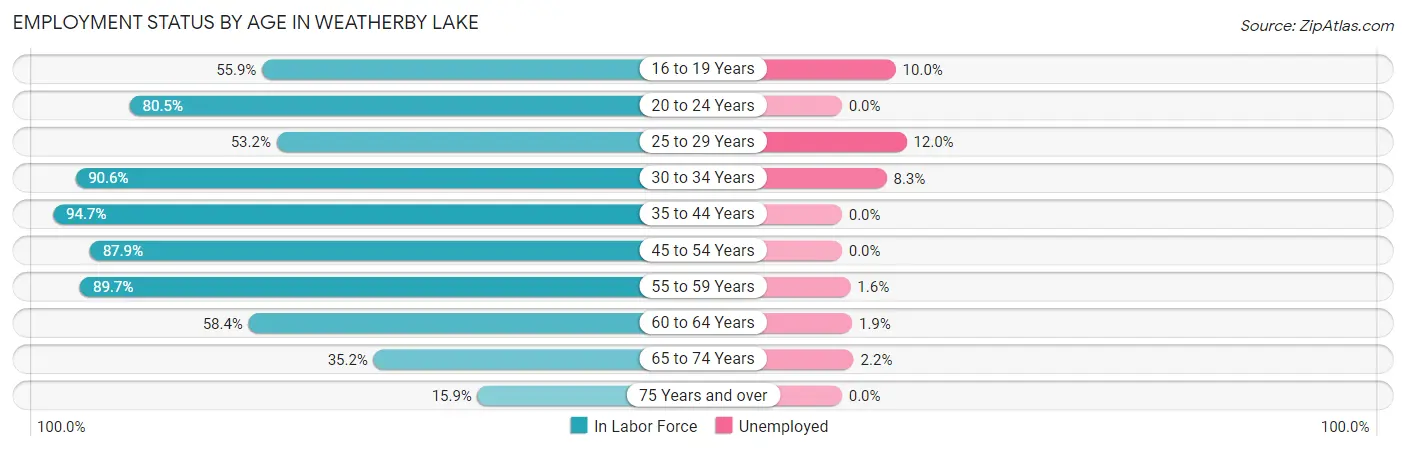
| Age Bracket | In Labor Force | Unemployed |
| 16 to 19 Years | 80 (55.9%) | 8 (10.0%) |
| 20 to 24 Years | 33 (80.5%) | 0 (0.0%) |
| 25 to 29 Years | 25 (53.2%) | 3 (12.0%) |
| 30 to 34 Years | 48 (90.6%) | 4 (8.3%) |
| 35 to 44 Years | 285 (94.7%) | 0 (0.0%) |
| 45 to 54 Years | 297 (87.9%) | 0 (0.0%) |
| 55 to 59 Years | 182 (89.7%) | 3 (1.6%) |
| 60 to 64 Years | 104 (58.4%) | 2 (1.9%) |
| 65 to 74 Years | 137 (35.2%) | 3 (2.2%) |
| 75 Years and over | 39 (15.9%) | 0 (0.0%) |
| Total | 1,229 (63.4%) | 23 (1.9%) |
Employment Status by Educational Attainment in Weatherby Lake
According to labor force statistics for Weatherby Lake, 84.0% of individuals (941) out of the total population between 25 and 64 years of age (1,120) are in the labor force, with 1.3% or 12 of them being unemployed. The group with the highest labor force participation rate are those with the educational attainment of bachelor's degree or higher, with 87.3% or 646 individuals in the labor force. Within the labor force, individuals with bachelor's degree or higher education have the highest percentage of unemployment, with 1.9% or 12 of them being unemployed.
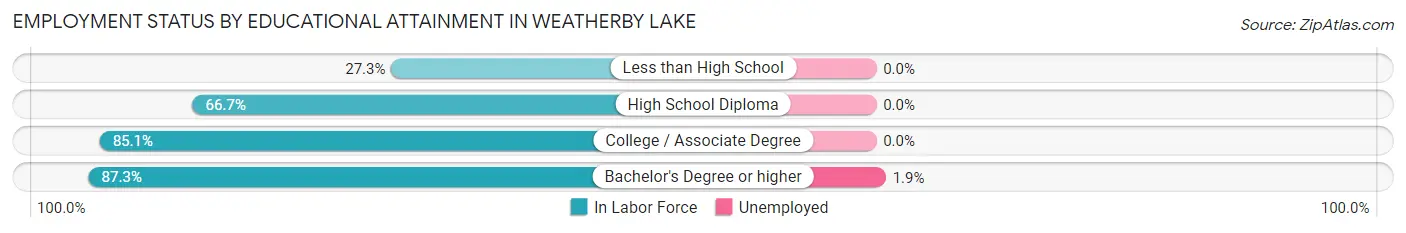
| Educational Attainment | In Labor Force | Unemployed |
| Less than High School | 3 (27.3%) | 0 (0.0%) |
| High School Diploma | 80 (66.7%) | 0 (0.0%) |
| College / Associate Degree | 212 (85.1%) | 0 (0.0%) |
| Bachelor's Degree or higher | 646 (87.3%) | 14 (1.9%) |
| Total | 941 (84.0%) | 15 (1.3%) |
Employment Occupations by Sex in Weatherby Lake
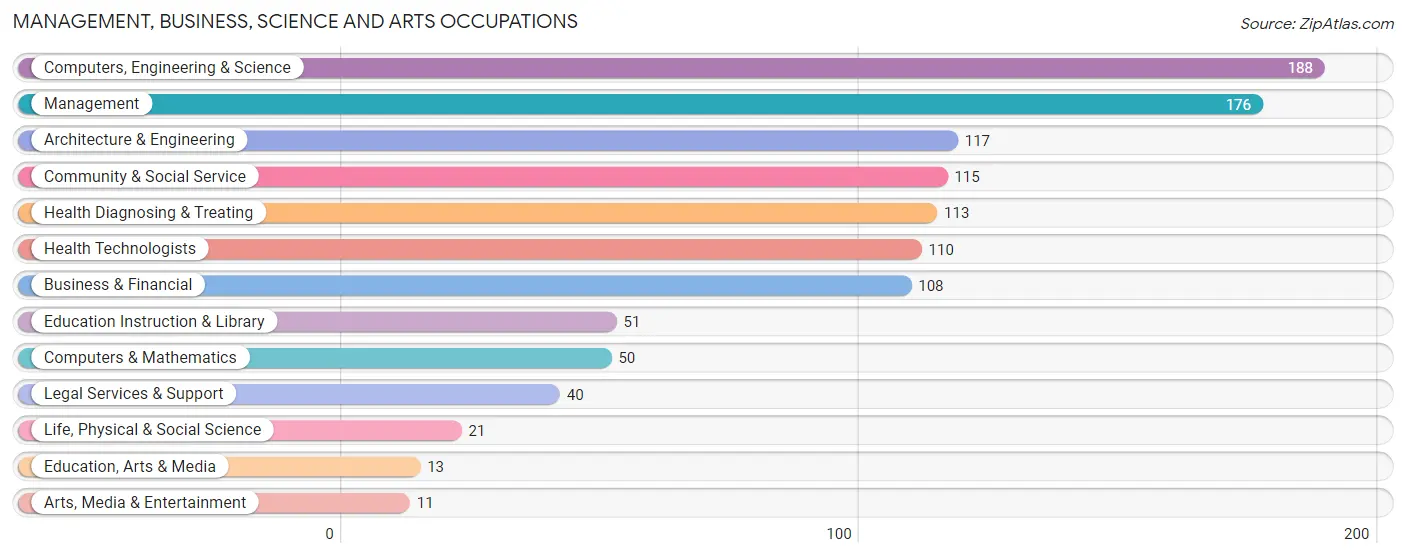
Management, Business, Science and Arts Occupations
The most common Management, Business, Science and Arts occupations in Weatherby Lake are Computers, Engineering & Science (188 | 15.6%), Management (176 | 14.6%), Architecture & Engineering (117 | 9.7%), Community & Social Service (115 | 9.5%), and Health Diagnosing & Treating (113 | 9.4%).
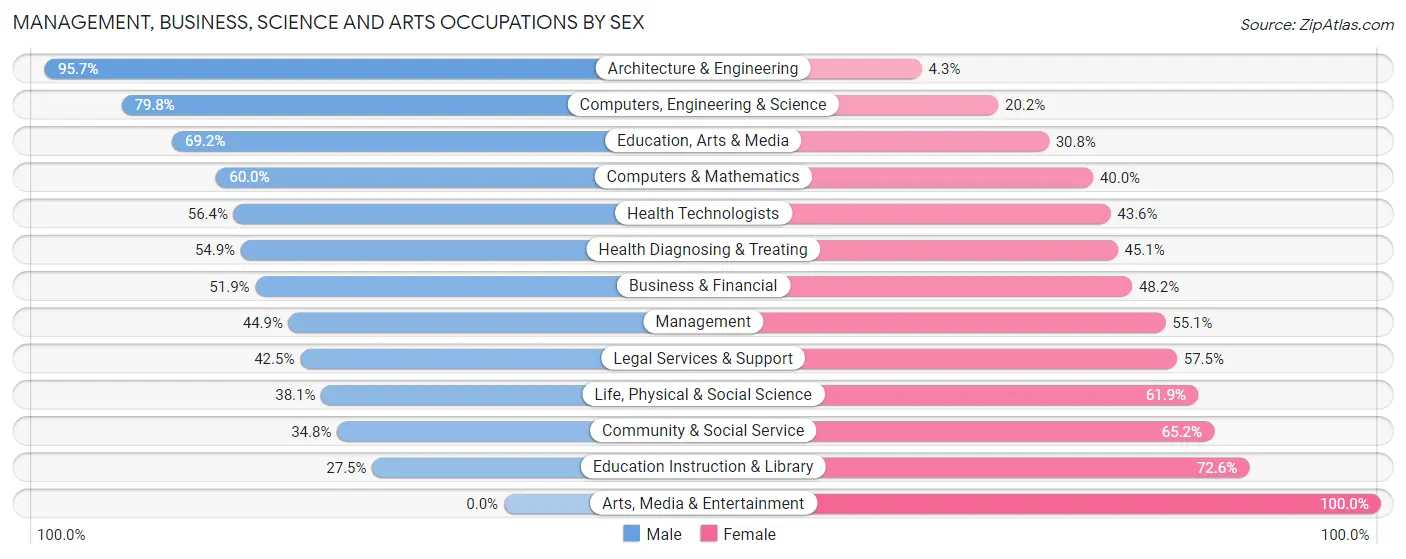
Management, Business, Science and Arts Occupations by Sex
Within the Management, Business, Science and Arts occupations in Weatherby Lake, the most male-oriented occupations are Architecture & Engineering (95.7%), Computers, Engineering & Science (79.8%), and Education, Arts & Media (69.2%), while the most female-oriented occupations are Arts, Media & Entertainment (100.0%), Education Instruction & Library (72.6%), and Community & Social Service (65.2%).
| Occupation | Male | Female |
| Management | 79 (44.9%) | 97 (55.1%) |
| Business & Financial | 56 (51.8%) | 52 (48.1%) |
| Computers, Engineering & Science | 150 (79.8%) | 38 (20.2%) |
| Computers & Mathematics | 30 (60.0%) | 20 (40.0%) |
| Architecture & Engineering | 112 (95.7%) | 5 (4.3%) |
| Life, Physical & Social Science | 8 (38.1%) | 13 (61.9%) |
| Community & Social Service | 40 (34.8%) | 75 (65.2%) |
| Education, Arts & Media | 9 (69.2%) | 4 (30.8%) |
| Legal Services & Support | 17 (42.5%) | 23 (57.5%) |
| Education Instruction & Library | 14 (27.5%) | 37 (72.6%) |
| Arts, Media & Entertainment | 0 (0.0%) | 11 (100.0%) |
| Health Diagnosing & Treating | 62 (54.9%) | 51 (45.1%) |
| Health Technologists | 62 (56.4%) | 48 (43.6%) |
| Total (Category) | 387 (55.3%) | 313 (44.7%) |
| Total (Overall) | 659 (54.6%) | 548 (45.4%) |
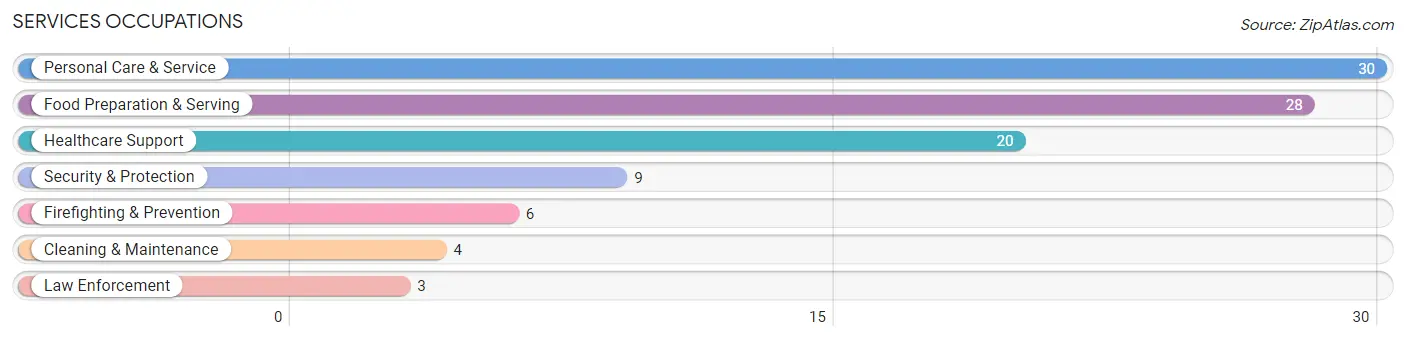
Services Occupations
The most common Services occupations in Weatherby Lake are Personal Care & Service (30 | 2.5%), Food Preparation & Serving (28 | 2.3%), Healthcare Support (20 | 1.7%), Security & Protection (9 | 0.7%), and Firefighting & Prevention (6 | 0.5%).
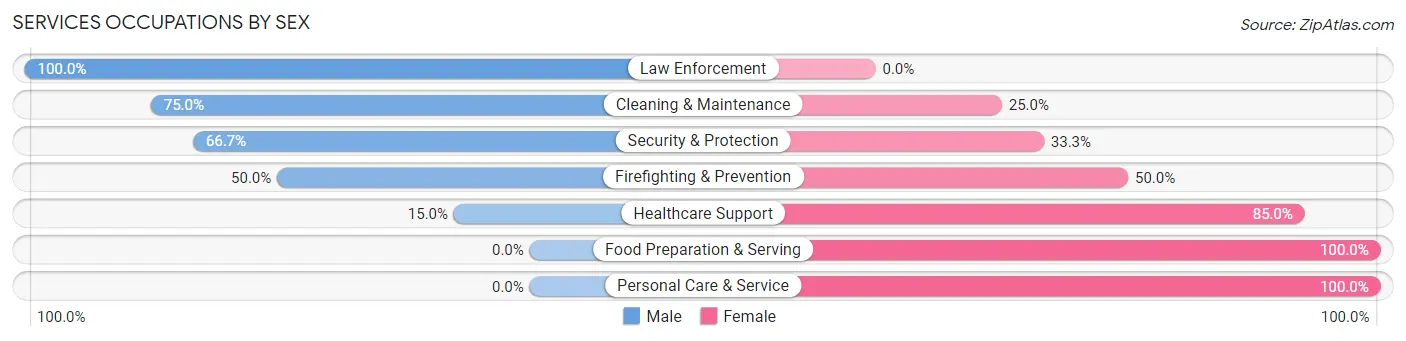
Services Occupations by Sex
Within the Services occupations in Weatherby Lake, the most male-oriented occupations are Law Enforcement (100.0%), Cleaning & Maintenance (75.0%), and Security & Protection (66.7%), while the most female-oriented occupations are Food Preparation & Serving (100.0%), Personal Care & Service (100.0%), and Healthcare Support (85.0%).
| Occupation | Male | Female |
| Healthcare Support | 3 (15.0%) | 17 (85.0%) |
| Security & Protection | 6 (66.7%) | 3 (33.3%) |
| Firefighting & Prevention | 3 (50.0%) | 3 (50.0%) |
| Law Enforcement | 3 (100.0%) | 0 (0.0%) |
| Food Preparation & Serving | 0 (0.0%) | 28 (100.0%) |
| Cleaning & Maintenance | 3 (75.0%) | 1 (25.0%) |
| Personal Care & Service | 0 (0.0%) | 30 (100.0%) |
| Total (Category) | 12 (13.2%) | 79 (86.8%) |
| Total (Overall) | 659 (54.6%) | 548 (45.4%) |
Sales and Office Occupations
The most common Sales and Office occupations in Weatherby Lake are Sales & Related (149 | 12.3%), and Office & Administration (62 | 5.1%).
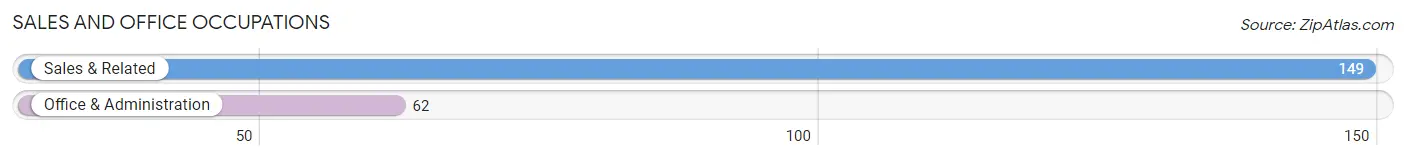
Sales and Office Occupations by Sex
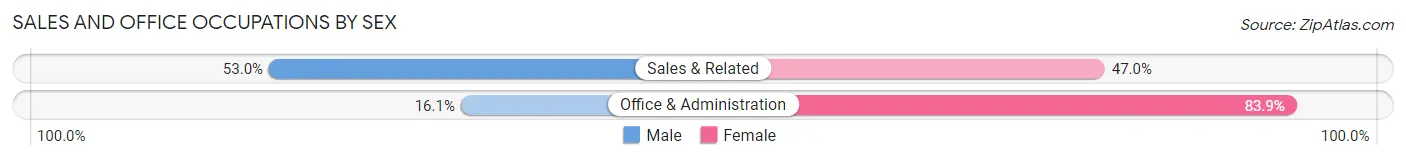
| Occupation | Male | Female |
| Sales & Related | 79 (53.0%) | 70 (47.0%) |
| Office & Administration | 10 (16.1%) | 52 (83.9%) |
| Total (Category) | 89 (42.2%) | 122 (57.8%) |
| Total (Overall) | 659 (54.6%) | 548 (45.4%) |
Natural Resources, Construction and Maintenance Occupations
The most common Natural Resources, Construction and Maintenance occupations in Weatherby Lake are Installation, Maintenance & Repair (41 | 3.4%), and Construction & Extraction (29 | 2.4%).
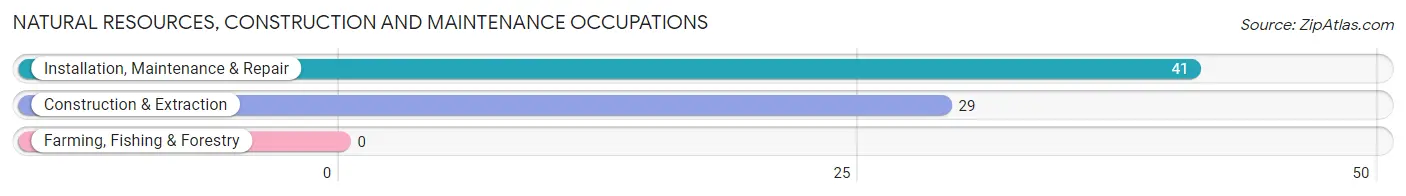
Natural Resources, Construction and Maintenance Occupations by Sex
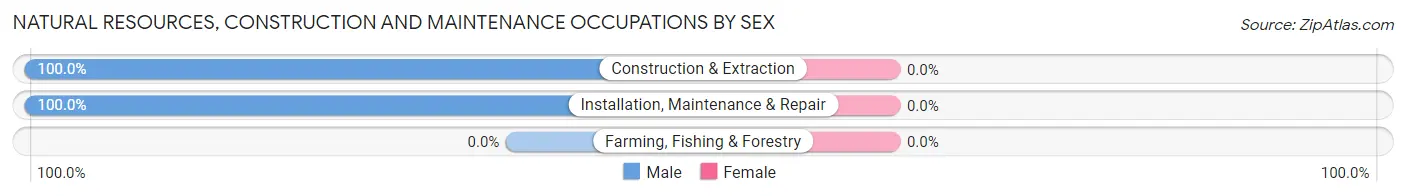
| Occupation | Male | Female |
| Farming, Fishing & Forestry | 0 (0.0%) | 0 (0.0%) |
| Construction & Extraction | 29 (100.0%) | 0 (0.0%) |
| Installation, Maintenance & Repair | 41 (100.0%) | 0 (0.0%) |
| Total (Category) | 70 (100.0%) | 0 (0.0%) |
| Total (Overall) | 659 (54.6%) | 548 (45.4%) |
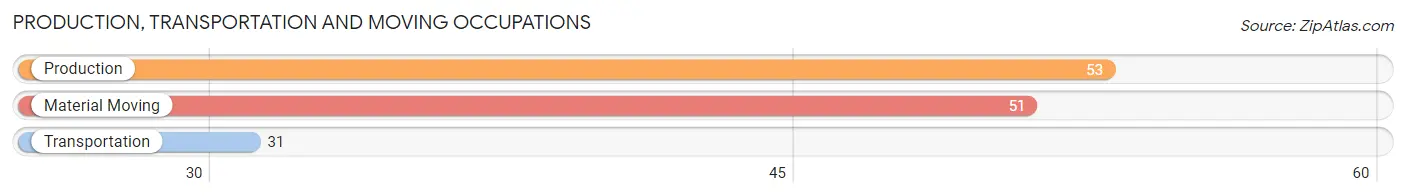
Production, Transportation and Moving Occupations
The most common Production, Transportation and Moving occupations in Weatherby Lake are Production (53 | 4.4%), Material Moving (51 | 4.2%), and Transportation (31 | 2.6%).
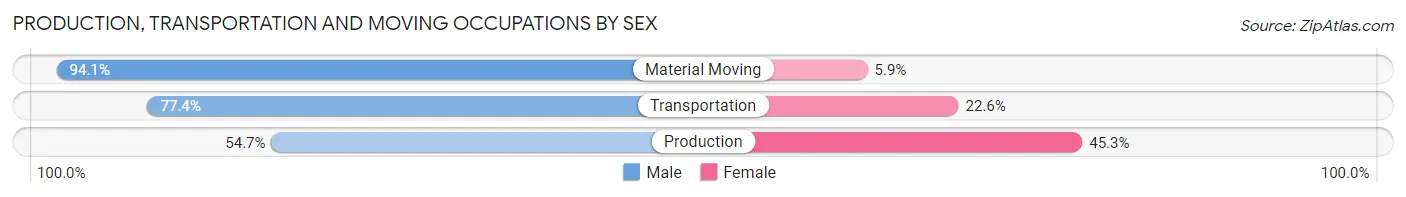
Production, Transportation and Moving Occupations by Sex
| Occupation | Male | Female |
| Production | 29 (54.7%) | 24 (45.3%) |
| Transportation | 24 (77.4%) | 7 (22.6%) |
| Material Moving | 48 (94.1%) | 3 (5.9%) |
| Total (Category) | 101 (74.8%) | 34 (25.2%) |
| Total (Overall) | 659 (54.6%) | 548 (45.4%) |
Employment Industries by Sex in Weatherby Lake
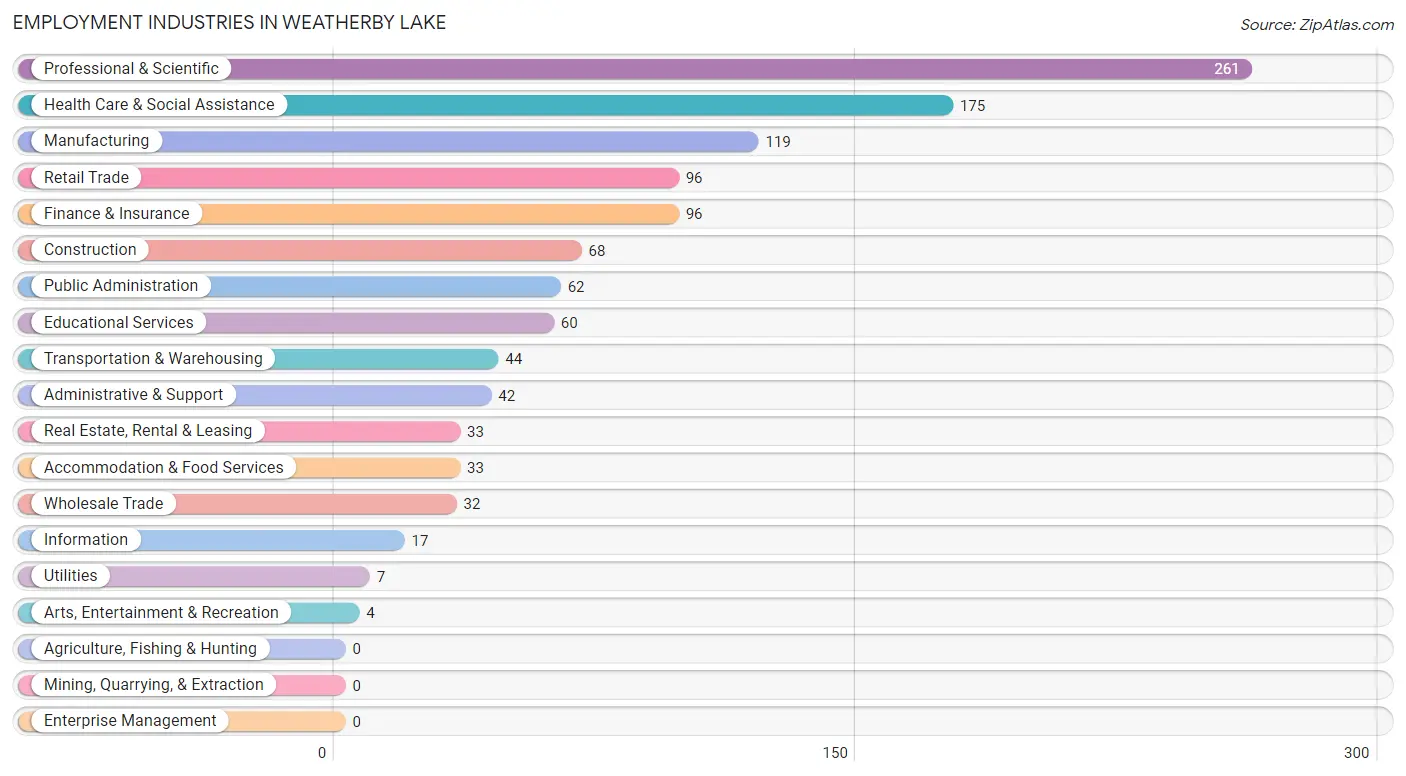
Employment Industries in Weatherby Lake
The major employment industries in Weatherby Lake include Professional & Scientific (261 | 21.6%), Health Care & Social Assistance (175 | 14.5%), Manufacturing (119 | 9.9%), Retail Trade (96 | 8.0%), and Finance & Insurance (96 | 8.0%).
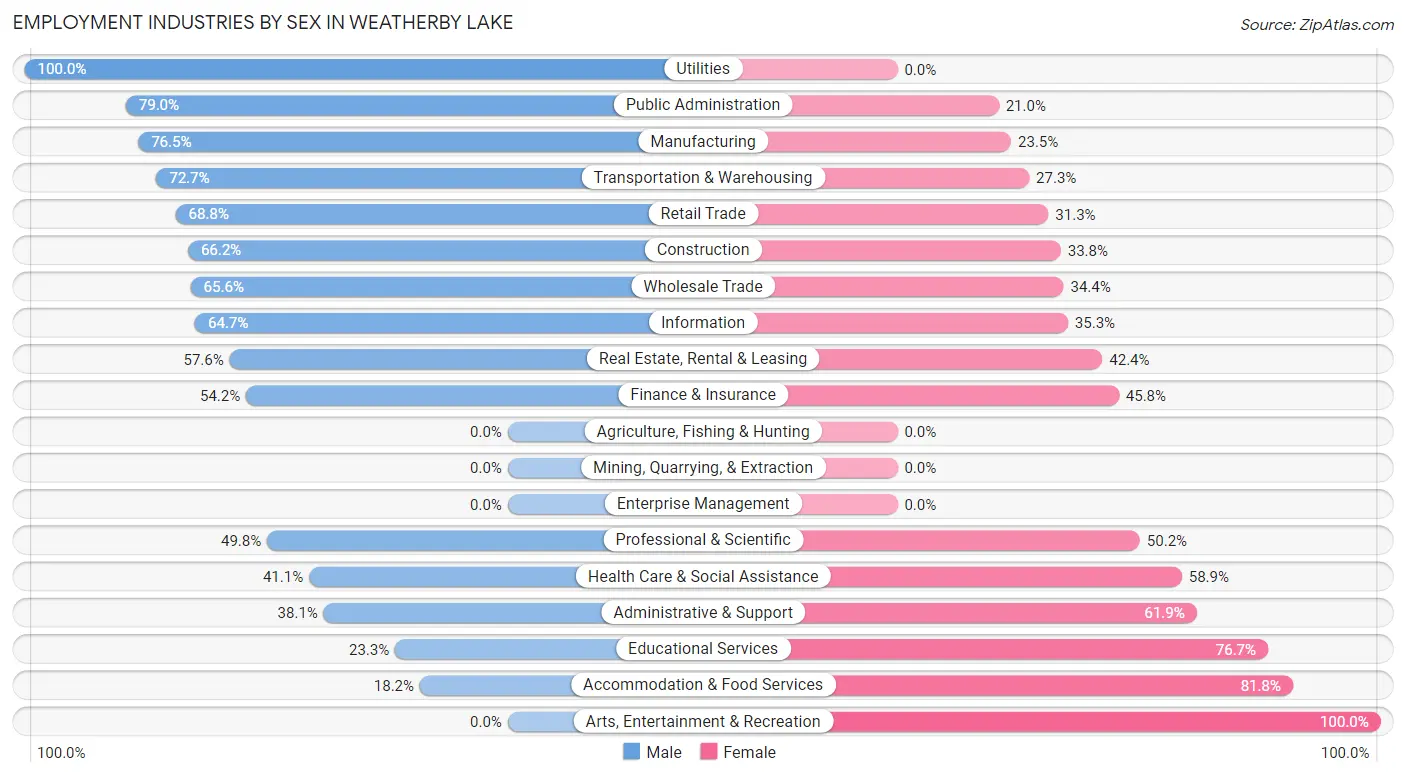
Employment Industries by Sex in Weatherby Lake
The Weatherby Lake industries that see more men than women are Utilities (100.0%), Public Administration (79.0%), and Manufacturing (76.5%), whereas the industries that tend to have a higher number of women are Arts, Entertainment & Recreation (100.0%), Accommodation & Food Services (81.8%), and Educational Services (76.7%).
| Industry | Male | Female |
| Agriculture, Fishing & Hunting | 0 (0.0%) | 0 (0.0%) |
| Mining, Quarrying, & Extraction | 0 (0.0%) | 0 (0.0%) |
| Construction | 45 (66.2%) | 23 (33.8%) |
| Manufacturing | 91 (76.5%) | 28 (23.5%) |
| Wholesale Trade | 21 (65.6%) | 11 (34.4%) |
| Retail Trade | 66 (68.8%) | 30 (31.2%) |
| Transportation & Warehousing | 32 (72.7%) | 12 (27.3%) |
| Utilities | 7 (100.0%) | 0 (0.0%) |
| Information | 11 (64.7%) | 6 (35.3%) |
| Finance & Insurance | 52 (54.2%) | 44 (45.8%) |
| Real Estate, Rental & Leasing | 19 (57.6%) | 14 (42.4%) |
| Professional & Scientific | 130 (49.8%) | 131 (50.2%) |
| Enterprise Management | 0 (0.0%) | 0 (0.0%) |
| Administrative & Support | 16 (38.1%) | 26 (61.9%) |
| Educational Services | 14 (23.3%) | 46 (76.7%) |
| Health Care & Social Assistance | 72 (41.1%) | 103 (58.9%) |
| Arts, Entertainment & Recreation | 0 (0.0%) | 4 (100.0%) |
| Accommodation & Food Services | 6 (18.2%) | 27 (81.8%) |
| Public Administration | 49 (79.0%) | 13 (21.0%) |
| Total | 659 (54.6%) | 548 (45.4%) |
Education in Weatherby Lake
School Enrollment in Weatherby Lake
The most common levels of schooling among the 622 students in Weatherby Lake are high school (198 | 31.8%), elementary school (174 | 28.0%), and middle school (156 | 25.1%).
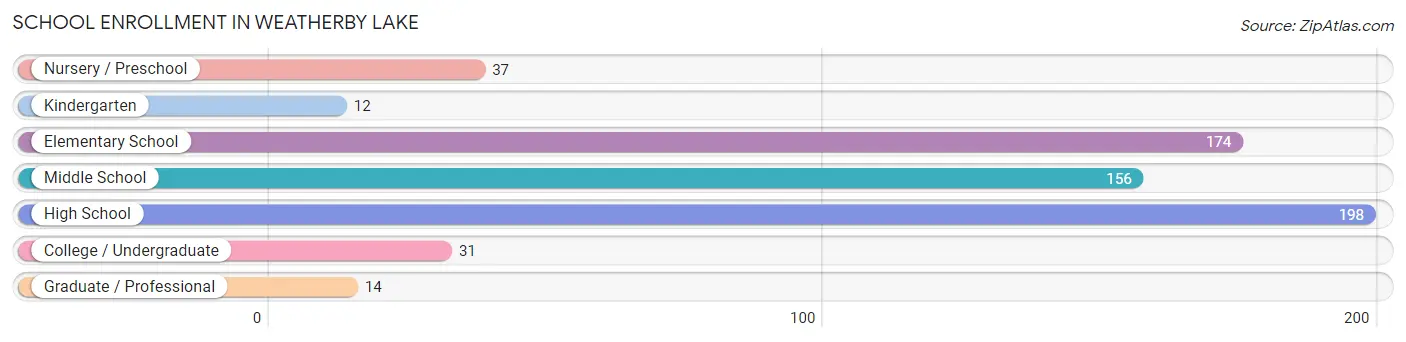
| School Level | # Students | % Students |
| Nursery / Preschool | 37 | 5.9% |
| Kindergarten | 12 | 1.9% |
| Elementary School | 174 | 28.0% |
| Middle School | 156 | 25.1% |
| High School | 198 | 31.8% |
| College / Undergraduate | 31 | 5.0% |
| Graduate / Professional | 14 | 2.2% |
| Total | 622 | 100.0% |
School Enrollment by Age by Funding Source in Weatherby Lake
Out of a total of 622 students who are enrolled in schools in Weatherby Lake, 81 (13.0%) attend a private institution, while the remaining 541 (87.0%) are enrolled in public schools. The age group of 20 to 24 year olds has the highest likelihood of being enrolled in private schools, with 11 (57.9% in the age bracket) enrolled. Conversely, the age group of 18 to 19 year olds has the lowest likelihood of being enrolled in a private school, with 35 (100.0% in the age bracket) attending a public institution.
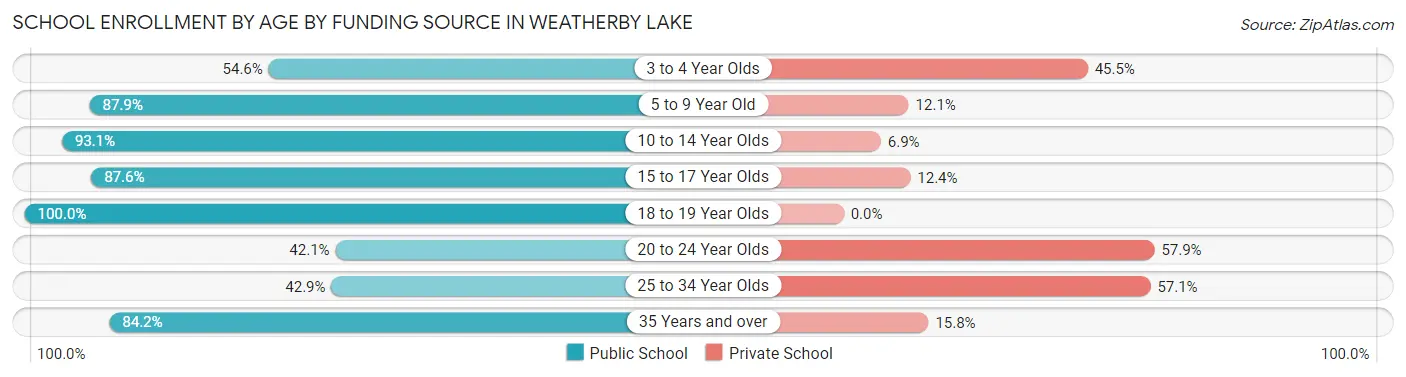
| Age Bracket | Public School | Private School |
| 3 to 4 Year Olds | 12 (54.5%) | 10 (45.5%) |
| 5 to 9 Year Old | 138 (87.9%) | 19 (12.1%) |
| 10 to 14 Year Olds | 188 (93.1%) | 14 (6.9%) |
| 15 to 17 Year Olds | 141 (87.6%) | 20 (12.4%) |
| 18 to 19 Year Olds | 35 (100.0%) | 0 (0.0%) |
| 20 to 24 Year Olds | 8 (42.1%) | 11 (57.9%) |
| 25 to 34 Year Olds | 3 (42.9%) | 4 (57.1%) |
| 35 Years and over | 16 (84.2%) | 3 (15.8%) |
| Total | 541 (87.0%) | 81 (13.0%) |
Educational Attainment by Field of Study in Weatherby Lake
Business (274 | 23.4%), education (195 | 16.6%), science & technology (137 | 11.7%), bio, nature & agricultural (102 | 8.7%), and computers & mathematics (95 | 8.1%) are the most common fields of study among 1,173 individuals in Weatherby Lake who have obtained a bachelor's degree or higher.
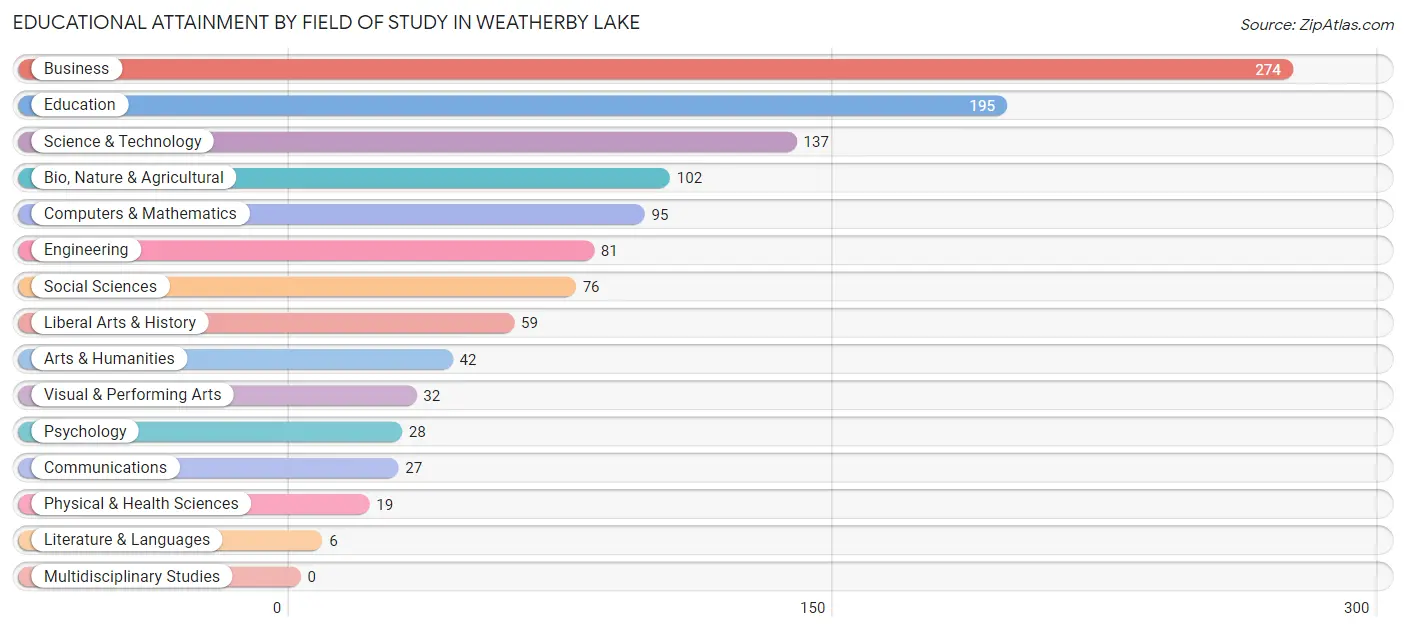
| Field of Study | # Graduates | % Graduates |
| Computers & Mathematics | 95 | 8.1% |
| Bio, Nature & Agricultural | 102 | 8.7% |
| Physical & Health Sciences | 19 | 1.6% |
| Psychology | 28 | 2.4% |
| Social Sciences | 76 | 6.5% |
| Engineering | 81 | 6.9% |
| Multidisciplinary Studies | 0 | 0.0% |
| Science & Technology | 137 | 11.7% |
| Business | 274 | 23.4% |
| Education | 195 | 16.6% |
| Literature & Languages | 6 | 0.5% |
| Liberal Arts & History | 59 | 5.0% |
| Visual & Performing Arts | 32 | 2.7% |
| Communications | 27 | 2.3% |
| Arts & Humanities | 42 | 3.6% |
| Total | 1,173 | 100.0% |
Transportation & Commute in Weatherby Lake
Vehicle Availability by Sex in Weatherby Lake
The most prevalent vehicle ownership categories in Weatherby Lake are males with 2 vehicles (279, accounting for 42.3%) and females with 2 vehicles (203, making up 52.4%).
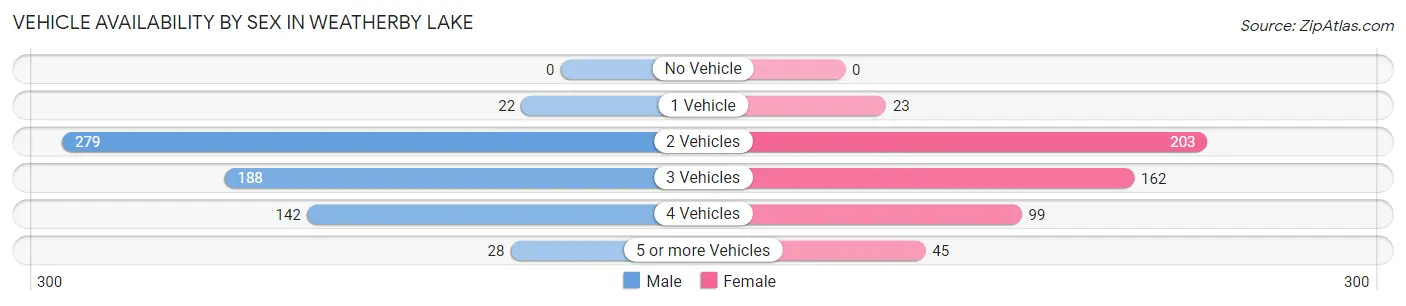
| Vehicles Available | Male | Female |
| No Vehicle | 0 (0.0%) | 0 (0.0%) |
| 1 Vehicle | 22 (3.3%) | 23 (4.3%) |
| 2 Vehicles | 279 (42.3%) | 203 (38.2%) |
| 3 Vehicles | 188 (28.5%) | 162 (30.4%) |
| 4 Vehicles | 142 (21.5%) | 99 (18.6%) |
| 5 or more Vehicles | 28 (4.3%) | 45 (8.5%) |
| Total | 659 (100.0%) | 532 (100.0%) |
Commute Time in Weatherby Lake
The most frequently occuring commute durations in Weatherby Lake are 20 to 24 minutes (139 commuters, 16.3%), 10 to 14 minutes (128 commuters, 15.0%), and 30 to 34 minutes (120 commuters, 14.1%).
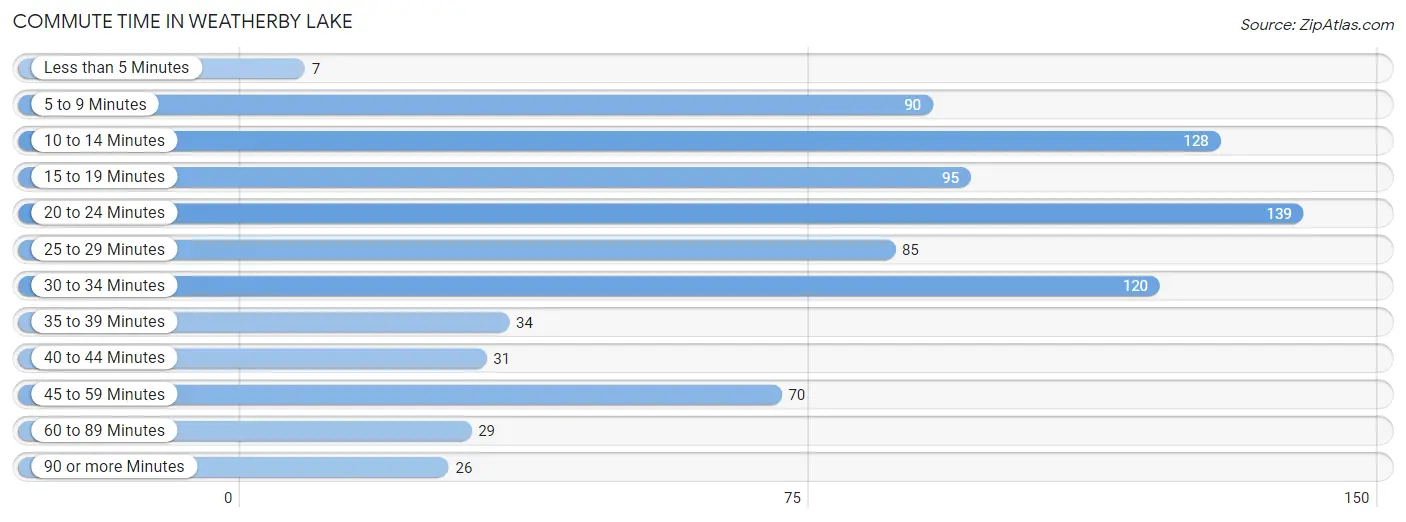
| Commute Time | # Commuters | % Commuters |
| Less than 5 Minutes | 7 | 0.8% |
| 5 to 9 Minutes | 90 | 10.5% |
| 10 to 14 Minutes | 128 | 15.0% |
| 15 to 19 Minutes | 95 | 11.1% |
| 20 to 24 Minutes | 139 | 16.3% |
| 25 to 29 Minutes | 85 | 10.0% |
| 30 to 34 Minutes | 120 | 14.1% |
| 35 to 39 Minutes | 34 | 4.0% |
| 40 to 44 Minutes | 31 | 3.6% |
| 45 to 59 Minutes | 70 | 8.2% |
| 60 to 89 Minutes | 29 | 3.4% |
| 90 or more Minutes | 26 | 3.0% |
Commute Time by Sex in Weatherby Lake
The most common commute times in Weatherby Lake are 20 to 24 minutes (107 commuters, 21.9%) for males and 10 to 14 minutes (79 commuters, 21.6%) for females.
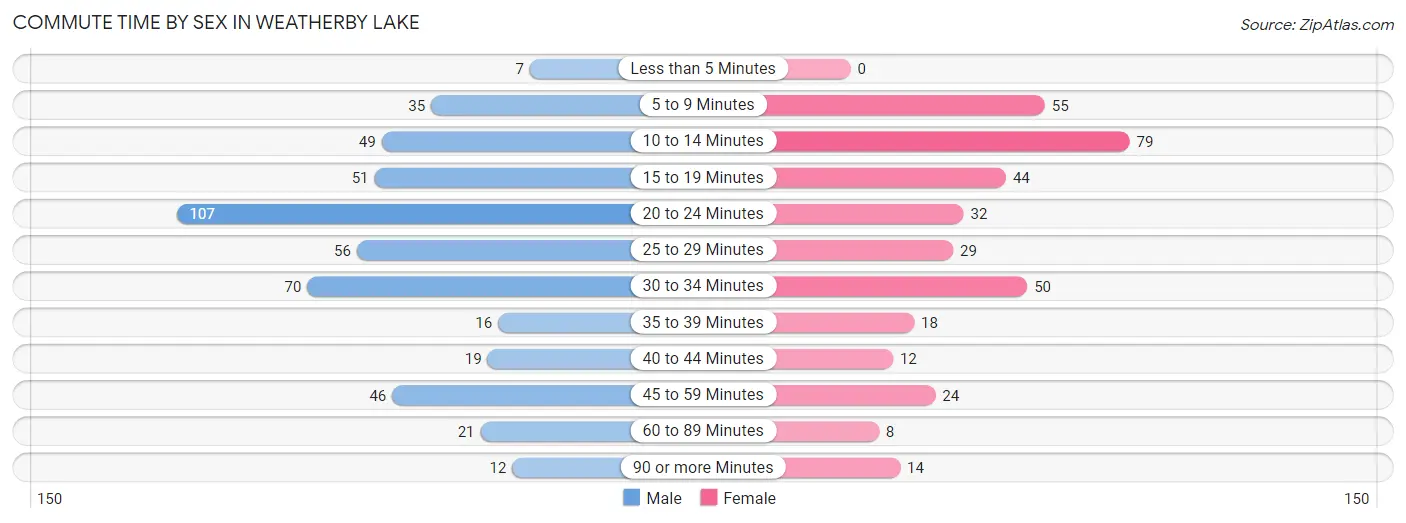
| Commute Time | Male | Female |
| Less than 5 Minutes | 7 (1.4%) | 0 (0.0%) |
| 5 to 9 Minutes | 35 (7.2%) | 55 (15.1%) |
| 10 to 14 Minutes | 49 (10.0%) | 79 (21.6%) |
| 15 to 19 Minutes | 51 (10.4%) | 44 (12.0%) |
| 20 to 24 Minutes | 107 (21.9%) | 32 (8.8%) |
| 25 to 29 Minutes | 56 (11.5%) | 29 (8.0%) |
| 30 to 34 Minutes | 70 (14.3%) | 50 (13.7%) |
| 35 to 39 Minutes | 16 (3.3%) | 18 (4.9%) |
| 40 to 44 Minutes | 19 (3.9%) | 12 (3.3%) |
| 45 to 59 Minutes | 46 (9.4%) | 24 (6.6%) |
| 60 to 89 Minutes | 21 (4.3%) | 8 (2.2%) |
| 90 or more Minutes | 12 (2.5%) | 14 (3.8%) |
Time of Departure to Work by Sex in Weatherby Lake
The most frequent times of departure to work in Weatherby Lake are 7:00 AM to 7:29 AM (114, 23.3%) for males and 7:00 AM to 7:29 AM (99, 27.1%) for females.
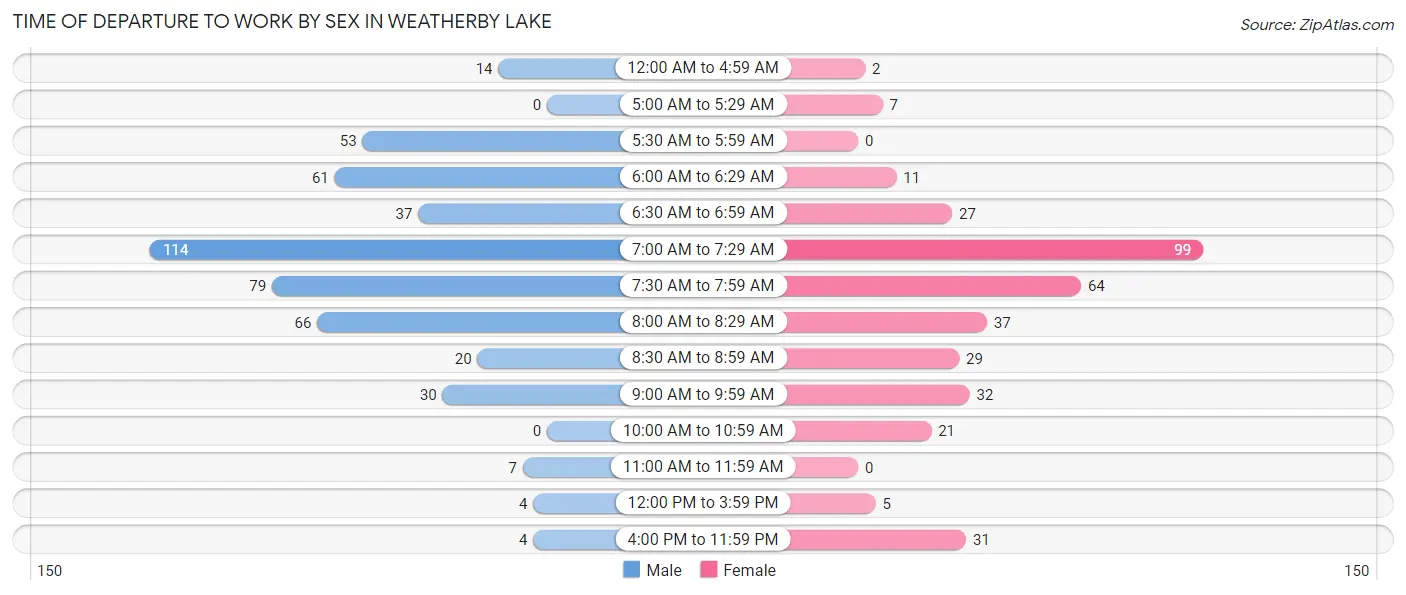
| Time of Departure | Male | Female |
| 12:00 AM to 4:59 AM | 14 (2.9%) | 2 (0.5%) |
| 5:00 AM to 5:29 AM | 0 (0.0%) | 7 (1.9%) |
| 5:30 AM to 5:59 AM | 53 (10.8%) | 0 (0.0%) |
| 6:00 AM to 6:29 AM | 61 (12.5%) | 11 (3.0%) |
| 6:30 AM to 6:59 AM | 37 (7.6%) | 27 (7.4%) |
| 7:00 AM to 7:29 AM | 114 (23.3%) | 99 (27.1%) |
| 7:30 AM to 7:59 AM | 79 (16.2%) | 64 (17.5%) |
| 8:00 AM to 8:29 AM | 66 (13.5%) | 37 (10.1%) |
| 8:30 AM to 8:59 AM | 20 (4.1%) | 29 (8.0%) |
| 9:00 AM to 9:59 AM | 30 (6.1%) | 32 (8.8%) |
| 10:00 AM to 10:59 AM | 0 (0.0%) | 21 (5.8%) |
| 11:00 AM to 11:59 AM | 7 (1.4%) | 0 (0.0%) |
| 12:00 PM to 3:59 PM | 4 (0.8%) | 5 (1.4%) |
| 4:00 PM to 11:59 PM | 4 (0.8%) | 31 (8.5%) |
| Total | 489 (100.0%) | 365 (100.0%) |
Housing Occupancy in Weatherby Lake
Occupancy by Ownership in Weatherby Lake
Of the total 940 dwellings in Weatherby Lake, owner-occupied units account for 916 (97.5%), while renter-occupied units make up 24 (2.5%).
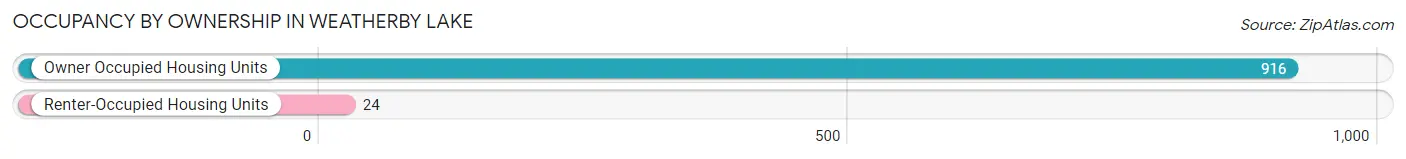
| Occupancy | # Housing Units | % Housing Units |
| Owner Occupied Housing Units | 916 | 97.5% |
| Renter-Occupied Housing Units | 24 | 2.5% |
| Total Occupied Housing Units | 940 | 100.0% |
Occupancy by Household Size in Weatherby Lake
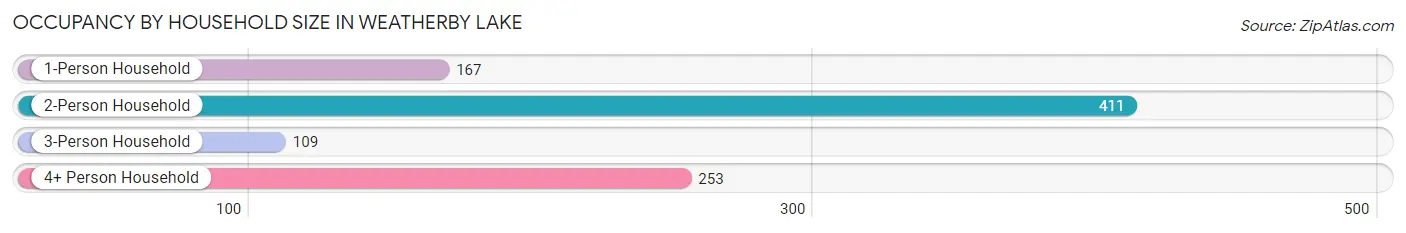
| Household Size | # Housing Units | % Housing Units |
| 1-Person Household | 167 | 17.8% |
| 2-Person Household | 411 | 43.7% |
| 3-Person Household | 109 | 11.6% |
| 4+ Person Household | 253 | 26.9% |
| Total Housing Units | 940 | 100.0% |
Occupancy by Ownership by Household Size in Weatherby Lake
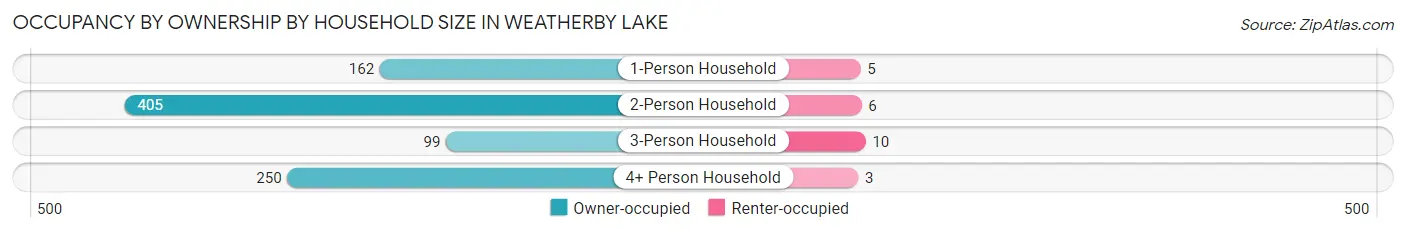
| Household Size | Owner-occupied | Renter-occupied |
| 1-Person Household | 162 (97.0%) | 5 (3.0%) |
| 2-Person Household | 405 (98.5%) | 6 (1.5%) |
| 3-Person Household | 99 (90.8%) | 10 (9.2%) |
| 4+ Person Household | 250 (98.8%) | 3 (1.2%) |
| Total Housing Units | 916 (97.5%) | 24 (2.5%) |
Occupancy by Educational Attainment in Weatherby Lake
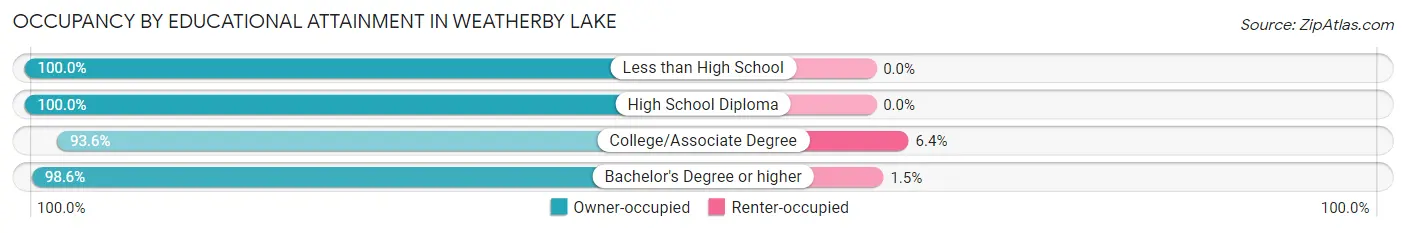
| Household Size | Owner-occupied | Renter-occupied |
| Less than High School | 7 (100.0%) | 0 (0.0%) |
| High School Diploma | 78 (100.0%) | 0 (0.0%) |
| College/Associate Degree | 218 (93.6%) | 15 (6.4%) |
| Bachelor's Degree or higher | 613 (98.6%) | 9 (1.5%) |
Occupancy by Age of Householder in Weatherby Lake
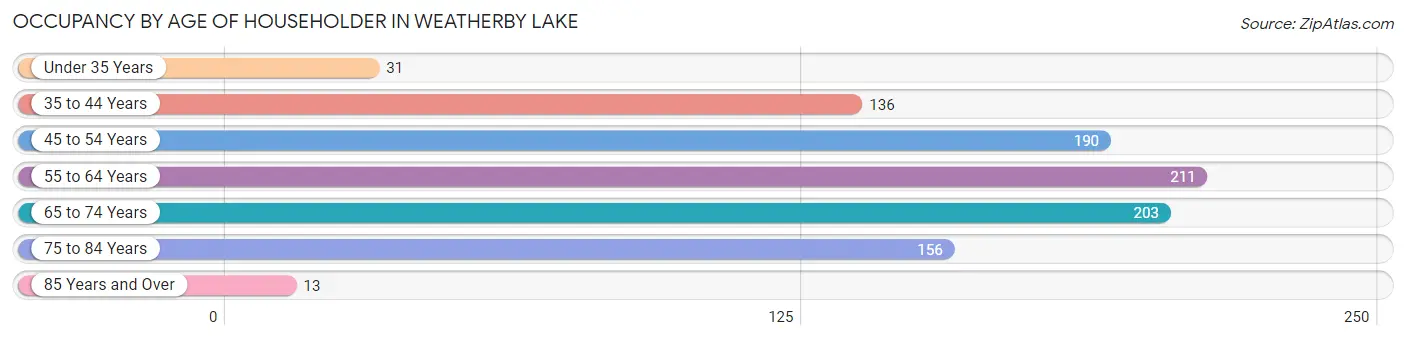
| Age Bracket | # Households | % Households |
| Under 35 Years | 31 | 3.3% |
| 35 to 44 Years | 136 | 14.5% |
| 45 to 54 Years | 190 | 20.2% |
| 55 to 64 Years | 211 | 22.5% |
| 65 to 74 Years | 203 | 21.6% |
| 75 to 84 Years | 156 | 16.6% |
| 85 Years and Over | 13 | 1.4% |
| Total | 940 | 100.0% |
Housing Finances in Weatherby Lake
Median Income by Occupancy in Weatherby Lake
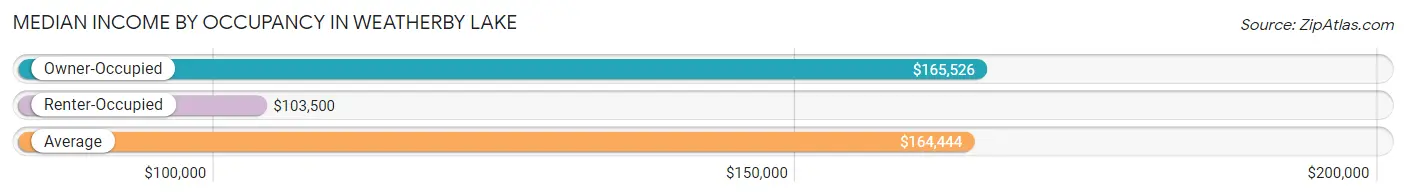
| Occupancy Type | # Households | Median Income |
| Owner-Occupied | 916 (97.5%) | $165,526 |
| Renter-Occupied | 24 (2.5%) | $103,500 |
| Average | 940 (100.0%) | $164,444 |
Occupancy by Householder Income Bracket in Weatherby Lake
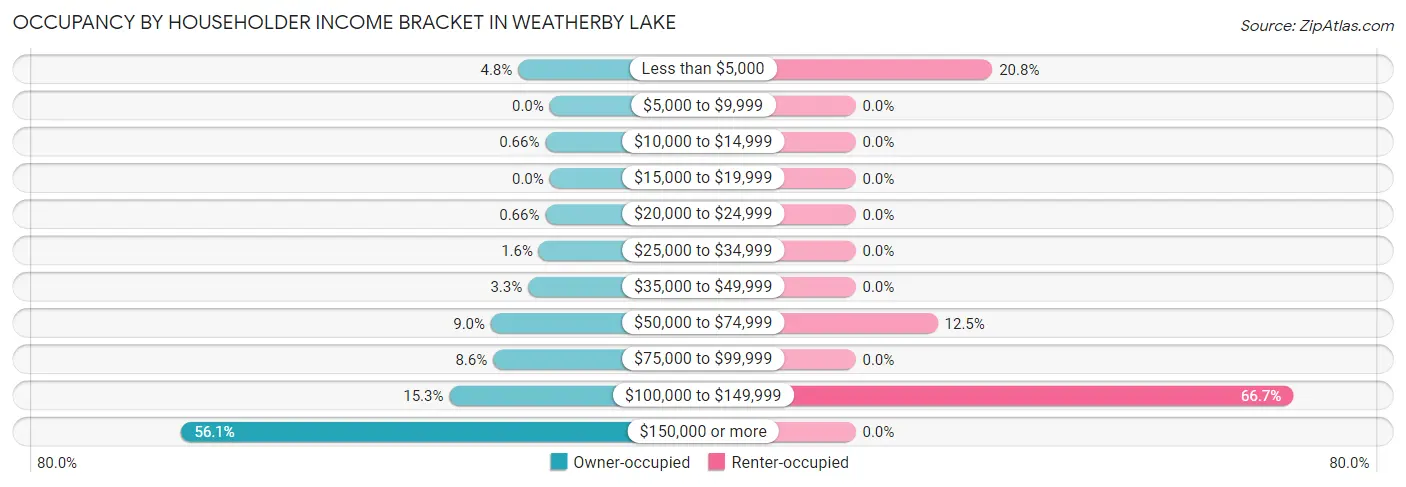
| Income Bracket | Owner-occupied | Renter-occupied |
| Less than $5,000 | 44 (4.8%) | 5 (20.8%) |
| $5,000 to $9,999 | 0 (0.0%) | 0 (0.0%) |
| $10,000 to $14,999 | 6 (0.7%) | 0 (0.0%) |
| $15,000 to $19,999 | 0 (0.0%) | 0 (0.0%) |
| $20,000 to $24,999 | 6 (0.7%) | 0 (0.0%) |
| $25,000 to $34,999 | 15 (1.6%) | 0 (0.0%) |
| $35,000 to $49,999 | 30 (3.3%) | 0 (0.0%) |
| $50,000 to $74,999 | 82 (8.9%) | 3 (12.5%) |
| $75,000 to $99,999 | 79 (8.6%) | 0 (0.0%) |
| $100,000 to $149,999 | 140 (15.3%) | 16 (66.7%) |
| $150,000 or more | 514 (56.1%) | 0 (0.0%) |
| Total | 916 (100.0%) | 24 (100.0%) |
Monthly Housing Cost Tiers in Weatherby Lake
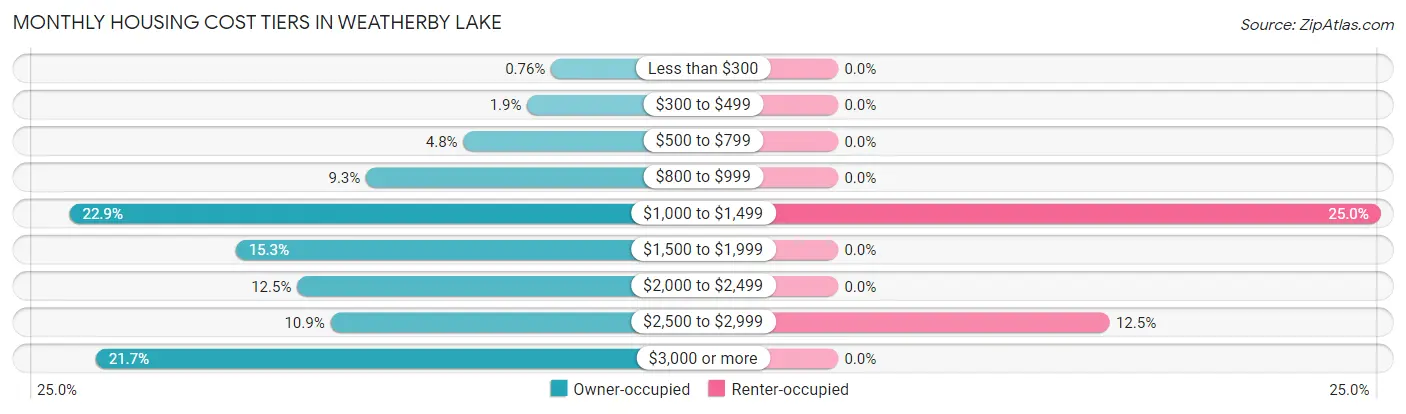
| Monthly Cost | Owner-occupied | Renter-occupied |
| Less than $300 | 7 (0.8%) | 0 (0.0%) |
| $300 to $499 | 17 (1.9%) | 0 (0.0%) |
| $500 to $799 | 44 (4.8%) | 0 (0.0%) |
| $800 to $999 | 85 (9.3%) | 0 (0.0%) |
| $1,000 to $1,499 | 210 (22.9%) | 6 (25.0%) |
| $1,500 to $1,999 | 140 (15.3%) | 0 (0.0%) |
| $2,000 to $2,499 | 114 (12.4%) | 0 (0.0%) |
| $2,500 to $2,999 | 100 (10.9%) | 3 (12.5%) |
| $3,000 or more | 199 (21.7%) | 0 (0.0%) |
| Total | 916 (100.0%) | 24 (100.0%) |
Physical Housing Characteristics in Weatherby Lake
Housing Structures in Weatherby Lake
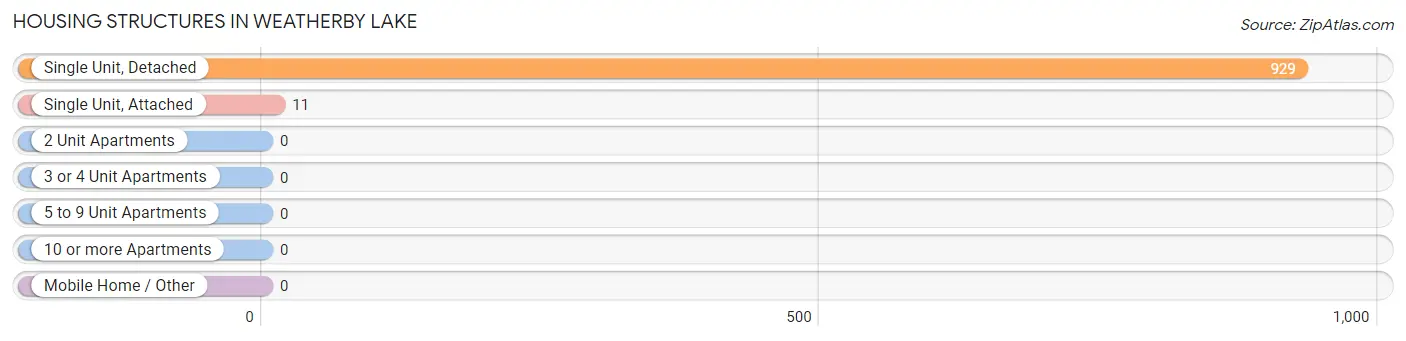
| Structure Type | # Housing Units | % Housing Units |
| Single Unit, Detached | 929 | 98.8% |
| Single Unit, Attached | 11 | 1.2% |
| 2 Unit Apartments | 0 | 0.0% |
| 3 or 4 Unit Apartments | 0 | 0.0% |
| 5 to 9 Unit Apartments | 0 | 0.0% |
| 10 or more Apartments | 0 | 0.0% |
| Mobile Home / Other | 0 | 0.0% |
| Total | 940 | 100.0% |
Housing Structures by Occupancy in Weatherby Lake
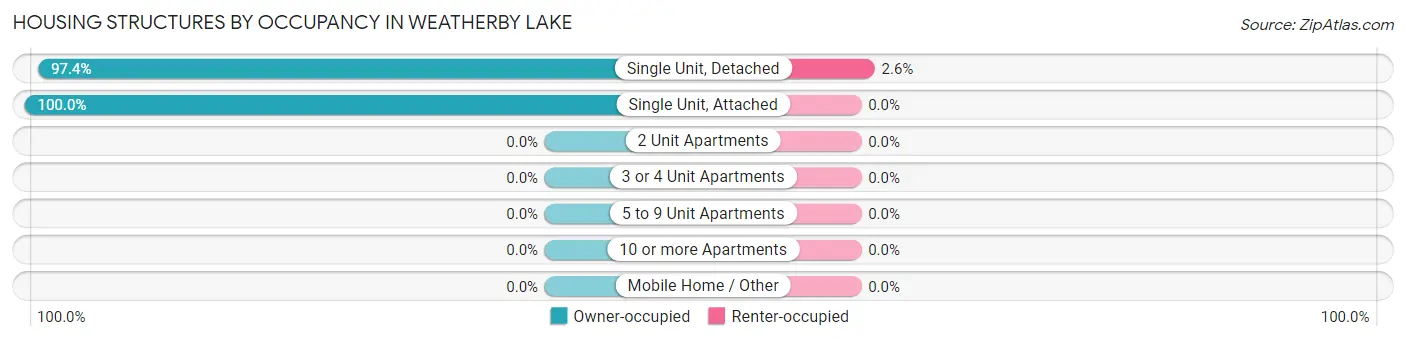
| Structure Type | Owner-occupied | Renter-occupied |
| Single Unit, Detached | 905 (97.4%) | 24 (2.6%) |
| Single Unit, Attached | 11 (100.0%) | 0 (0.0%) |
| 2 Unit Apartments | 0 (0.0%) | 0 (0.0%) |
| 3 or 4 Unit Apartments | 0 (0.0%) | 0 (0.0%) |
| 5 to 9 Unit Apartments | 0 (0.0%) | 0 (0.0%) |
| 10 or more Apartments | 0 (0.0%) | 0 (0.0%) |
| Mobile Home / Other | 0 (0.0%) | 0 (0.0%) |
| Total | 916 (97.5%) | 24 (2.5%) |
Housing Structures by Number of Rooms in Weatherby Lake
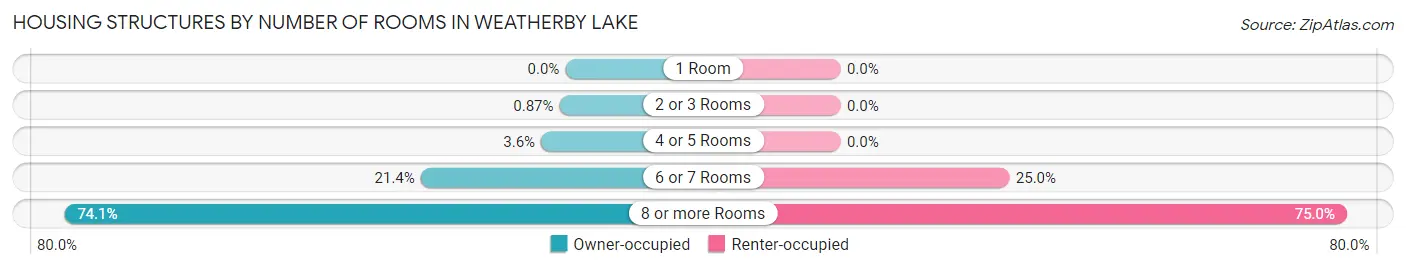
| Number of Rooms | Owner-occupied | Renter-occupied |
| 1 Room | 0 (0.0%) | 0 (0.0%) |
| 2 or 3 Rooms | 8 (0.9%) | 0 (0.0%) |
| 4 or 5 Rooms | 33 (3.6%) | 0 (0.0%) |
| 6 or 7 Rooms | 196 (21.4%) | 6 (25.0%) |
| 8 or more Rooms | 679 (74.1%) | 18 (75.0%) |
| Total | 916 (100.0%) | 24 (100.0%) |
Housing Structure by Heating Type in Weatherby Lake
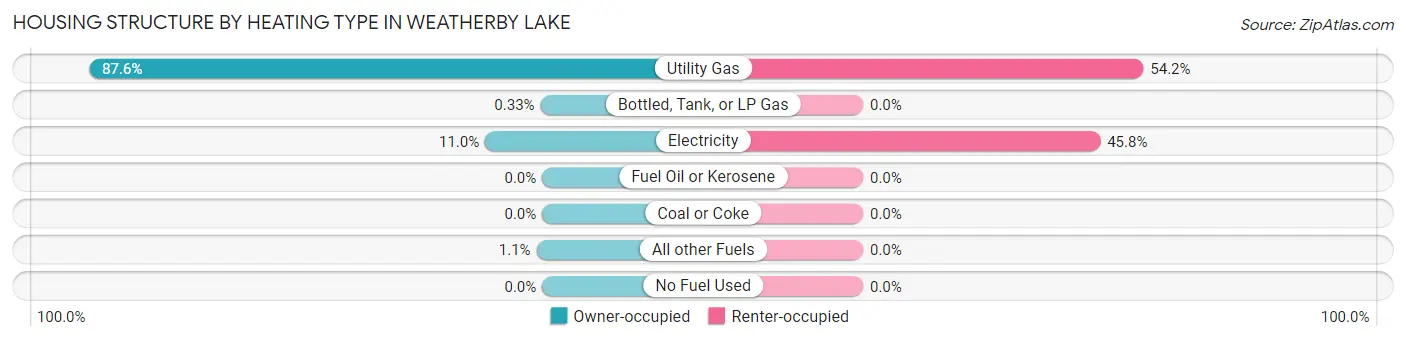
| Heating Type | Owner-occupied | Renter-occupied |
| Utility Gas | 802 (87.5%) | 13 (54.2%) |
| Bottled, Tank, or LP Gas | 3 (0.3%) | 0 (0.0%) |
| Electricity | 101 (11.0%) | 11 (45.8%) |
| Fuel Oil or Kerosene | 0 (0.0%) | 0 (0.0%) |
| Coal or Coke | 0 (0.0%) | 0 (0.0%) |
| All other Fuels | 10 (1.1%) | 0 (0.0%) |
| No Fuel Used | 0 (0.0%) | 0 (0.0%) |
| Total | 916 (100.0%) | 24 (100.0%) |
Household Vehicle Usage in Weatherby Lake
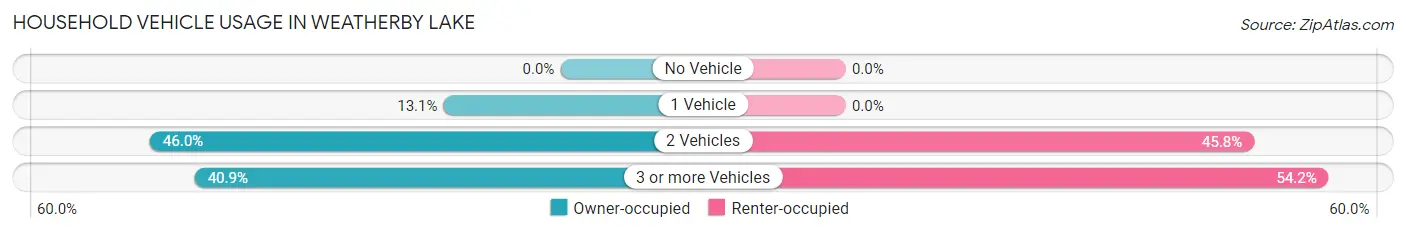
| Vehicles per Household | Owner-occupied | Renter-occupied |
| No Vehicle | 0 (0.0%) | 0 (0.0%) |
| 1 Vehicle | 120 (13.1%) | 0 (0.0%) |
| 2 Vehicles | 421 (46.0%) | 11 (45.8%) |
| 3 or more Vehicles | 375 (40.9%) | 13 (54.2%) |
| Total | 916 (100.0%) | 24 (100.0%) |
Real Estate & Mortgages in Weatherby Lake
Real Estate and Mortgage Overview in Weatherby Lake
| Characteristic | Without Mortgage | With Mortgage |
| Housing Units | 371 | 545 |
| Median Property Value | $492,600 | $455,000 |
| Median Household Income | $104,875 | $383 |
| Monthly Housing Costs | $1,064 | $195 |
| Real Estate Taxes | $5,818 | $0 |
Property Value by Mortgage Status in Weatherby Lake
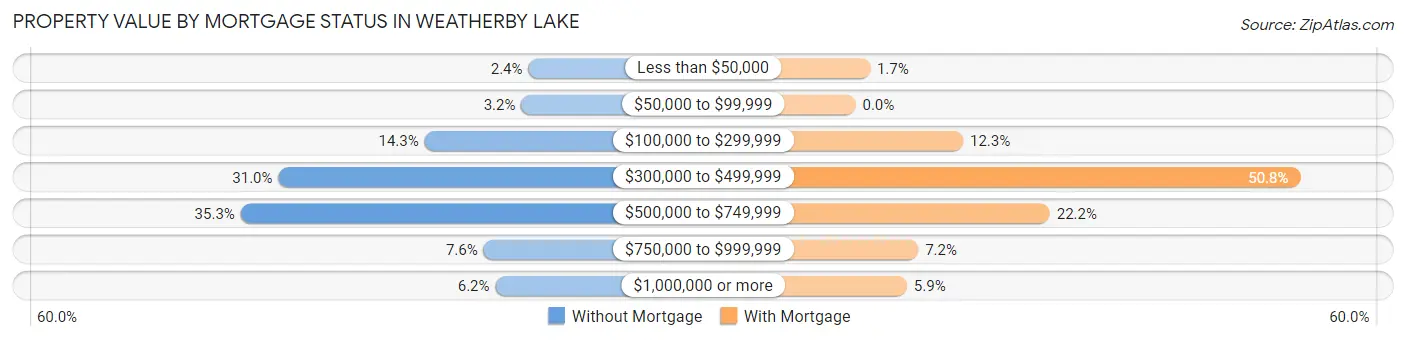
| Property Value | Without Mortgage | With Mortgage |
| Less than $50,000 | 9 (2.4%) | 9 (1.7%) |
| $50,000 to $99,999 | 12 (3.2%) | 0 (0.0%) |
| $100,000 to $299,999 | 53 (14.3%) | 67 (12.3%) |
| $300,000 to $499,999 | 115 (31.0%) | 277 (50.8%) |
| $500,000 to $749,999 | 131 (35.3%) | 121 (22.2%) |
| $750,000 to $999,999 | 28 (7.5%) | 39 (7.2%) |
| $1,000,000 or more | 23 (6.2%) | 32 (5.9%) |
| Total | 371 (100.0%) | 545 (100.0%) |
Household Income by Mortgage Status in Weatherby Lake
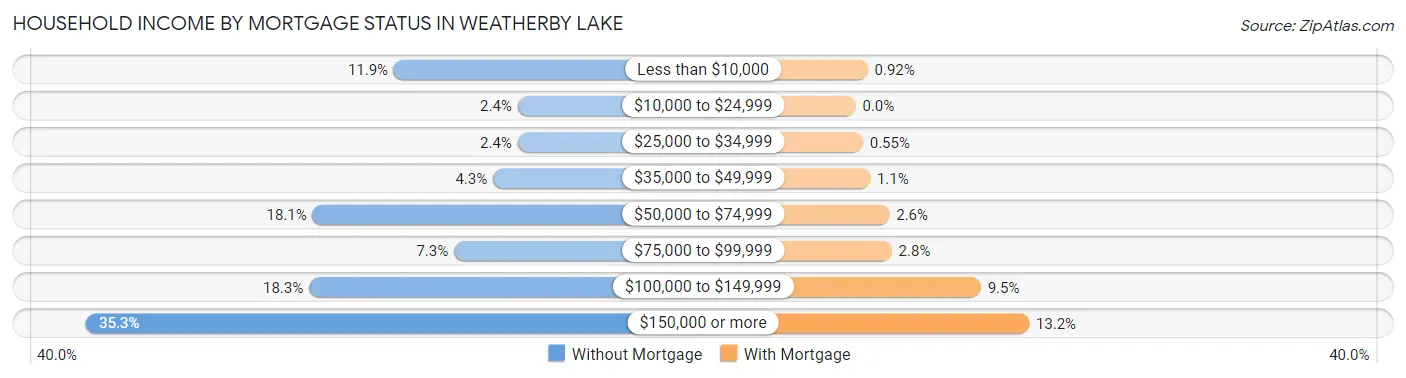
| Household Income | Without Mortgage | With Mortgage |
| Less than $10,000 | 44 (11.9%) | 5 (0.9%) |
| $10,000 to $24,999 | 9 (2.4%) | 0 (0.0%) |
| $25,000 to $34,999 | 9 (2.4%) | 3 (0.5%) |
| $35,000 to $49,999 | 16 (4.3%) | 6 (1.1%) |
| $50,000 to $74,999 | 67 (18.1%) | 14 (2.6%) |
| $75,000 to $99,999 | 27 (7.3%) | 15 (2.8%) |
| $100,000 to $149,999 | 68 (18.3%) | 52 (9.5%) |
| $150,000 or more | 131 (35.3%) | 72 (13.2%) |
| Total | 371 (100.0%) | 545 (100.0%) |
Property Value to Household Income Ratio in Weatherby Lake
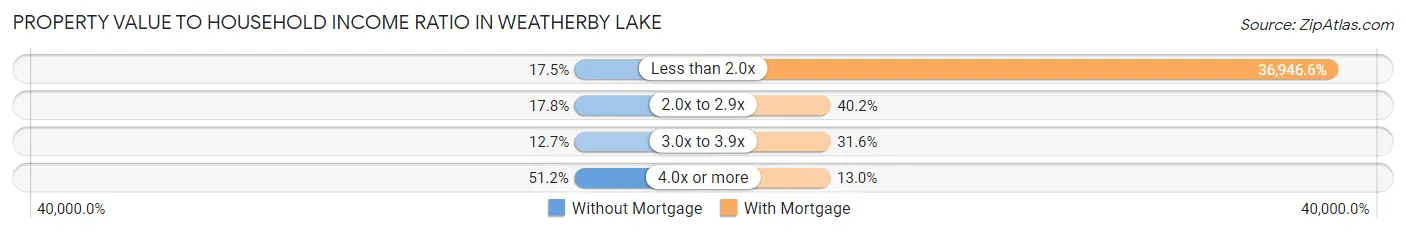
| Value-to-Income Ratio | Without Mortgage | With Mortgage |
| Less than 2.0x | 65 (17.5%) | 201,359 (36,946.6%) |
| 2.0x to 2.9x | 66 (17.8%) | 219 (40.2%) |
| 3.0x to 3.9x | 47 (12.7%) | 172 (31.6%) |
| 4.0x or more | 190 (51.2%) | 71 (13.0%) |
| Total | 371 (100.0%) | 545 (100.0%) |
Real Estate Taxes by Mortgage Status in Weatherby Lake
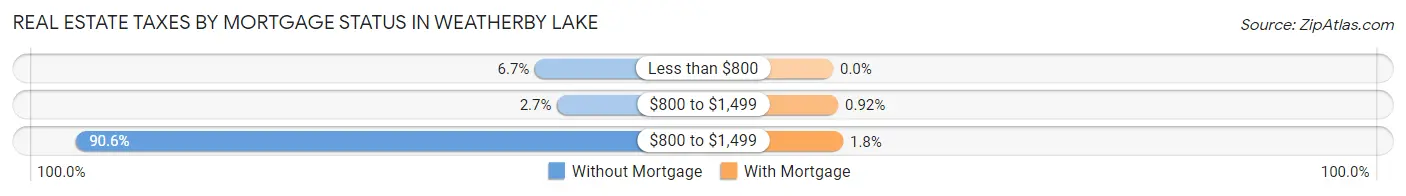
| Property Taxes | Without Mortgage | With Mortgage |
| Less than $800 | 25 (6.7%) | 0 (0.0%) |
| $800 to $1,499 | 10 (2.7%) | 5 (0.9%) |
| $800 to $1,499 | 336 (90.6%) | 10 (1.8%) |
| Total | 371 (100.0%) | 545 (100.0%) |
Health & Disability in Weatherby Lake
Health Insurance Coverage by Age in Weatherby Lake
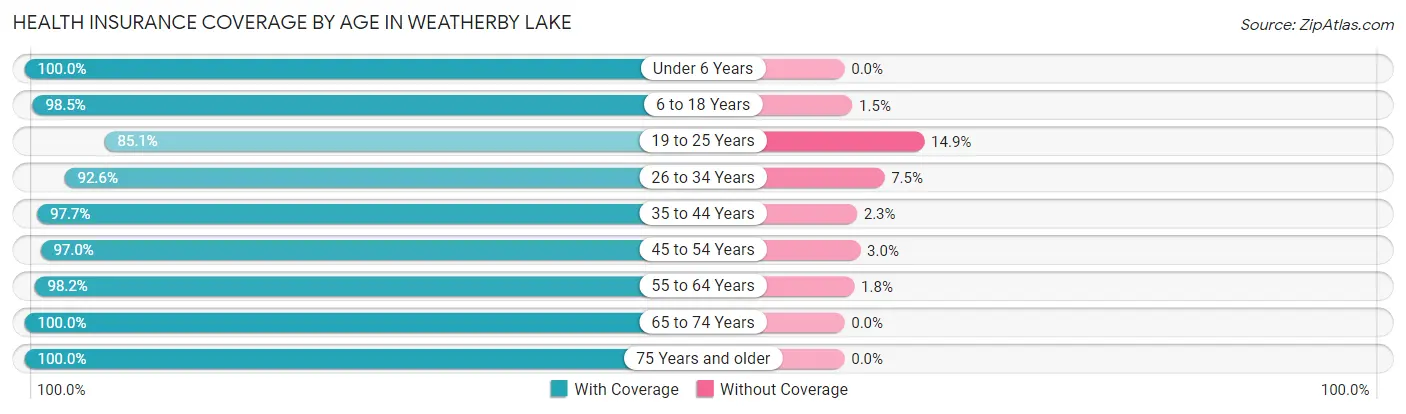
| Age Bracket | With Coverage | Without Coverage |
| Under 6 Years | 81 (100.0%) | 0 (0.0%) |
| 6 to 18 Years | 537 (98.5%) | 8 (1.5%) |
| 19 to 25 Years | 40 (85.1%) | 7 (14.9%) |
| 26 to 34 Years | 87 (92.5%) | 7 (7.4%) |
| 35 to 44 Years | 294 (97.7%) | 7 (2.3%) |
| 45 to 54 Years | 328 (97.0%) | 10 (3.0%) |
| 55 to 64 Years | 374 (98.2%) | 7 (1.8%) |
| 65 to 74 Years | 389 (100.0%) | 0 (0.0%) |
| 75 Years and older | 246 (100.0%) | 0 (0.0%) |
| Total | 2,376 (98.1%) | 46 (1.9%) |
Health Insurance Coverage by Citizenship Status in Weatherby Lake
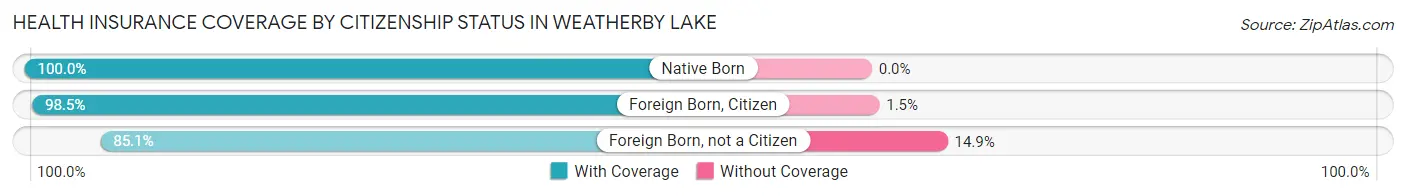
| Citizenship Status | With Coverage | Without Coverage |
| Native Born | 81 (100.0%) | 0 (0.0%) |
| Foreign Born, Citizen | 537 (98.5%) | 8 (1.5%) |
| Foreign Born, not a Citizen | 40 (85.1%) | 7 (14.9%) |
Health Insurance Coverage by Household Income in Weatherby Lake
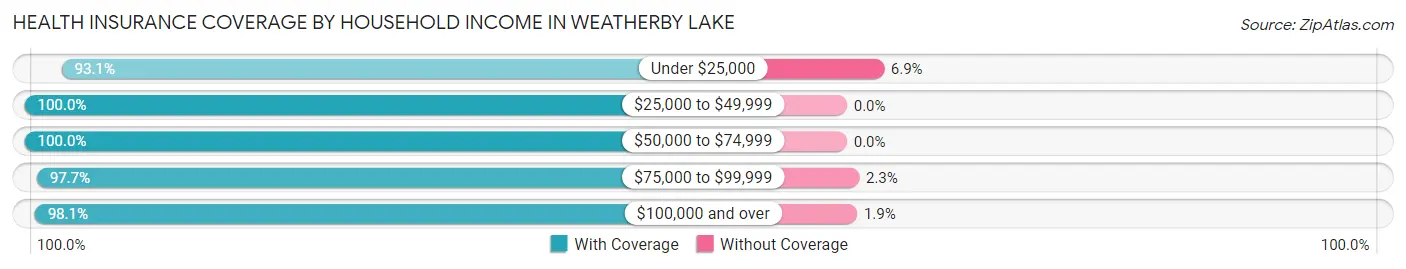
| Household Income | With Coverage | Without Coverage |
| Under $25,000 | 67 (93.1%) | 5 (6.9%) |
| $25,000 to $49,999 | 70 (100.0%) | 0 (0.0%) |
| $50,000 to $74,999 | 162 (100.0%) | 0 (0.0%) |
| $75,000 to $99,999 | 171 (97.7%) | 4 (2.3%) |
| $100,000 and over | 1,898 (98.1%) | 37 (1.9%) |
Public vs Private Health Insurance Coverage by Age in Weatherby Lake
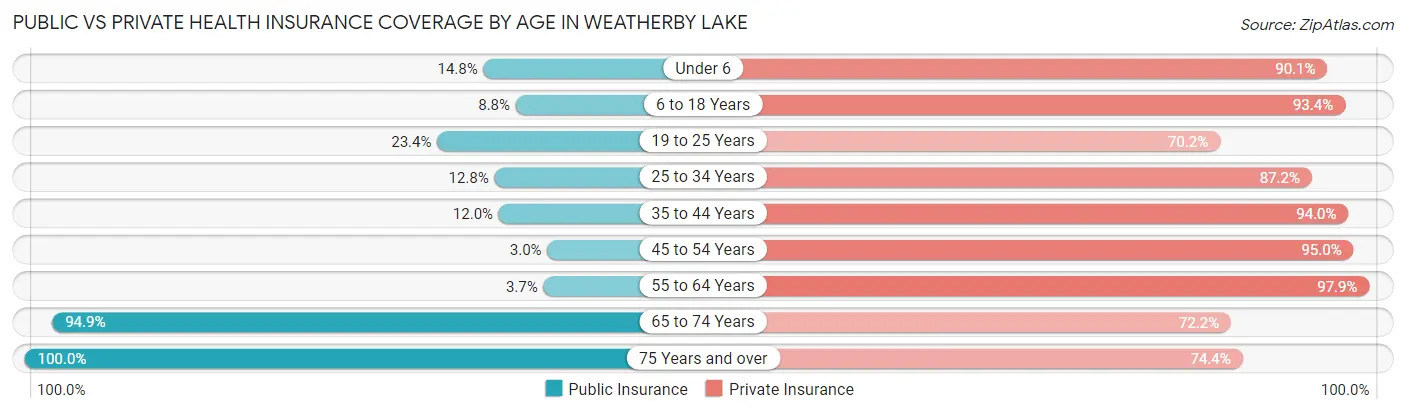
| Age Bracket | Public Insurance | Private Insurance |
| Under 6 | 12 (14.8%) | 73 (90.1%) |
| 6 to 18 Years | 48 (8.8%) | 509 (93.4%) |
| 19 to 25 Years | 11 (23.4%) | 33 (70.2%) |
| 25 to 34 Years | 12 (12.8%) | 82 (87.2%) |
| 35 to 44 Years | 36 (12.0%) | 283 (94.0%) |
| 45 to 54 Years | 10 (3.0%) | 321 (95.0%) |
| 55 to 64 Years | 14 (3.7%) | 373 (97.9%) |
| 65 to 74 Years | 369 (94.9%) | 281 (72.2%) |
| 75 Years and over | 246 (100.0%) | 183 (74.4%) |
| Total | 758 (31.3%) | 2,138 (88.3%) |
Disability Status by Sex by Age in Weatherby Lake
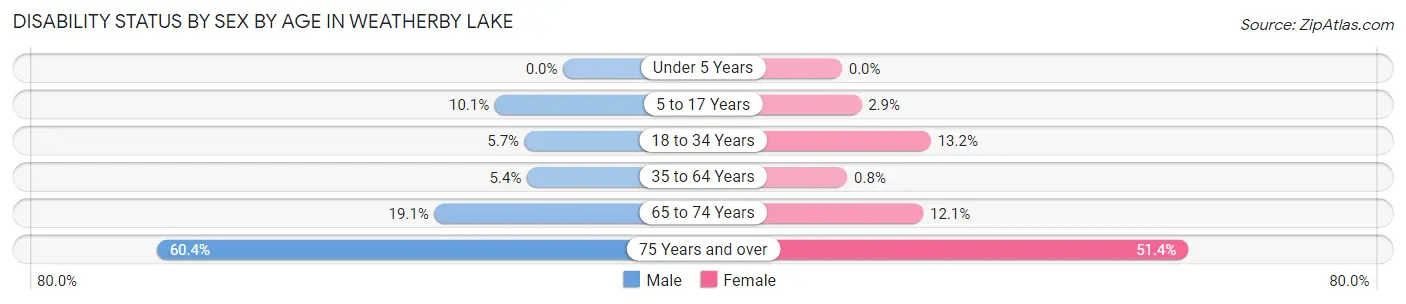
| Age Bracket | Male | Female |
| Under 5 Years | 0 (0.0%) | 0 (0.0%) |
| 5 to 17 Years | 29 (10.1%) | 7 (2.9%) |
| 18 to 34 Years | 4 (5.7%) | 14 (13.2%) |
| 35 to 64 Years | 28 (5.4%) | 4 (0.8%) |
| 65 to 74 Years | 30 (19.1%) | 28 (12.1%) |
| 75 Years and over | 64 (60.4%) | 72 (51.4%) |
Disability Class by Sex by Age in Weatherby Lake
Disability Class: Hearing Difficulty
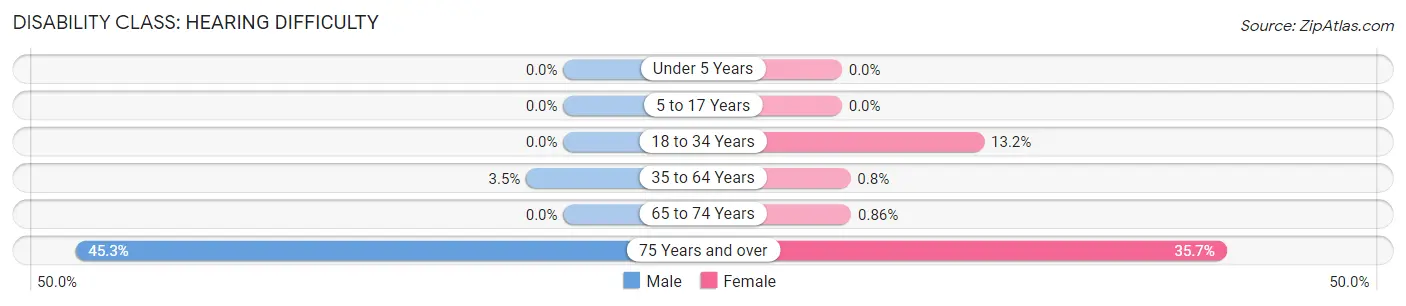
| Age Bracket | Male | Female |
| Under 5 Years | 0 (0.0%) | 0 (0.0%) |
| 5 to 17 Years | 0 (0.0%) | 0 (0.0%) |
| 18 to 34 Years | 0 (0.0%) | 14 (13.2%) |
| 35 to 64 Years | 18 (3.5%) | 4 (0.8%) |
| 65 to 74 Years | 0 (0.0%) | 2 (0.9%) |
| 75 Years and over | 48 (45.3%) | 50 (35.7%) |
Disability Class: Vision Difficulty
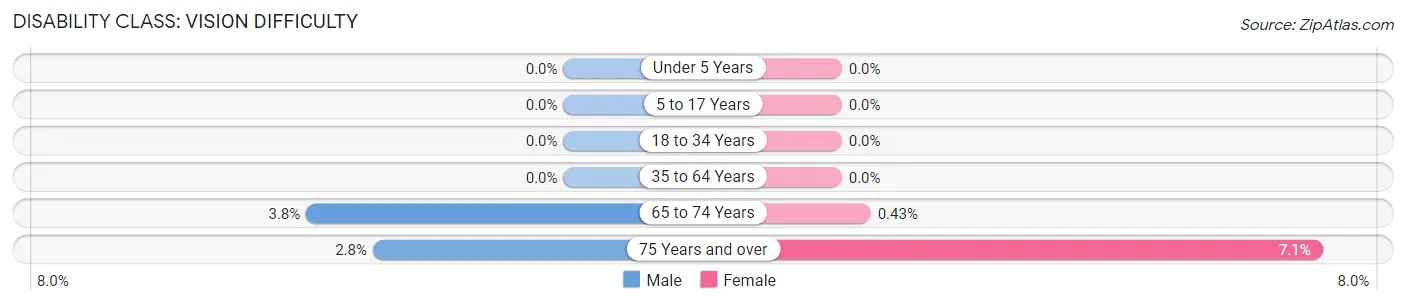
| Age Bracket | Male | Female |
| Under 5 Years | 0 (0.0%) | 0 (0.0%) |
| 5 to 17 Years | 0 (0.0%) | 0 (0.0%) |
| 18 to 34 Years | 0 (0.0%) | 0 (0.0%) |
| 35 to 64 Years | 0 (0.0%) | 0 (0.0%) |
| 65 to 74 Years | 6 (3.8%) | 1 (0.4%) |
| 75 Years and over | 3 (2.8%) | 10 (7.1%) |
Disability Class: Cognitive Difficulty
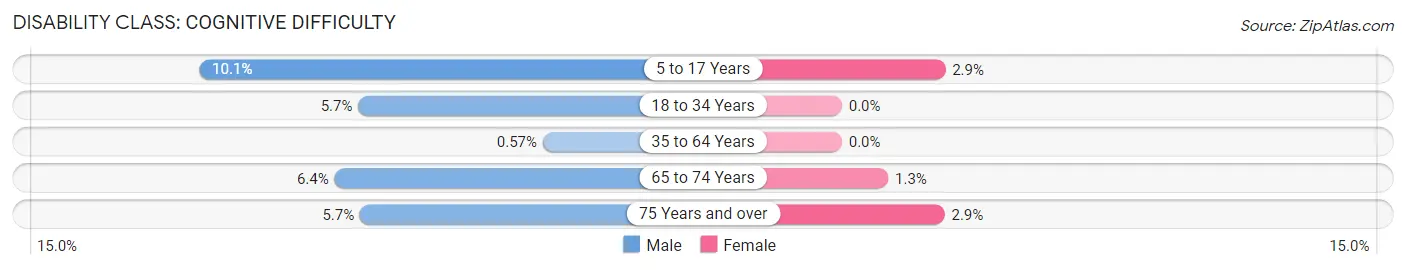
| Age Bracket | Male | Female |
| 5 to 17 Years | 29 (10.1%) | 7 (2.9%) |
| 18 to 34 Years | 4 (5.7%) | 0 (0.0%) |
| 35 to 64 Years | 3 (0.6%) | 0 (0.0%) |
| 65 to 74 Years | 10 (6.4%) | 3 (1.3%) |
| 75 Years and over | 6 (5.7%) | 4 (2.9%) |
Disability Class: Ambulatory Difficulty
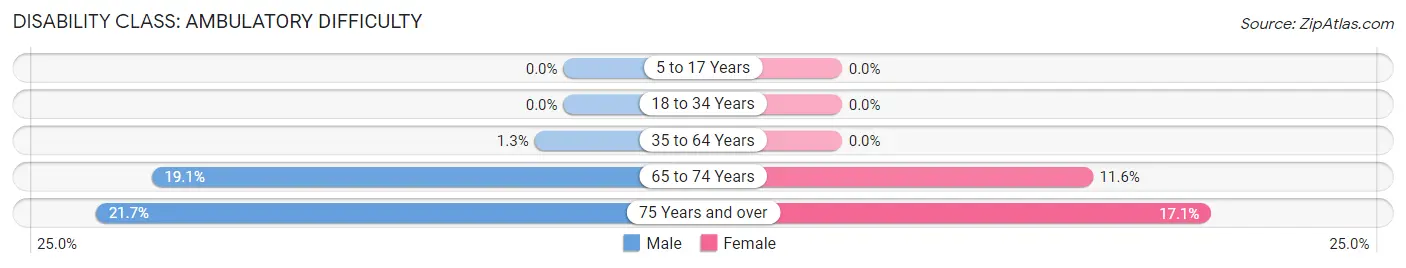
| Age Bracket | Male | Female |
| 5 to 17 Years | 0 (0.0%) | 0 (0.0%) |
| 18 to 34 Years | 0 (0.0%) | 0 (0.0%) |
| 35 to 64 Years | 7 (1.3%) | 0 (0.0%) |
| 65 to 74 Years | 30 (19.1%) | 27 (11.6%) |
| 75 Years and over | 23 (21.7%) | 24 (17.1%) |
Disability Class: Self-Care Difficulty
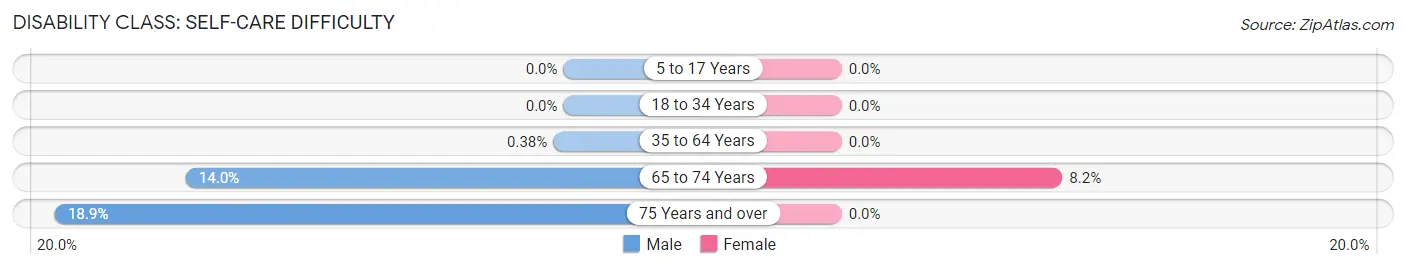
| Age Bracket | Male | Female |
| 5 to 17 Years | 0 (0.0%) | 0 (0.0%) |
| 18 to 34 Years | 0 (0.0%) | 0 (0.0%) |
| 35 to 64 Years | 2 (0.4%) | 0 (0.0%) |
| 65 to 74 Years | 22 (14.0%) | 19 (8.2%) |
| 75 Years and over | 20 (18.9%) | 0 (0.0%) |
Technology Access in Weatherby Lake
Computing Device Access in Weatherby Lake
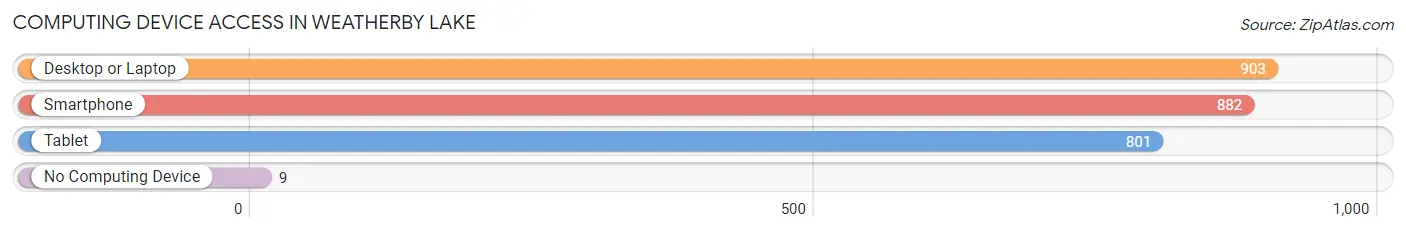
| Device Type | # Households | % Households |
| Desktop or Laptop | 903 | 96.1% |
| Smartphone | 882 | 93.8% |
| Tablet | 801 | 85.2% |
| No Computing Device | 9 | 1.0% |
| Total | 940 | 100.0% |
Internet Access in Weatherby Lake
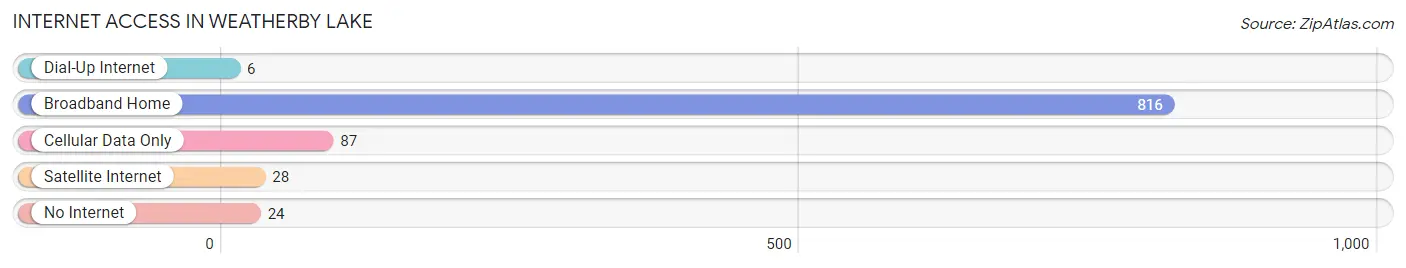
| Internet Type | # Households | % Households |
| Dial-Up Internet | 6 | 0.6% |
| Broadband Home | 816 | 86.8% |
| Cellular Data Only | 87 | 9.3% |
| Satellite Internet | 28 | 3.0% |
| No Internet | 24 | 2.5% |
| Total | 940 | 100.0% |
Weatherby Lake Summary
Introduction
Located in Platte County, Missouri, the small city of Weatherby Lake is a suburb of Kansas City. With a population of just over 1,000 people, Weatherby Lake is a small, tight-knit community that is known for its beautiful lake and its close proximity to the larger city of Kansas City. This paper will explore the history, geography, economy, and demographics of Weatherby Lake, Missouri.
History
Weatherby Lake was founded in the late 1800s by a man named William Weatherby. Weatherby was a wealthy businessman from Kansas City who wanted to create a lake for recreational purposes. He purchased the land and began to build the lake, which was completed in 1891. The lake was named after him and the surrounding area became known as Weatherby Lake.
In the early 1900s, the area began to grow as more people moved to the area. The town was incorporated in 1921 and the population began to grow steadily. In the 1950s, the city began to expand and develop, with the construction of new homes and businesses.
Geography
Weatherby Lake is located in Platte County, Missouri, just north of Kansas City. The city is situated on the banks of the Weatherby Lake, which is a man-made lake that was created in the late 1800s. The lake is approximately 1,000 acres in size and is a popular destination for fishing, boating, and other recreational activities.
The city is located in the Missouri River Valley, which is a region of rolling hills and valleys. The city is surrounded by farmland and is located near the Missouri River. The climate in Weatherby Lake is humid and subtropical, with hot summers and mild winters.
Economy
The economy of Weatherby Lake is largely based on tourism and recreation. The city is home to several businesses that cater to tourists, such as restaurants, hotels, and marinas. The city is also home to several manufacturing companies, such as a plastics factory and a metal fabrication plant.
The city is also home to several small businesses, such as retail stores, auto repair shops, and other service-based businesses. The city is also home to several large employers, such as the University of Missouri-Kansas City and the Kansas City Chiefs football team.
Demographics
As of the 2010 census, the population of Weatherby Lake was 1,072. The population is predominantly white, with a small percentage of African Americans and Hispanics. The median household income is $50,000, and the median age is 44.
Conclusion
Weatherby Lake, Missouri is a small city located in Platte County, just north of Kansas City. The city is known for its beautiful lake and its close proximity to the larger city of Kansas City. The city has a rich history, and its economy is largely based on tourism and recreation. The population is predominantly white, with a small percentage of African Americans and Hispanics. Weatherby Lake is a small, tight-knit community that is a great place to live and work.
Common Questions
What is Per Capita Income in Weatherby Lake?
Per Capita income in Weatherby Lake is $72,467.
What is the Median Family Income in Weatherby Lake?
Median Family Income in Weatherby Lake is $175,750.
What is the Median Household income in Weatherby Lake?
Median Household Income in Weatherby Lake is $164,444.
What is Income or Wage Gap in Weatherby Lake?
Income or Wage Gap in Weatherby Lake is 47.6%.
Women in Weatherby Lake earn 52.4 cents for every dollar earned by a man.
What is Family Income Deficit in Weatherby Lake?
Family Income Deficit in Weatherby Lake is $9,289.
Families that are below poverty line in Weatherby Lake earn $9,289 less on average than the poverty threshold level.
What is Inequality or Gini Index in Weatherby Lake?
Inequality or Gini Index in Weatherby Lake is 0.40.
What is the Total Population of Weatherby Lake?
Total Population of Weatherby Lake is 2,422.
What is the Total Male Population of Weatherby Lake?
Total Male Population of Weatherby Lake is 1,176.
What is the Total Female Population of Weatherby Lake?
Total Female Population of Weatherby Lake is 1,246.
What is the Ratio of Males per 100 Females in Weatherby Lake?
There are 94.38 Males per 100 Females in Weatherby Lake.
What is the Ratio of Females per 100 Males in Weatherby Lake?
There are 105.95 Females per 100 Males in Weatherby Lake.
What is the Median Population Age in Weatherby Lake?
Median Population Age in Weatherby Lake is 49.3 Years.
What is the Average Family Size in Weatherby Lake
Average Family Size in Weatherby Lake is 2.9 People.
What is the Average Household Size in Weatherby Lake
Average Household Size in Weatherby Lake is 2.6 People.
How Large is the Labor Force in Weatherby Lake?
There are 1,229 People in the Labor Forcein in Weatherby Lake.
What is the Percentage of People in the Labor Force in Weatherby Lake?
63.4% of People are in the Labor Force in Weatherby Lake.
What is the Unemployment Rate in Weatherby Lake?
Unemployment Rate in Weatherby Lake is 1.9%.