Fairview, MO Map & Demographics
Fairview Map
Fairview Overview
$18,487
PER CAPITA INCOME
$52,188
AVG FAMILY INCOME
$51,563
AVG HOUSEHOLD INCOME
0.36
INEQUALITY / GINI INDEX
398
TOTAL POPULATION
189
MALE POPULATION
209
FEMALE POPULATION
90.43
MALES / 100 FEMALES
110.58
FEMALES / 100 MALES
35.5
MEDIAN AGE
3.3
AVG FAMILY SIZE
3.1
AVG HOUSEHOLD SIZE
173
LABOR FORCE [ PEOPLE ]
56.5%
PERCENT IN LABOR FORCE
24.9%
UNEMPLOYMENT RATE
Fairview Zip Codes
Fairview Area Codes
Income in Fairview
Income Overview in Fairview
Per Capita Income in Fairview is $18,487, while median incomes of families and households are $52,188 and $51,563 respectively.
| Characteristic | Number | Measure |
| Per Capita Income | 398 | $18,487 |
| Median Family Income | 109 | $52,188 |
| Mean Family Income | 109 | $56,730 |
| Median Household Income | 127 | $51,563 |
| Mean Household Income | 127 | $56,905 |
| Income Deficit | 109 | $0 |
| Wage / Income Gap (%) | 398 | 0.00% |
| Wage / Income Gap ($) | 398 | 100.00¢ per $1 |
| Gini / Inequality Index | 398 | 0.36 |
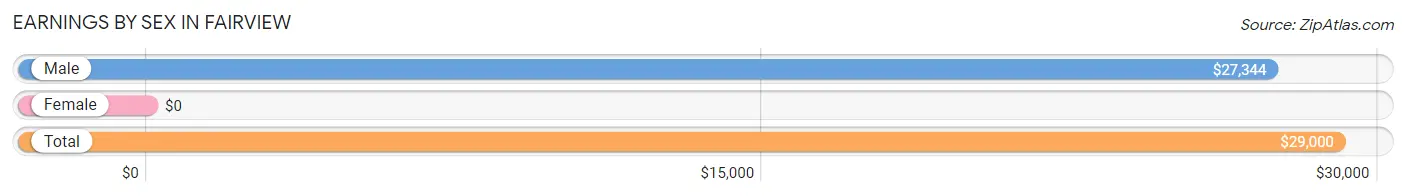
Earnings by Sex in Fairview
| Sex | Number | Average Earnings |
| Male | 67 (48.5%) | $27,344 |
| Female | 71 (51.4%) | $0 |
| Total | 138 (100.0%) | $29,000 |
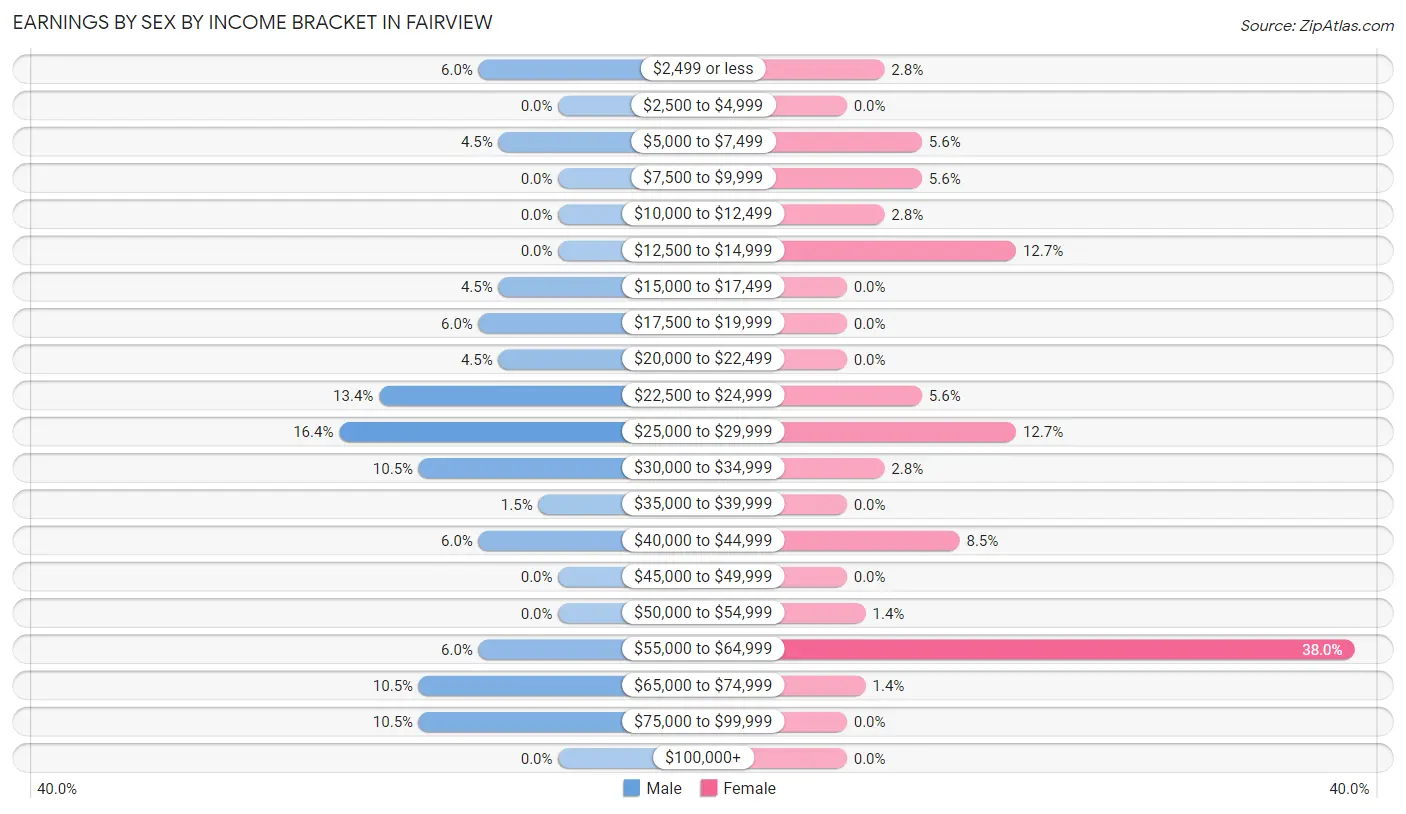
Earnings by Sex by Income Bracket in Fairview
The most common earnings brackets in Fairview are $25,000 to $29,999 for men (11 | 16.4%) and $55,000 to $64,999 for women (27 | 38.0%).
| Income | Male | Female |
| $2,499 or less | 4 (6.0%) | 2 (2.8%) |
| $2,500 to $4,999 | 0 (0.0%) | 0 (0.0%) |
| $5,000 to $7,499 | 3 (4.5%) | 4 (5.6%) |
| $7,500 to $9,999 | 0 (0.0%) | 4 (5.6%) |
| $10,000 to $12,499 | 0 (0.0%) | 2 (2.8%) |
| $12,500 to $14,999 | 0 (0.0%) | 9 (12.7%) |
| $15,000 to $17,499 | 3 (4.5%) | 0 (0.0%) |
| $17,500 to $19,999 | 4 (6.0%) | 0 (0.0%) |
| $20,000 to $22,499 | 3 (4.5%) | 0 (0.0%) |
| $22,500 to $24,999 | 9 (13.4%) | 4 (5.6%) |
| $25,000 to $29,999 | 11 (16.4%) | 9 (12.7%) |
| $30,000 to $34,999 | 7 (10.4%) | 2 (2.8%) |
| $35,000 to $39,999 | 1 (1.5%) | 0 (0.0%) |
| $40,000 to $44,999 | 4 (6.0%) | 6 (8.5%) |
| $45,000 to $49,999 | 0 (0.0%) | 0 (0.0%) |
| $50,000 to $54,999 | 0 (0.0%) | 1 (1.4%) |
| $55,000 to $64,999 | 4 (6.0%) | 27 (38.0%) |
| $65,000 to $74,999 | 7 (10.4%) | 1 (1.4%) |
| $75,000 to $99,999 | 7 (10.4%) | 0 (0.0%) |
| $100,000+ | 0 (0.0%) | 0 (0.0%) |
| Total | 67 (100.0%) | 71 (100.0%) |
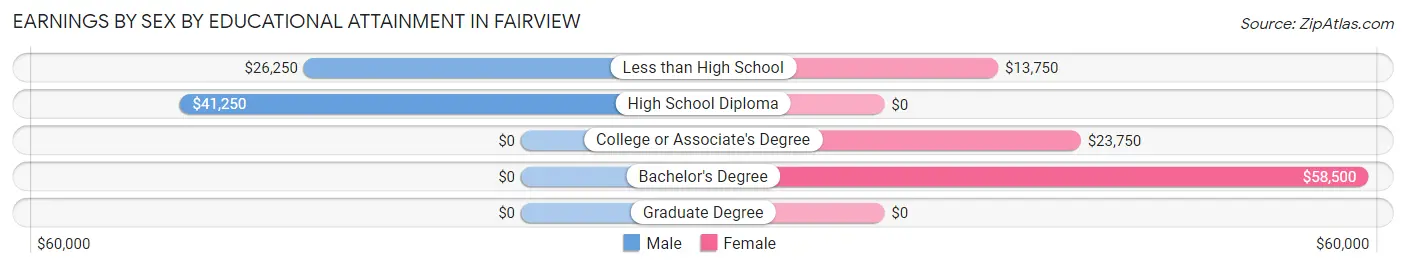
Earnings by Sex by Educational Attainment in Fairview
Average earnings in Fairview are $33,750 for men and $40,938 for women, a difference of 17.6%. Men with an educational attainment of high school diploma enjoy the highest average annual earnings of $41,250, while those with less than high school education earn the least with $26,250. Women with an educational attainment of bachelor's degree earn the most with the average annual earnings of $58,500, while those with less than high school education have the smallest earnings of $13,750.
| Educational Attainment | Male Income | Female Income |
| Less than High School | $26,250 | $13,750 |
| High School Diploma | $41,250 | $0 |
| College or Associate's Degree | - | - |
| Bachelor's Degree | - | - |
| Graduate Degree | - | - |
| Total | $33,750 | $40,938 |
Family Income in Fairview
Family Income Brackets in Fairview
According to the Fairview family income data, there are 40 families falling into the $50,000 to $74,999 income range, which is the most common income bracket and makes up 36.7% of all families.
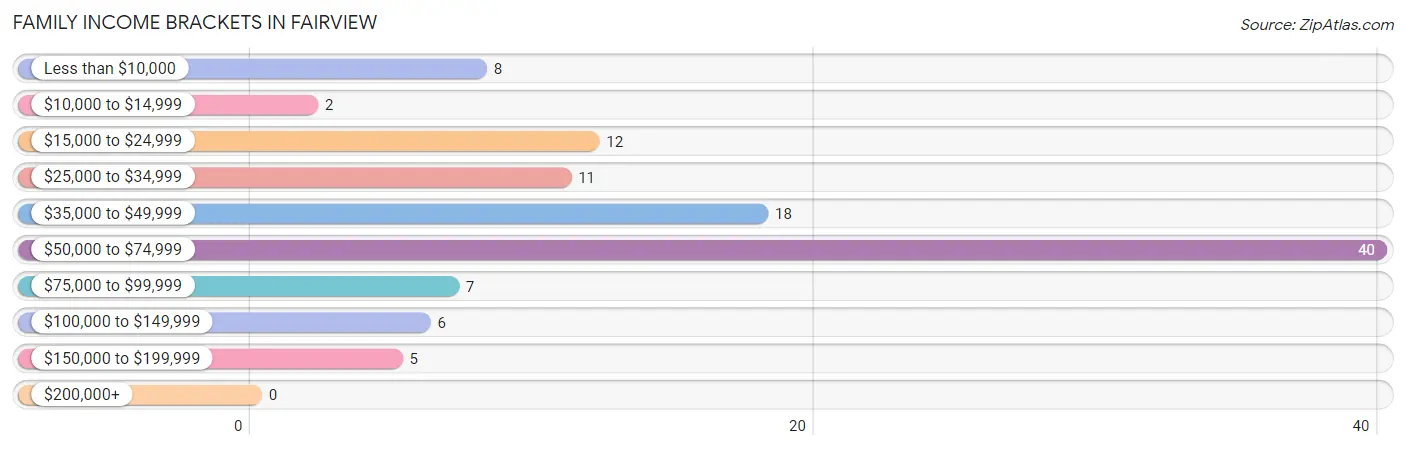
| Income Bracket | # Families | % Families |
| Less than $10,000 | 8 | 7.3% |
| $10,000 to $14,999 | 2 | 1.8% |
| $15,000 to $24,999 | 12 | 11.0% |
| $25,000 to $34,999 | 11 | 10.1% |
| $35,000 to $49,999 | 18 | 16.5% |
| $50,000 to $74,999 | 40 | 36.7% |
| $75,000 to $99,999 | 7 | 6.4% |
| $100,000 to $149,999 | 6 | 5.5% |
| $150,000 to $199,999 | 5 | 4.6% |
| $200,000+ | 0 | 0.0% |
Family Income by Famaliy Size in Fairview
3-person families (35 | 32.1%) account for the highest median family income in Fairview with $66,050 per family, while 2-person families (42 | 38.5%) have the highest median income of $24,107 per family member.
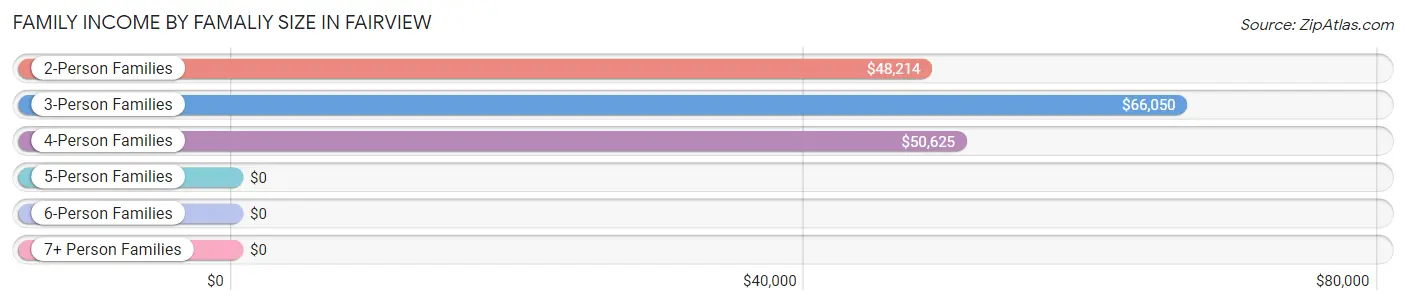
| Income Bracket | # Families | Median Income |
| 2-Person Families | 42 (38.5%) | $48,214 |
| 3-Person Families | 35 (32.1%) | $66,050 |
| 4-Person Families | 21 (19.3%) | $50,625 |
| 5-Person Families | 8 (7.3%) | $0 |
| 6-Person Families | 0 (0.0%) | $0 |
| 7+ Person Families | 3 (2.8%) | $0 |
| Total | 109 (100.0%) | $52,188 |
Family Income by Number of Earners in Fairview
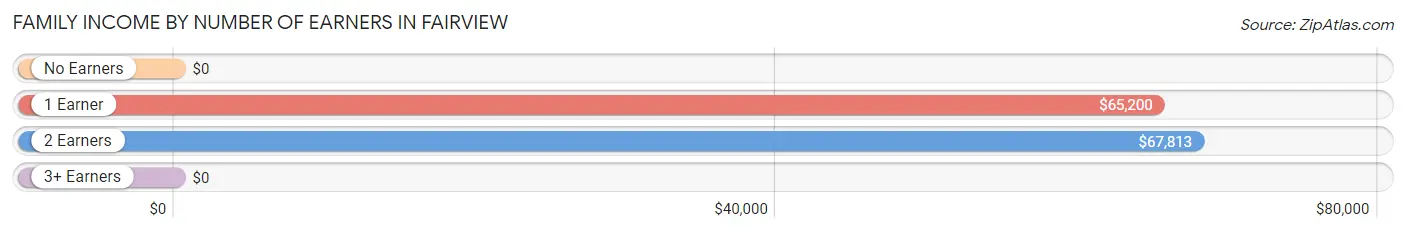
| Number of Earners | # Families | Median Income |
| No Earners | 24 (22.0%) | $0 |
| 1 Earner | 62 (56.9%) | $65,200 |
| 2 Earners | 19 (17.4%) | $67,813 |
| 3+ Earners | 4 (3.7%) | $0 |
| Total | 109 (100.0%) | $52,188 |
Household Income in Fairview
Household Income Brackets in Fairview
With 43 households falling in the category, the $50,000 to $74,999 income range is the most frequent in Fairview, accounting for 33.9% of all households.
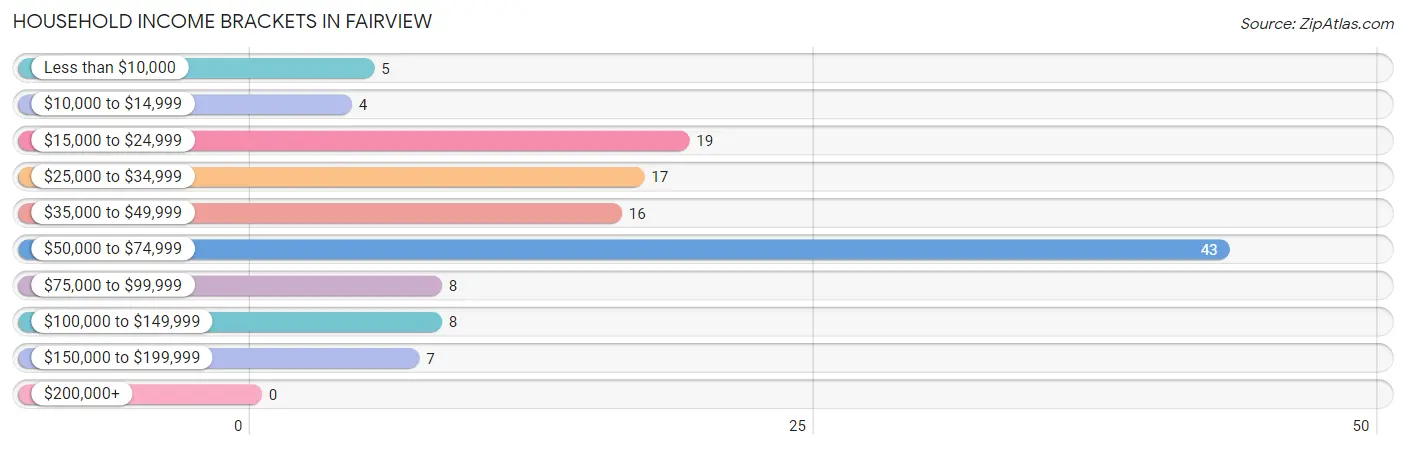
| Income Bracket | # Households | % Households |
| Less than $10,000 | 5 | 3.9% |
| $10,000 to $14,999 | 4 | 3.1% |
| $15,000 to $24,999 | 19 | 15.0% |
| $25,000 to $34,999 | 17 | 13.4% |
| $35,000 to $49,999 | 16 | 12.6% |
| $50,000 to $74,999 | 43 | 33.9% |
| $75,000 to $99,999 | 8 | 6.3% |
| $100,000 to $149,999 | 8 | 6.3% |
| $150,000 to $199,999 | 7 | 5.5% |
| $200,000+ | 0 | 0.0% |
Household Income by Householder Age in Fairview
The median household income in Fairview is $51,563, with the highest median household income of $66,058 found in the 45 to 64 years age bracket for the primary householder. A total of 54 households (42.5%) fall into this category. Meanwhile, the 15 to 24 years age bracket for the primary householder has the lowest median household income of $0, with 5 households (3.9%) in this group.
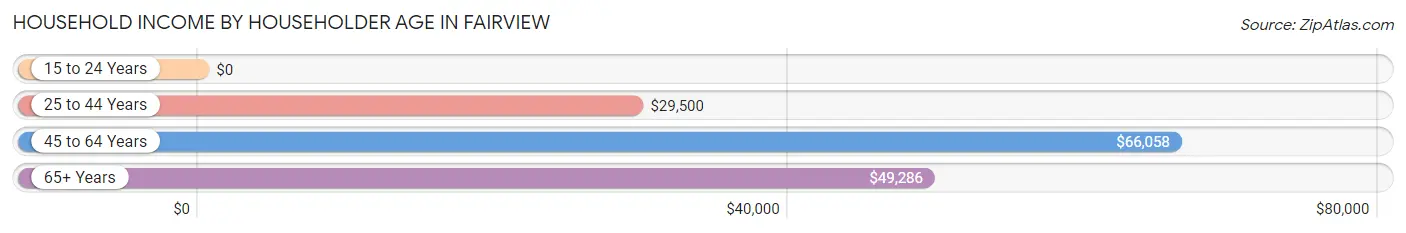
| Income Bracket | # Households | Median Income |
| 15 to 24 Years | 5 (3.9%) | $0 |
| 25 to 44 Years | 38 (29.9%) | $29,500 |
| 45 to 64 Years | 54 (42.5%) | $66,058 |
| 65+ Years | 30 (23.6%) | $49,286 |
| Total | 127 (100.0%) | $51,563 |
Poverty in Fairview
Income Below Poverty by Sex and Age in Fairview
With 17.5% poverty level for males and 42.1% for females among the residents of Fairview, 6 to 11 year old males and 5 year old females are the most vulnerable to poverty, with 11 males (73.3%) and 6 females (85.7%) in their respective age groups living below the poverty level.
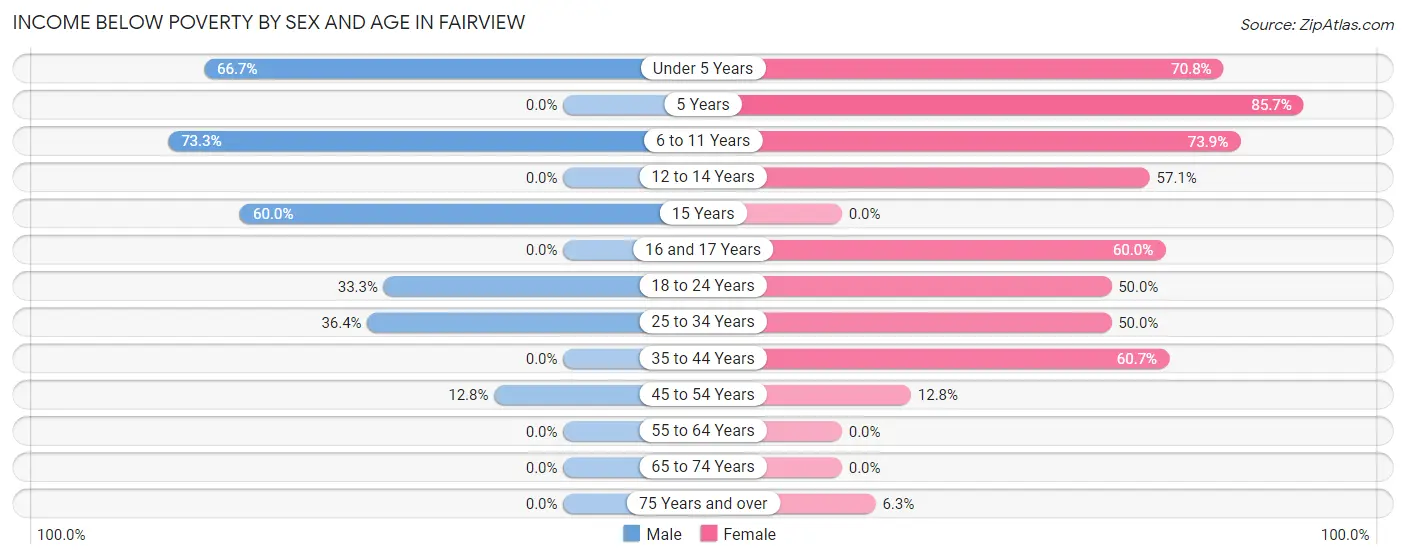
| Age Bracket | Male | Female |
| Under 5 Years | 4 (66.7%) | 17 (70.8%) |
| 5 Years | 0 (0.0%) | 6 (85.7%) |
| 6 to 11 Years | 11 (73.3%) | 17 (73.9%) |
| 12 to 14 Years | 0 (0.0%) | 4 (57.1%) |
| 15 Years | 3 (60.0%) | 0 (0.0%) |
| 16 and 17 Years | 0 (0.0%) | 3 (60.0%) |
| 18 to 24 Years | 6 (33.3%) | 6 (50.0%) |
| 25 to 34 Years | 4 (36.4%) | 12 (50.0%) |
| 35 to 44 Years | 0 (0.0%) | 17 (60.7%) |
| 45 to 54 Years | 5 (12.8%) | 5 (12.8%) |
| 55 to 64 Years | 0 (0.0%) | 0 (0.0%) |
| 65 to 74 Years | 0 (0.0%) | 0 (0.0%) |
| 75 Years and over | 0 (0.0%) | 1 (6.2%) |
| Total | 33 (17.5%) | 88 (42.1%) |
Income Above Poverty by Sex and Age in Fairview
According to the poverty statistics in Fairview, males aged 5 years and females aged 55 to 64 years are the age groups that are most secure financially, with 100.0% of males and 100.0% of females in these age groups living above the poverty line.
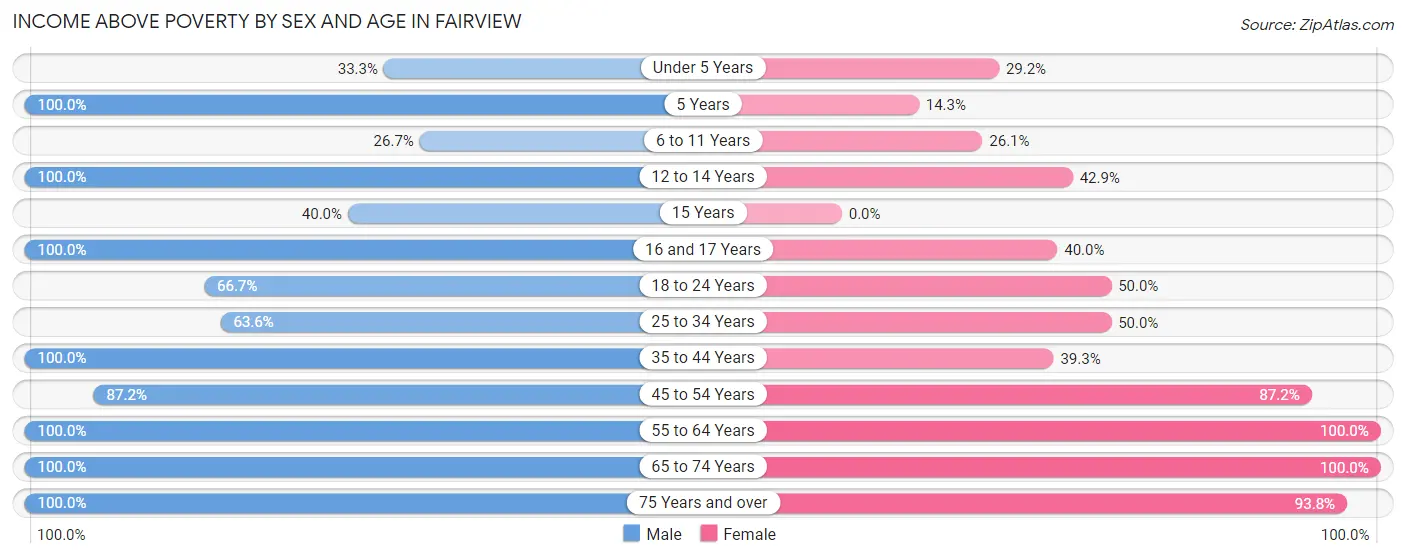
| Age Bracket | Male | Female |
| Under 5 Years | 2 (33.3%) | 7 (29.2%) |
| 5 Years | 1 (100.0%) | 1 (14.3%) |
| 6 to 11 Years | 4 (26.7%) | 6 (26.1%) |
| 12 to 14 Years | 4 (100.0%) | 3 (42.9%) |
| 15 Years | 2 (40.0%) | 0 (0.0%) |
| 16 and 17 Years | 31 (100.0%) | 2 (40.0%) |
| 18 to 24 Years | 12 (66.7%) | 6 (50.0%) |
| 25 to 34 Years | 7 (63.6%) | 12 (50.0%) |
| 35 to 44 Years | 22 (100.0%) | 11 (39.3%) |
| 45 to 54 Years | 34 (87.2%) | 34 (87.2%) |
| 55 to 64 Years | 9 (100.0%) | 10 (100.0%) |
| 65 to 74 Years | 13 (100.0%) | 14 (100.0%) |
| 75 Years and over | 15 (100.0%) | 15 (93.8%) |
| Total | 156 (82.5%) | 121 (57.9%) |
Income Below Poverty Among Married-Couple Families in Fairview
The poverty statistics for married-couple families in Fairview show that 6.3% or 5 of the total 79 families live below the poverty line. Families with 1 or 2 children have the highest poverty rate of 13.2%, comprising of 5 families. On the other hand, families with no children have the lowest poverty rate of 0.0%, which includes 0 families.
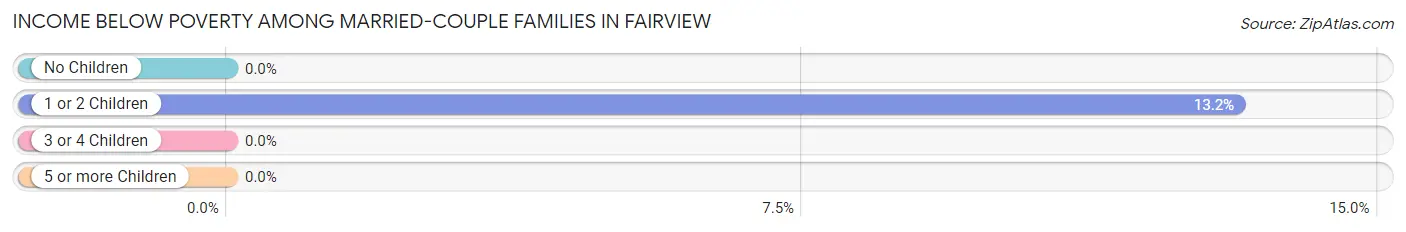
| Children | Above Poverty | Below Poverty |
| No Children | 38 (100.0%) | 0 (0.0%) |
| 1 or 2 Children | 33 (86.8%) | 5 (13.2%) |
| 3 or 4 Children | 3 (100.0%) | 0 (0.0%) |
| 5 or more Children | 0 (0.0%) | 0 (0.0%) |
| Total | 74 (93.7%) | 5 (6.3%) |
Income Below Poverty Among Single-Parent Households in Fairview
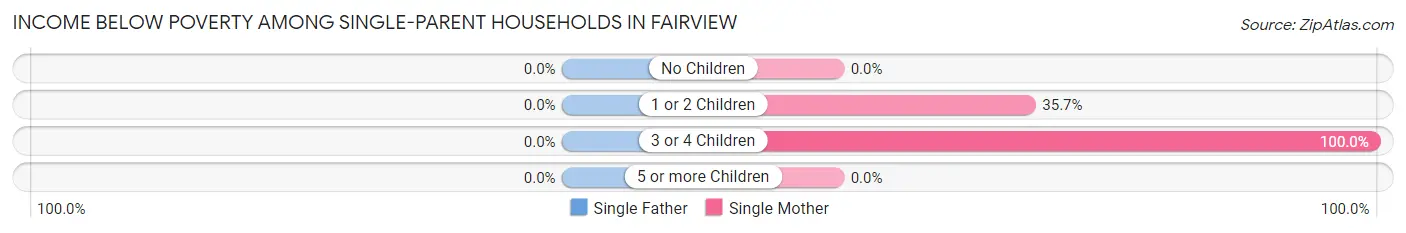
| Children | Single Father | Single Mother |
| No Children | 0 (0.0%) | 0 (0.0%) |
| 1 or 2 Children | 0 (0.0%) | 5 (35.7%) |
| 3 or 4 Children | 0 (0.0%) | 10 (100.0%) |
| 5 or more Children | 0 (0.0%) | 0 (0.0%) |
| Total | 0 (0.0%) | 15 (50.0%) |
Income Below Poverty Among Married-Couple vs Single-Parent Households in Fairview
The poverty data for Fairview shows that 5 of the married-couple family households (6.3%) and 15 of the single-parent households (50.0%) are living below the poverty level. Within the married-couple family households, those with 1 or 2 children have the highest poverty rate, with 5 households (13.2%) falling below the poverty line. Among the single-parent households, those with 3 or 4 children have the highest poverty rate, with 10 household (100.0%) living below poverty.
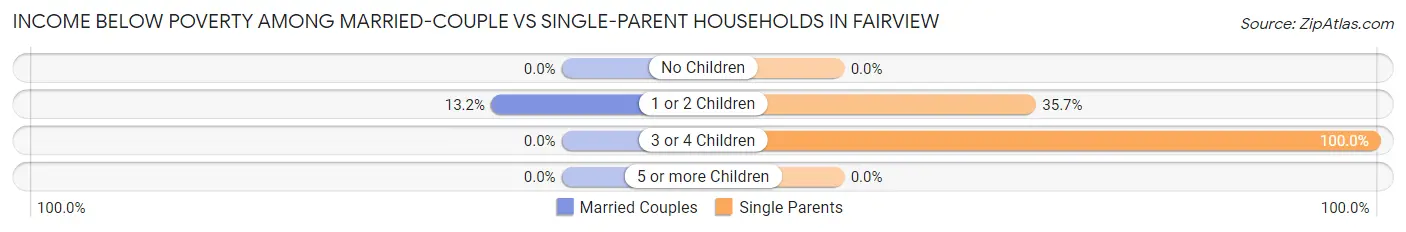
| Children | Married-Couple Families | Single-Parent Households |
| No Children | 0 (0.0%) | 0 (0.0%) |
| 1 or 2 Children | 5 (13.2%) | 5 (35.7%) |
| 3 or 4 Children | 0 (0.0%) | 10 (100.0%) |
| 5 or more Children | 0 (0.0%) | 0 (0.0%) |
| Total | 5 (6.3%) | 15 (50.0%) |
Race in Fairview
The most populous races in Fairview are White / Caucasian (257 | 64.6%), Two or more Races (122 | 30.6%), and Hispanic or Latino (69 | 17.3%).
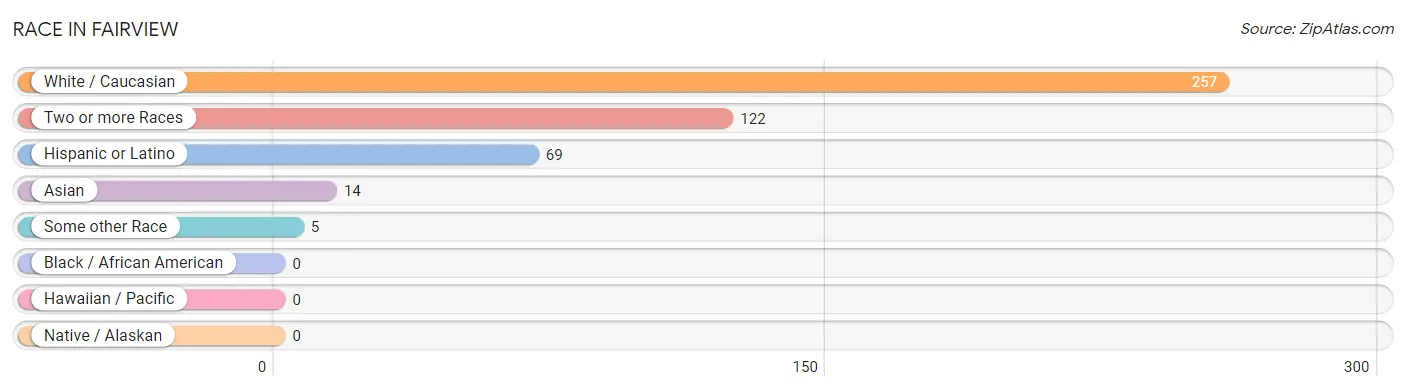
| Race | # Population | % Population |
| Asian | 14 | 3.5% |
| Black / African American | 0 | 0.0% |
| Hawaiian / Pacific | 0 | 0.0% |
| Hispanic or Latino | 69 | 17.3% |
| Native / Alaskan | 0 | 0.0% |
| White / Caucasian | 257 | 64.6% |
| Two or more Races | 122 | 30.6% |
| Some other Race | 5 | 1.3% |
| Total | 398 | 100.0% |
Ancestry in Fairview
The most populous ancestries reported in Fairview are German (102 | 25.6%), Irish (94 | 23.6%), Mexican (56 | 14.1%), English (35 | 8.8%), and Bangladeshi (14 | 3.5%), together accounting for 75.6% of all Fairview residents.
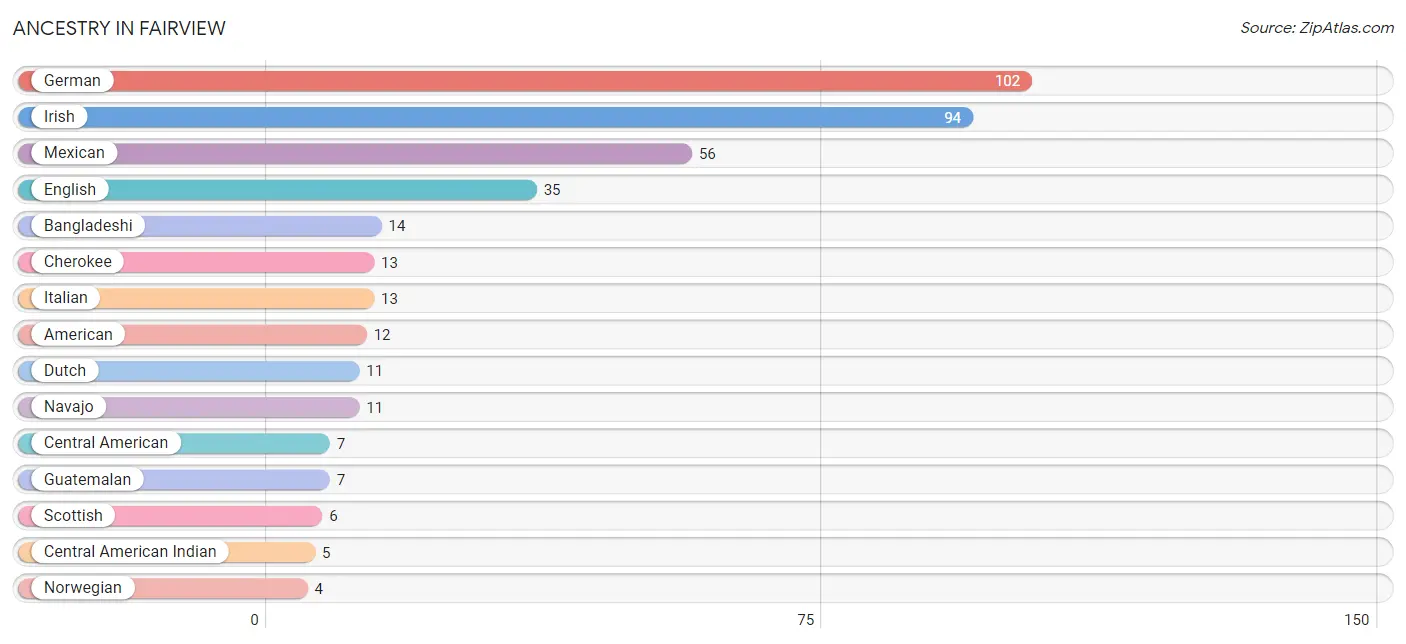
| Ancestry | # Population | % Population |
| American | 12 | 3.0% |
| Bangladeshi | 14 | 3.5% |
| Blackfeet | 3 | 0.7% |
| British | 2 | 0.5% |
| Central American | 7 | 1.8% |
| Central American Indian | 5 | 1.3% |
| Cherokee | 13 | 3.3% |
| Dutch | 11 | 2.8% |
| English | 35 | 8.8% |
| Finnish | 1 | 0.3% |
| French | 2 | 0.5% |
| German | 102 | 25.6% |
| Guatemalan | 7 | 1.8% |
| Irish | 94 | 23.6% |
| Italian | 13 | 3.3% |
| Mexican | 56 | 14.1% |
| Navajo | 11 | 2.8% |
| Norwegian | 4 | 1.0% |
| Russian | 2 | 0.5% |
| Scandinavian | 4 | 1.0% |
| Scotch-Irish | 2 | 0.5% |
| Scottish | 6 | 1.5% |
| Sri Lankan | 3 | 0.7% | View All 23 Rows |
Immigrants in Fairview
The most numerous immigrant groups reported in Fairview came from Central America (9 | 2.3%), Guatemala (9 | 2.3%), Latin America (9 | 2.3%), Europe (1 | 0.3%), and France (1 | 0.3%), together accounting for 7.3% of all Fairview residents.
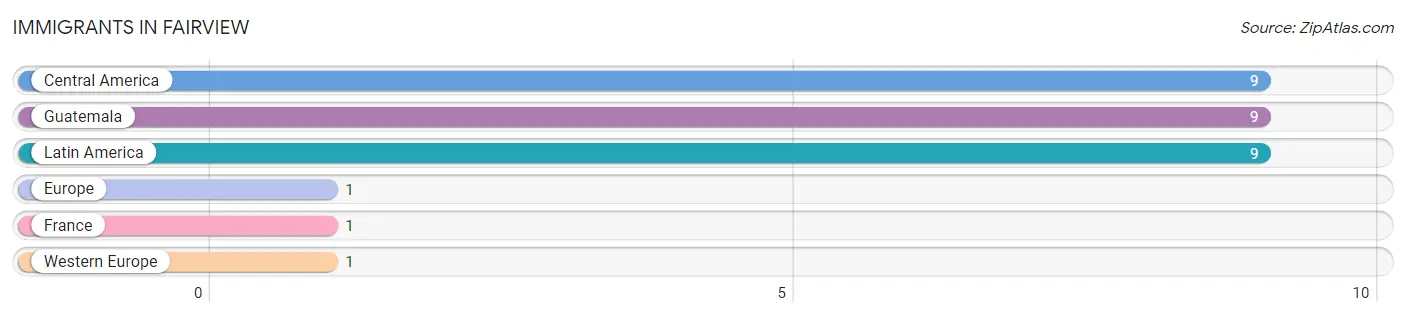
| Immigration Origin | # Population | % Population |
| Central America | 9 | 2.3% |
| Europe | 1 | 0.3% |
| France | 1 | 0.3% |
| Guatemala | 9 | 2.3% |
| Latin America | 9 | 2.3% |
| Western Europe | 1 | 0.3% | View All 6 Rows |
Sex and Age in Fairview
Sex and Age in Fairview
The most populous age groups in Fairview are 15 to 19 Years (36 | 19.1%) for men and 45 to 49 Years (38 | 18.2%) for women.
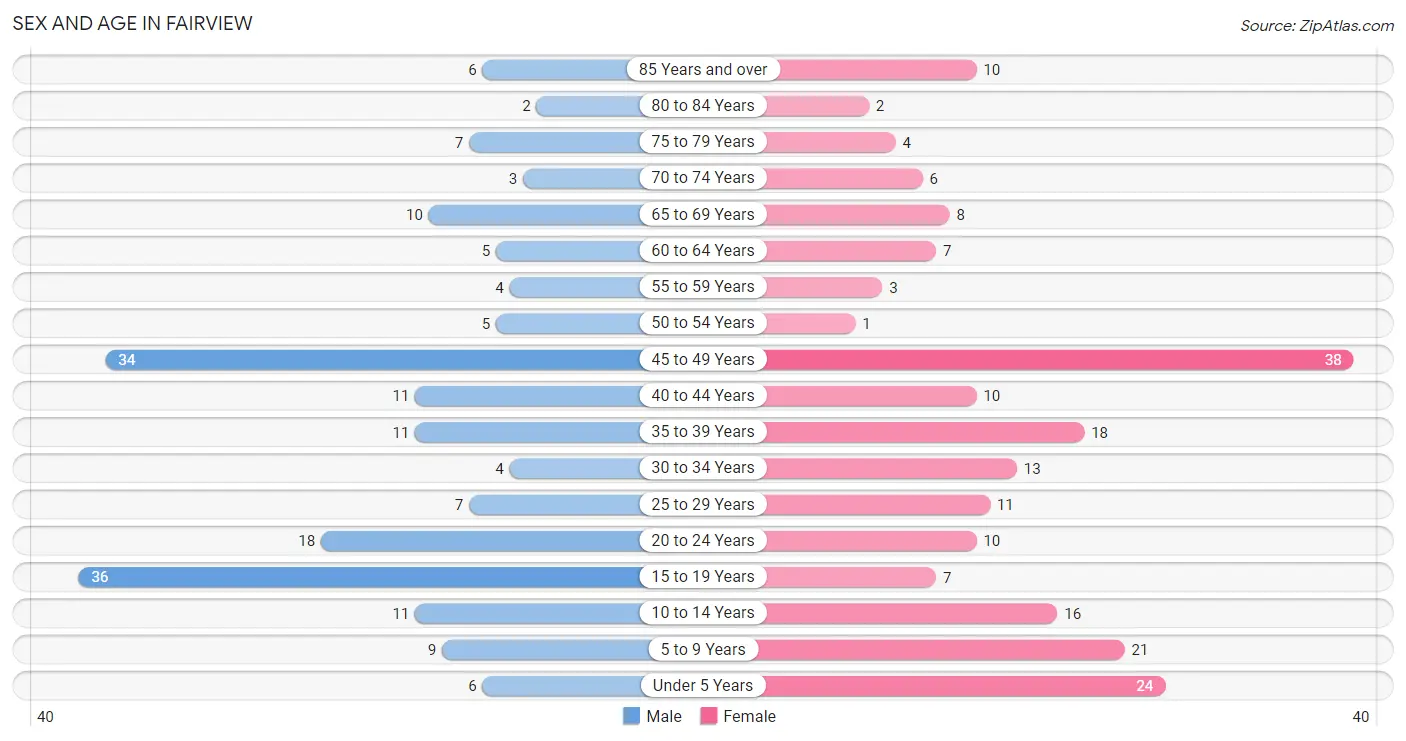
| Age Bracket | Male | Female |
| Under 5 Years | 6 (3.2%) | 24 (11.5%) |
| 5 to 9 Years | 9 (4.8%) | 21 (10.1%) |
| 10 to 14 Years | 11 (5.8%) | 16 (7.7%) |
| 15 to 19 Years | 36 (19.1%) | 7 (3.4%) |
| 20 to 24 Years | 18 (9.5%) | 10 (4.8%) |
| 25 to 29 Years | 7 (3.7%) | 11 (5.3%) |
| 30 to 34 Years | 4 (2.1%) | 13 (6.2%) |
| 35 to 39 Years | 11 (5.8%) | 18 (8.6%) |
| 40 to 44 Years | 11 (5.8%) | 10 (4.8%) |
| 45 to 49 Years | 34 (18.0%) | 38 (18.2%) |
| 50 to 54 Years | 5 (2.6%) | 1 (0.5%) |
| 55 to 59 Years | 4 (2.1%) | 3 (1.4%) |
| 60 to 64 Years | 5 (2.6%) | 7 (3.4%) |
| 65 to 69 Years | 10 (5.3%) | 8 (3.8%) |
| 70 to 74 Years | 3 (1.6%) | 6 (2.9%) |
| 75 to 79 Years | 7 (3.7%) | 4 (1.9%) |
| 80 to 84 Years | 2 (1.1%) | 2 (1.0%) |
| 85 Years and over | 6 (3.2%) | 10 (4.8%) |
| Total | 189 (100.0%) | 209 (100.0%) |
Families and Households in Fairview
Median Family Size in Fairview
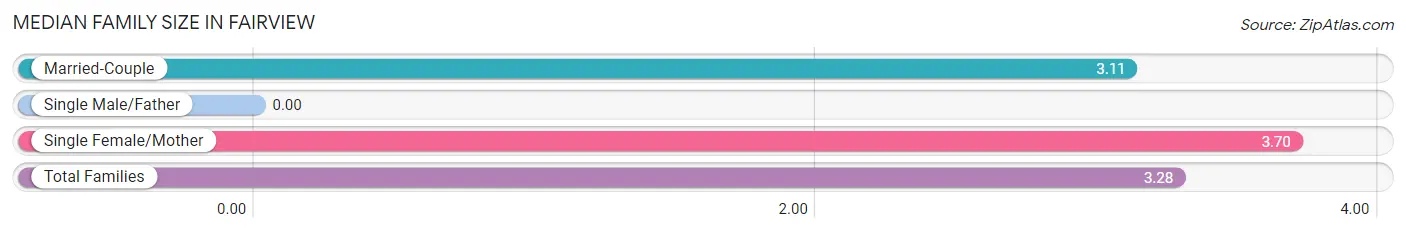
| Family Type | # Families | Family Size |
| Married-Couple | 79 (72.5%) | 3.11 |
| Single Male/Father | 0 (0.0%) | - |
| Single Female/Mother | 30 (27.5%) | 3.70 |
| Total Families | 109 (100.0%) | 3.28 |
Median Household Size in Fairview
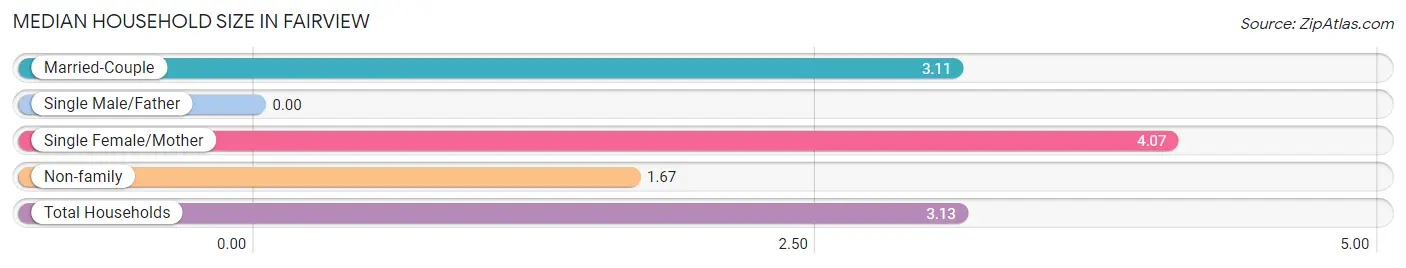
| Household Type | # Households | Household Size |
| Married-Couple | 79 (62.2%) | 3.11 |
| Single Male/Father | 0 (0.0%) | - |
| Single Female/Mother | 30 (23.6%) | 4.07 |
| Non-family | 18 (14.2%) | 1.67 |
| Total Households | 127 (100.0%) | 3.13 |
Household Size by Marriage Status in Fairview
Out of a total of 127 households in Fairview, 109 (85.8%) are family households, while 18 (14.2%) are nonfamily households. The most numerous type of family households are 2-person households, comprising 37, and the most common type of nonfamily households are 1-person households, comprising 9.
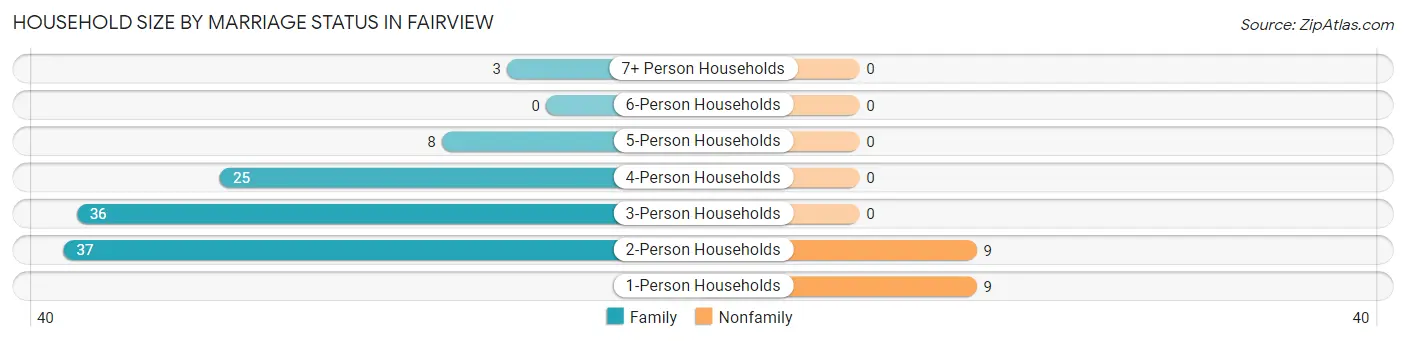
| Household Size | Family Households | Nonfamily Households |
| 1-Person Households | - | 9 (7.1%) |
| 2-Person Households | 37 (29.1%) | 9 (7.1%) |
| 3-Person Households | 36 (28.3%) | 0 (0.0%) |
| 4-Person Households | 25 (19.7%) | 0 (0.0%) |
| 5-Person Households | 8 (6.3%) | 0 (0.0%) |
| 6-Person Households | 0 (0.0%) | 0 (0.0%) |
| 7+ Person Households | 3 (2.4%) | 0 (0.0%) |
| Total | 109 (85.8%) | 18 (14.2%) |
Female Fertility in Fairview
Fertility by Age in Fairview
Average fertility rate in Fairview is 37.0 births per 1,000 women. Women in the age bracket of 20 to 34 years have the highest fertility rate with 88.0 births per 1,000 women. Women in the age bracket of 20 to 34 years acount for 75.0% of all women with births.
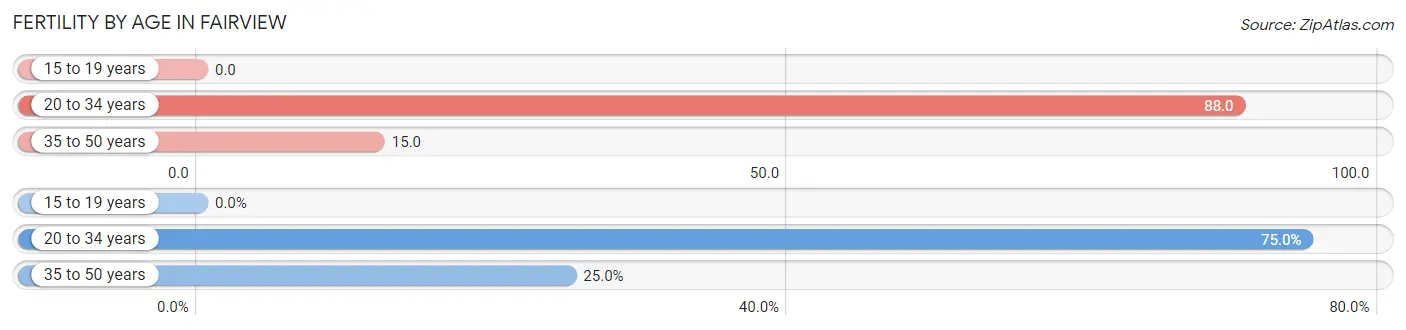
| Age Bracket | Women with Births | Births / 1,000 Women |
| 15 to 19 years | 0 (0.0%) | 0.0 |
| 20 to 34 years | 3 (75.0%) | 88.0 |
| 35 to 50 years | 1 (25.0%) | 15.0 |
| Total | 4 (100.0%) | 37.0 |
Fertility by Age by Marriage Status in Fairview
75.0% of women with births (4) in Fairview are married. The highest percentage of unmarried women with births falls into 35 to 50 years age bracket with 100.0% of them unmarried at the time of birth, while the lowest percentage of unmarried women with births belong to 20 to 34 years age bracket with 0.0% of them unmarried.
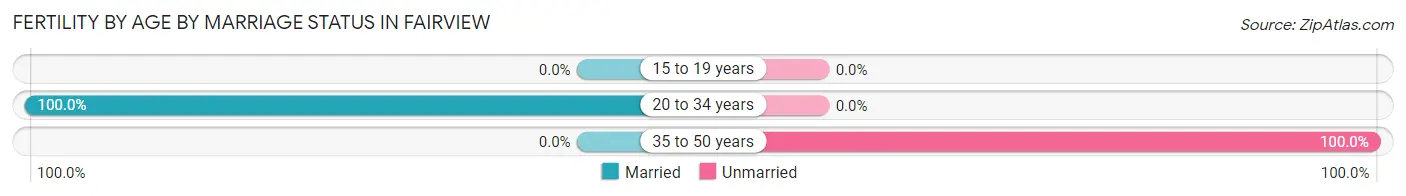
| Age Bracket | Married | Unmarried |
| 15 to 19 years | 0 (0.0%) | 0 (0.0%) |
| 20 to 34 years | 3 (100.0%) | 0 (0.0%) |
| 35 to 50 years | 0 (0.0%) | 1 (100.0%) |
| Total | 3 (75.0%) | 1 (25.0%) |
Fertility by Education in Fairview
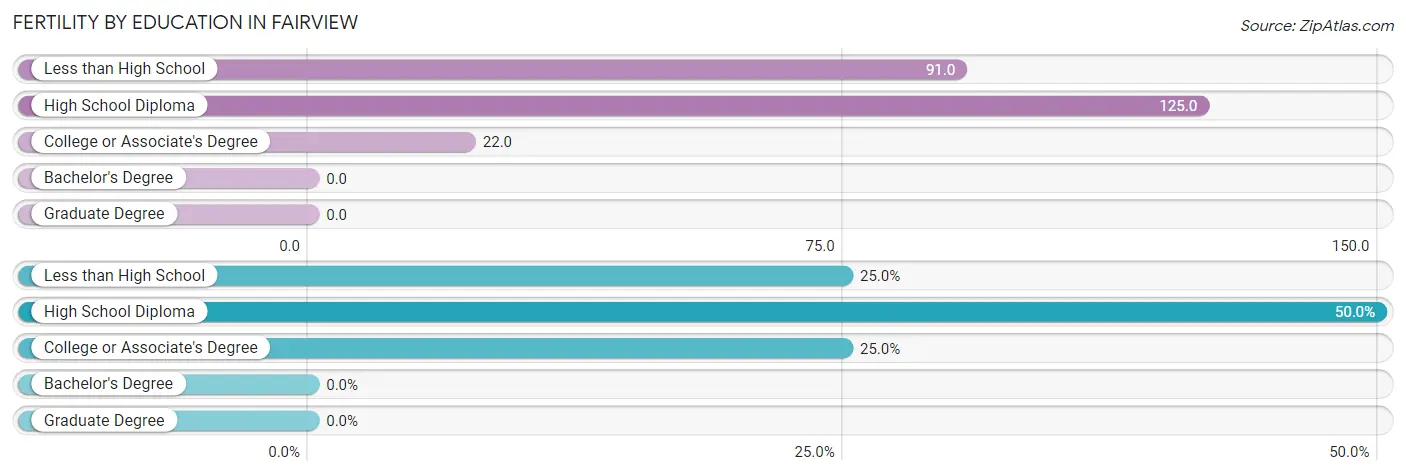
| Educational Attainment | Women with Births | Births / 1,000 Women |
| Less than High School | 1 (25.0%) | 91.0 |
| High School Diploma | 2 (50.0%) | 125.0 |
| College or Associate's Degree | 1 (25.0%) | 22.0 |
| Bachelor's Degree | 0 (0.0%) | 0.0 |
| Graduate Degree | 0 (0.0%) | 0.0 |
| Total | 4 (100.0%) | 37.0 |
Fertility by Education by Marriage Status in Fairview
25.0% of women with births in Fairview are unmarried. Women with the educational attainment of high school diploma are most likely to be married with 100.0% of them married at childbirth, while women with the educational attainment of less than high school are least likely to be married with 100.0% of them unmarried at childbirth.
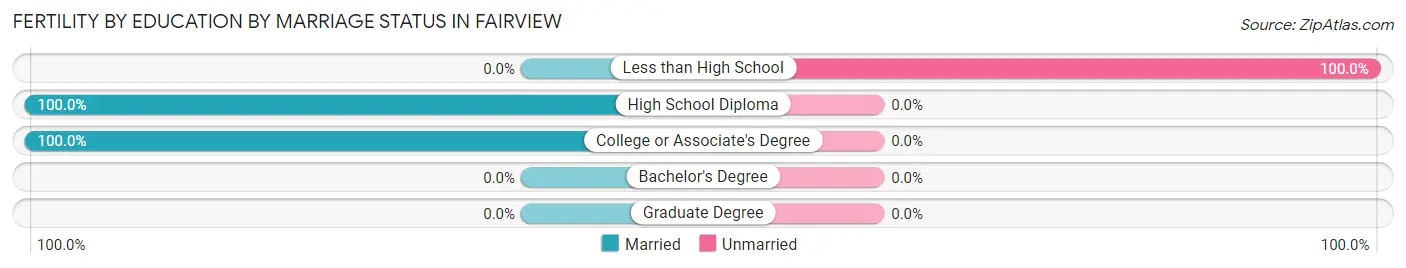
| Educational Attainment | Married | Unmarried |
| Less than High School | 0 (0.0%) | 1 (100.0%) |
| High School Diploma | 2 (100.0%) | 0 (0.0%) |
| College or Associate's Degree | 1 (100.0%) | 0 (0.0%) |
| Bachelor's Degree | 0 (0.0%) | 0 (0.0%) |
| Graduate Degree | 0 (0.0%) | 0 (0.0%) |
| Total | 3 (75.0%) | 1 (25.0%) |
Employment Characteristics in Fairview
Employment by Class of Employer in Fairview
Among the 130 employed individuals in Fairview, private company employees (108 | 83.1%), local government employees (10 | 7.7%), and self-employed (incorporated) (7 | 5.4%) make up the most common classes of employment.
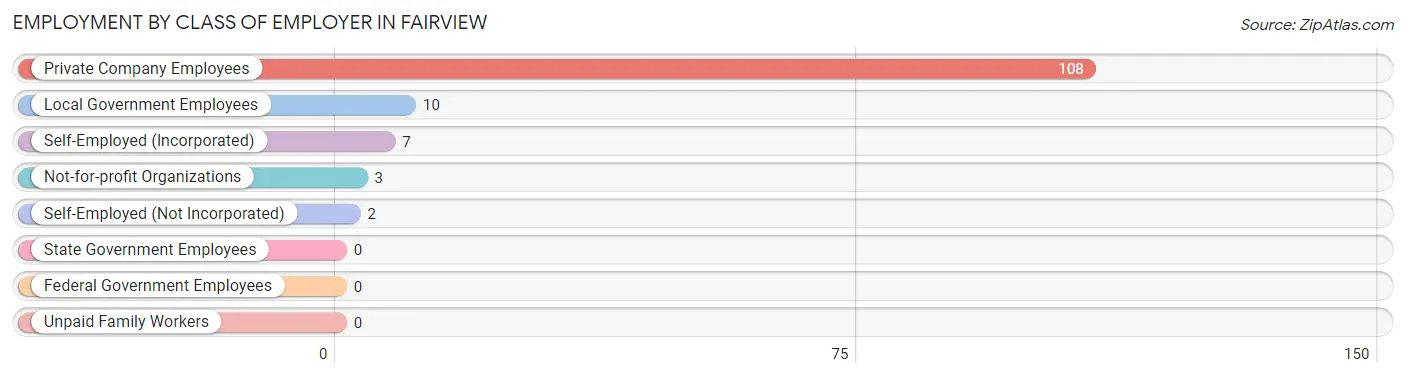
| Employer Class | # Employees | % Employees |
| Private Company Employees | 108 | 83.1% |
| Self-Employed (Incorporated) | 7 | 5.4% |
| Self-Employed (Not Incorporated) | 2 | 1.5% |
| Not-for-profit Organizations | 3 | 2.3% |
| Local Government Employees | 10 | 7.7% |
| State Government Employees | 0 | 0.0% |
| Federal Government Employees | 0 | 0.0% |
| Unpaid Family Workers | 0 | 0.0% |
| Total | 130 | 100.0% |
Employment Status by Age in Fairview
According to the labor force statistics for Fairview, out of the total population over 16 years of age (306), 56.5% or 173 individuals are in the labor force, with 24.9% or 43 of them unemployed. The age group with the highest labor force participation rate is 55 to 59 years, with 100.0% or 7 individuals in the labor force. Within the labor force, the 45 to 54 years age range has the highest percentage of unemployed individuals, with 37.9% or 25 of them being unemployed.
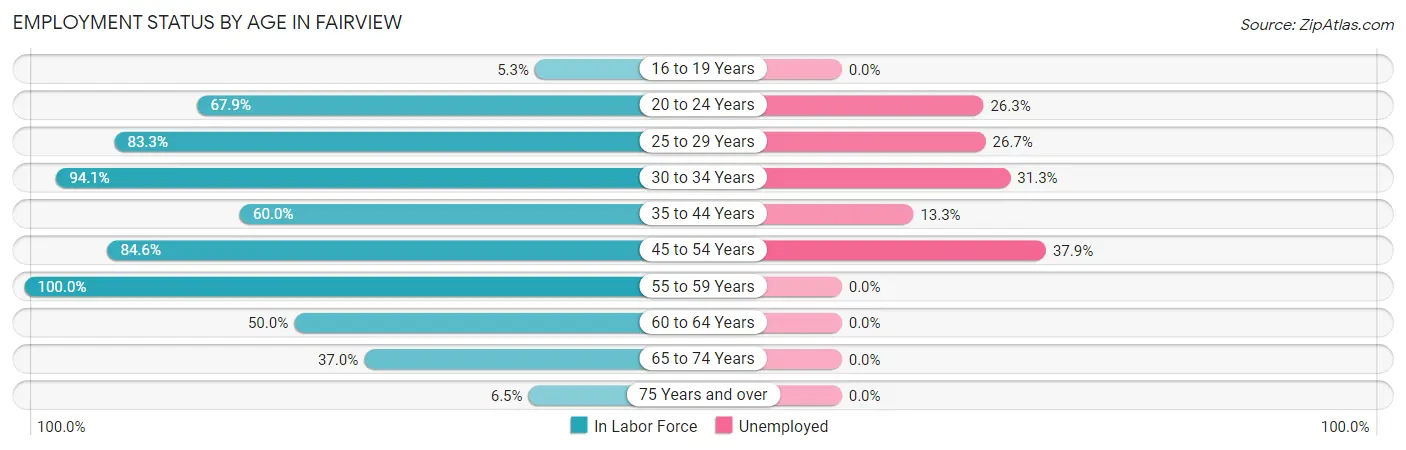
| Age Bracket | In Labor Force | Unemployed |
| 16 to 19 Years | 2 (5.3%) | 0 (0.0%) |
| 20 to 24 Years | 19 (67.9%) | 5 (26.3%) |
| 25 to 29 Years | 15 (83.3%) | 4 (26.7%) |
| 30 to 34 Years | 16 (94.1%) | 5 (31.3%) |
| 35 to 44 Years | 30 (60.0%) | 4 (13.3%) |
| 45 to 54 Years | 66 (84.6%) | 25 (37.9%) |
| 55 to 59 Years | 7 (100.0%) | 0 (0.0%) |
| 60 to 64 Years | 6 (50.0%) | 0 (0.0%) |
| 65 to 74 Years | 10 (37.0%) | 0 (0.0%) |
| 75 Years and over | 2 (6.5%) | 0 (0.0%) |
| Total | 173 (56.5%) | 43 (24.9%) |
Employment Status by Educational Attainment in Fairview
According to labor force statistics for Fairview, 76.9% of individuals (140) out of the total population between 25 and 64 years of age (182) are in the labor force, with 27.1% or 38 of them being unemployed. The group with the highest labor force participation rate are those with the educational attainment of bachelor's degree or higher, with 90.9% or 60 individuals in the labor force. Within the labor force, individuals with bachelor's degree or higher education have the highest percentage of unemployment, with 41.7% or 25 of them being unemployed.
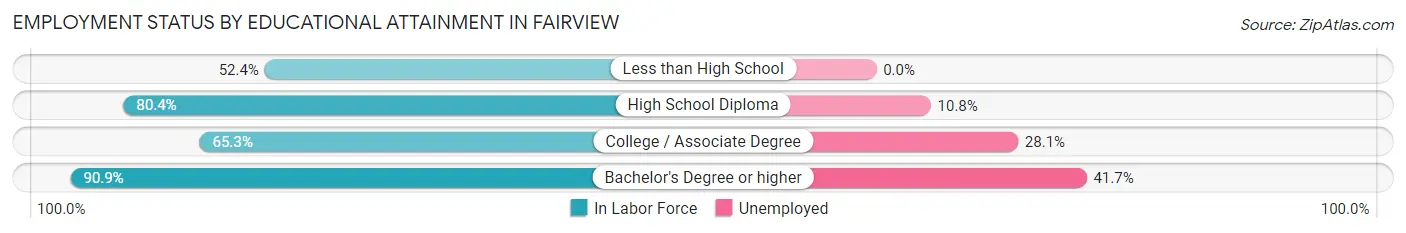
| Educational Attainment | In Labor Force | Unemployed |
| Less than High School | 11 (52.4%) | 0 (0.0%) |
| High School Diploma | 37 (80.4%) | 5 (10.8%) |
| College / Associate Degree | 32 (65.3%) | 14 (28.1%) |
| Bachelor's Degree or higher | 60 (90.9%) | 28 (41.7%) |
| Total | 140 (76.9%) | 49 (27.1%) |
Employment Occupations by Sex in Fairview
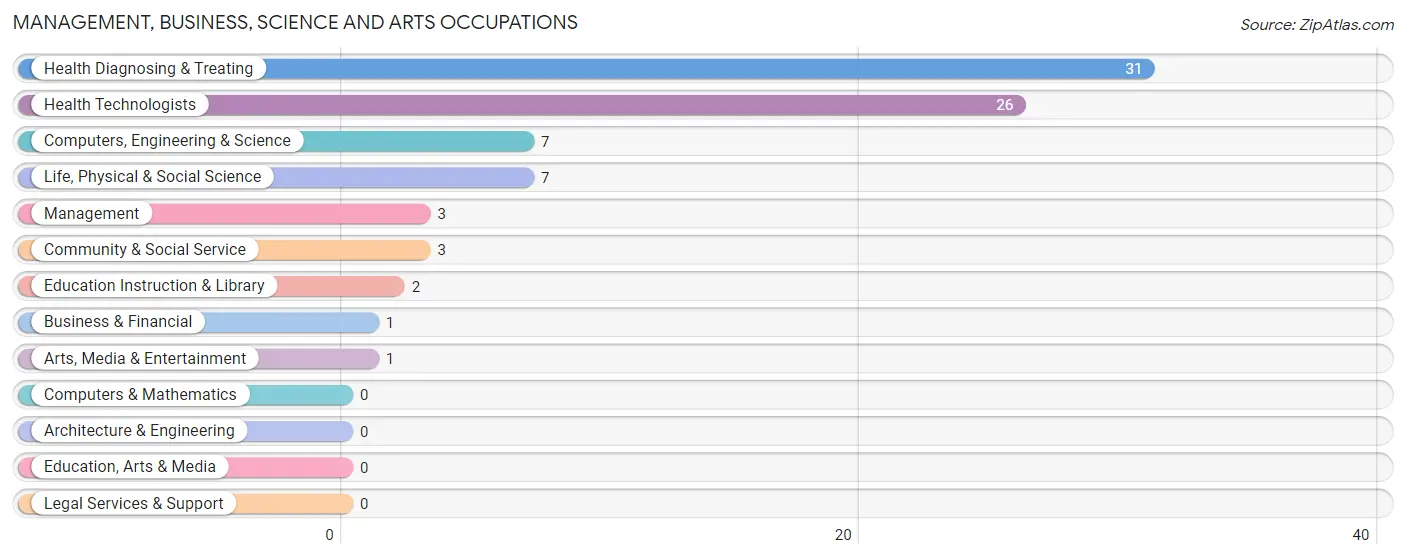
Management, Business, Science and Arts Occupations
The most common Management, Business, Science and Arts occupations in Fairview are Health Diagnosing & Treating (31 | 23.8%), Health Technologists (26 | 20.0%), Computers, Engineering & Science (7 | 5.4%), Life, Physical & Social Science (7 | 5.4%), and Management (3 | 2.3%).
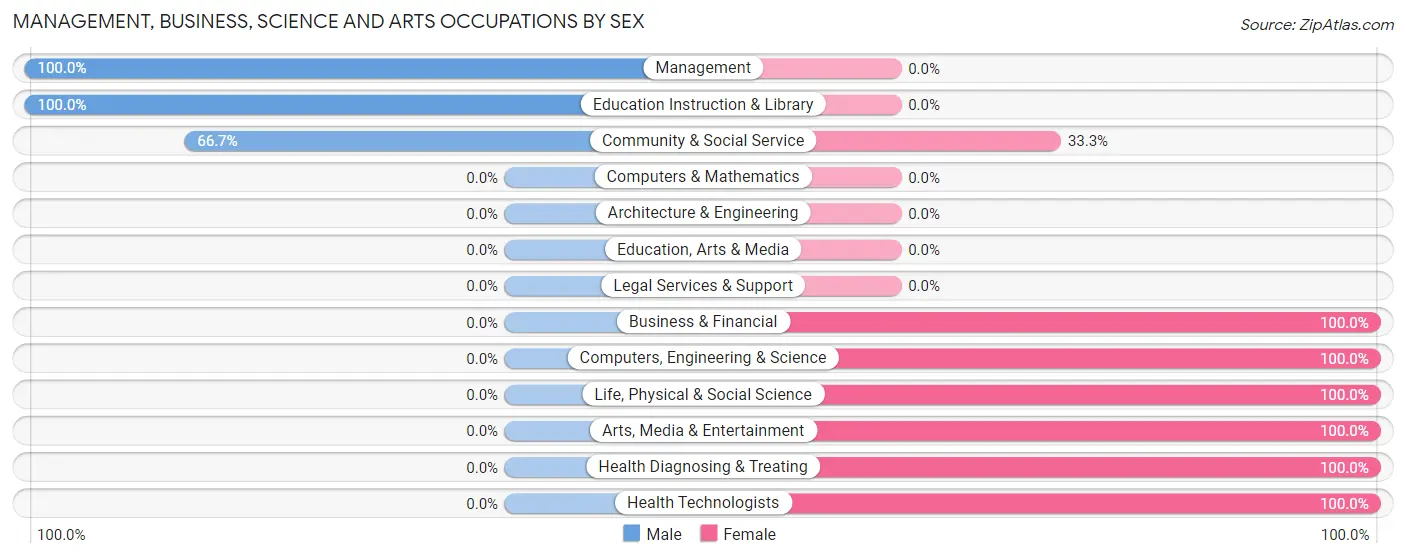
Management, Business, Science and Arts Occupations by Sex
Within the Management, Business, Science and Arts occupations in Fairview, the most male-oriented occupations are Management (100.0%), Education Instruction & Library (100.0%), and Community & Social Service (66.7%), while the most female-oriented occupations are Business & Financial (100.0%), Computers, Engineering & Science (100.0%), and Life, Physical & Social Science (100.0%).
| Occupation | Male | Female |
| Management | 3 (100.0%) | 0 (0.0%) |
| Business & Financial | 0 (0.0%) | 1 (100.0%) |
| Computers, Engineering & Science | 0 (0.0%) | 7 (100.0%) |
| Computers & Mathematics | 0 (0.0%) | 0 (0.0%) |
| Architecture & Engineering | 0 (0.0%) | 0 (0.0%) |
| Life, Physical & Social Science | 0 (0.0%) | 7 (100.0%) |
| Community & Social Service | 2 (66.7%) | 1 (33.3%) |
| Education, Arts & Media | 0 (0.0%) | 0 (0.0%) |
| Legal Services & Support | 0 (0.0%) | 0 (0.0%) |
| Education Instruction & Library | 2 (100.0%) | 0 (0.0%) |
| Arts, Media & Entertainment | 0 (0.0%) | 1 (100.0%) |
| Health Diagnosing & Treating | 0 (0.0%) | 31 (100.0%) |
| Health Technologists | 0 (0.0%) | 26 (100.0%) |
| Total (Category) | 5 (11.1%) | 40 (88.9%) |
| Total (Overall) | 60 (46.2%) | 70 (53.8%) |
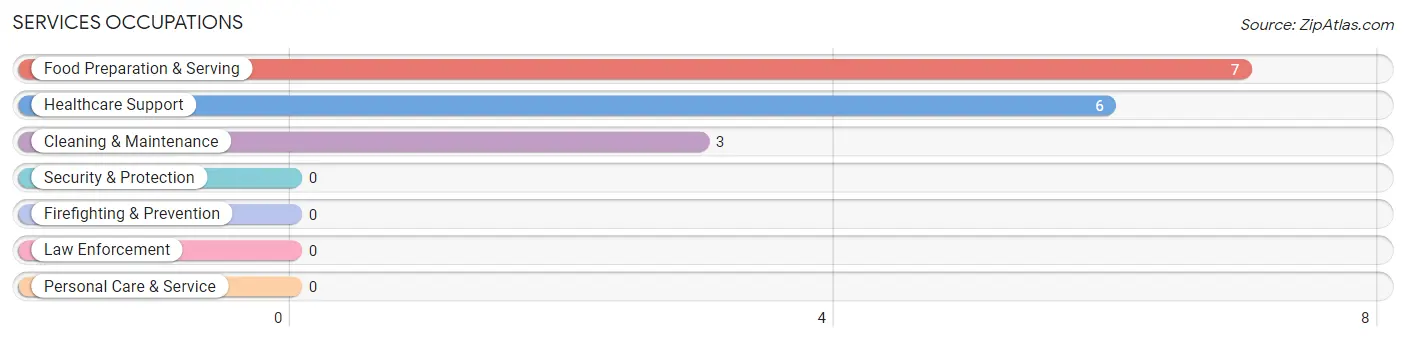
Services Occupations
The most common Services occupations in Fairview are Food Preparation & Serving (7 | 5.4%), Healthcare Support (6 | 4.6%), and Cleaning & Maintenance (3 | 2.3%).
Services Occupations by Sex
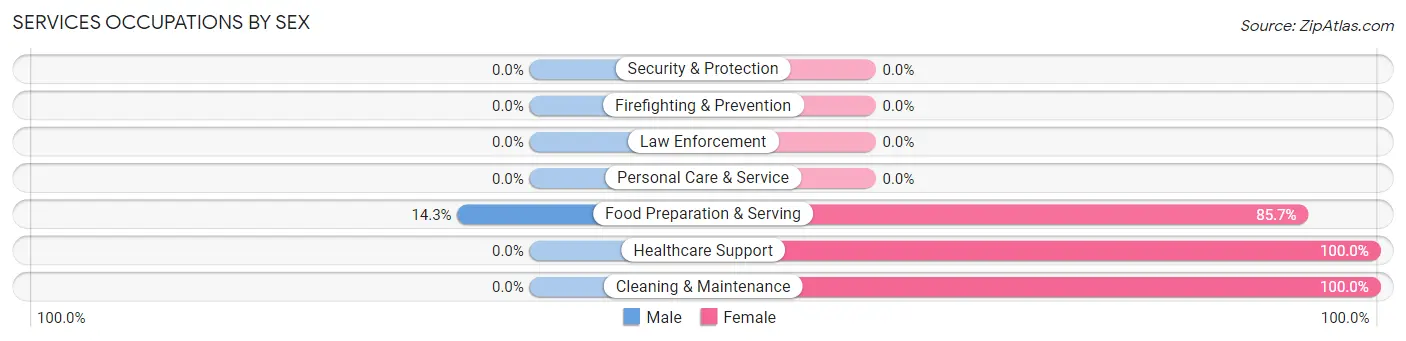
| Occupation | Male | Female |
| Healthcare Support | 0 (0.0%) | 6 (100.0%) |
| Security & Protection | 0 (0.0%) | 0 (0.0%) |
| Firefighting & Prevention | 0 (0.0%) | 0 (0.0%) |
| Law Enforcement | 0 (0.0%) | 0 (0.0%) |
| Food Preparation & Serving | 1 (14.3%) | 6 (85.7%) |
| Cleaning & Maintenance | 0 (0.0%) | 3 (100.0%) |
| Personal Care & Service | 0 (0.0%) | 0 (0.0%) |
| Total (Category) | 1 (6.2%) | 15 (93.8%) |
| Total (Overall) | 60 (46.2%) | 70 (53.8%) |
Sales and Office Occupations
The most common Sales and Office occupations in Fairview are Office & Administration (9 | 6.9%), and Sales & Related (5 | 3.8%).

Sales and Office Occupations by Sex

| Occupation | Male | Female |
| Sales & Related | 1 (20.0%) | 4 (80.0%) |
| Office & Administration | 1 (11.1%) | 8 (88.9%) |
| Total (Category) | 2 (14.3%) | 12 (85.7%) |
| Total (Overall) | 60 (46.2%) | 70 (53.8%) |
Natural Resources, Construction and Maintenance Occupations
The most common Natural Resources, Construction and Maintenance occupations in Fairview are Construction & Extraction (9 | 6.9%), Installation, Maintenance & Repair (7 | 5.4%), and Farming, Fishing & Forestry (4 | 3.1%).
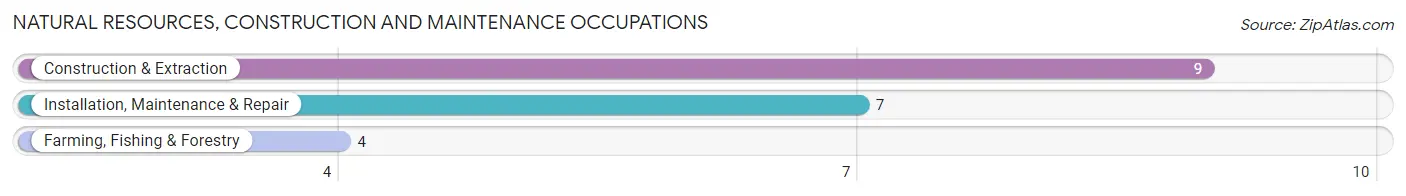
Natural Resources, Construction and Maintenance Occupations by Sex
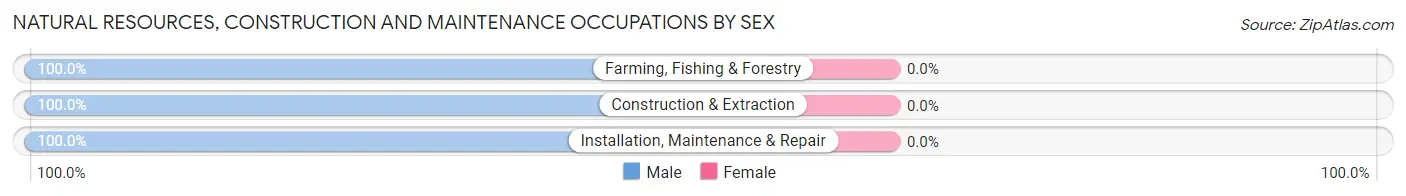
| Occupation | Male | Female |
| Farming, Fishing & Forestry | 4 (100.0%) | 0 (0.0%) |
| Construction & Extraction | 9 (100.0%) | 0 (0.0%) |
| Installation, Maintenance & Repair | 7 (100.0%) | 0 (0.0%) |
| Total (Category) | 20 (100.0%) | 0 (0.0%) |
| Total (Overall) | 60 (46.2%) | 70 (53.8%) |
Production, Transportation and Moving Occupations
The most common Production, Transportation and Moving occupations in Fairview are Production (17 | 13.1%), Transportation (10 | 7.7%), and Material Moving (8 | 6.1%).
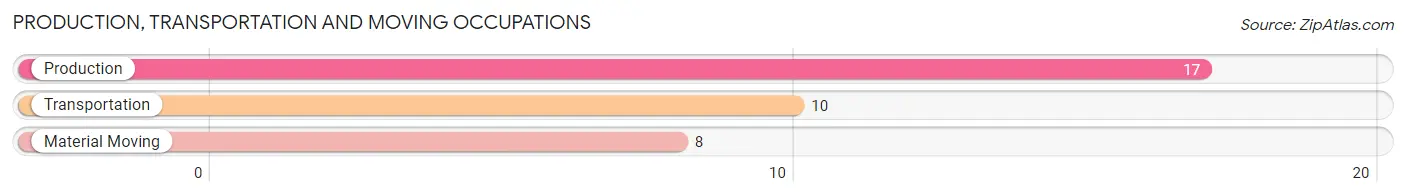
Production, Transportation and Moving Occupations by Sex
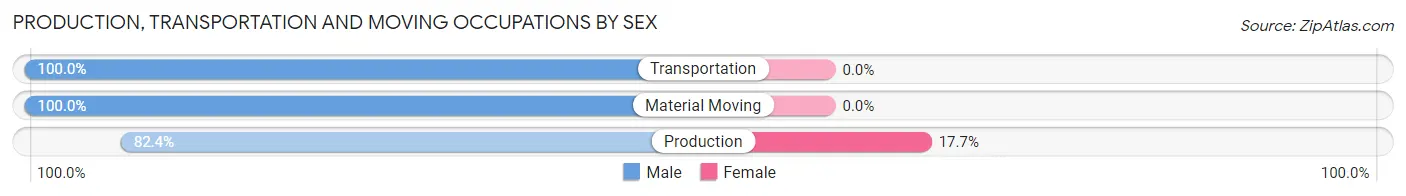
| Occupation | Male | Female |
| Production | 14 (82.4%) | 3 (17.6%) |
| Transportation | 10 (100.0%) | 0 (0.0%) |
| Material Moving | 8 (100.0%) | 0 (0.0%) |
| Total (Category) | 32 (91.4%) | 3 (8.6%) |
| Total (Overall) | 60 (46.2%) | 70 (53.8%) |
Employment Industries by Sex in Fairview
Employment Industries in Fairview
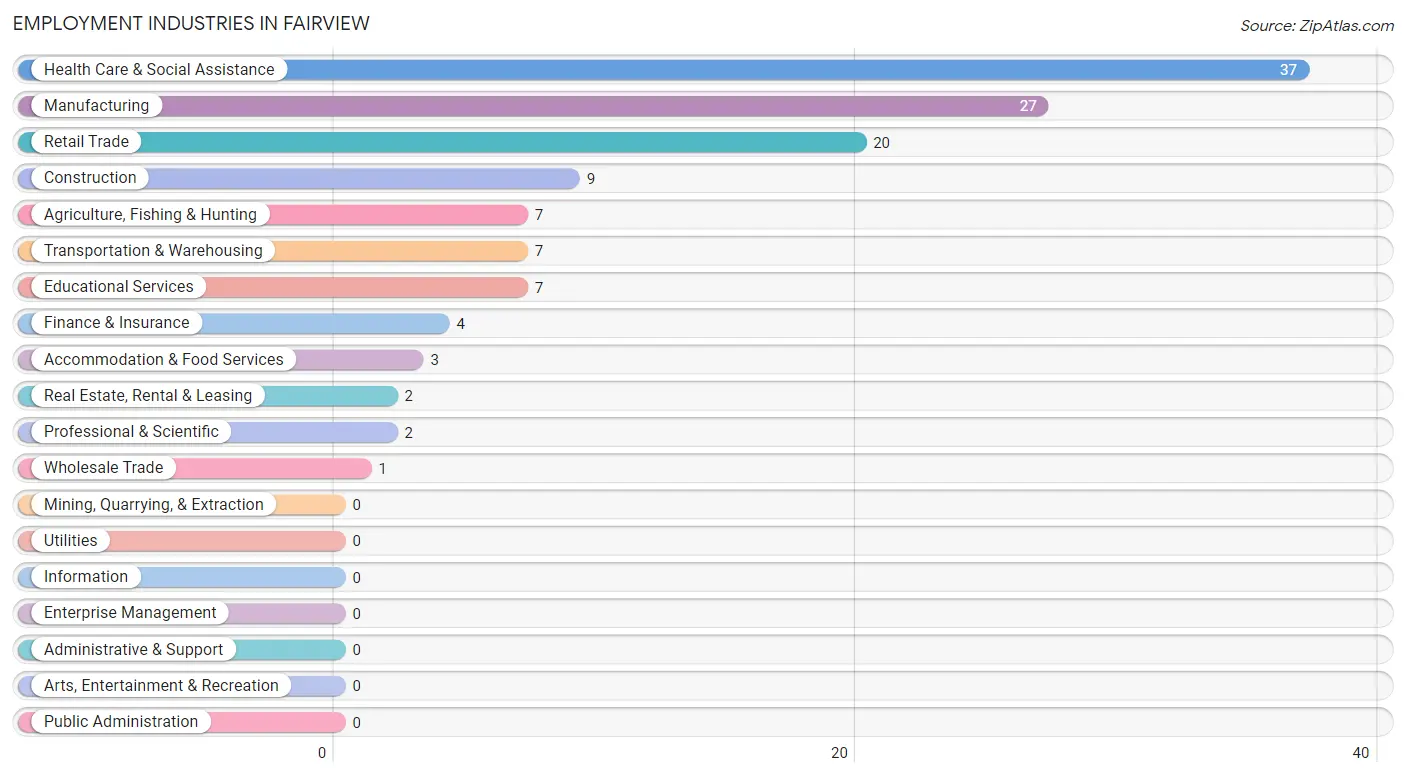
The major employment industries in Fairview include Health Care & Social Assistance (37 | 28.5%), Manufacturing (27 | 20.8%), Retail Trade (20 | 15.4%), Construction (9 | 6.9%), and Agriculture, Fishing & Hunting (7 | 5.4%).
Employment Industries by Sex in Fairview
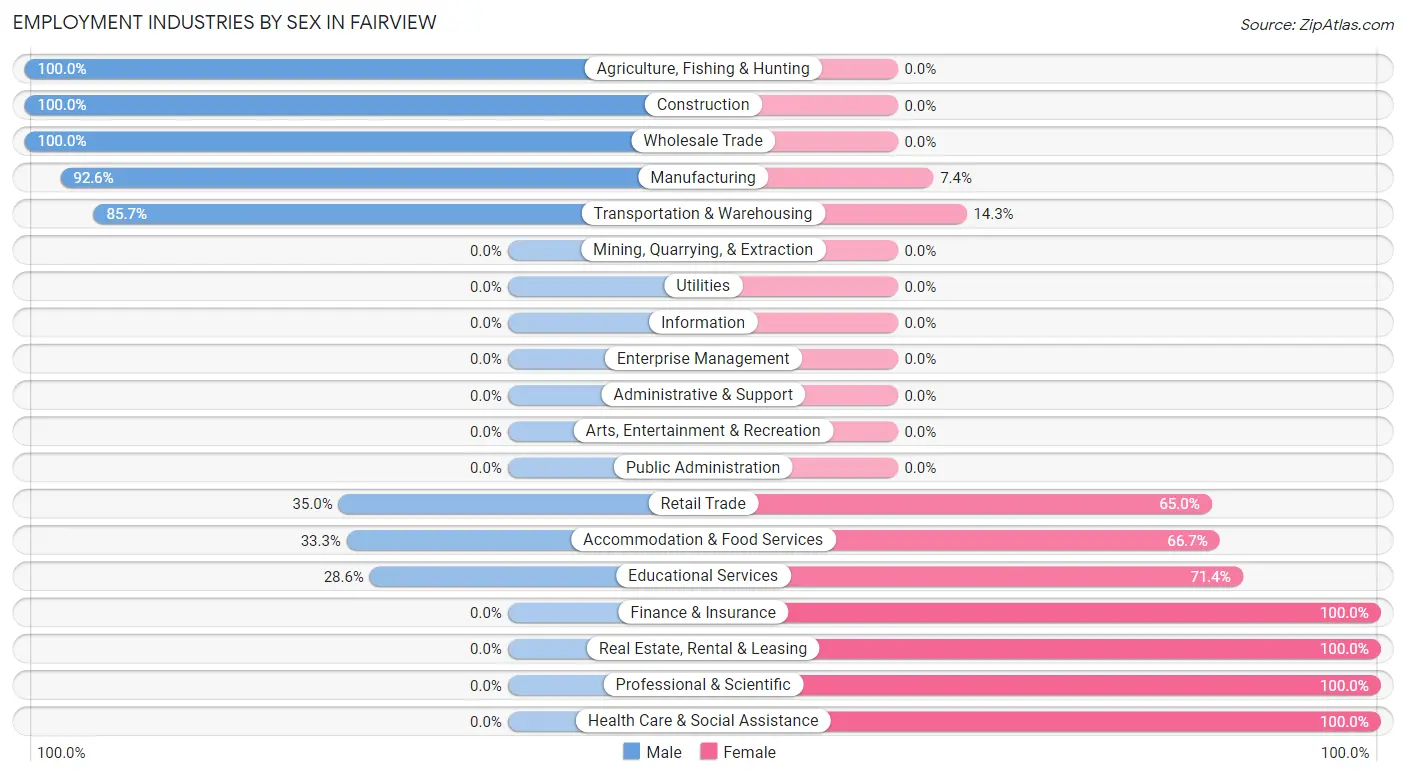
The Fairview industries that see more men than women are Agriculture, Fishing & Hunting (100.0%), Construction (100.0%), and Wholesale Trade (100.0%), whereas the industries that tend to have a higher number of women are Finance & Insurance (100.0%), Real Estate, Rental & Leasing (100.0%), and Professional & Scientific (100.0%).
| Industry | Male | Female |
| Agriculture, Fishing & Hunting | 7 (100.0%) | 0 (0.0%) |
| Mining, Quarrying, & Extraction | 0 (0.0%) | 0 (0.0%) |
| Construction | 9 (100.0%) | 0 (0.0%) |
| Manufacturing | 25 (92.6%) | 2 (7.4%) |
| Wholesale Trade | 1 (100.0%) | 0 (0.0%) |
| Retail Trade | 7 (35.0%) | 13 (65.0%) |
| Transportation & Warehousing | 6 (85.7%) | 1 (14.3%) |
| Utilities | 0 (0.0%) | 0 (0.0%) |
| Information | 0 (0.0%) | 0 (0.0%) |
| Finance & Insurance | 0 (0.0%) | 4 (100.0%) |
| Real Estate, Rental & Leasing | 0 (0.0%) | 2 (100.0%) |
| Professional & Scientific | 0 (0.0%) | 2 (100.0%) |
| Enterprise Management | 0 (0.0%) | 0 (0.0%) |
| Administrative & Support | 0 (0.0%) | 0 (0.0%) |
| Educational Services | 2 (28.6%) | 5 (71.4%) |
| Health Care & Social Assistance | 0 (0.0%) | 37 (100.0%) |
| Arts, Entertainment & Recreation | 0 (0.0%) | 0 (0.0%) |
| Accommodation & Food Services | 1 (33.3%) | 2 (66.7%) |
| Public Administration | 0 (0.0%) | 0 (0.0%) |
| Total | 60 (46.2%) | 70 (53.8%) |
Education in Fairview
School Enrollment in Fairview
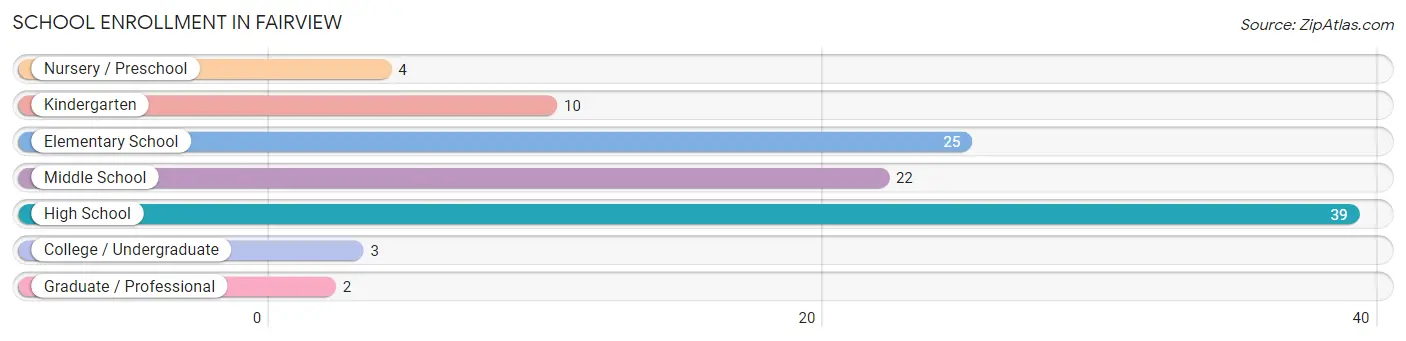
The most common levels of schooling among the 105 students in Fairview are high school (39 | 37.1%), elementary school (25 | 23.8%), and middle school (22 | 20.9%).
| School Level | # Students | % Students |
| Nursery / Preschool | 4 | 3.8% |
| Kindergarten | 10 | 9.5% |
| Elementary School | 25 | 23.8% |
| Middle School | 22 | 20.9% |
| High School | 39 | 37.1% |
| College / Undergraduate | 3 | 2.9% |
| Graduate / Professional | 2 | 1.9% |
| Total | 105 | 100.0% |
School Enrollment by Age by Funding Source in Fairview
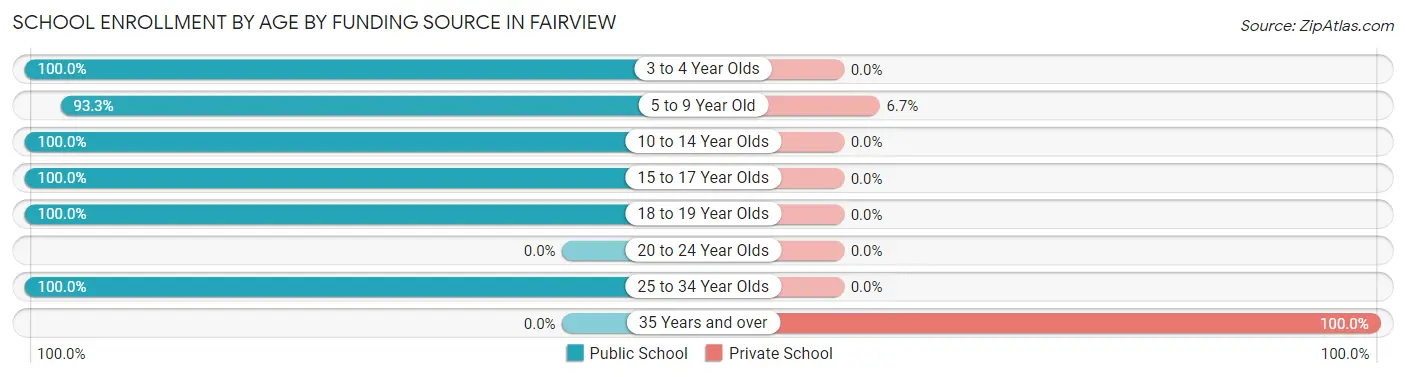
Out of a total of 105 students who are enrolled in schools in Fairview, 3 (2.9%) attend a private institution, while the remaining 102 (97.1%) are enrolled in public schools. The age group of 35 years and over has the highest likelihood of being enrolled in private schools, with 1 (100.0% in the age bracket) enrolled. Conversely, the age group of 3 to 4 year olds has the lowest likelihood of being enrolled in a private school, with 2 (100.0% in the age bracket) attending a public institution.
| Age Bracket | Public School | Private School |
| 3 to 4 Year Olds | 2 (100.0%) | 0 (0.0%) |
| 5 to 9 Year Old | 28 (93.3%) | 2 (6.7%) |
| 10 to 14 Year Olds | 27 (100.0%) | 0 (0.0%) |
| 15 to 17 Year Olds | 41 (100.0%) | 0 (0.0%) |
| 18 to 19 Year Olds | 2 (100.0%) | 0 (0.0%) |
| 20 to 24 Year Olds | 0 (0.0%) | 0 (0.0%) |
| 25 to 34 Year Olds | 2 (100.0%) | 0 (0.0%) |
| 35 Years and over | 0 (0.0%) | 1 (100.0%) |
| Total | 102 (97.1%) | 3 (2.9%) |
Educational Attainment by Field of Study in Fairview
Science & technology (25 | 37.9%), visual & performing arts (25 | 37.9%), arts & humanities (5 | 7.6%), physical & health sciences (4 | 6.1%), and education (3 | 4.5%) are the most common fields of study among 66 individuals in Fairview who have obtained a bachelor's degree or higher.
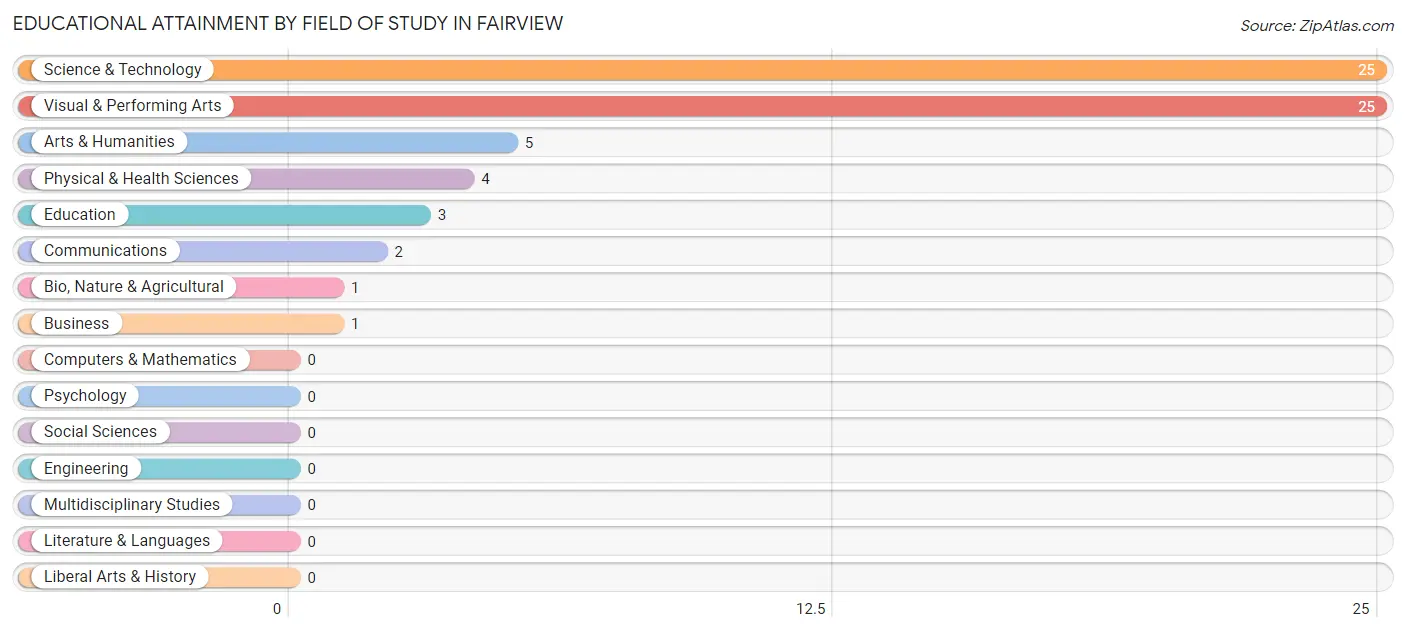
| Field of Study | # Graduates | % Graduates |
| Computers & Mathematics | 0 | 0.0% |
| Bio, Nature & Agricultural | 1 | 1.5% |
| Physical & Health Sciences | 4 | 6.1% |
| Psychology | 0 | 0.0% |
| Social Sciences | 0 | 0.0% |
| Engineering | 0 | 0.0% |
| Multidisciplinary Studies | 0 | 0.0% |
| Science & Technology | 25 | 37.9% |
| Business | 1 | 1.5% |
| Education | 3 | 4.5% |
| Literature & Languages | 0 | 0.0% |
| Liberal Arts & History | 0 | 0.0% |
| Visual & Performing Arts | 25 | 37.9% |
| Communications | 2 | 3.0% |
| Arts & Humanities | 5 | 7.6% |
| Total | 66 | 100.0% |
Transportation & Commute in Fairview
Vehicle Availability by Sex in Fairview
The most prevalent vehicle ownership categories in Fairview are males with 2 vehicles (19, accounting for 31.7%) and females with 2 vehicles (21, making up 27.1%).
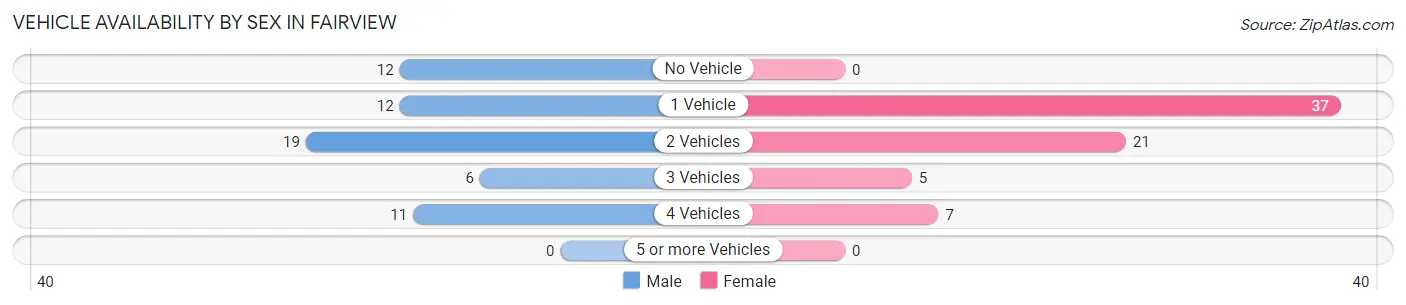
| Vehicles Available | Male | Female |
| No Vehicle | 12 (20.0%) | 0 (0.0%) |
| 1 Vehicle | 12 (20.0%) | 37 (52.9%) |
| 2 Vehicles | 19 (31.7%) | 21 (30.0%) |
| 3 Vehicles | 6 (10.0%) | 5 (7.1%) |
| 4 Vehicles | 11 (18.3%) | 7 (10.0%) |
| 5 or more Vehicles | 0 (0.0%) | 0 (0.0%) |
| Total | 60 (100.0%) | 70 (100.0%) |
Commute Time in Fairview
The most frequently occuring commute durations in Fairview are 30 to 34 minutes (41 commuters, 32.8%), 20 to 24 minutes (17 commuters, 13.6%), and 5 to 9 minutes (12 commuters, 9.6%).
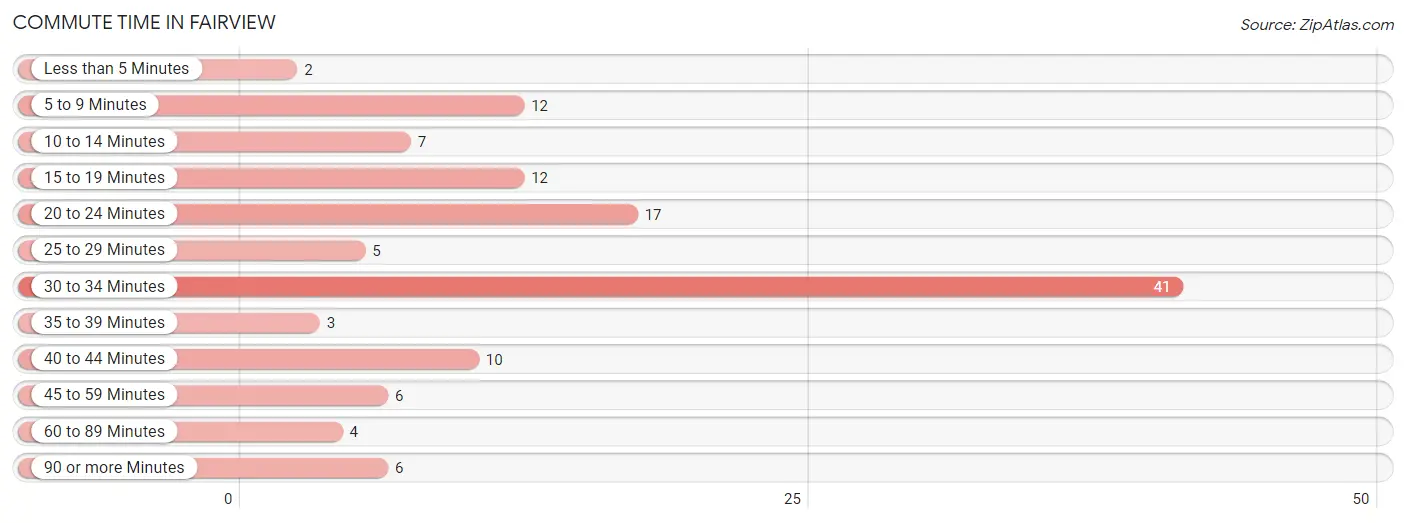
| Commute Time | # Commuters | % Commuters |
| Less than 5 Minutes | 2 | 1.6% |
| 5 to 9 Minutes | 12 | 9.6% |
| 10 to 14 Minutes | 7 | 5.6% |
| 15 to 19 Minutes | 12 | 9.6% |
| 20 to 24 Minutes | 17 | 13.6% |
| 25 to 29 Minutes | 5 | 4.0% |
| 30 to 34 Minutes | 41 | 32.8% |
| 35 to 39 Minutes | 3 | 2.4% |
| 40 to 44 Minutes | 10 | 8.0% |
| 45 to 59 Minutes | 6 | 4.8% |
| 60 to 89 Minutes | 4 | 3.2% |
| 90 or more Minutes | 6 | 4.8% |
Commute Time by Sex in Fairview
The most common commute times in Fairview are 30 to 34 minutes (11 commuters, 18.3%) for males and 30 to 34 minutes (30 commuters, 46.2%) for females.
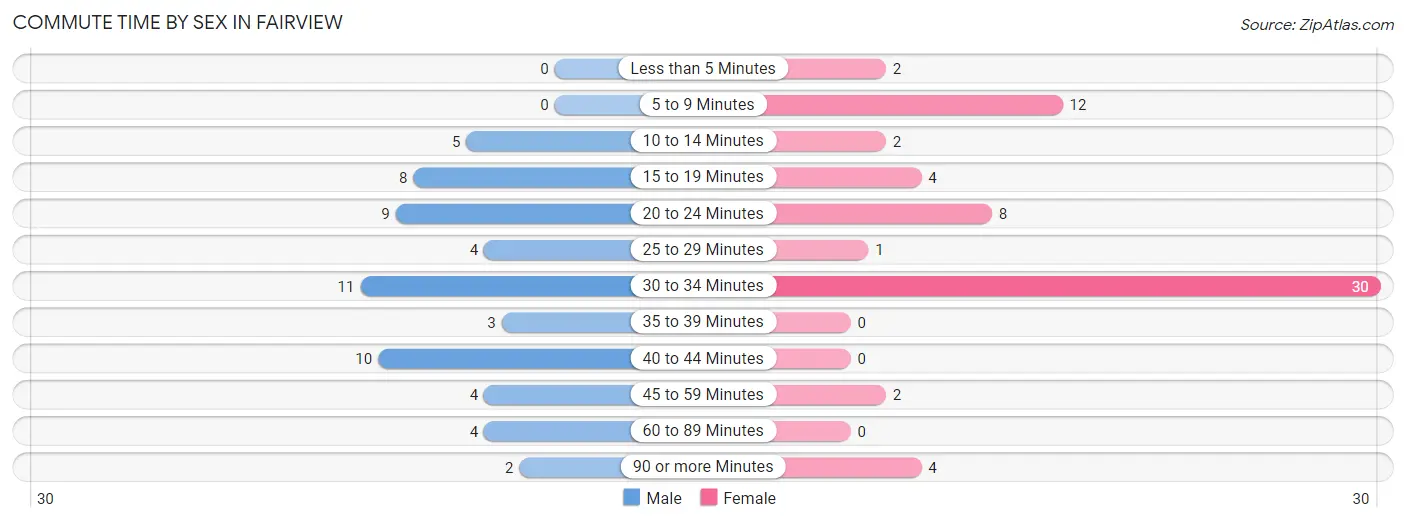
| Commute Time | Male | Female |
| Less than 5 Minutes | 0 (0.0%) | 2 (3.1%) |
| 5 to 9 Minutes | 0 (0.0%) | 12 (18.5%) |
| 10 to 14 Minutes | 5 (8.3%) | 2 (3.1%) |
| 15 to 19 Minutes | 8 (13.3%) | 4 (6.1%) |
| 20 to 24 Minutes | 9 (15.0%) | 8 (12.3%) |
| 25 to 29 Minutes | 4 (6.7%) | 1 (1.5%) |
| 30 to 34 Minutes | 11 (18.3%) | 30 (46.2%) |
| 35 to 39 Minutes | 3 (5.0%) | 0 (0.0%) |
| 40 to 44 Minutes | 10 (16.7%) | 0 (0.0%) |
| 45 to 59 Minutes | 4 (6.7%) | 2 (3.1%) |
| 60 to 89 Minutes | 4 (6.7%) | 0 (0.0%) |
| 90 or more Minutes | 2 (3.3%) | 4 (6.1%) |
Time of Departure to Work by Sex in Fairview
The most frequent times of departure to work in Fairview are 7:00 AM to 7:29 AM (10, 16.7%) for males and 5:30 AM to 5:59 AM (31, 47.7%) for females.
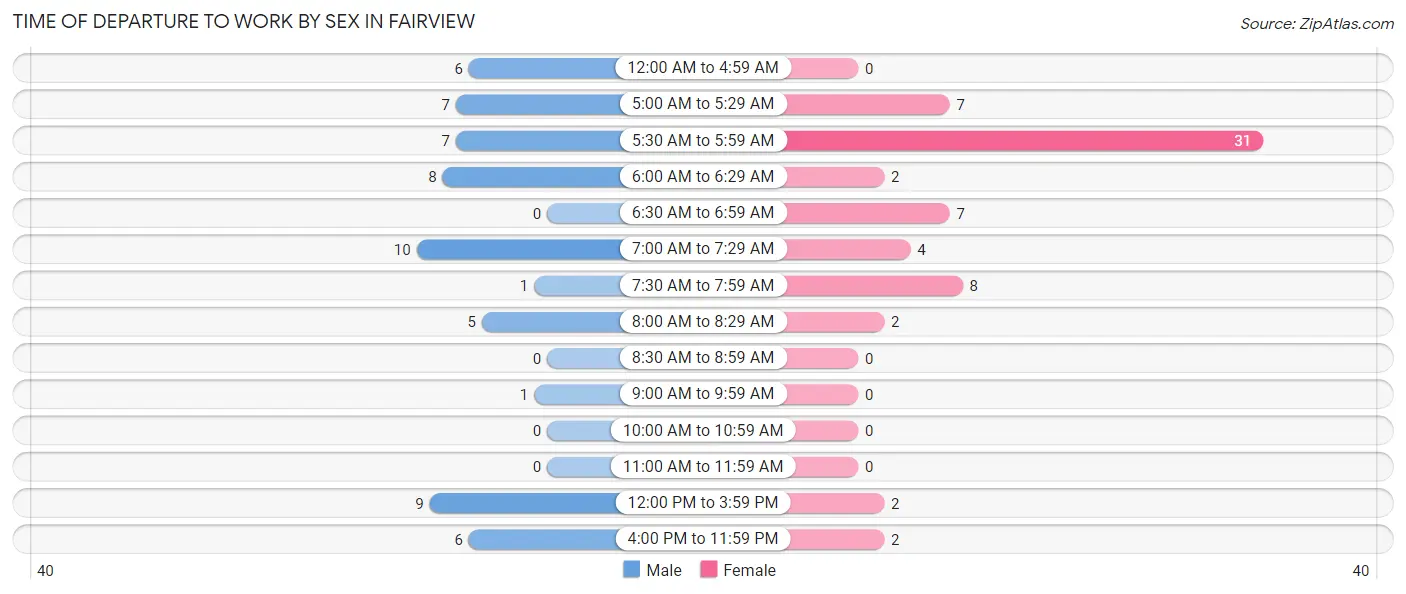
| Time of Departure | Male | Female |
| 12:00 AM to 4:59 AM | 6 (10.0%) | 0 (0.0%) |
| 5:00 AM to 5:29 AM | 7 (11.7%) | 7 (10.8%) |
| 5:30 AM to 5:59 AM | 7 (11.7%) | 31 (47.7%) |
| 6:00 AM to 6:29 AM | 8 (13.3%) | 2 (3.1%) |
| 6:30 AM to 6:59 AM | 0 (0.0%) | 7 (10.8%) |
| 7:00 AM to 7:29 AM | 10 (16.7%) | 4 (6.1%) |
| 7:30 AM to 7:59 AM | 1 (1.7%) | 8 (12.3%) |
| 8:00 AM to 8:29 AM | 5 (8.3%) | 2 (3.1%) |
| 8:30 AM to 8:59 AM | 0 (0.0%) | 0 (0.0%) |
| 9:00 AM to 9:59 AM | 1 (1.7%) | 0 (0.0%) |
| 10:00 AM to 10:59 AM | 0 (0.0%) | 0 (0.0%) |
| 11:00 AM to 11:59 AM | 0 (0.0%) | 0 (0.0%) |
| 12:00 PM to 3:59 PM | 9 (15.0%) | 2 (3.1%) |
| 4:00 PM to 11:59 PM | 6 (10.0%) | 2 (3.1%) |
| Total | 60 (100.0%) | 65 (100.0%) |
Housing Occupancy in Fairview
Occupancy by Ownership in Fairview
Of the total 127 dwellings in Fairview, owner-occupied units account for 73 (57.5%), while renter-occupied units make up 54 (42.5%).

| Occupancy | # Housing Units | % Housing Units |
| Owner Occupied Housing Units | 73 | 57.5% |
| Renter-Occupied Housing Units | 54 | 42.5% |
| Total Occupied Housing Units | 127 | 100.0% |
Occupancy by Household Size in Fairview
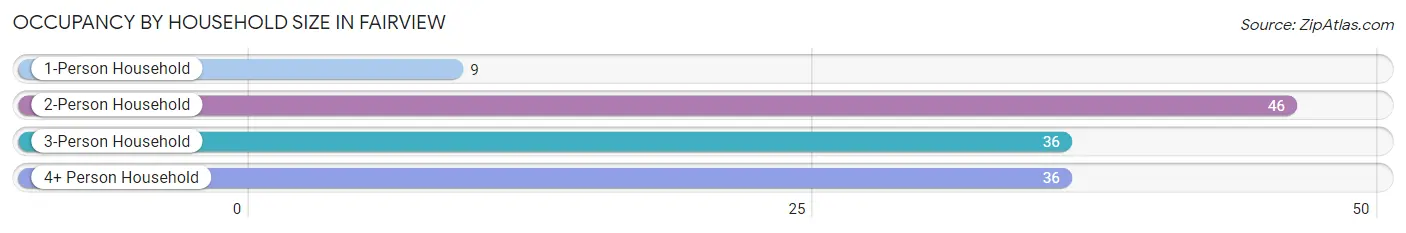
| Household Size | # Housing Units | % Housing Units |
| 1-Person Household | 9 | 7.1% |
| 2-Person Household | 46 | 36.2% |
| 3-Person Household | 36 | 28.3% |
| 4+ Person Household | 36 | 28.3% |
| Total Housing Units | 127 | 100.0% |
Occupancy by Ownership by Household Size in Fairview
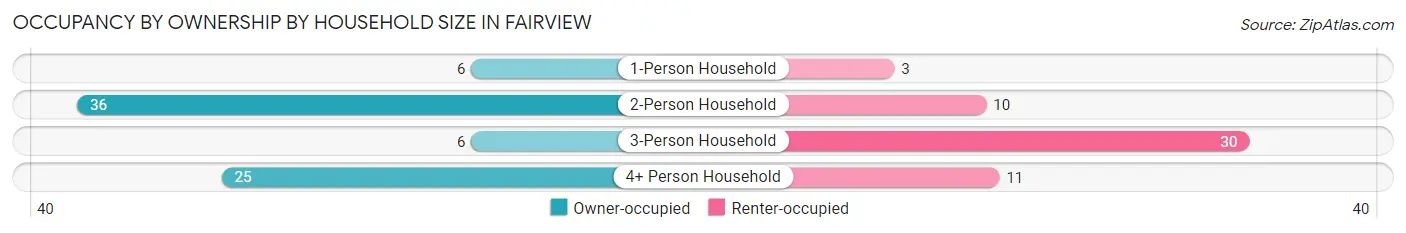
| Household Size | Owner-occupied | Renter-occupied |
| 1-Person Household | 6 (66.7%) | 3 (33.3%) |
| 2-Person Household | 36 (78.3%) | 10 (21.7%) |
| 3-Person Household | 6 (16.7%) | 30 (83.3%) |
| 4+ Person Household | 25 (69.4%) | 11 (30.6%) |
| Total Housing Units | 73 (57.5%) | 54 (42.5%) |
Occupancy by Educational Attainment in Fairview
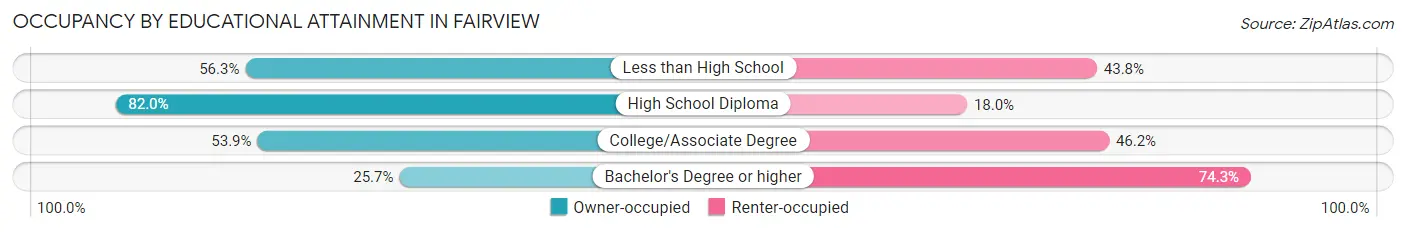
| Household Size | Owner-occupied | Renter-occupied |
| Less than High School | 9 (56.2%) | 7 (43.8%) |
| High School Diploma | 41 (82.0%) | 9 (18.0%) |
| College/Associate Degree | 14 (53.8%) | 12 (46.2%) |
| Bachelor's Degree or higher | 9 (25.7%) | 26 (74.3%) |
Occupancy by Age of Householder in Fairview
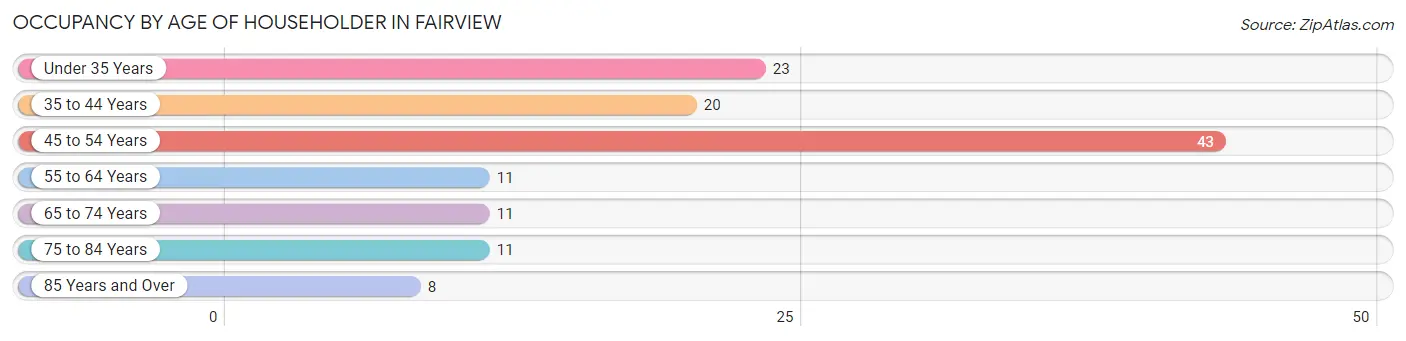
| Age Bracket | # Households | % Households |
| Under 35 Years | 23 | 18.1% |
| 35 to 44 Years | 20 | 15.8% |
| 45 to 54 Years | 43 | 33.9% |
| 55 to 64 Years | 11 | 8.7% |
| 65 to 74 Years | 11 | 8.7% |
| 75 to 84 Years | 11 | 8.7% |
| 85 Years and Over | 8 | 6.3% |
| Total | 127 | 100.0% |
Housing Finances in Fairview
Median Income by Occupancy in Fairview
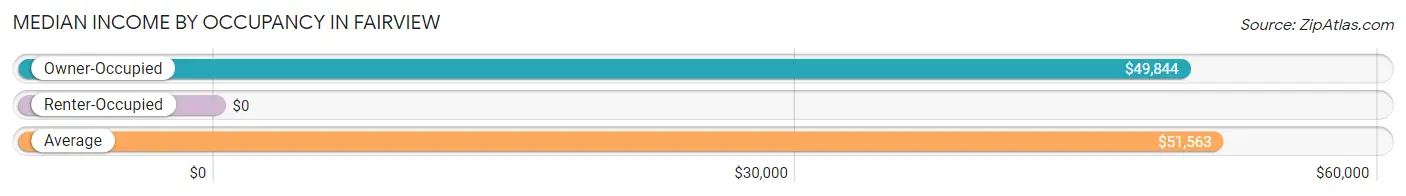
| Occupancy Type | # Households | Median Income |
| Owner-Occupied | 73 (57.5%) | $49,844 |
| Renter-Occupied | 54 (42.5%) | $0 |
| Average | 127 (100.0%) | $51,563 |
Occupancy by Householder Income Bracket in Fairview
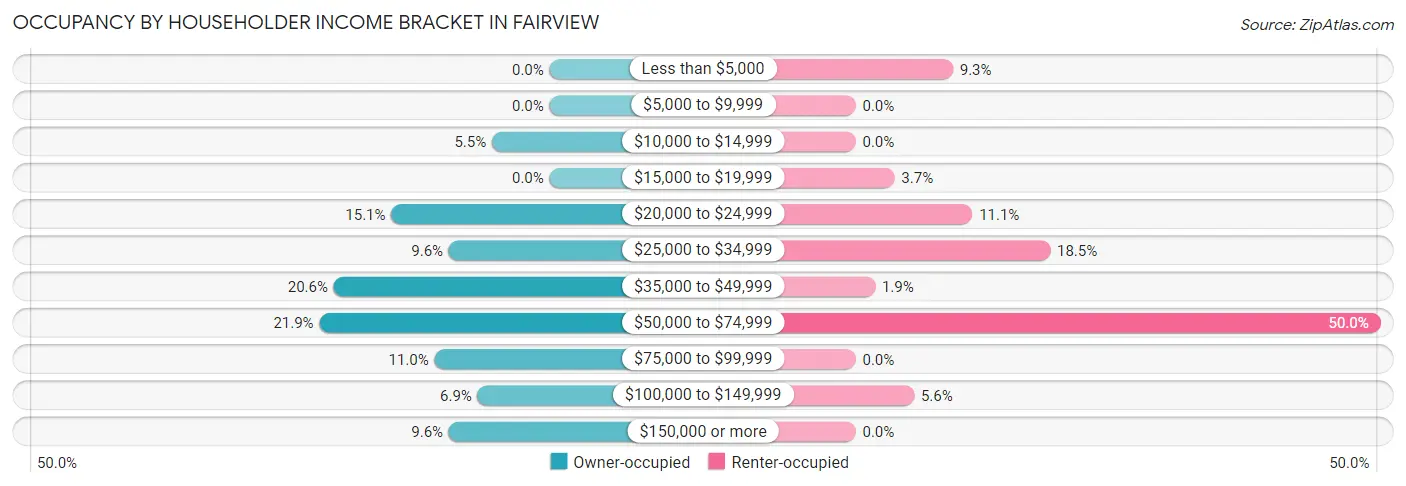
| Income Bracket | Owner-occupied | Renter-occupied |
| Less than $5,000 | 0 (0.0%) | 5 (9.3%) |
| $5,000 to $9,999 | 0 (0.0%) | 0 (0.0%) |
| $10,000 to $14,999 | 4 (5.5%) | 0 (0.0%) |
| $15,000 to $19,999 | 0 (0.0%) | 2 (3.7%) |
| $20,000 to $24,999 | 11 (15.1%) | 6 (11.1%) |
| $25,000 to $34,999 | 7 (9.6%) | 10 (18.5%) |
| $35,000 to $49,999 | 15 (20.5%) | 1 (1.8%) |
| $50,000 to $74,999 | 16 (21.9%) | 27 (50.0%) |
| $75,000 to $99,999 | 8 (11.0%) | 0 (0.0%) |
| $100,000 to $149,999 | 5 (6.9%) | 3 (5.6%) |
| $150,000 or more | 7 (9.6%) | 0 (0.0%) |
| Total | 73 (100.0%) | 54 (100.0%) |
Monthly Housing Cost Tiers in Fairview
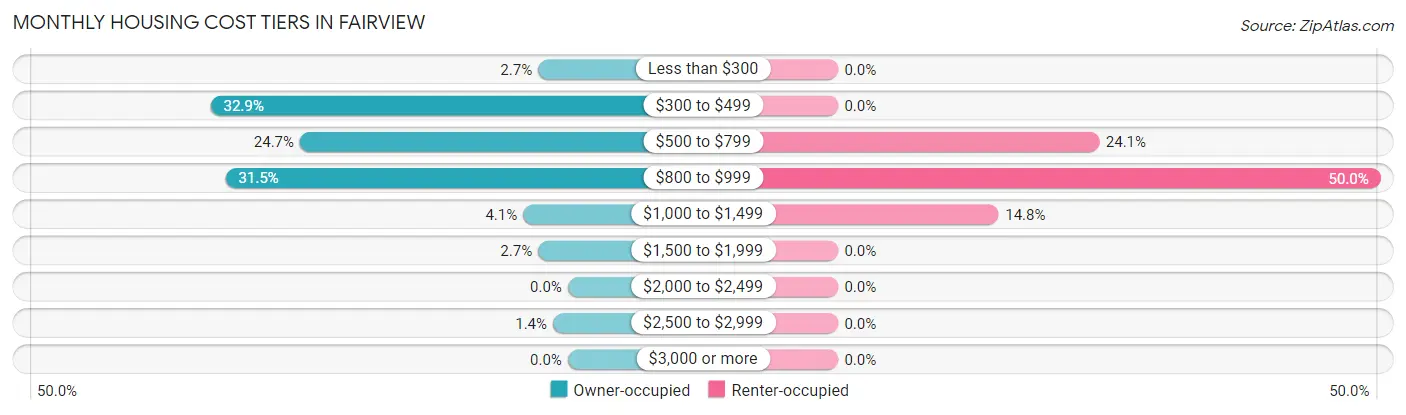
| Monthly Cost | Owner-occupied | Renter-occupied |
| Less than $300 | 2 (2.7%) | 0 (0.0%) |
| $300 to $499 | 24 (32.9%) | 0 (0.0%) |
| $500 to $799 | 18 (24.7%) | 13 (24.1%) |
| $800 to $999 | 23 (31.5%) | 27 (50.0%) |
| $1,000 to $1,499 | 3 (4.1%) | 8 (14.8%) |
| $1,500 to $1,999 | 2 (2.7%) | 0 (0.0%) |
| $2,000 to $2,499 | 0 (0.0%) | 0 (0.0%) |
| $2,500 to $2,999 | 1 (1.4%) | 0 (0.0%) |
| $3,000 or more | 0 (0.0%) | 0 (0.0%) |
| Total | 73 (100.0%) | 54 (100.0%) |
Physical Housing Characteristics in Fairview
Housing Structures in Fairview
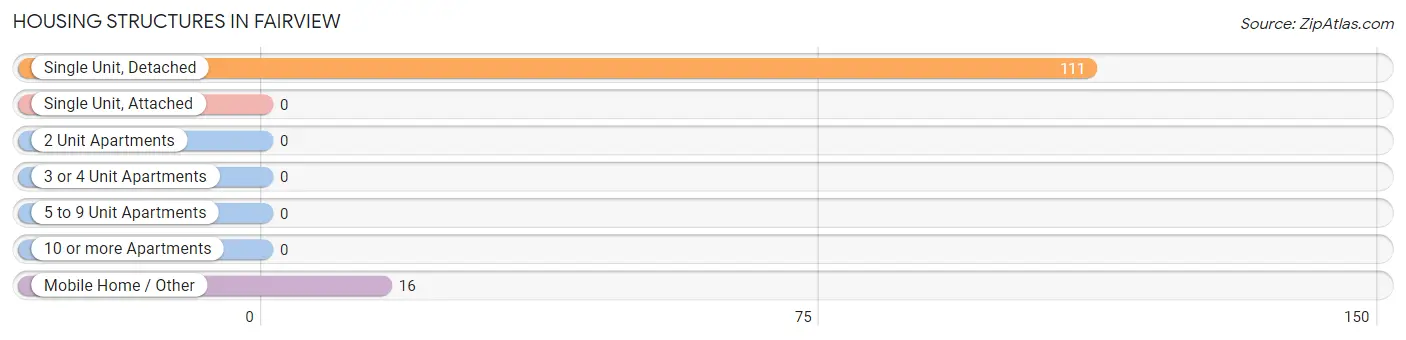
| Structure Type | # Housing Units | % Housing Units |
| Single Unit, Detached | 111 | 87.4% |
| Single Unit, Attached | 0 | 0.0% |
| 2 Unit Apartments | 0 | 0.0% |
| 3 or 4 Unit Apartments | 0 | 0.0% |
| 5 to 9 Unit Apartments | 0 | 0.0% |
| 10 or more Apartments | 0 | 0.0% |
| Mobile Home / Other | 16 | 12.6% |
| Total | 127 | 100.0% |
Housing Structures by Occupancy in Fairview
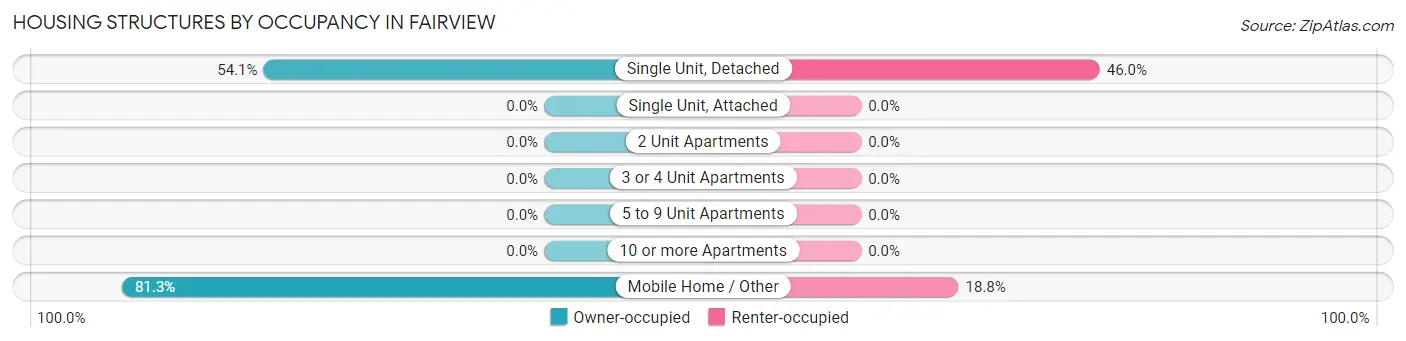
| Structure Type | Owner-occupied | Renter-occupied |
| Single Unit, Detached | 60 (54.0%) | 51 (46.0%) |
| Single Unit, Attached | 0 (0.0%) | 0 (0.0%) |
| 2 Unit Apartments | 0 (0.0%) | 0 (0.0%) |
| 3 or 4 Unit Apartments | 0 (0.0%) | 0 (0.0%) |
| 5 to 9 Unit Apartments | 0 (0.0%) | 0 (0.0%) |
| 10 or more Apartments | 0 (0.0%) | 0 (0.0%) |
| Mobile Home / Other | 13 (81.2%) | 3 (18.8%) |
| Total | 73 (57.5%) | 54 (42.5%) |
Housing Structures by Number of Rooms in Fairview
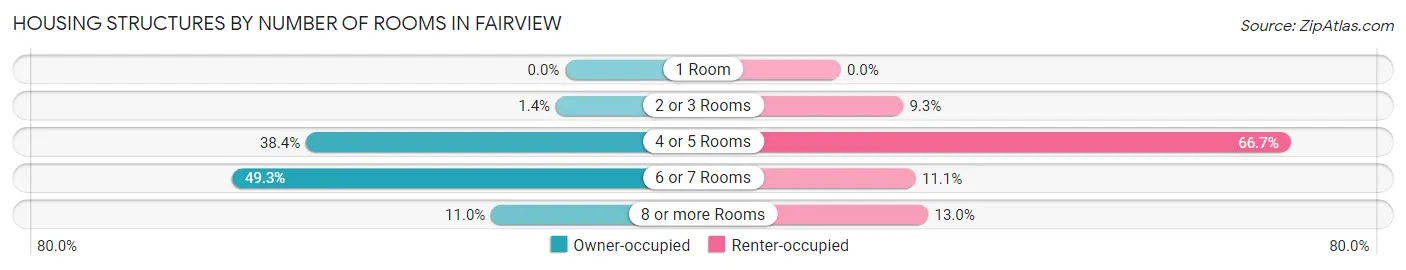
| Number of Rooms | Owner-occupied | Renter-occupied |
| 1 Room | 0 (0.0%) | 0 (0.0%) |
| 2 or 3 Rooms | 1 (1.4%) | 5 (9.3%) |
| 4 or 5 Rooms | 28 (38.4%) | 36 (66.7%) |
| 6 or 7 Rooms | 36 (49.3%) | 6 (11.1%) |
| 8 or more Rooms | 8 (11.0%) | 7 (13.0%) |
| Total | 73 (100.0%) | 54 (100.0%) |
Housing Structure by Heating Type in Fairview
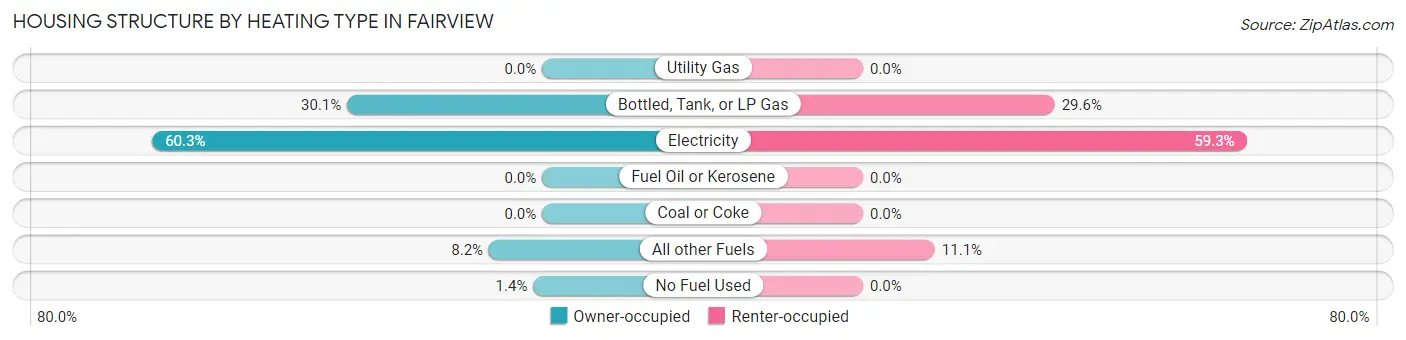
| Heating Type | Owner-occupied | Renter-occupied |
| Utility Gas | 0 (0.0%) | 0 (0.0%) |
| Bottled, Tank, or LP Gas | 22 (30.1%) | 16 (29.6%) |
| Electricity | 44 (60.3%) | 32 (59.3%) |
| Fuel Oil or Kerosene | 0 (0.0%) | 0 (0.0%) |
| Coal or Coke | 0 (0.0%) | 0 (0.0%) |
| All other Fuels | 6 (8.2%) | 6 (11.1%) |
| No Fuel Used | 1 (1.4%) | 0 (0.0%) |
| Total | 73 (100.0%) | 54 (100.0%) |
Household Vehicle Usage in Fairview
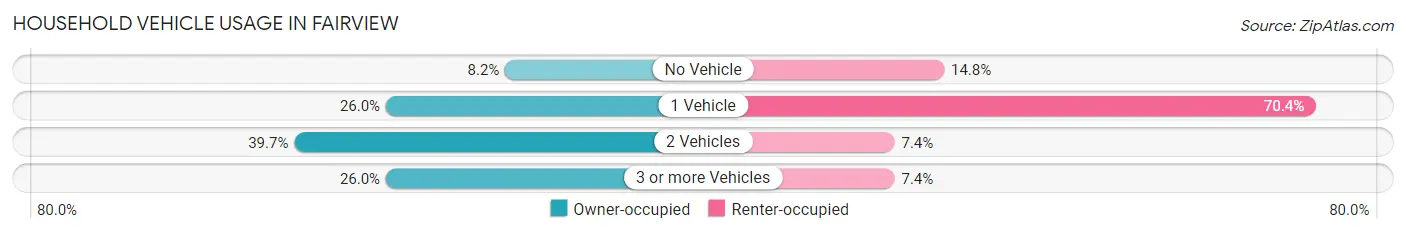
| Vehicles per Household | Owner-occupied | Renter-occupied |
| No Vehicle | 6 (8.2%) | 8 (14.8%) |
| 1 Vehicle | 19 (26.0%) | 38 (70.4%) |
| 2 Vehicles | 29 (39.7%) | 4 (7.4%) |
| 3 or more Vehicles | 19 (26.0%) | 4 (7.4%) |
| Total | 73 (100.0%) | 54 (100.0%) |
Real Estate & Mortgages in Fairview
Real Estate and Mortgage Overview in Fairview
| Characteristic | Without Mortgage | With Mortgage |
| Housing Units | 36 | 37 |
| Median Property Value | $72,500 | $76,300 |
| Median Household Income | $48,438 | $5 |
| Monthly Housing Costs | $400 | $0 |
| Real Estate Taxes | $600 | $0 |
Property Value by Mortgage Status in Fairview
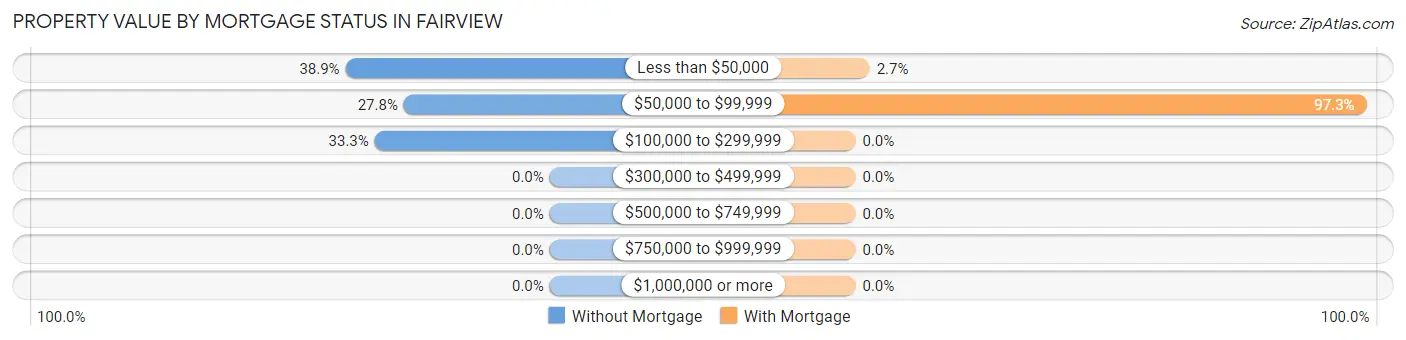
| Property Value | Without Mortgage | With Mortgage |
| Less than $50,000 | 14 (38.9%) | 1 (2.7%) |
| $50,000 to $99,999 | 10 (27.8%) | 36 (97.3%) |
| $100,000 to $299,999 | 12 (33.3%) | 0 (0.0%) |
| $300,000 to $499,999 | 0 (0.0%) | 0 (0.0%) |
| $500,000 to $749,999 | 0 (0.0%) | 0 (0.0%) |
| $750,000 to $999,999 | 0 (0.0%) | 0 (0.0%) |
| $1,000,000 or more | 0 (0.0%) | 0 (0.0%) |
| Total | 36 (100.0%) | 37 (100.0%) |
Household Income by Mortgage Status in Fairview
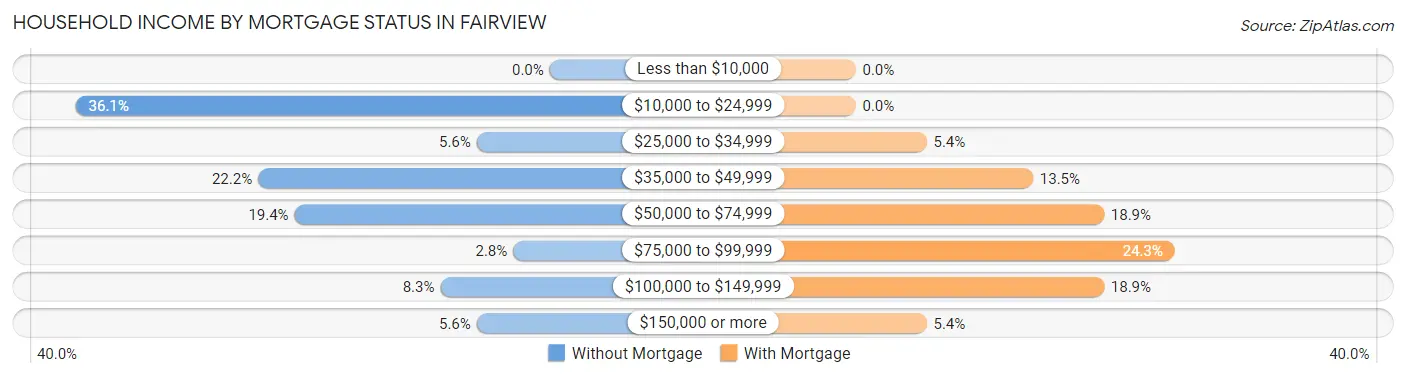
| Household Income | Without Mortgage | With Mortgage |
| Less than $10,000 | 0 (0.0%) | 0 (0.0%) |
| $10,000 to $24,999 | 13 (36.1%) | 0 (0.0%) |
| $25,000 to $34,999 | 2 (5.6%) | 2 (5.4%) |
| $35,000 to $49,999 | 8 (22.2%) | 5 (13.5%) |
| $50,000 to $74,999 | 7 (19.4%) | 7 (18.9%) |
| $75,000 to $99,999 | 1 (2.8%) | 9 (24.3%) |
| $100,000 to $149,999 | 3 (8.3%) | 7 (18.9%) |
| $150,000 or more | 2 (5.6%) | 2 (5.4%) |
| Total | 36 (100.0%) | 37 (100.0%) |
Property Value to Household Income Ratio in Fairview
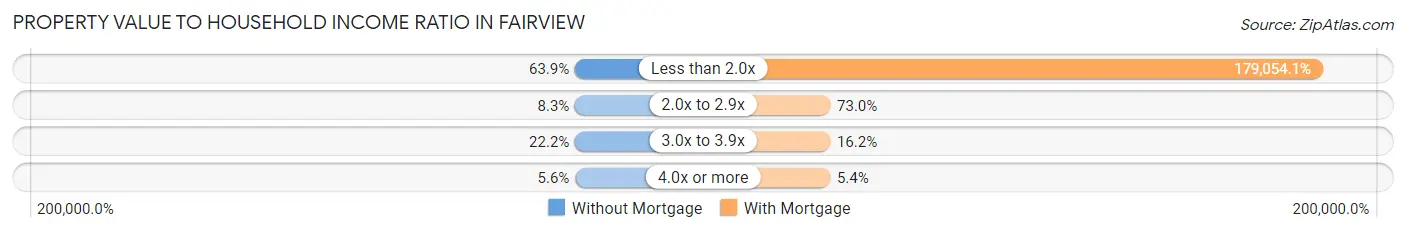
| Value-to-Income Ratio | Without Mortgage | With Mortgage |
| Less than 2.0x | 23 (63.9%) | 66,250 (179,054.1%) |
| 2.0x to 2.9x | 3 (8.3%) | 27 (73.0%) |
| 3.0x to 3.9x | 8 (22.2%) | 6 (16.2%) |
| 4.0x or more | 2 (5.6%) | 2 (5.4%) |
| Total | 36 (100.0%) | 37 (100.0%) |
Real Estate Taxes by Mortgage Status in Fairview
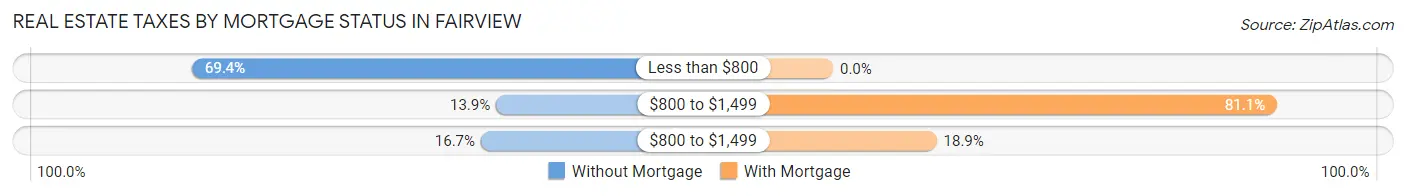
| Property Taxes | Without Mortgage | With Mortgage |
| Less than $800 | 25 (69.4%) | 0 (0.0%) |
| $800 to $1,499 | 5 (13.9%) | 30 (81.1%) |
| $800 to $1,499 | 6 (16.7%) | 7 (18.9%) |
| Total | 36 (100.0%) | 37 (100.0%) |
Health & Disability in Fairview
Health Insurance Coverage by Age in Fairview
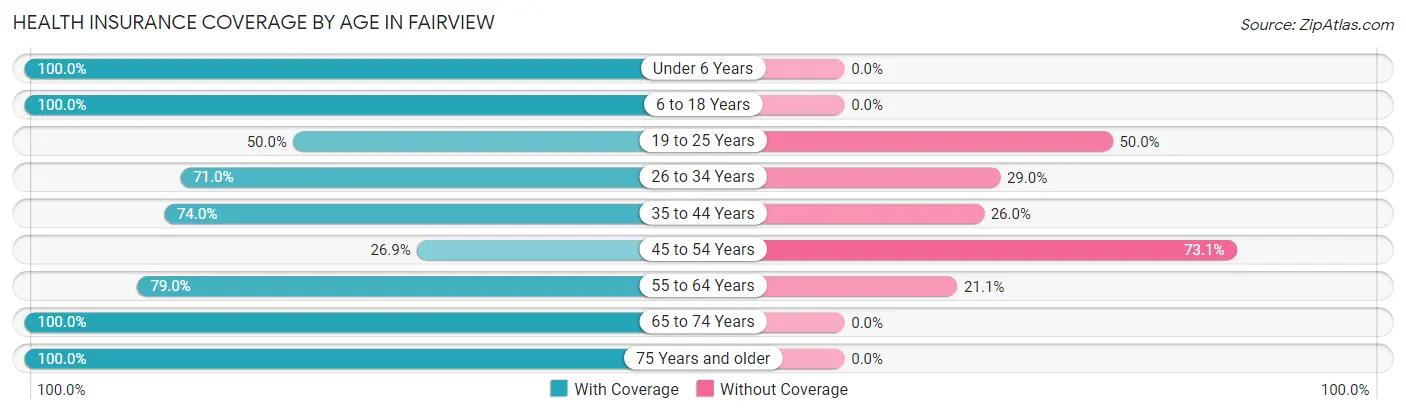
| Age Bracket | With Coverage | Without Coverage |
| Under 6 Years | 38 (100.0%) | 0 (0.0%) |
| 6 to 18 Years | 90 (100.0%) | 0 (0.0%) |
| 19 to 25 Years | 17 (50.0%) | 17 (50.0%) |
| 26 to 34 Years | 22 (71.0%) | 9 (29.0%) |
| 35 to 44 Years | 37 (74.0%) | 13 (26.0%) |
| 45 to 54 Years | 21 (26.9%) | 57 (73.1%) |
| 55 to 64 Years | 15 (78.9%) | 4 (21.0%) |
| 65 to 74 Years | 27 (100.0%) | 0 (0.0%) |
| 75 Years and older | 31 (100.0%) | 0 (0.0%) |
| Total | 298 (74.9%) | 100 (25.1%) |
Health Insurance Coverage by Citizenship Status in Fairview
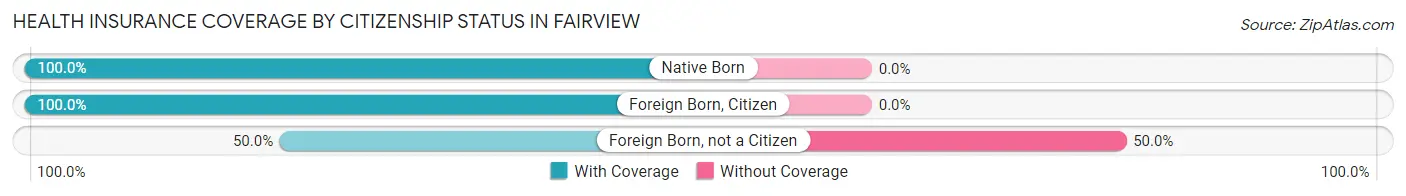
| Citizenship Status | With Coverage | Without Coverage |
| Native Born | 38 (100.0%) | 0 (0.0%) |
| Foreign Born, Citizen | 90 (100.0%) | 0 (0.0%) |
| Foreign Born, not a Citizen | 17 (50.0%) | 17 (50.0%) |
Health Insurance Coverage by Household Income in Fairview
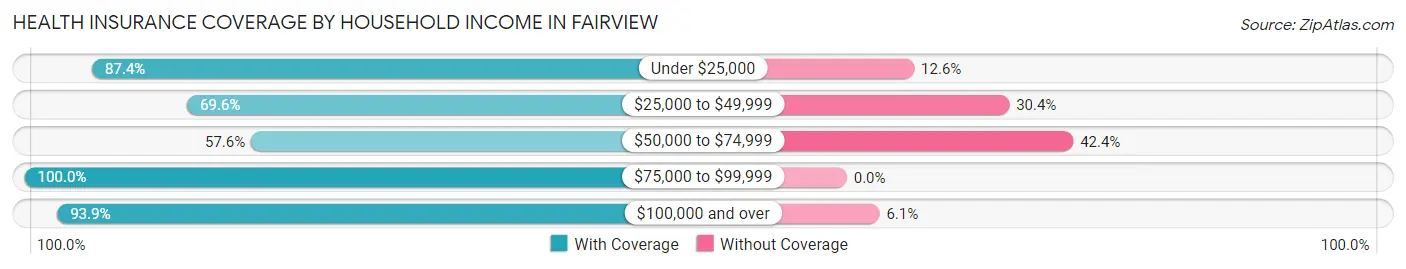
| Household Income | With Coverage | Without Coverage |
| Under $25,000 | 90 (87.4%) | 13 (12.6%) |
| $25,000 to $49,999 | 64 (69.6%) | 28 (30.4%) |
| $50,000 to $74,999 | 76 (57.6%) | 56 (42.4%) |
| $75,000 to $99,999 | 22 (100.0%) | 0 (0.0%) |
| $100,000 and over | 46 (93.9%) | 3 (6.1%) |
Public vs Private Health Insurance Coverage by Age in Fairview
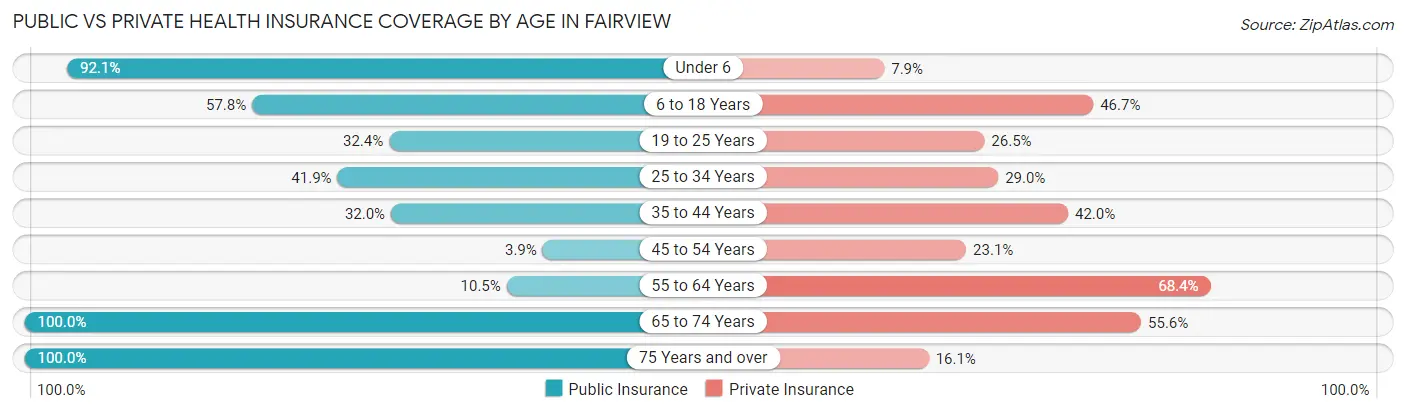
| Age Bracket | Public Insurance | Private Insurance |
| Under 6 | 35 (92.1%) | 3 (7.9%) |
| 6 to 18 Years | 52 (57.8%) | 42 (46.7%) |
| 19 to 25 Years | 11 (32.4%) | 9 (26.5%) |
| 25 to 34 Years | 13 (41.9%) | 9 (29.0%) |
| 35 to 44 Years | 16 (32.0%) | 21 (42.0%) |
| 45 to 54 Years | 3 (3.8%) | 18 (23.1%) |
| 55 to 64 Years | 2 (10.5%) | 13 (68.4%) |
| 65 to 74 Years | 27 (100.0%) | 15 (55.6%) |
| 75 Years and over | 31 (100.0%) | 5 (16.1%) |
| Total | 190 (47.7%) | 135 (33.9%) |
Disability Status by Sex by Age in Fairview
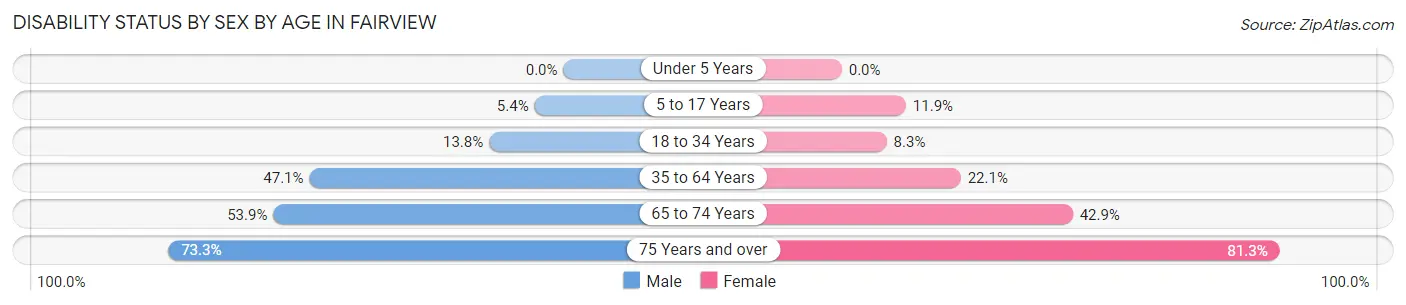
| Age Bracket | Male | Female |
| Under 5 Years | 0 (0.0%) | 0 (0.0%) |
| 5 to 17 Years | 3 (5.4%) | 5 (11.9%) |
| 18 to 34 Years | 4 (13.8%) | 3 (8.3%) |
| 35 to 64 Years | 33 (47.1%) | 17 (22.1%) |
| 65 to 74 Years | 7 (53.8%) | 6 (42.9%) |
| 75 Years and over | 11 (73.3%) | 13 (81.2%) |
Disability Class by Sex by Age in Fairview
Disability Class: Hearing Difficulty
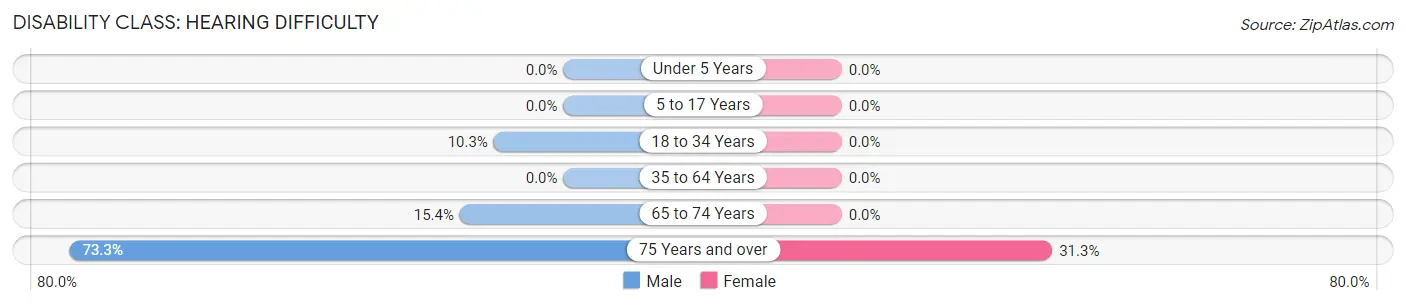
| Age Bracket | Male | Female |
| Under 5 Years | 0 (0.0%) | 0 (0.0%) |
| 5 to 17 Years | 0 (0.0%) | 0 (0.0%) |
| 18 to 34 Years | 3 (10.3%) | 0 (0.0%) |
| 35 to 64 Years | 0 (0.0%) | 0 (0.0%) |
| 65 to 74 Years | 2 (15.4%) | 0 (0.0%) |
| 75 Years and over | 11 (73.3%) | 5 (31.2%) |
Disability Class: Vision Difficulty
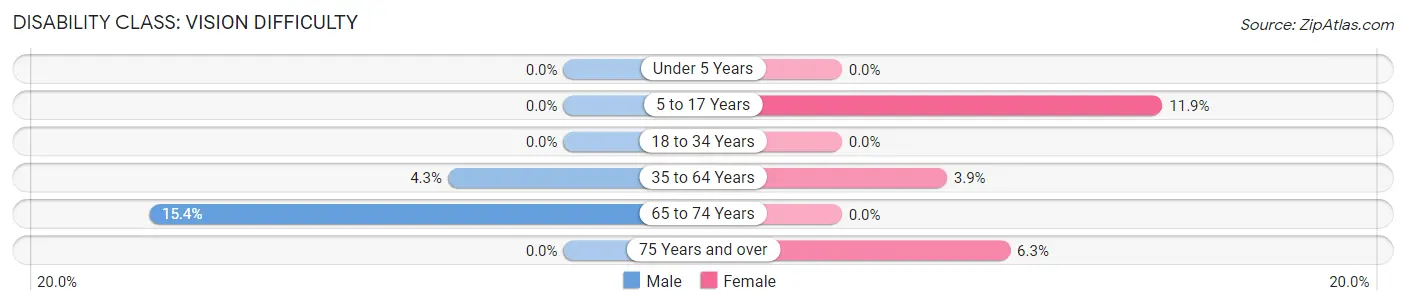
| Age Bracket | Male | Female |
| Under 5 Years | 0 (0.0%) | 0 (0.0%) |
| 5 to 17 Years | 0 (0.0%) | 5 (11.9%) |
| 18 to 34 Years | 0 (0.0%) | 0 (0.0%) |
| 35 to 64 Years | 3 (4.3%) | 3 (3.9%) |
| 65 to 74 Years | 2 (15.4%) | 0 (0.0%) |
| 75 Years and over | 0 (0.0%) | 1 (6.2%) |
Disability Class: Cognitive Difficulty
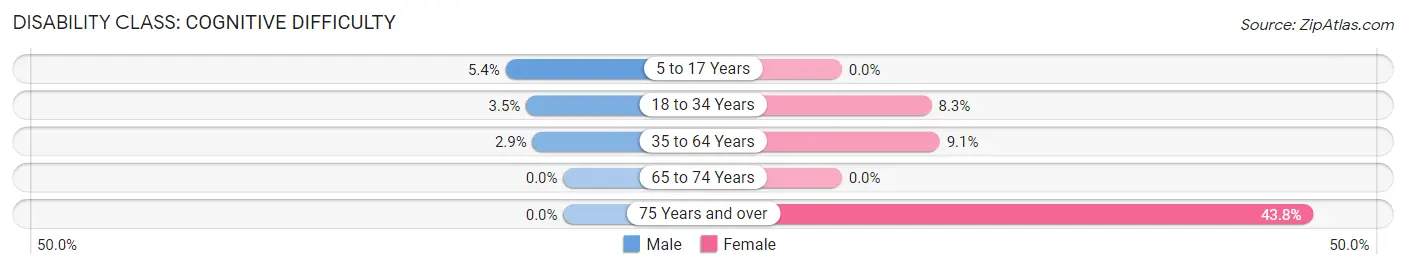
| Age Bracket | Male | Female |
| 5 to 17 Years | 3 (5.4%) | 0 (0.0%) |
| 18 to 34 Years | 1 (3.5%) | 3 (8.3%) |
| 35 to 64 Years | 2 (2.9%) | 7 (9.1%) |
| 65 to 74 Years | 0 (0.0%) | 0 (0.0%) |
| 75 Years and over | 0 (0.0%) | 7 (43.8%) |
Disability Class: Ambulatory Difficulty
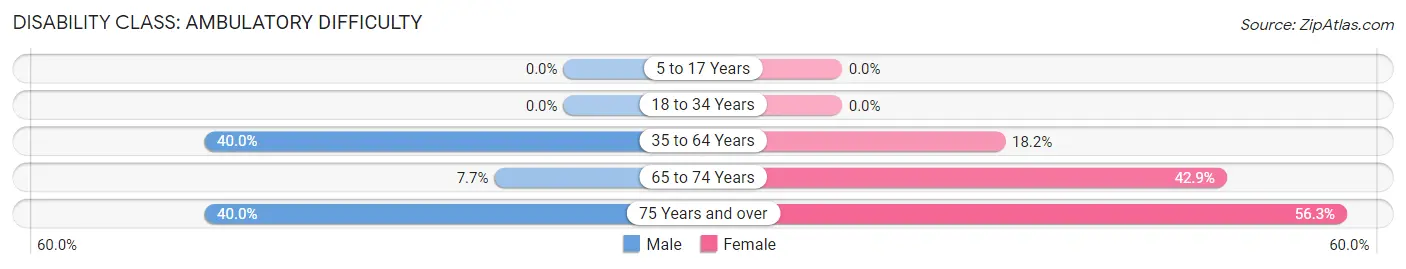
| Age Bracket | Male | Female |
| 5 to 17 Years | 0 (0.0%) | 0 (0.0%) |
| 18 to 34 Years | 0 (0.0%) | 0 (0.0%) |
| 35 to 64 Years | 28 (40.0%) | 14 (18.2%) |
| 65 to 74 Years | 1 (7.7%) | 6 (42.9%) |
| 75 Years and over | 6 (40.0%) | 9 (56.2%) |
Disability Class: Self-Care Difficulty
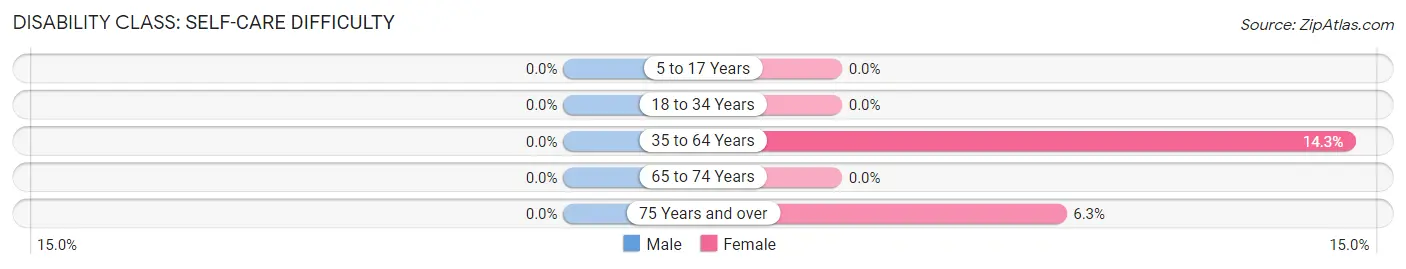
| Age Bracket | Male | Female |
| 5 to 17 Years | 0 (0.0%) | 0 (0.0%) |
| 18 to 34 Years | 0 (0.0%) | 0 (0.0%) |
| 35 to 64 Years | 0 (0.0%) | 11 (14.3%) |
| 65 to 74 Years | 0 (0.0%) | 0 (0.0%) |
| 75 Years and over | 0 (0.0%) | 1 (6.2%) |
Technology Access in Fairview
Computing Device Access in Fairview
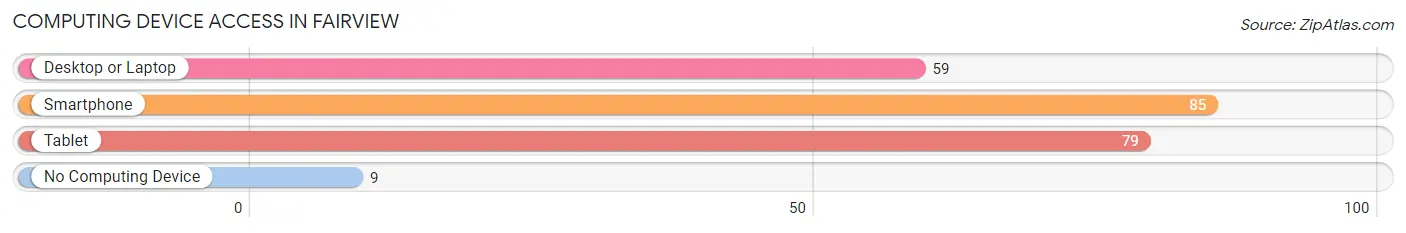
| Device Type | # Households | % Households |
| Desktop or Laptop | 59 | 46.5% |
| Smartphone | 85 | 66.9% |
| Tablet | 79 | 62.2% |
| No Computing Device | 9 | 7.1% |
| Total | 127 | 100.0% |
Internet Access in Fairview
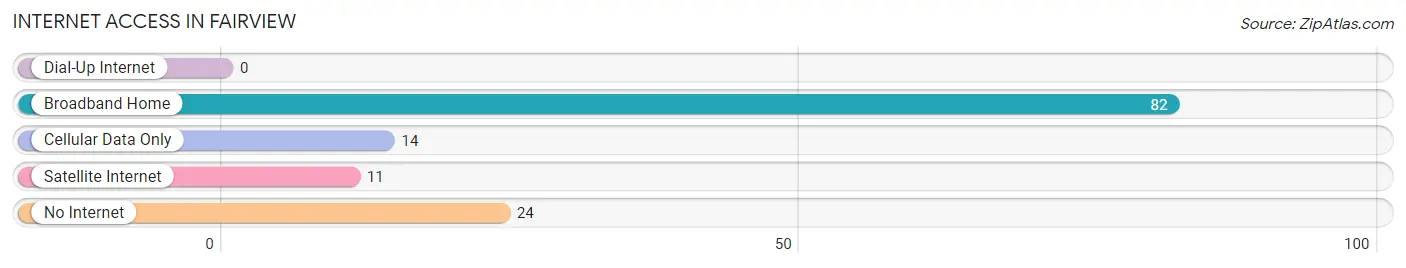
| Internet Type | # Households | % Households |
| Dial-Up Internet | 0 | 0.0% |
| Broadband Home | 82 | 64.6% |
| Cellular Data Only | 14 | 11.0% |
| Satellite Internet | 11 | 8.7% |
| No Internet | 24 | 18.9% |
| Total | 127 | 100.0% |
Fairview Summary
History
The small town of Fairview, Missouri is located in the northwest corner of the state, just south of the Iowa border. It is part of the St. Joseph metropolitan area and is home to a population of just over 1,000 people. The town was founded in 1856 by a group of settlers from Ohio, who named it after the nearby Fairview Church. The town was incorporated in 1872 and has remained a small, rural community ever since.
The town has a rich history of agriculture, with many of the original settlers being farmers. The town was also home to a number of small businesses, including a general store, a blacksmith shop, and a sawmill. In the early 1900s, the town was home to a number of small factories, including a brickyard, a canning factory, and a flour mill.
The town was also home to a number of churches, including the Fairview Church, which was founded in 1856 and is still active today. The town also had a number of schools, including a high school, which was established in 1891 and is still in operation today.
Geography
Fairview is located in the northwest corner of Missouri, just south of the Iowa border. It is part of the St. Joseph metropolitan area and is located about 30 miles north of St. Joseph. The town is situated on the banks of the Platte River and is surrounded by rolling hills and farmland. The town is located in the Central Lowland region of the United States and has a humid continental climate, with hot summers and cold winters.
Economy
The economy of Fairview is largely based on agriculture, with many of the town’s residents employed in farming and related industries. The town is also home to a number of small businesses, including a general store, a hardware store, and a restaurant. The town is also home to a number of manufacturing companies, including a brickyard, a canning factory, and a flour mill.
Demographics
As of the 2010 census, the population of Fairview was 1,072. The racial makeup of the town was 97.3% White, 0.7% African American, 0.3% Native American, 0.2% Asian, 0.1% Pacific Islander, and 1.4% from other races. The median household income was $37,917 and the median family income was $45,625. The per capita income was $19,945. The town had a poverty rate of 11.3%.
Conclusion
Fairview, Missouri is a small, rural town located in the northwest corner of the state. It has a rich history of agriculture and small businesses, and is home to a population of just over 1,000 people. The town has a largely agricultural economy, with many of the town’s residents employed in farming and related industries. The town also has a number of small businesses, manufacturing companies, and churches. The town has a diverse population, with a median household income of $37,917 and a poverty rate of 11.3%.
Common Questions
What is Per Capita Income in Fairview?
Per Capita income in Fairview is $18,487.
What is the Median Family Income in Fairview?
Median Family Income in Fairview is $52,188.
What is the Median Household income in Fairview?
Median Household Income in Fairview is $51,563.
What is Inequality or Gini Index in Fairview?
Inequality or Gini Index in Fairview is 0.36.
What is the Total Population of Fairview?
Total Population of Fairview is 398.
What is the Total Male Population of Fairview?
Total Male Population of Fairview is 189.
What is the Total Female Population of Fairview?
Total Female Population of Fairview is 209.
What is the Ratio of Males per 100 Females in Fairview?
There are 90.43 Males per 100 Females in Fairview.
What is the Ratio of Females per 100 Males in Fairview?
There are 110.58 Females per 100 Males in Fairview.
What is the Median Population Age in Fairview?
Median Population Age in Fairview is 35.5 Years.
What is the Average Family Size in Fairview
Average Family Size in Fairview is 3.3 People.
What is the Average Household Size in Fairview
Average Household Size in Fairview is 3.1 People.
How Large is the Labor Force in Fairview?
There are 173 People in the Labor Forcein in Fairview.
What is the Percentage of People in the Labor Force in Fairview?
56.5% of People are in the Labor Force in Fairview.
What is the Unemployment Rate in Fairview?
Unemployment Rate in Fairview is 24.9%.