Hurdland, MO Map & Demographics
Hurdland Map
Hurdland Overview
$21,788
PER CAPITA INCOME
$43,125
AVG FAMILY INCOME
$30,833
AVG HOUSEHOLD INCOME
0.50
INEQUALITY / GINI INDEX
224
TOTAL POPULATION
127
MALE POPULATION
97
FEMALE POPULATION
130.93
MALES / 100 FEMALES
76.38
FEMALES / 100 MALES
41.5
MEDIAN AGE
5.1
AVG FAMILY SIZE
3.2
AVG HOUSEHOLD SIZE
113
LABOR FORCE [ PEOPLE ]
62.8%
PERCENT IN LABOR FORCE
Hurdland Zip Codes
Hurdland Area Codes
Income in Hurdland
Income Overview in Hurdland
Per Capita Income in Hurdland is $21,788, while median incomes of families and households are $43,125 and $30,833 respectively.
| Characteristic | Number | Measure |
| Per Capita Income | 224 | $21,788 |
| Median Family Income | 31 | $43,125 |
| Mean Family Income | 31 | $60,990 |
| Median Household Income | 70 | $30,833 |
| Mean Household Income | 70 | $38,070 |
| Income Deficit | 31 | $0 |
| Wage / Income Gap (%) | 224 | 0.00% |
| Wage / Income Gap ($) | 224 | 100.00¢ per $1 |
| Gini / Inequality Index | 224 | 0.50 |
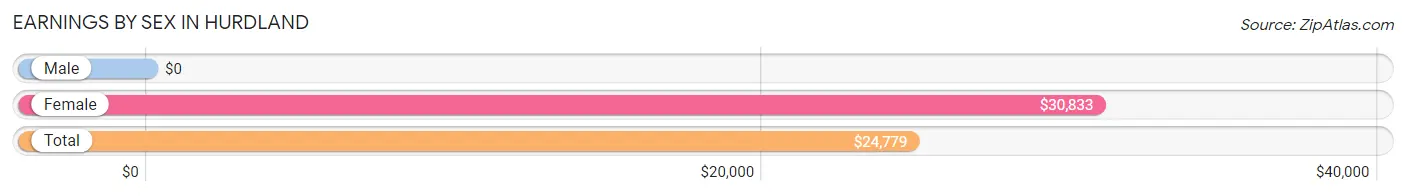
Earnings by Sex in Hurdland
| Sex | Number | Average Earnings |
| Male | 53 (45.3%) | $0 |
| Female | 64 (54.7%) | $30,833 |
| Total | 117 (100.0%) | $24,779 |
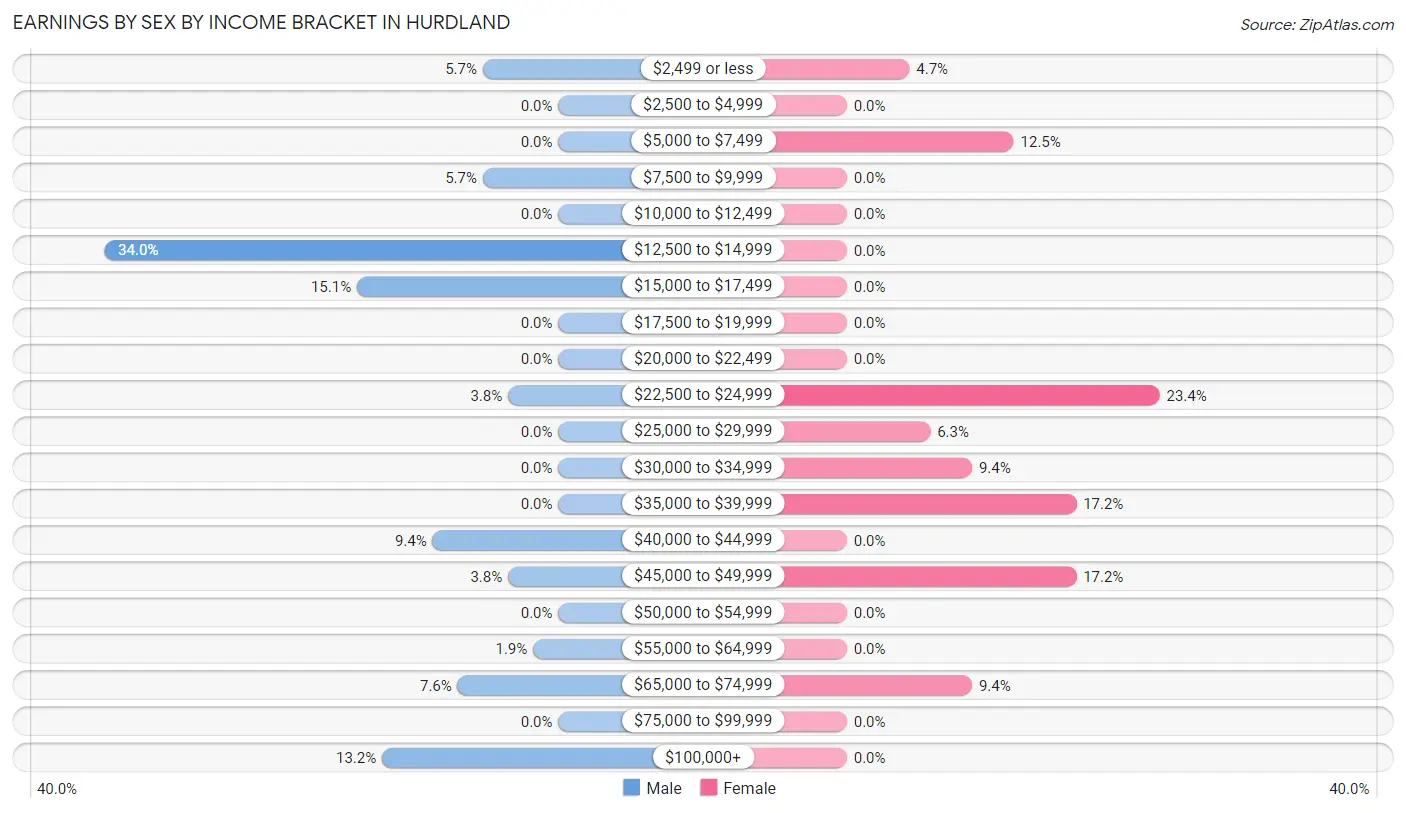
Earnings by Sex by Income Bracket in Hurdland
The most common earnings brackets in Hurdland are $12,500 to $14,999 for men (18 | 34.0%) and $22,500 to $24,999 for women (15 | 23.4%).
| Income | Male | Female |
| $2,499 or less | 3 (5.7%) | 3 (4.7%) |
| $2,500 to $4,999 | 0 (0.0%) | 0 (0.0%) |
| $5,000 to $7,499 | 0 (0.0%) | 8 (12.5%) |
| $7,500 to $9,999 | 3 (5.7%) | 0 (0.0%) |
| $10,000 to $12,499 | 0 (0.0%) | 0 (0.0%) |
| $12,500 to $14,999 | 18 (34.0%) | 0 (0.0%) |
| $15,000 to $17,499 | 8 (15.1%) | 0 (0.0%) |
| $17,500 to $19,999 | 0 (0.0%) | 0 (0.0%) |
| $20,000 to $22,499 | 0 (0.0%) | 0 (0.0%) |
| $22,500 to $24,999 | 2 (3.8%) | 15 (23.4%) |
| $25,000 to $29,999 | 0 (0.0%) | 4 (6.2%) |
| $30,000 to $34,999 | 0 (0.0%) | 6 (9.4%) |
| $35,000 to $39,999 | 0 (0.0%) | 11 (17.2%) |
| $40,000 to $44,999 | 5 (9.4%) | 0 (0.0%) |
| $45,000 to $49,999 | 2 (3.8%) | 11 (17.2%) |
| $50,000 to $54,999 | 0 (0.0%) | 0 (0.0%) |
| $55,000 to $64,999 | 1 (1.9%) | 0 (0.0%) |
| $65,000 to $74,999 | 4 (7.5%) | 6 (9.4%) |
| $75,000 to $99,999 | 0 (0.0%) | 0 (0.0%) |
| $100,000+ | 7 (13.2%) | 0 (0.0%) |
| Total | 53 (100.0%) | 64 (100.0%) |
Earnings by Sex by Educational Attainment in Hurdland
| Educational Attainment | Male Income | Female Income |
| Less than High School | - | - |
| High School Diploma | - | - |
| College or Associate's Degree | - | - |
| Bachelor's Degree | - | - |
| Graduate Degree | - | - |
| Total | - | - |
Family Income in Hurdland
Family Income Brackets in Hurdland
According to the Hurdland family income data, there are 11 families falling into the $35,000 to $49,999 income range, which is the most common income bracket and makes up 35.5% of all families.

| Income Bracket | # Families | % Families |
| Less than $10,000 | 0 | 0.0% |
| $10,000 to $14,999 | 0 | 0.0% |
| $15,000 to $24,999 | 2 | 6.5% |
| $25,000 to $34,999 | 6 | 19.4% |
| $35,000 to $49,999 | 11 | 35.5% |
| $50,000 to $74,999 | 6 | 19.4% |
| $75,000 to $99,999 | 1 | 3.2% |
| $100,000 to $149,999 | 4 | 12.9% |
| $150,000 to $199,999 | 0 | 0.0% |
| $200,000+ | 1 | 3.2% |
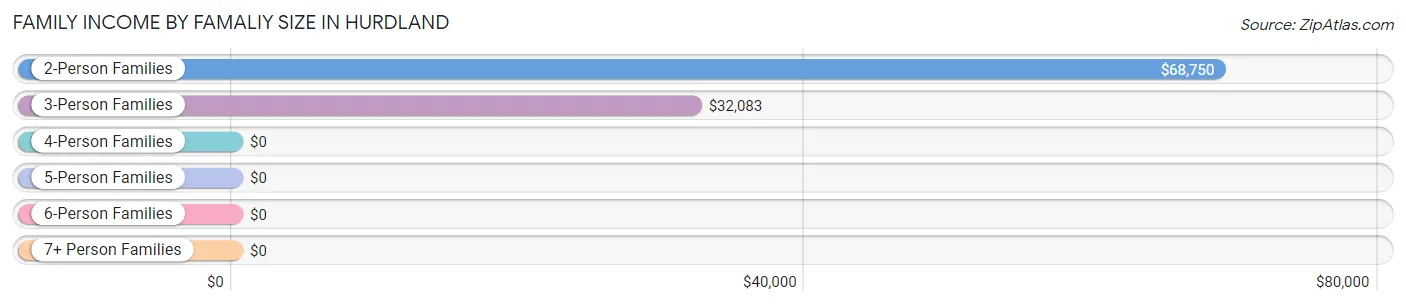
Family Income by Famaliy Size in Hurdland
2-person families (10 | 32.3%) account for the highest median family income in Hurdland with $68,750 per family, while 2-person families (10 | 32.3%) have the highest median income of $34,375 per family member.
| Income Bracket | # Families | Median Income |
| 2-Person Families | 10 (32.3%) | $68,750 |
| 3-Person Families | 14 (45.2%) | $32,083 |
| 4-Person Families | 3 (9.7%) | $0 |
| 5-Person Families | 4 (12.9%) | $0 |
| 6-Person Families | 0 (0.0%) | $0 |
| 7+ Person Families | 0 (0.0%) | $0 |
| Total | 31 (100.0%) | $43,125 |
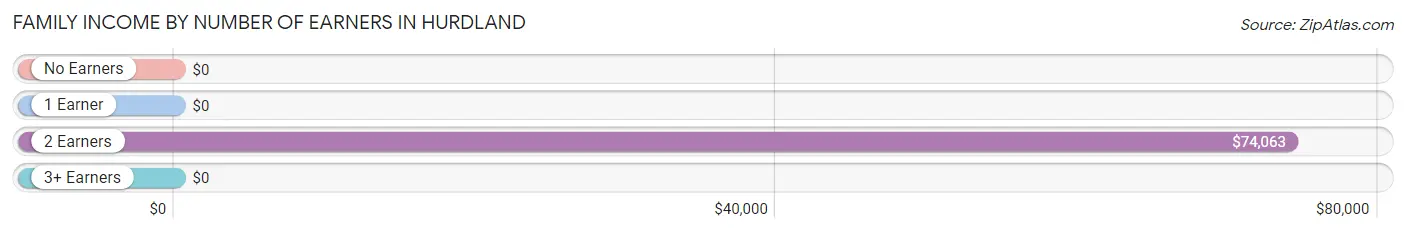
Family Income by Number of Earners in Hurdland
| Number of Earners | # Families | Median Income |
| No Earners | 7 (22.6%) | $0 |
| 1 Earner | 14 (45.2%) | $0 |
| 2 Earners | 9 (29.0%) | $74,063 |
| 3+ Earners | 1 (3.2%) | $0 |
| Total | 31 (100.0%) | $43,125 |
Household Income in Hurdland
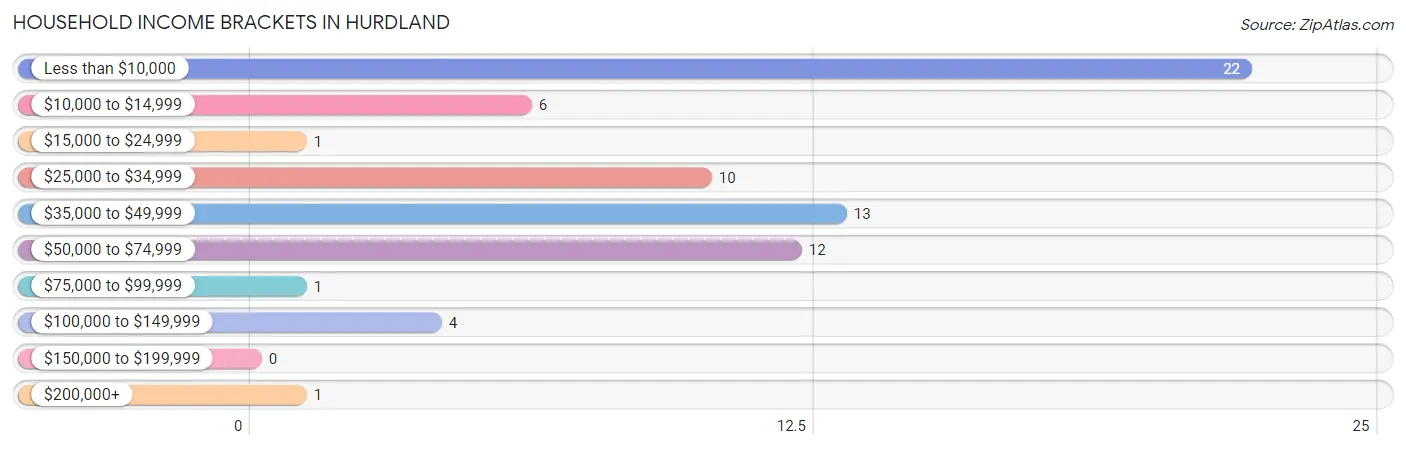
Household Income Brackets in Hurdland
With 22 households falling in the category, the less than $10,000 income range is the most frequent in Hurdland, accounting for 31.4% of all households.
| Income Bracket | # Households | % Households |
| Less than $10,000 | 22 | 31.4% |
| $10,000 to $14,999 | 6 | 8.6% |
| $15,000 to $24,999 | 1 | 1.4% |
| $25,000 to $34,999 | 10 | 14.3% |
| $35,000 to $49,999 | 13 | 18.6% |
| $50,000 to $74,999 | 12 | 17.1% |
| $75,000 to $99,999 | 1 | 1.4% |
| $100,000 to $149,999 | 4 | 5.7% |
| $150,000 to $199,999 | 0 | 0.0% |
| $200,000+ | 1 | 1.4% |
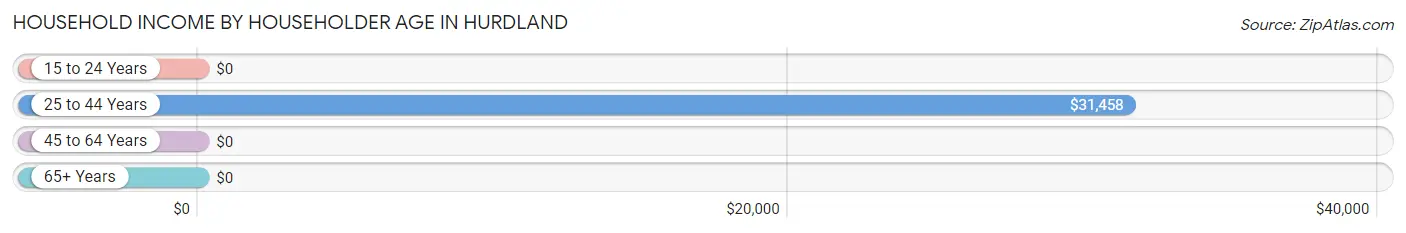
Household Income by Householder Age in Hurdland
The median household income in Hurdland is $30,833, with the highest median household income of $31,458 found in the 25 to 44 years age bracket for the primary householder. A total of 31 households (44.3%) fall into this category.
| Income Bracket | # Households | Median Income |
| 15 to 24 Years | 0 (0.0%) | $0 |
| 25 to 44 Years | 31 (44.3%) | $31,458 |
| 45 to 64 Years | 21 (30.0%) | $0 |
| 65+ Years | 18 (25.7%) | $0 |
| Total | 70 (100.0%) | $30,833 |
Poverty in Hurdland
Income Below Poverty by Sex and Age in Hurdland
With 32.3% poverty level for males and 18.6% for females among the residents of Hurdland, 45 to 54 year old males and 55 to 64 year old females are the most vulnerable to poverty, with 23 males (85.2%) and 5 females (45.5%) in their respective age groups living below the poverty level.
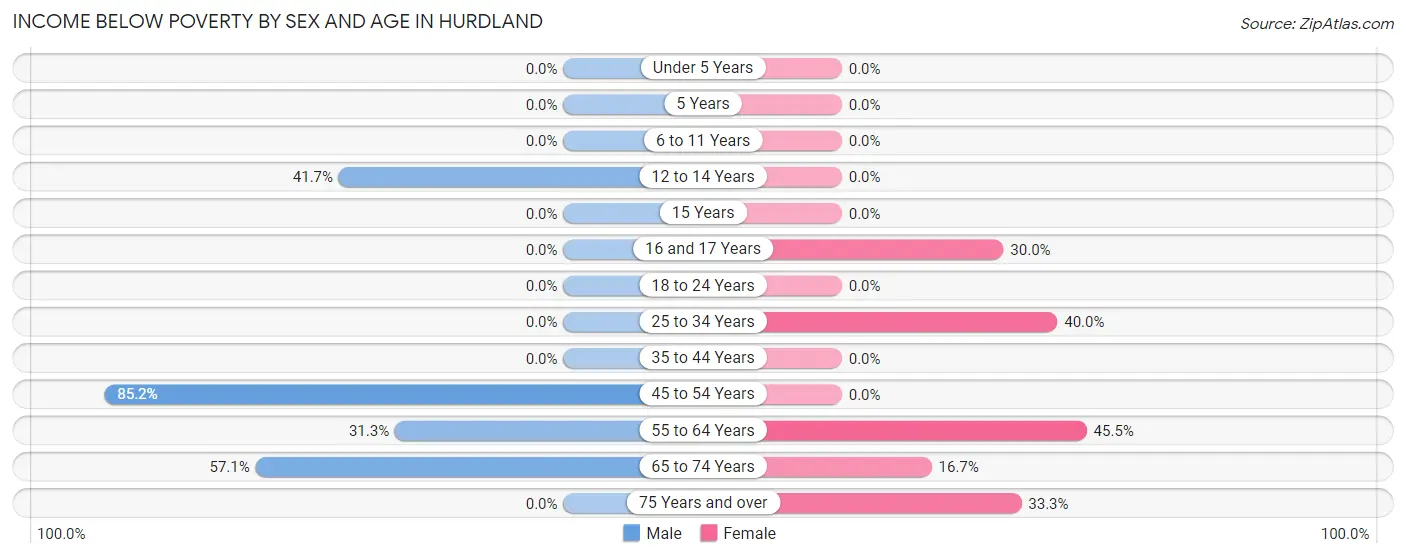
| Age Bracket | Male | Female |
| Under 5 Years | 0 (0.0%) | 0 (0.0%) |
| 5 Years | 0 (0.0%) | 0 (0.0%) |
| 6 to 11 Years | 0 (0.0%) | 0 (0.0%) |
| 12 to 14 Years | 5 (41.7%) | 0 (0.0%) |
| 15 Years | 0 (0.0%) | 0 (0.0%) |
| 16 and 17 Years | 0 (0.0%) | 3 (30.0%) |
| 18 to 24 Years | 0 (0.0%) | 0 (0.0%) |
| 25 to 34 Years | 0 (0.0%) | 8 (40.0%) |
| 35 to 44 Years | 0 (0.0%) | 0 (0.0%) |
| 45 to 54 Years | 23 (85.2%) | 0 (0.0%) |
| 55 to 64 Years | 5 (31.2%) | 5 (45.5%) |
| 65 to 74 Years | 8 (57.1%) | 1 (16.7%) |
| 75 Years and over | 0 (0.0%) | 1 (33.3%) |
| Total | 41 (32.3%) | 18 (18.6%) |
Income Above Poverty by Sex and Age in Hurdland
According to the poverty statistics in Hurdland, males aged under 5 years and females aged 6 to 11 years are the age groups that are most secure financially, with 100.0% of males and 100.0% of females in these age groups living above the poverty line.
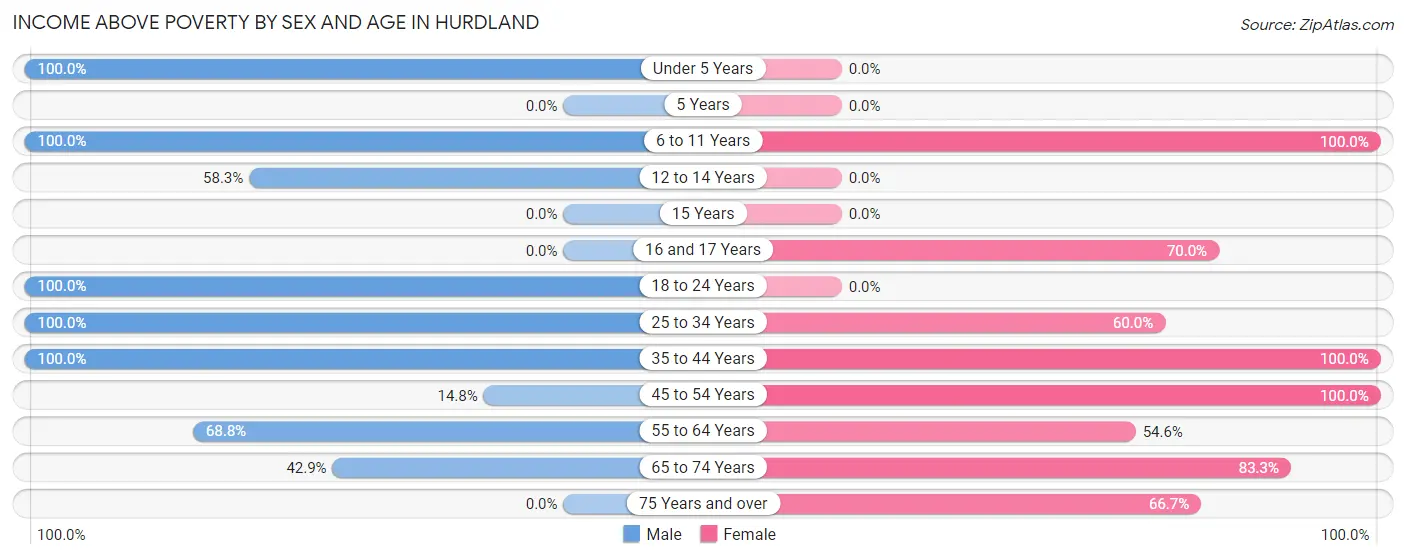
| Age Bracket | Male | Female |
| Under 5 Years | 8 (100.0%) | 0 (0.0%) |
| 5 Years | 0 (0.0%) | 0 (0.0%) |
| 6 to 11 Years | 21 (100.0%) | 3 (100.0%) |
| 12 to 14 Years | 7 (58.3%) | 0 (0.0%) |
| 15 Years | 0 (0.0%) | 0 (0.0%) |
| 16 and 17 Years | 0 (0.0%) | 7 (70.0%) |
| 18 to 24 Years | 18 (100.0%) | 0 (0.0%) |
| 25 to 34 Years | 6 (100.0%) | 12 (60.0%) |
| 35 to 44 Years | 5 (100.0%) | 32 (100.0%) |
| 45 to 54 Years | 4 (14.8%) | 12 (100.0%) |
| 55 to 64 Years | 11 (68.8%) | 6 (54.5%) |
| 65 to 74 Years | 6 (42.9%) | 5 (83.3%) |
| 75 Years and over | 0 (0.0%) | 2 (66.7%) |
| Total | 86 (67.7%) | 79 (81.4%) |
Income Below Poverty Among Married-Couple Families in Hurdland
| Children | Above Poverty | Below Poverty |
| No Children | 10 (100.0%) | 0 (0.0%) |
| 1 or 2 Children | 10 (100.0%) | 0 (0.0%) |
| 3 or 4 Children | 0 (0.0%) | 0 (0.0%) |
| 5 or more Children | 0 (0.0%) | 0 (0.0%) |
| Total | 20 (100.0%) | 0 (0.0%) |
Income Below Poverty Among Single-Parent Households in Hurdland
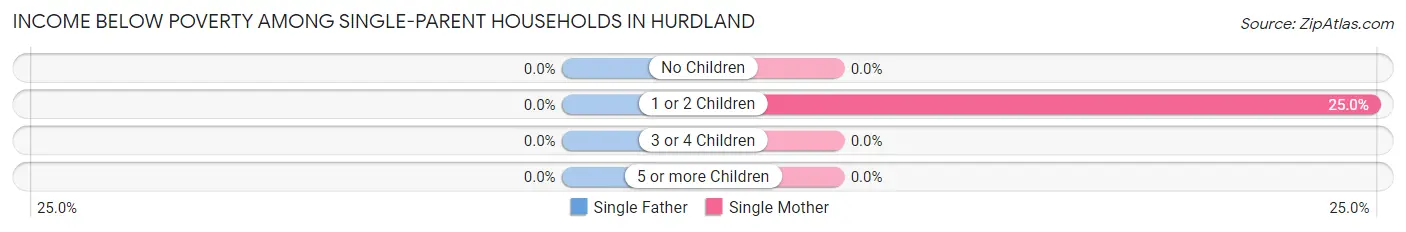
| Children | Single Father | Single Mother |
| No Children | 0 (0.0%) | 0 (0.0%) |
| 1 or 2 Children | 0 (0.0%) | 2 (25.0%) |
| 3 or 4 Children | 0 (0.0%) | 0 (0.0%) |
| 5 or more Children | 0 (0.0%) | 0 (0.0%) |
| Total | 0 (0.0%) | 2 (18.2%) |
Income Below Poverty Among Married-Couple vs Single-Parent Households in Hurdland
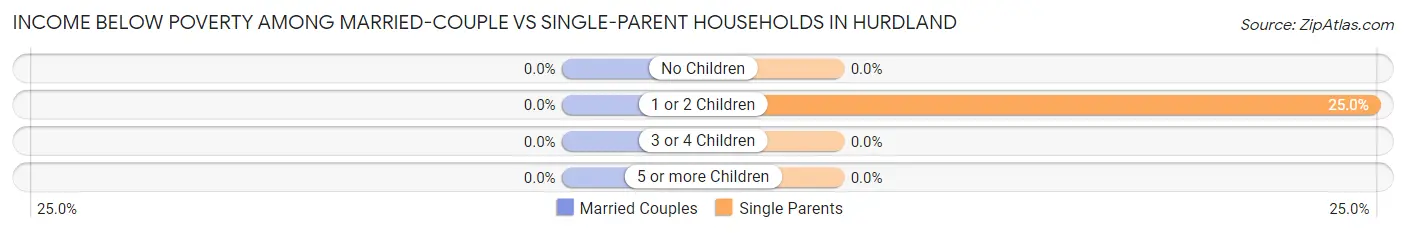
| Children | Married-Couple Families | Single-Parent Households |
| No Children | 0 (0.0%) | 0 (0.0%) |
| 1 or 2 Children | 0 (0.0%) | 2 (25.0%) |
| 3 or 4 Children | 0 (0.0%) | 0 (0.0%) |
| 5 or more Children | 0 (0.0%) | 0 (0.0%) |
| Total | 0 (0.0%) | 2 (18.2%) |
Race in Hurdland
The most populous races in Hurdland are White / Caucasian (215 | 96.0%), and Asian (9 | 4.0%).
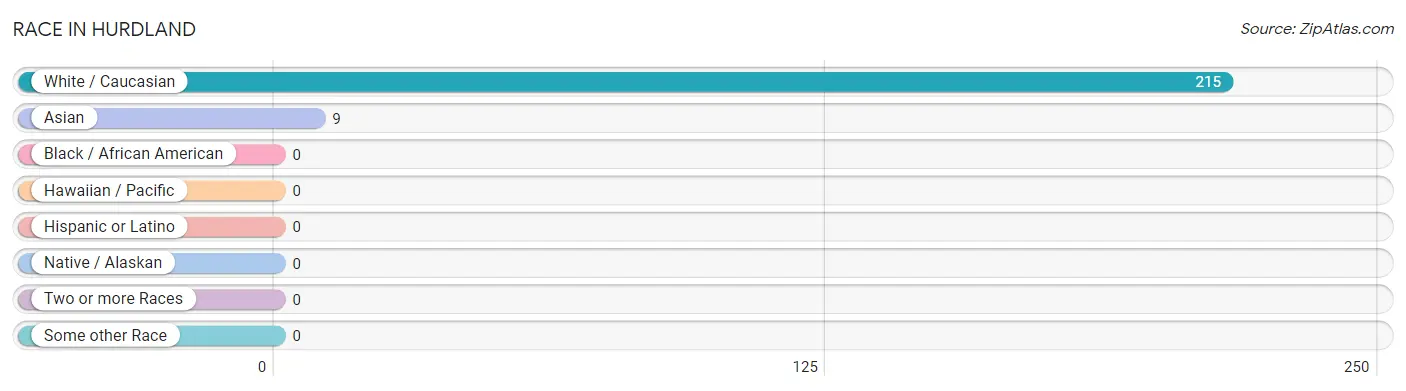
| Race | # Population | % Population |
| Asian | 9 | 4.0% |
| Black / African American | 0 | 0.0% |
| Hawaiian / Pacific | 0 | 0.0% |
| Hispanic or Latino | 0 | 0.0% |
| Native / Alaskan | 0 | 0.0% |
| White / Caucasian | 215 | 96.0% |
| Two or more Races | 0 | 0.0% |
| Some other Race | 0 | 0.0% |
| Total | 224 | 100.0% |
Ancestry in Hurdland
The most populous ancestries reported in Hurdland are English (55 | 24.5%), German (21 | 9.4%), American (14 | 6.2%), Irish (11 | 4.9%), and Korean (9 | 4.0%), together accounting for 49.1% of all Hurdland residents.
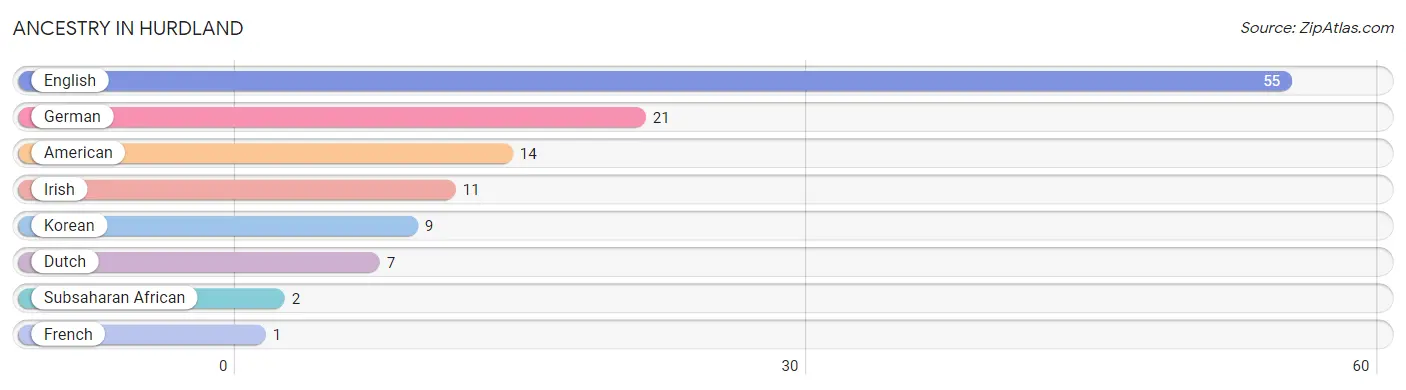
| Ancestry | # Population | % Population |
| American | 14 | 6.2% |
| Dutch | 7 | 3.1% |
| English | 55 | 24.5% |
| French | 1 | 0.4% |
| German | 21 | 9.4% |
| Irish | 11 | 4.9% |
| Korean | 9 | 4.0% |
| Subsaharan African | 2 | 0.9% | View All 8 Rows |
Immigrants in Hurdland
The most numerous immigrant groups reported in Hurdland came from Asia (9 | 4.0%), Philippines (9 | 4.0%), and South Eastern Asia (9 | 4.0%), together accounting for 12.1% of all Hurdland residents.
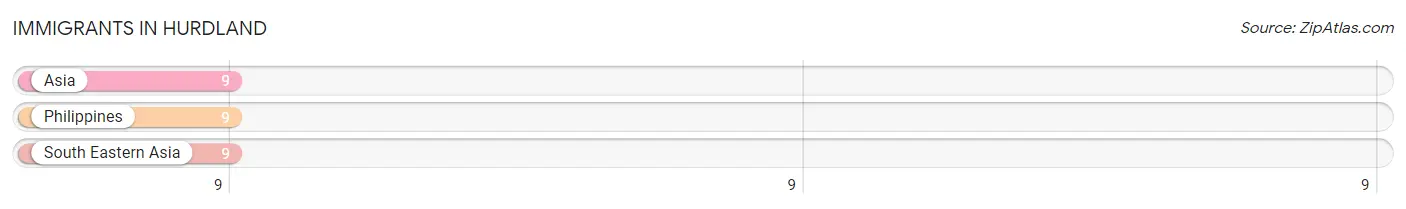
| Immigration Origin | # Population | % Population |
| Asia | 9 | 4.0% |
| Philippines | 9 | 4.0% |
| South Eastern Asia | 9 | 4.0% | View All 3 Rows |
Sex and Age in Hurdland
Sex and Age in Hurdland
The most populous age groups in Hurdland are 50 to 54 Years (20 | 15.8%) for men and 30 to 34 Years (20 | 20.6%) for women.
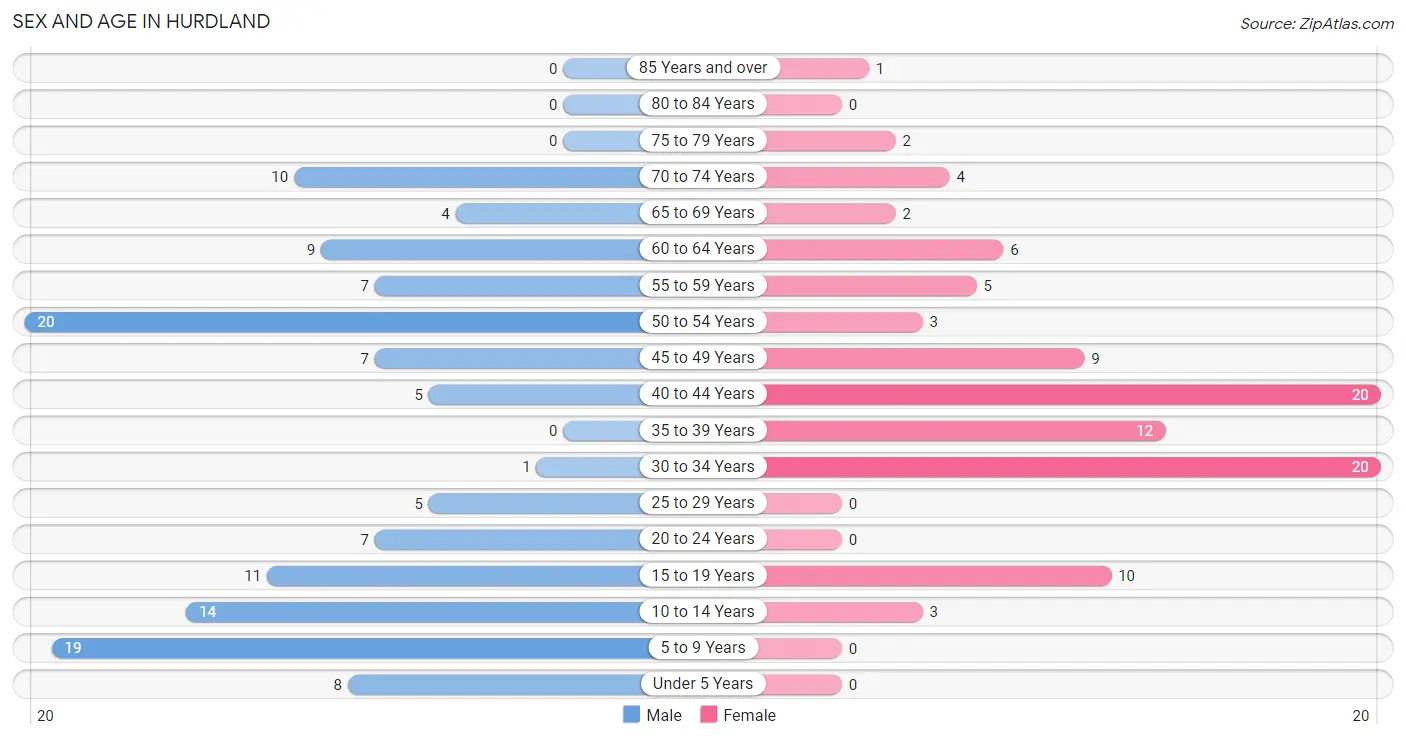
| Age Bracket | Male | Female |
| Under 5 Years | 8 (6.3%) | 0 (0.0%) |
| 5 to 9 Years | 19 (15.0%) | 0 (0.0%) |
| 10 to 14 Years | 14 (11.0%) | 3 (3.1%) |
| 15 to 19 Years | 11 (8.7%) | 10 (10.3%) |
| 20 to 24 Years | 7 (5.5%) | 0 (0.0%) |
| 25 to 29 Years | 5 (3.9%) | 0 (0.0%) |
| 30 to 34 Years | 1 (0.8%) | 20 (20.6%) |
| 35 to 39 Years | 0 (0.0%) | 12 (12.4%) |
| 40 to 44 Years | 5 (3.9%) | 20 (20.6%) |
| 45 to 49 Years | 7 (5.5%) | 9 (9.3%) |
| 50 to 54 Years | 20 (15.8%) | 3 (3.1%) |
| 55 to 59 Years | 7 (5.5%) | 5 (5.1%) |
| 60 to 64 Years | 9 (7.1%) | 6 (6.2%) |
| 65 to 69 Years | 4 (3.2%) | 2 (2.1%) |
| 70 to 74 Years | 10 (7.9%) | 4 (4.1%) |
| 75 to 79 Years | 0 (0.0%) | 2 (2.1%) |
| 80 to 84 Years | 0 (0.0%) | 0 (0.0%) |
| 85 Years and over | 0 (0.0%) | 1 (1.0%) |
| Total | 127 (100.0%) | 97 (100.0%) |
Families and Households in Hurdland
Median Family Size in Hurdland
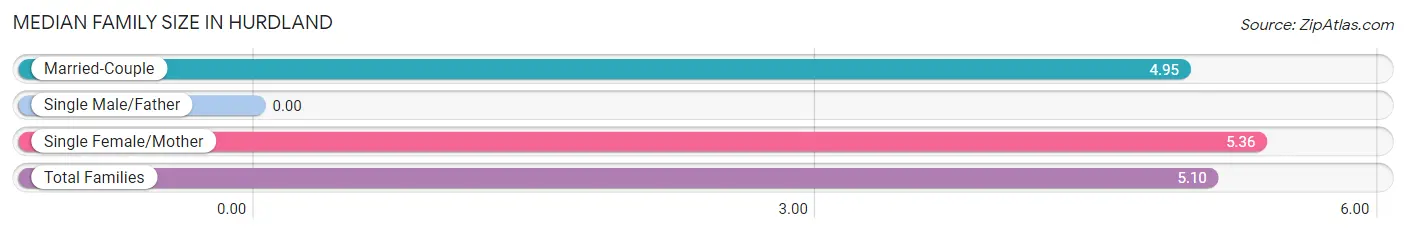
| Family Type | # Families | Family Size |
| Married-Couple | 20 (64.5%) | 4.95 |
| Single Male/Father | 0 (0.0%) | - |
| Single Female/Mother | 11 (35.5%) | 5.36 |
| Total Families | 31 (100.0%) | 5.10 |
Median Household Size in Hurdland
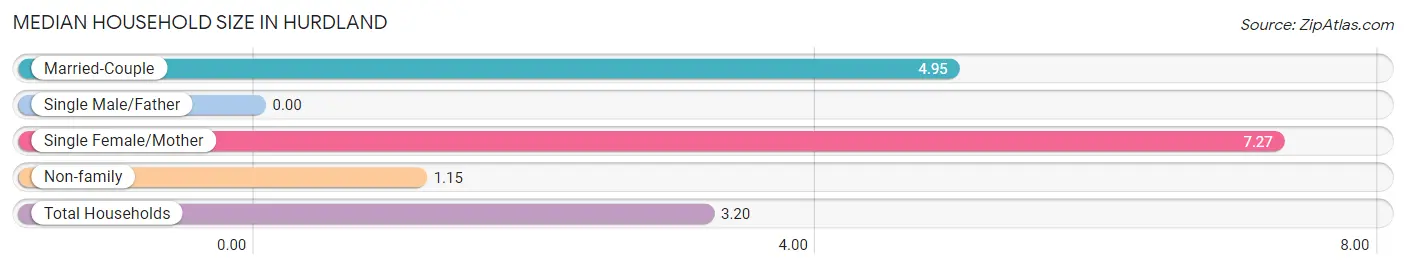
| Household Type | # Households | Household Size |
| Married-Couple | 20 (28.6%) | 4.95 |
| Single Male/Father | 0 (0.0%) | - |
| Single Female/Mother | 11 (15.7%) | 7.27 |
| Non-family | 39 (55.7%) | 1.15 |
| Total Households | 70 (100.0%) | 3.20 |
Household Size by Marriage Status in Hurdland
Out of a total of 70 households in Hurdland, 31 (44.3%) are family households, while 39 (55.7%) are nonfamily households. The most numerous type of family households are 4-person households, comprising 11, and the most common type of nonfamily households are 1-person households, comprising 34.
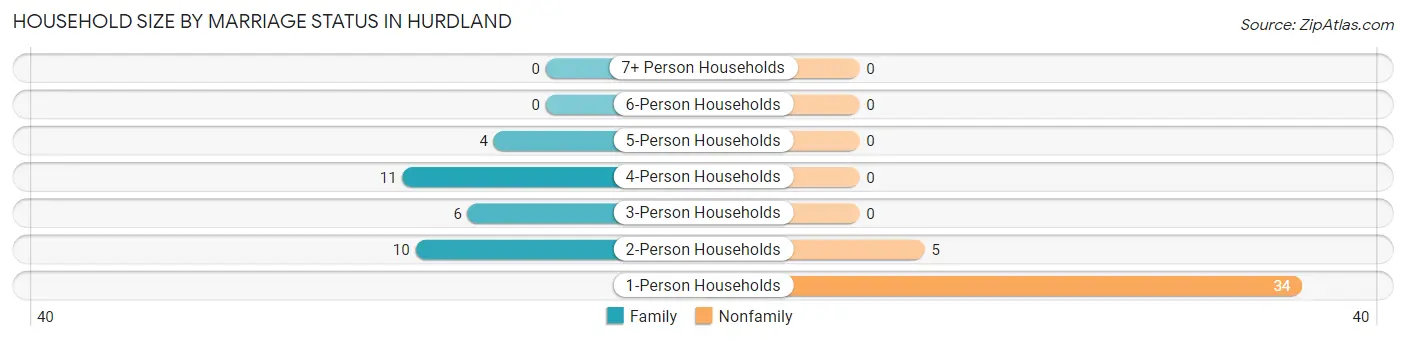
| Household Size | Family Households | Nonfamily Households |
| 1-Person Households | - | 34 (48.6%) |
| 2-Person Households | 10 (14.3%) | 5 (7.1%) |
| 3-Person Households | 6 (8.6%) | 0 (0.0%) |
| 4-Person Households | 11 (15.7%) | 0 (0.0%) |
| 5-Person Households | 4 (5.7%) | 0 (0.0%) |
| 6-Person Households | 0 (0.0%) | 0 (0.0%) |
| 7+ Person Households | 0 (0.0%) | 0 (0.0%) |
| Total | 31 (44.3%) | 39 (55.7%) |
Female Fertility in Hurdland
Fertility by Age in Hurdland
| Age Bracket | Women with Births | Births / 1,000 Women |
| 15 to 19 years | 0 (0.0%) | 0.0 |
| 20 to 34 years | 0 (0.0%) | 0.0 |
| 35 to 50 years | 0 (0.0%) | 0.0 |
| Total | 0 (0.0%) | 0.0 |
Fertility by Age by Marriage Status in Hurdland
| Age Bracket | Married | Unmarried |
| 15 to 19 years | 0 (0.0%) | 0 (0.0%) |
| 20 to 34 years | 0 (0.0%) | 0 (0.0%) |
| 35 to 50 years | 0 (0.0%) | 0 (0.0%) |
| Total | 0 (0.0%) | 0 (0.0%) |
Fertility by Education in Hurdland
| Educational Attainment | Women with Births | Births / 1,000 Women |
| Less than High School | 0 (0.0%) | 0.0 |
| High School Diploma | 0 (0.0%) | 0.0 |
| College or Associate's Degree | 0 (0.0%) | 0.0 |
| Bachelor's Degree | 0 (0.0%) | 0.0 |
| Graduate Degree | 0 (0.0%) | 0.0 |
| Total | 0 (0.0%) | 0.0 |
Fertility by Education by Marriage Status in Hurdland
| Educational Attainment | Married | Unmarried |
| Less than High School | 0 (0.0%) | 0 (0.0%) |
| High School Diploma | 0 (0.0%) | 0 (0.0%) |
| College or Associate's Degree | 0 (0.0%) | 0 (0.0%) |
| Bachelor's Degree | 0 (0.0%) | 0 (0.0%) |
| Graduate Degree | 0 (0.0%) | 0 (0.0%) |
| Total | 0 (0.0%) | 0 (0.0%) |
Employment Characteristics in Hurdland
Employment by Class of Employer in Hurdland
Among the 113 employed individuals in Hurdland, private company employees (70 | 62.0%), not-for-profit organizations (12 | 10.6%), and federal government employees (12 | 10.6%) make up the most common classes of employment.
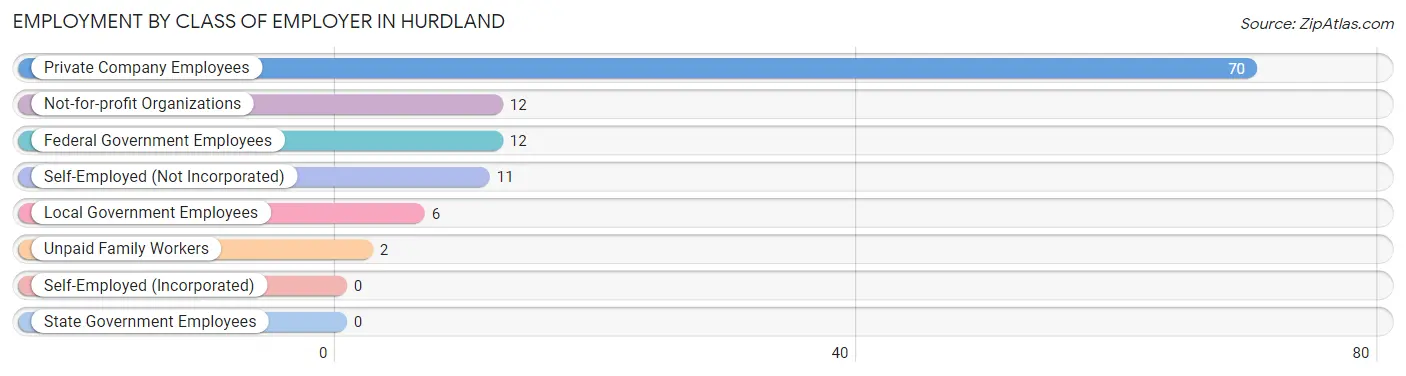
| Employer Class | # Employees | % Employees |
| Private Company Employees | 70 | 62.0% |
| Self-Employed (Incorporated) | 0 | 0.0% |
| Self-Employed (Not Incorporated) | 11 | 9.7% |
| Not-for-profit Organizations | 12 | 10.6% |
| Local Government Employees | 6 | 5.3% |
| State Government Employees | 0 | 0.0% |
| Federal Government Employees | 12 | 10.6% |
| Unpaid Family Workers | 2 | 1.8% |
| Total | 113 | 100.0% |
Employment Status by Age in Hurdland
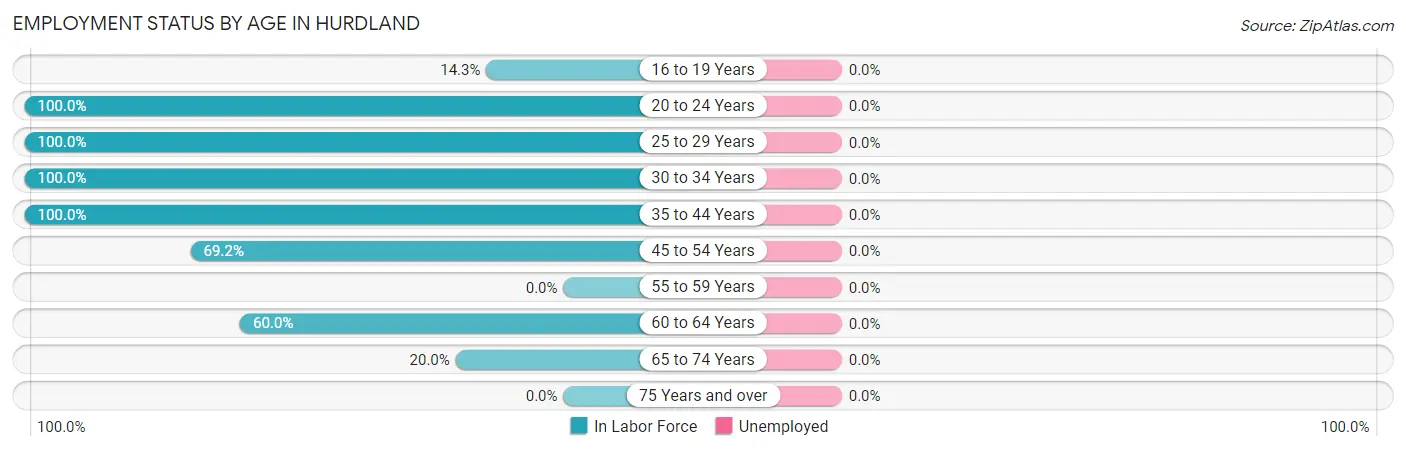
| Age Bracket | In Labor Force | Unemployed |
| 16 to 19 Years | 3 (14.3%) | 0 (0.0%) |
| 20 to 24 Years | 7 (100.0%) | 0 (0.0%) |
| 25 to 29 Years | 5 (100.0%) | 0 (0.0%) |
| 30 to 34 Years | 21 (100.0%) | 0 (0.0%) |
| 35 to 44 Years | 37 (100.0%) | 0 (0.0%) |
| 45 to 54 Years | 27 (69.2%) | 0 (0.0%) |
| 55 to 59 Years | 0 (0.0%) | 0 (0.0%) |
| 60 to 64 Years | 9 (60.0%) | 0 (0.0%) |
| 65 to 74 Years | 4 (20.0%) | 0 (0.0%) |
| 75 Years and over | 0 (0.0%) | 0 (0.0%) |
| Total | 113 (62.8%) | 0 (0.0%) |
Employment Status by Educational Attainment in Hurdland
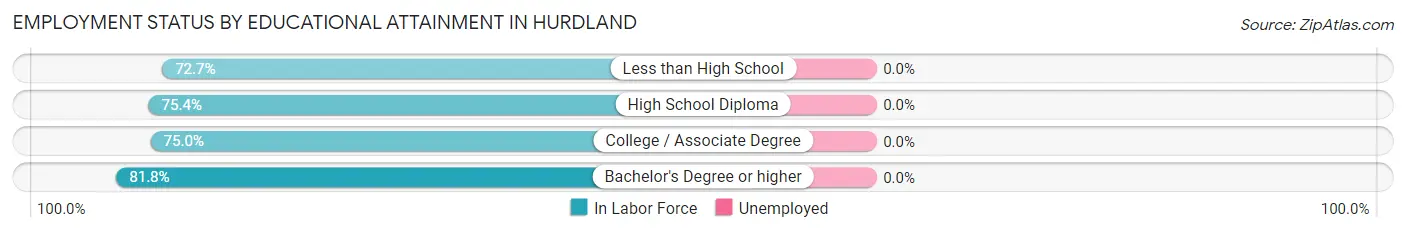
| Educational Attainment | In Labor Force | Unemployed |
| Less than High School | 8 (72.7%) | 0 (0.0%) |
| High School Diploma | 43 (75.4%) | 0 (0.0%) |
| College / Associate Degree | 21 (75.0%) | 0 (0.0%) |
| Bachelor's Degree or higher | 27 (81.8%) | 0 (0.0%) |
| Total | 99 (76.7%) | 0 (0.0%) |
Employment Occupations by Sex in Hurdland
Management, Business, Science and Arts Occupations
The most common Management, Business, Science and Arts occupations in Hurdland are Management (10 | 8.8%), Health Diagnosing & Treating (8 | 7.1%), Community & Social Service (2 | 1.8%), and Education Instruction & Library (2 | 1.8%).
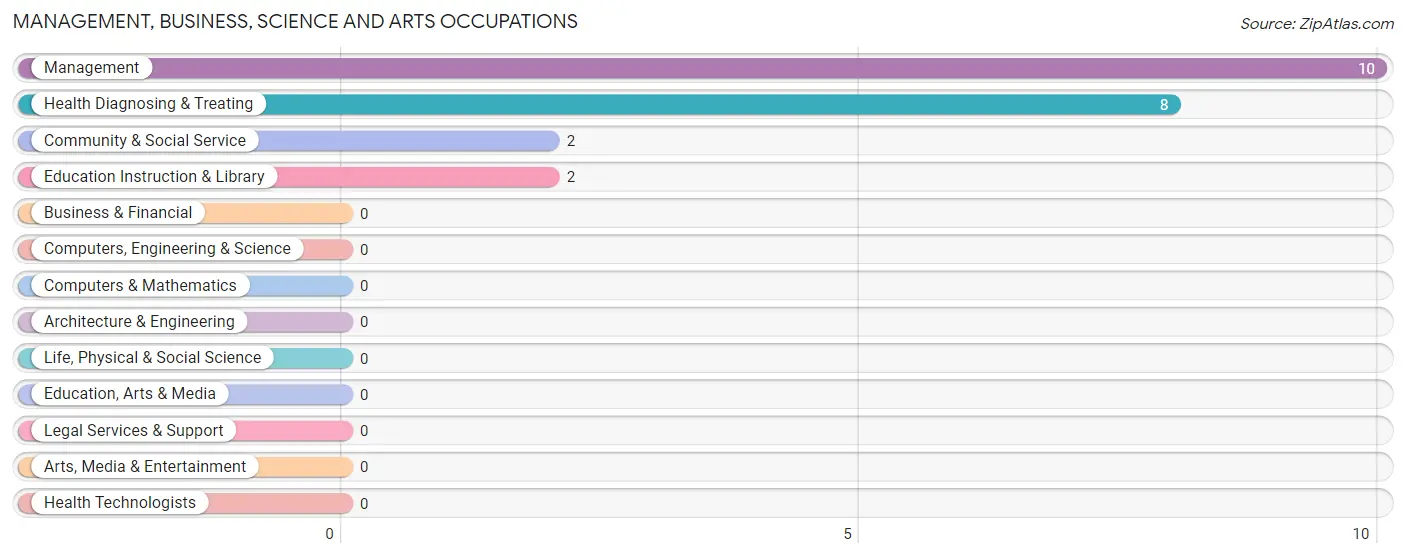
Management, Business, Science and Arts Occupations by Sex
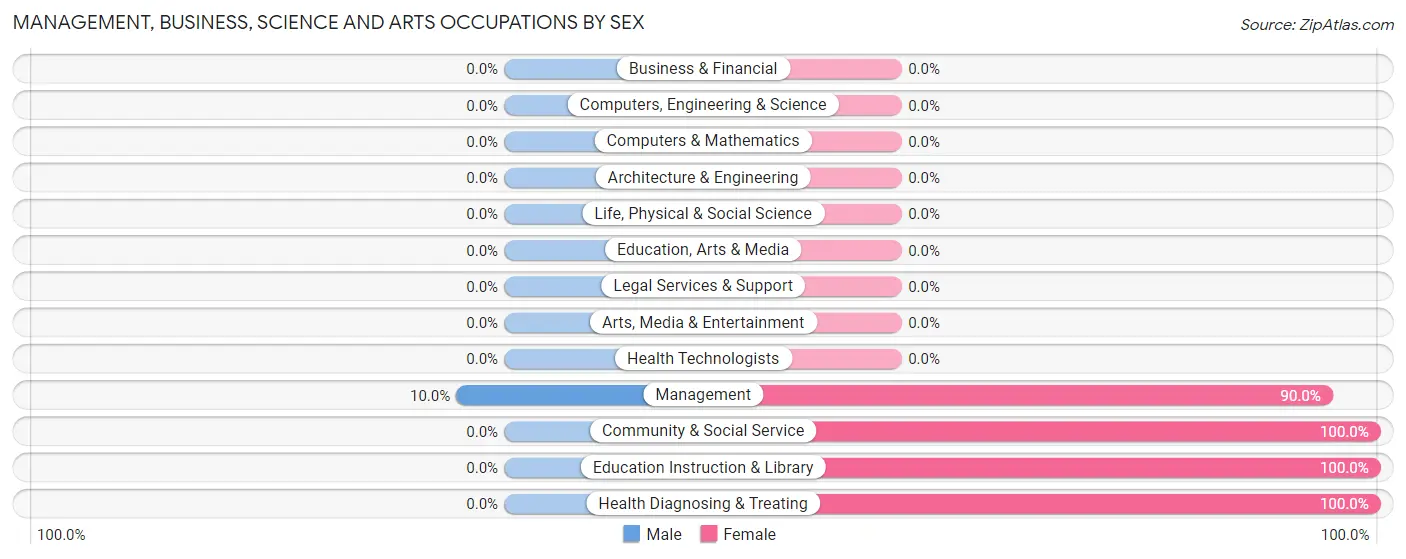
| Occupation | Male | Female |
| Management | 1 (10.0%) | 9 (90.0%) |
| Business & Financial | 0 (0.0%) | 0 (0.0%) |
| Computers, Engineering & Science | 0 (0.0%) | 0 (0.0%) |
| Computers & Mathematics | 0 (0.0%) | 0 (0.0%) |
| Architecture & Engineering | 0 (0.0%) | 0 (0.0%) |
| Life, Physical & Social Science | 0 (0.0%) | 0 (0.0%) |
| Community & Social Service | 0 (0.0%) | 2 (100.0%) |
| Education, Arts & Media | 0 (0.0%) | 0 (0.0%) |
| Legal Services & Support | 0 (0.0%) | 0 (0.0%) |
| Education Instruction & Library | 0 (0.0%) | 2 (100.0%) |
| Arts, Media & Entertainment | 0 (0.0%) | 0 (0.0%) |
| Health Diagnosing & Treating | 0 (0.0%) | 8 (100.0%) |
| Health Technologists | 0 (0.0%) | 0 (0.0%) |
| Total (Category) | 1 (5.0%) | 19 (95.0%) |
| Total (Overall) | 50 (44.3%) | 63 (55.7%) |
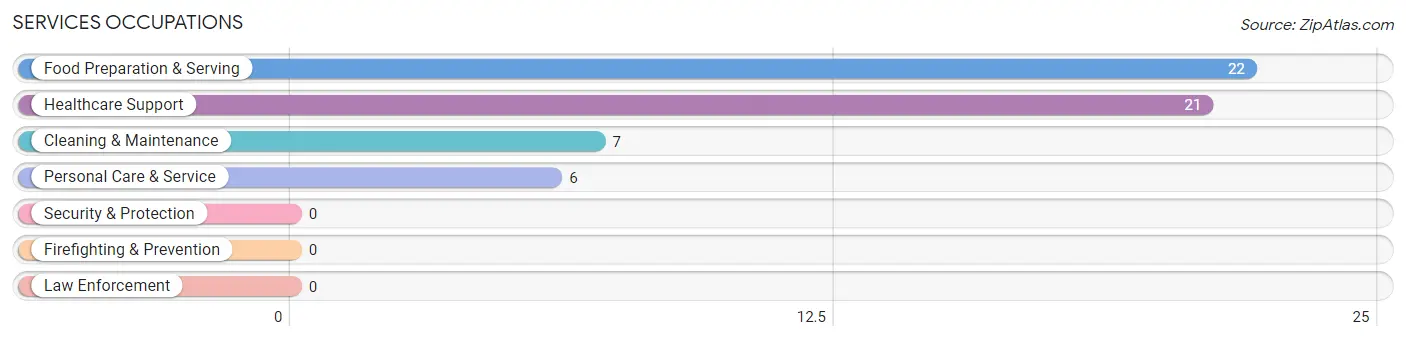
Services Occupations
The most common Services occupations in Hurdland are Food Preparation & Serving (22 | 19.5%), Healthcare Support (21 | 18.6%), Cleaning & Maintenance (7 | 6.2%), and Personal Care & Service (6 | 5.3%).
Services Occupations by Sex
Within the Services occupations in Hurdland, the most male-oriented occupations are Cleaning & Maintenance (100.0%), and Food Preparation & Serving (81.8%), while the most female-oriented occupations are Healthcare Support (100.0%), Personal Care & Service (100.0%), and Food Preparation & Serving (18.2%).
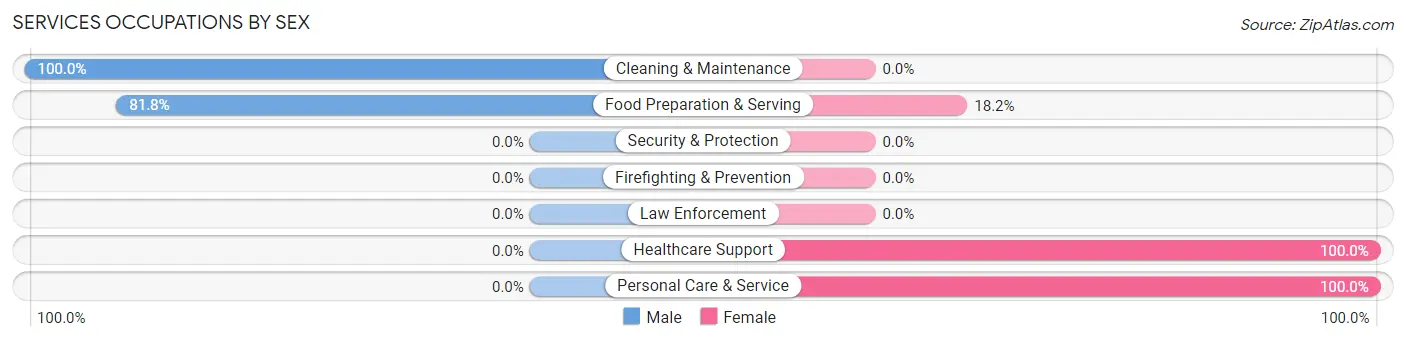
| Occupation | Male | Female |
| Healthcare Support | 0 (0.0%) | 21 (100.0%) |
| Security & Protection | 0 (0.0%) | 0 (0.0%) |
| Firefighting & Prevention | 0 (0.0%) | 0 (0.0%) |
| Law Enforcement | 0 (0.0%) | 0 (0.0%) |
| Food Preparation & Serving | 18 (81.8%) | 4 (18.2%) |
| Cleaning & Maintenance | 7 (100.0%) | 0 (0.0%) |
| Personal Care & Service | 0 (0.0%) | 6 (100.0%) |
| Total (Category) | 25 (44.6%) | 31 (55.4%) |
| Total (Overall) | 50 (44.3%) | 63 (55.7%) |
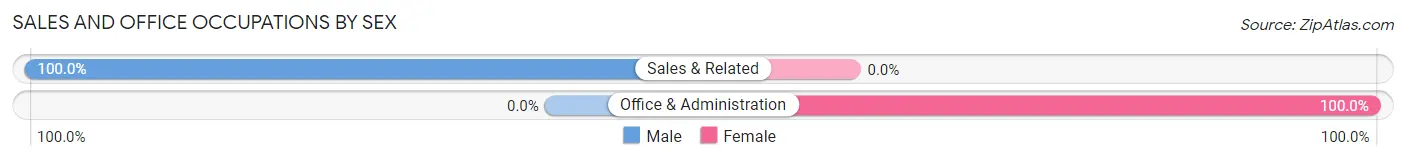
Sales and Office Occupations
The most common Sales and Office occupations in Hurdland are Sales & Related (3 | 2.6%), and Office & Administration (3 | 2.6%).
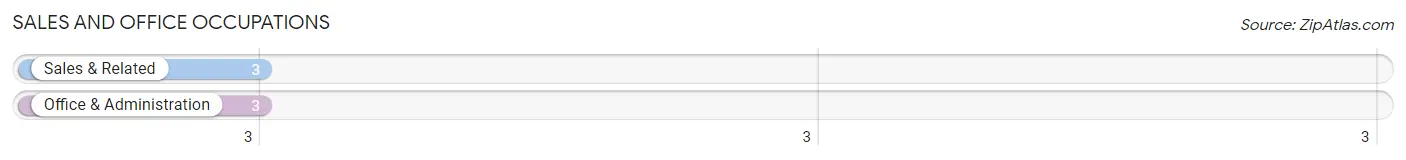
Sales and Office Occupations by Sex
| Occupation | Male | Female |
| Sales & Related | 3 (100.0%) | 0 (0.0%) |
| Office & Administration | 0 (0.0%) | 3 (100.0%) |
| Total (Category) | 3 (50.0%) | 3 (50.0%) |
| Total (Overall) | 50 (44.3%) | 63 (55.7%) |
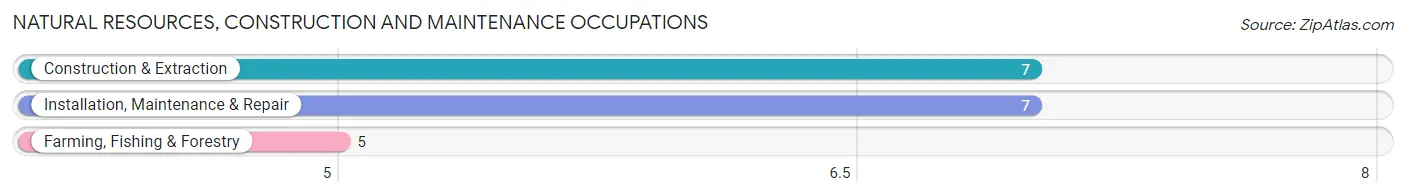
Natural Resources, Construction and Maintenance Occupations
The most common Natural Resources, Construction and Maintenance occupations in Hurdland are Construction & Extraction (7 | 6.2%), Installation, Maintenance & Repair (7 | 6.2%), and Farming, Fishing & Forestry (5 | 4.4%).
Natural Resources, Construction and Maintenance Occupations by Sex
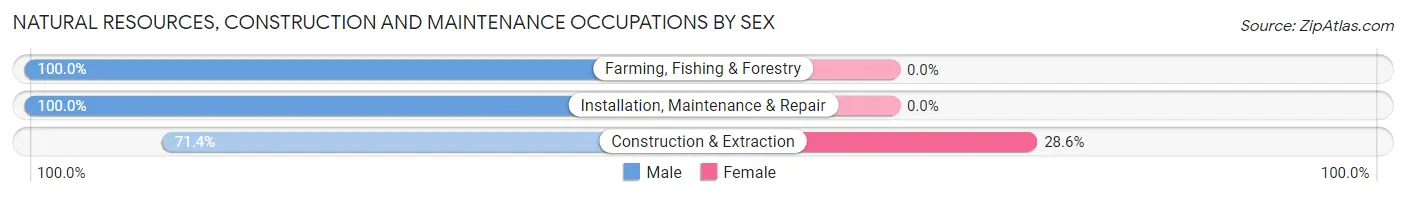
| Occupation | Male | Female |
| Farming, Fishing & Forestry | 5 (100.0%) | 0 (0.0%) |
| Construction & Extraction | 5 (71.4%) | 2 (28.6%) |
| Installation, Maintenance & Repair | 7 (100.0%) | 0 (0.0%) |
| Total (Category) | 17 (89.5%) | 2 (10.5%) |
| Total (Overall) | 50 (44.3%) | 63 (55.7%) |
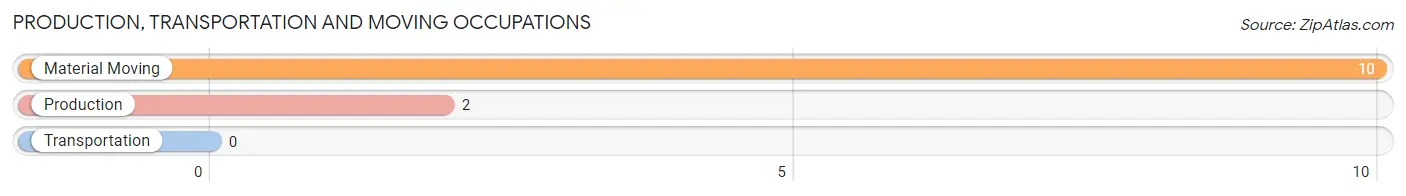
Production, Transportation and Moving Occupations
The most common Production, Transportation and Moving occupations in Hurdland are Material Moving (10 | 8.8%), and Production (2 | 1.8%).
Production, Transportation and Moving Occupations by Sex
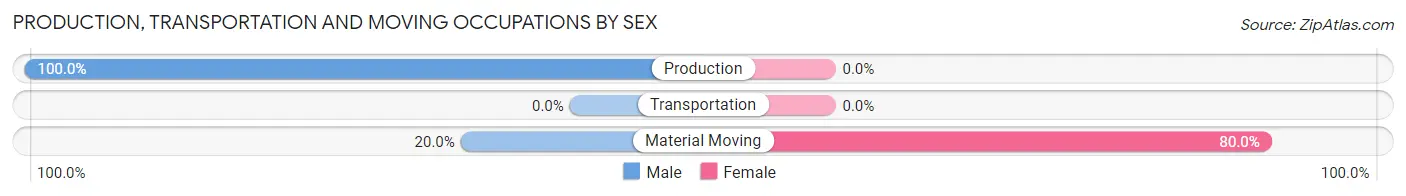
| Occupation | Male | Female |
| Production | 2 (100.0%) | 0 (0.0%) |
| Transportation | 0 (0.0%) | 0 (0.0%) |
| Material Moving | 2 (20.0%) | 8 (80.0%) |
| Total (Category) | 4 (33.3%) | 8 (66.7%) |
| Total (Overall) | 50 (44.3%) | 63 (55.7%) |
Employment Industries by Sex in Hurdland
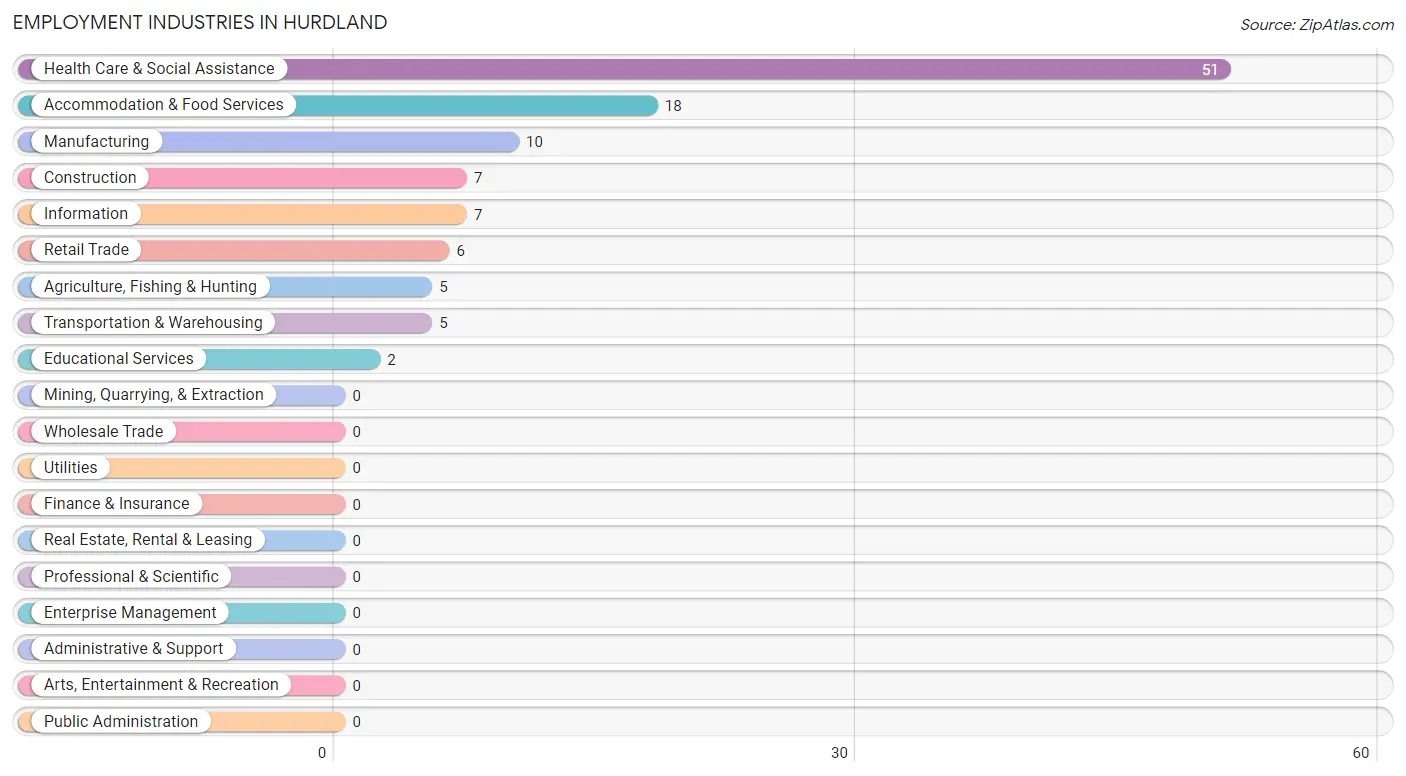
Employment Industries in Hurdland
The major employment industries in Hurdland include Health Care & Social Assistance (51 | 45.1%), Accommodation & Food Services (18 | 15.9%), Manufacturing (10 | 8.8%), Construction (7 | 6.2%), and Information (7 | 6.2%).
Employment Industries by Sex in Hurdland
The Hurdland industries that see more men than women are Agriculture, Fishing & Hunting (100.0%), Information (100.0%), and Accommodation & Food Services (100.0%), whereas the industries that tend to have a higher number of women are Educational Services (100.0%), Health Care & Social Assistance (86.3%), and Manufacturing (80.0%).
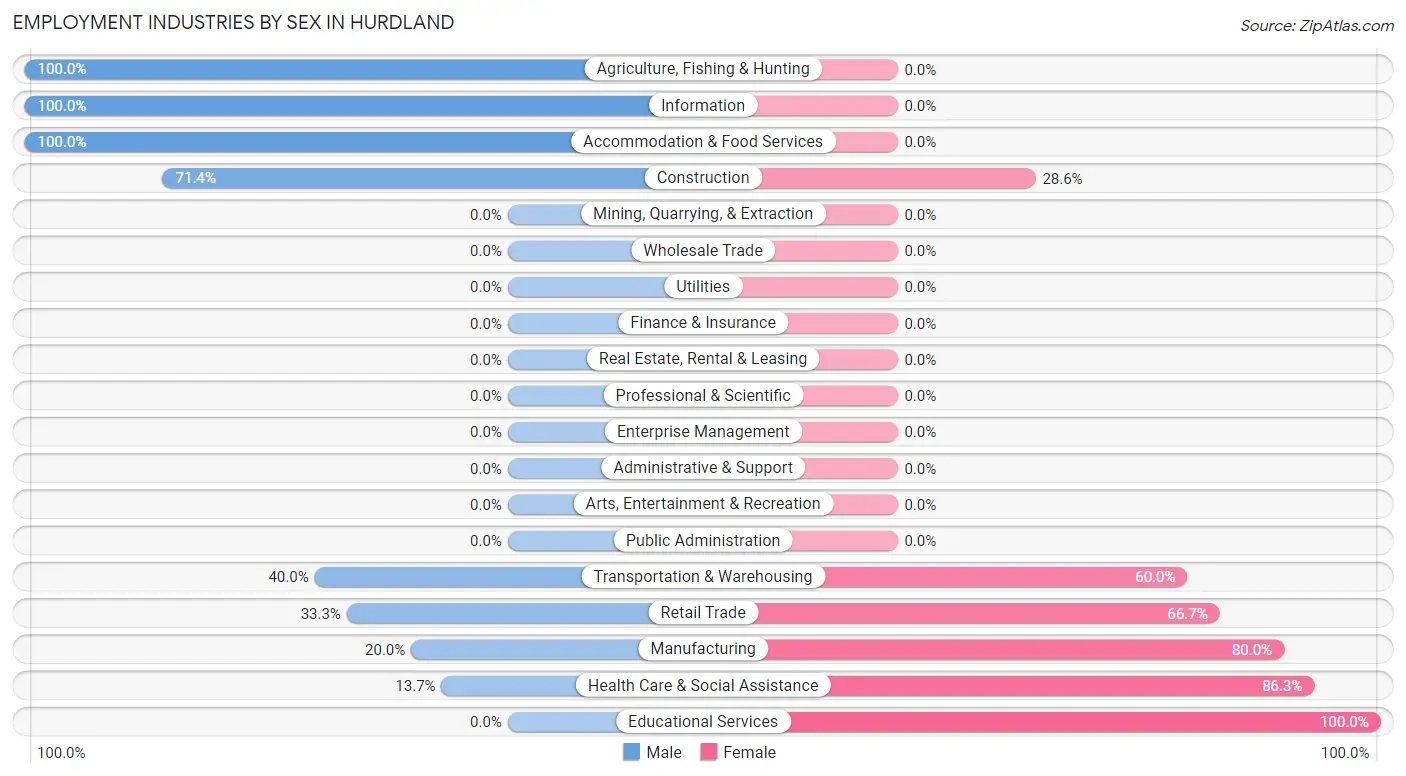
| Industry | Male | Female |
| Agriculture, Fishing & Hunting | 5 (100.0%) | 0 (0.0%) |
| Mining, Quarrying, & Extraction | 0 (0.0%) | 0 (0.0%) |
| Construction | 5 (71.4%) | 2 (28.6%) |
| Manufacturing | 2 (20.0%) | 8 (80.0%) |
| Wholesale Trade | 0 (0.0%) | 0 (0.0%) |
| Retail Trade | 2 (33.3%) | 4 (66.7%) |
| Transportation & Warehousing | 2 (40.0%) | 3 (60.0%) |
| Utilities | 0 (0.0%) | 0 (0.0%) |
| Information | 7 (100.0%) | 0 (0.0%) |
| Finance & Insurance | 0 (0.0%) | 0 (0.0%) |
| Real Estate, Rental & Leasing | 0 (0.0%) | 0 (0.0%) |
| Professional & Scientific | 0 (0.0%) | 0 (0.0%) |
| Enterprise Management | 0 (0.0%) | 0 (0.0%) |
| Administrative & Support | 0 (0.0%) | 0 (0.0%) |
| Educational Services | 0 (0.0%) | 2 (100.0%) |
| Health Care & Social Assistance | 7 (13.7%) | 44 (86.3%) |
| Arts, Entertainment & Recreation | 0 (0.0%) | 0 (0.0%) |
| Accommodation & Food Services | 18 (100.0%) | 0 (0.0%) |
| Public Administration | 0 (0.0%) | 0 (0.0%) |
| Total | 50 (44.3%) | 63 (55.7%) |
Education in Hurdland
School Enrollment in Hurdland
The most common levels of schooling among the 62 students in Hurdland are elementary school (21 | 33.9%), high school (14 | 22.6%), and middle school (11 | 17.7%).
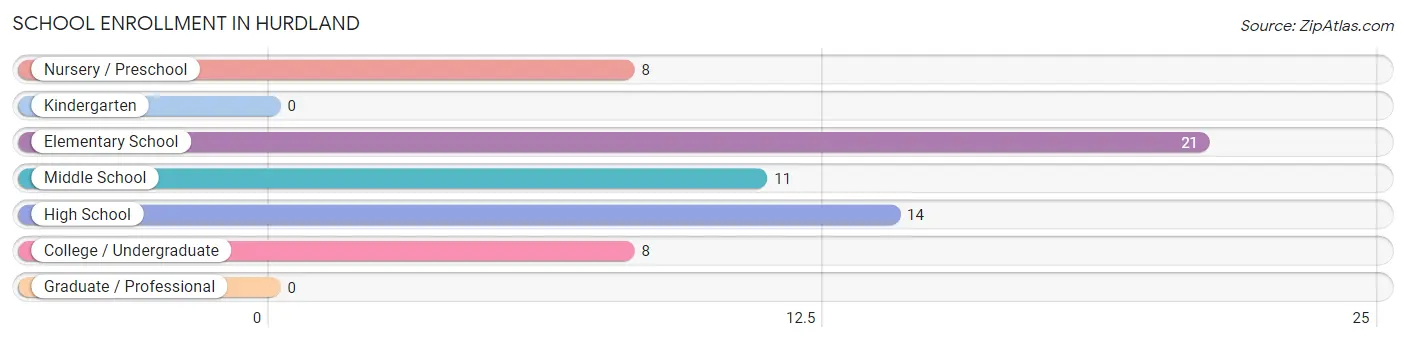
| School Level | # Students | % Students |
| Nursery / Preschool | 8 | 12.9% |
| Kindergarten | 0 | 0.0% |
| Elementary School | 21 | 33.9% |
| Middle School | 11 | 17.7% |
| High School | 14 | 22.6% |
| College / Undergraduate | 8 | 12.9% |
| Graduate / Professional | 0 | 0.0% |
| Total | 62 | 100.0% |
School Enrollment by Age by Funding Source in Hurdland
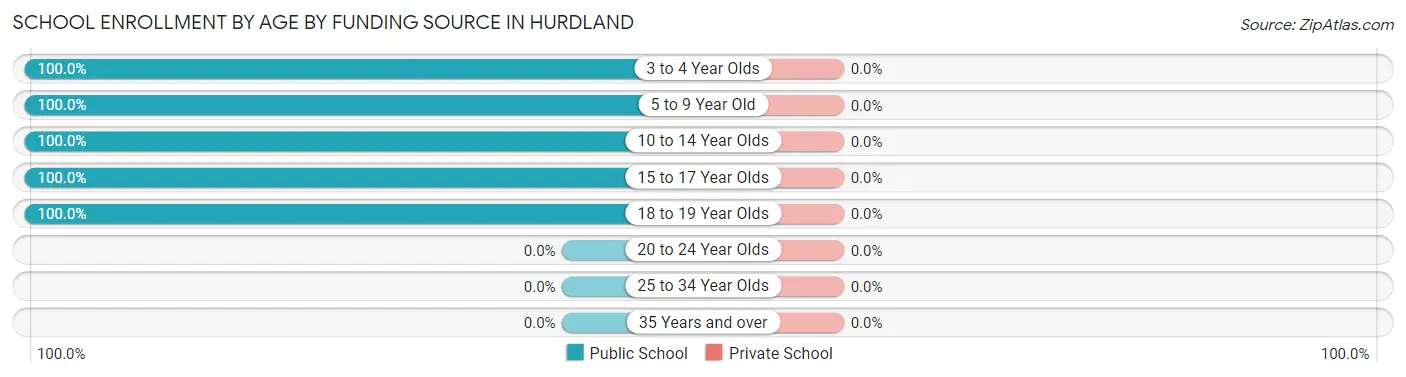
| Age Bracket | Public School | Private School |
| 3 to 4 Year Olds | 8 (100.0%) | 0 (0.0%) |
| 5 to 9 Year Old | 19 (100.0%) | 0 (0.0%) |
| 10 to 14 Year Olds | 17 (100.0%) | 0 (0.0%) |
| 15 to 17 Year Olds | 10 (100.0%) | 0 (0.0%) |
| 18 to 19 Year Olds | 8 (100.0%) | 0 (0.0%) |
| 20 to 24 Year Olds | 0 (0.0%) | 0 (0.0%) |
| 25 to 34 Year Olds | 0 (0.0%) | 0 (0.0%) |
| 35 Years and over | 0 (0.0%) | 0 (0.0%) |
| Total | 62 (100.0%) | 0 (0.0%) |
Educational Attainment by Field of Study in Hurdland
Psychology (9 | 20.0%), science & technology (9 | 20.0%), education (8 | 17.8%), computers & mathematics (6 | 13.3%), and business (6 | 13.3%) are the most common fields of study among 45 individuals in Hurdland who have obtained a bachelor's degree or higher.
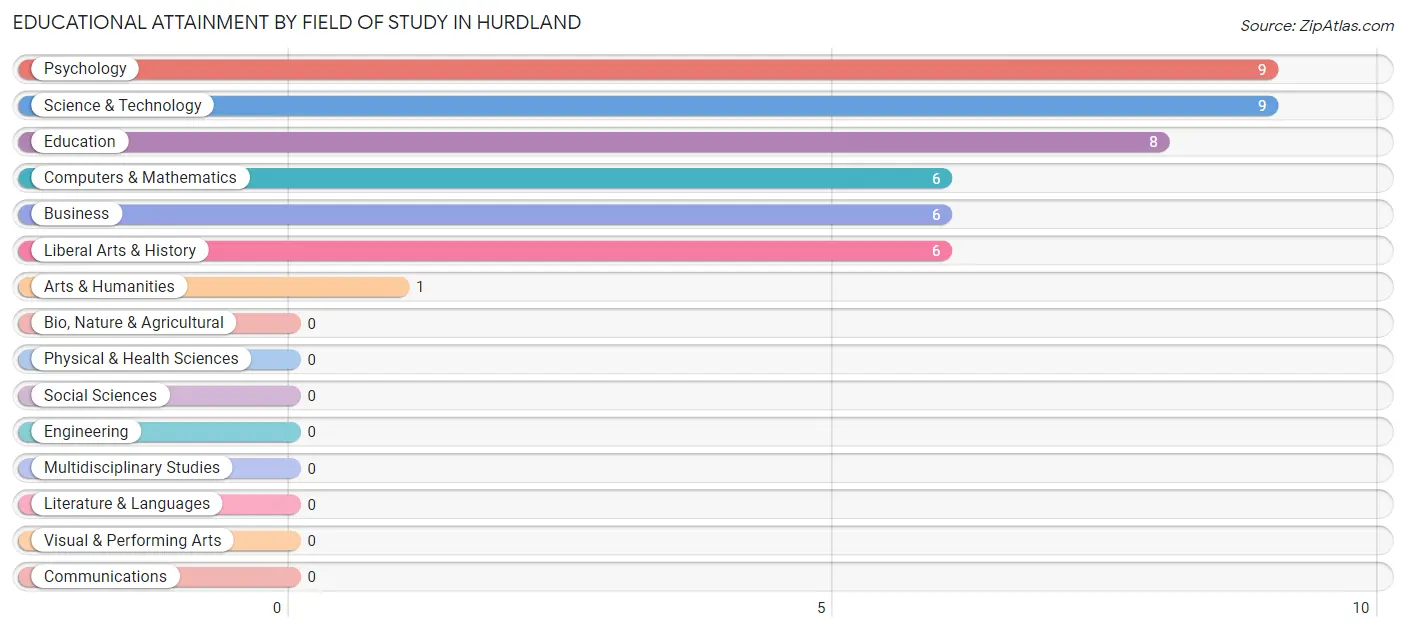
| Field of Study | # Graduates | % Graduates |
| Computers & Mathematics | 6 | 13.3% |
| Bio, Nature & Agricultural | 0 | 0.0% |
| Physical & Health Sciences | 0 | 0.0% |
| Psychology | 9 | 20.0% |
| Social Sciences | 0 | 0.0% |
| Engineering | 0 | 0.0% |
| Multidisciplinary Studies | 0 | 0.0% |
| Science & Technology | 9 | 20.0% |
| Business | 6 | 13.3% |
| Education | 8 | 17.8% |
| Literature & Languages | 0 | 0.0% |
| Liberal Arts & History | 6 | 13.3% |
| Visual & Performing Arts | 0 | 0.0% |
| Communications | 0 | 0.0% |
| Arts & Humanities | 1 | 2.2% |
| Total | 45 | 100.0% |
Transportation & Commute in Hurdland
Vehicle Availability by Sex in Hurdland
The most prevalent vehicle ownership categories in Hurdland are males with 2 vehicles (36, accounting for 72.0%) and females with 2 vehicles (26, making up 57.1%).
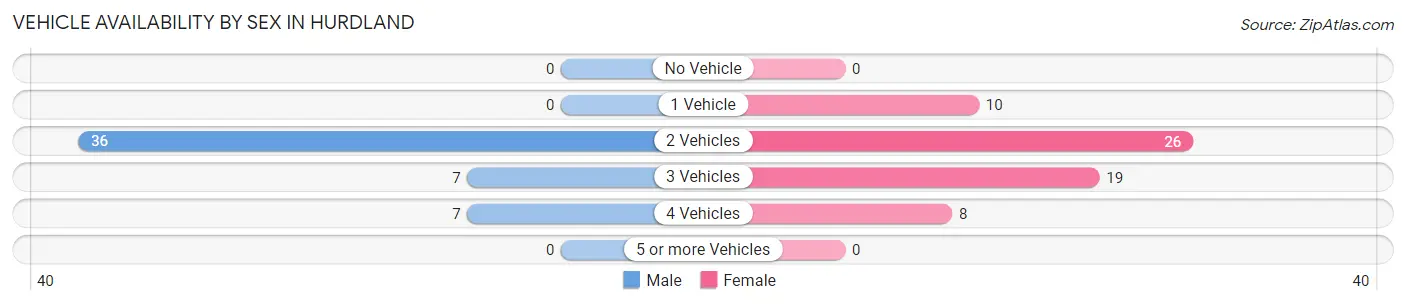
| Vehicles Available | Male | Female |
| No Vehicle | 0 (0.0%) | 0 (0.0%) |
| 1 Vehicle | 0 (0.0%) | 10 (15.9%) |
| 2 Vehicles | 36 (72.0%) | 26 (41.3%) |
| 3 Vehicles | 7 (14.0%) | 19 (30.2%) |
| 4 Vehicles | 7 (14.0%) | 8 (12.7%) |
| 5 or more Vehicles | 0 (0.0%) | 0 (0.0%) |
| Total | 50 (100.0%) | 63 (100.0%) |
Commute Time in Hurdland
The most frequently occuring commute durations in Hurdland are 15 to 19 minutes (28 commuters, 25.2%), 30 to 34 minutes (21 commuters, 18.9%), and 45 to 59 minutes (18 commuters, 16.2%).
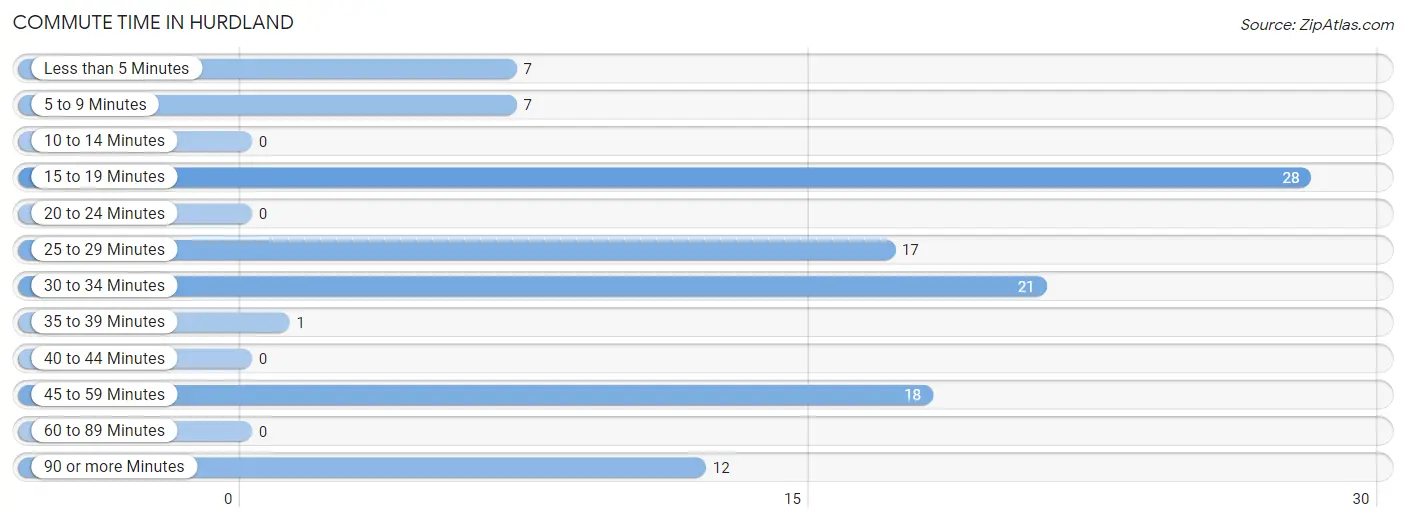
| Commute Time | # Commuters | % Commuters |
| Less than 5 Minutes | 7 | 6.3% |
| 5 to 9 Minutes | 7 | 6.3% |
| 10 to 14 Minutes | 0 | 0.0% |
| 15 to 19 Minutes | 28 | 25.2% |
| 20 to 24 Minutes | 0 | 0.0% |
| 25 to 29 Minutes | 17 | 15.3% |
| 30 to 34 Minutes | 21 | 18.9% |
| 35 to 39 Minutes | 1 | 0.9% |
| 40 to 44 Minutes | 0 | 0.0% |
| 45 to 59 Minutes | 18 | 16.2% |
| 60 to 89 Minutes | 0 | 0.0% |
| 90 or more Minutes | 12 | 10.8% |
Commute Time by Sex in Hurdland
The most common commute times in Hurdland are 45 to 59 minutes (18 commuters, 37.5%) for males and 15 to 19 minutes (17 commuters, 27.0%) for females.
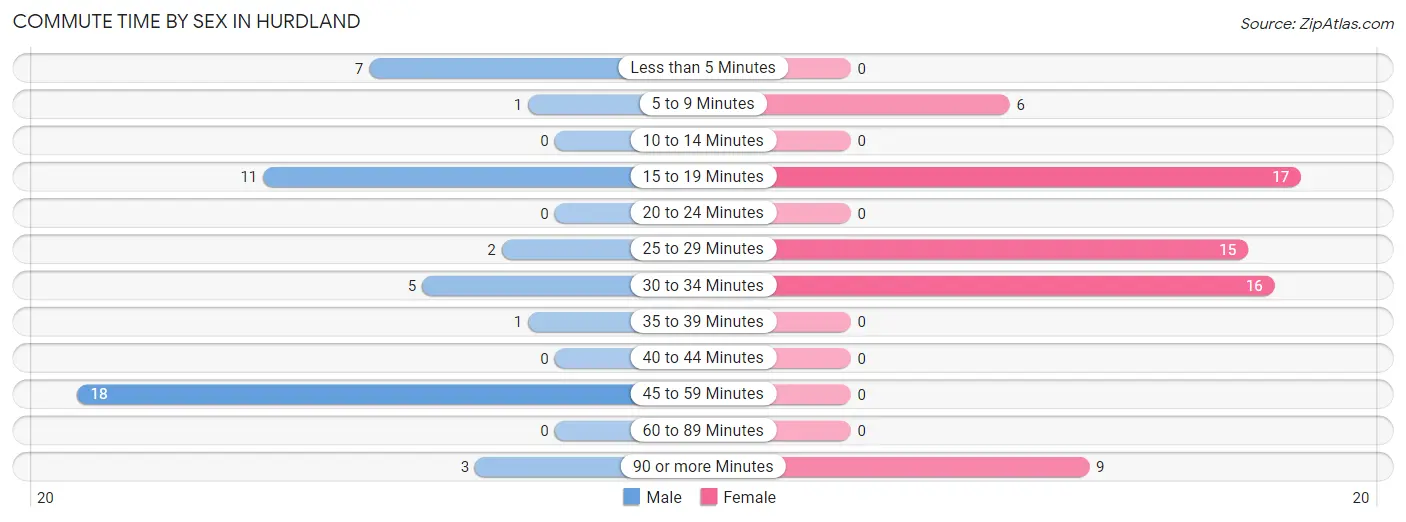
| Commute Time | Male | Female |
| Less than 5 Minutes | 7 (14.6%) | 0 (0.0%) |
| 5 to 9 Minutes | 1 (2.1%) | 6 (9.5%) |
| 10 to 14 Minutes | 0 (0.0%) | 0 (0.0%) |
| 15 to 19 Minutes | 11 (22.9%) | 17 (27.0%) |
| 20 to 24 Minutes | 0 (0.0%) | 0 (0.0%) |
| 25 to 29 Minutes | 2 (4.2%) | 15 (23.8%) |
| 30 to 34 Minutes | 5 (10.4%) | 16 (25.4%) |
| 35 to 39 Minutes | 1 (2.1%) | 0 (0.0%) |
| 40 to 44 Minutes | 0 (0.0%) | 0 (0.0%) |
| 45 to 59 Minutes | 18 (37.5%) | 0 (0.0%) |
| 60 to 89 Minutes | 0 (0.0%) | 0 (0.0%) |
| 90 or more Minutes | 3 (6.2%) | 9 (14.3%) |
Time of Departure to Work by Sex in Hurdland
The most frequent times of departure to work in Hurdland are 7:00 AM to 7:29 AM (21, 43.8%) for males and 7:00 AM to 7:29 AM (17, 27.0%) for females.
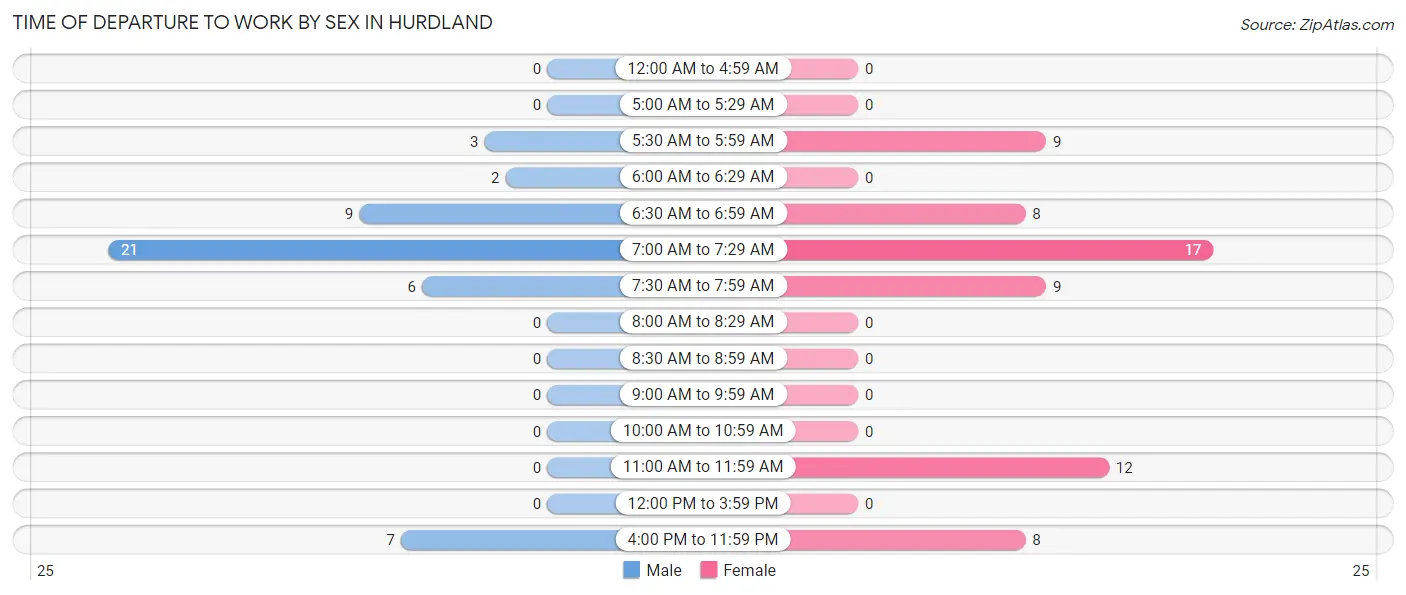
| Time of Departure | Male | Female |
| 12:00 AM to 4:59 AM | 0 (0.0%) | 0 (0.0%) |
| 5:00 AM to 5:29 AM | 0 (0.0%) | 0 (0.0%) |
| 5:30 AM to 5:59 AM | 3 (6.2%) | 9 (14.3%) |
| 6:00 AM to 6:29 AM | 2 (4.2%) | 0 (0.0%) |
| 6:30 AM to 6:59 AM | 9 (18.8%) | 8 (12.7%) |
| 7:00 AM to 7:29 AM | 21 (43.8%) | 17 (27.0%) |
| 7:30 AM to 7:59 AM | 6 (12.5%) | 9 (14.3%) |
| 8:00 AM to 8:29 AM | 0 (0.0%) | 0 (0.0%) |
| 8:30 AM to 8:59 AM | 0 (0.0%) | 0 (0.0%) |
| 9:00 AM to 9:59 AM | 0 (0.0%) | 0 (0.0%) |
| 10:00 AM to 10:59 AM | 0 (0.0%) | 0 (0.0%) |
| 11:00 AM to 11:59 AM | 0 (0.0%) | 12 (19.1%) |
| 12:00 PM to 3:59 PM | 0 (0.0%) | 0 (0.0%) |
| 4:00 PM to 11:59 PM | 7 (14.6%) | 8 (12.7%) |
| Total | 48 (100.0%) | 63 (100.0%) |
Housing Occupancy in Hurdland
Occupancy by Ownership in Hurdland
Of the total 70 dwellings in Hurdland, owner-occupied units account for 61 (87.1%), while renter-occupied units make up 9 (12.9%).
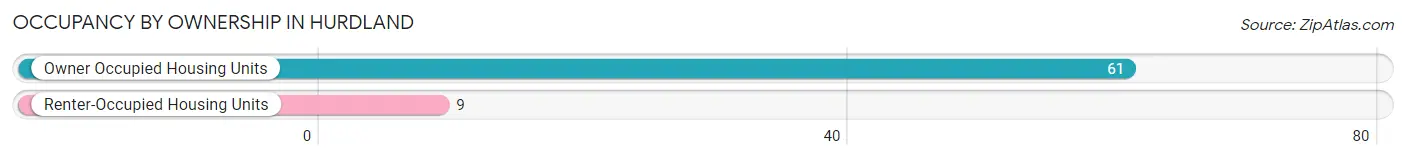
| Occupancy | # Housing Units | % Housing Units |
| Owner Occupied Housing Units | 61 | 87.1% |
| Renter-Occupied Housing Units | 9 | 12.9% |
| Total Occupied Housing Units | 70 | 100.0% |
Occupancy by Household Size in Hurdland
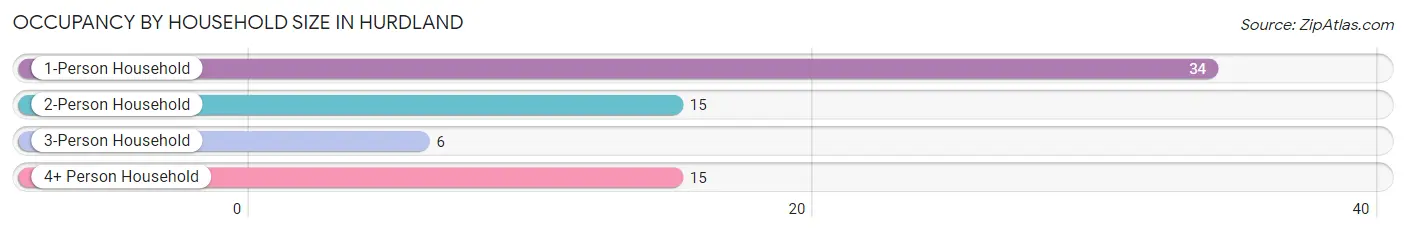
| Household Size | # Housing Units | % Housing Units |
| 1-Person Household | 34 | 48.6% |
| 2-Person Household | 15 | 21.4% |
| 3-Person Household | 6 | 8.6% |
| 4+ Person Household | 15 | 21.4% |
| Total Housing Units | 70 | 100.0% |
Occupancy by Ownership by Household Size in Hurdland
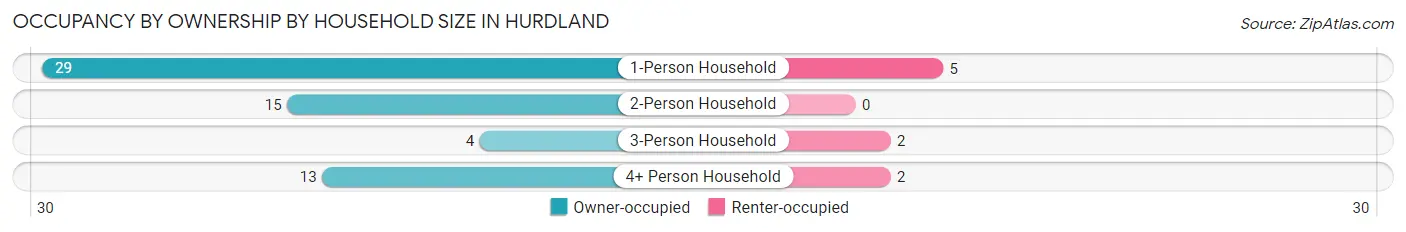
| Household Size | Owner-occupied | Renter-occupied |
| 1-Person Household | 29 (85.3%) | 5 (14.7%) |
| 2-Person Household | 15 (100.0%) | 0 (0.0%) |
| 3-Person Household | 4 (66.7%) | 2 (33.3%) |
| 4+ Person Household | 13 (86.7%) | 2 (13.3%) |
| Total Housing Units | 61 (87.1%) | 9 (12.9%) |
Occupancy by Educational Attainment in Hurdland
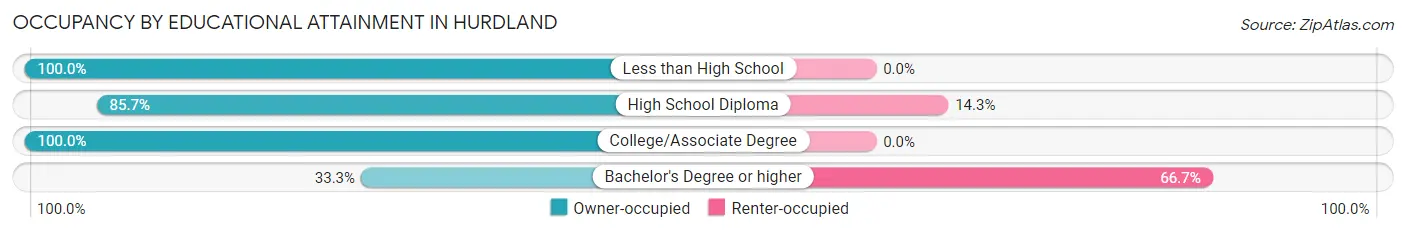
| Household Size | Owner-occupied | Renter-occupied |
| Less than High School | 10 (100.0%) | 0 (0.0%) |
| High School Diploma | 42 (85.7%) | 7 (14.3%) |
| College/Associate Degree | 8 (100.0%) | 0 (0.0%) |
| Bachelor's Degree or higher | 1 (33.3%) | 2 (66.7%) |
Occupancy by Age of Householder in Hurdland
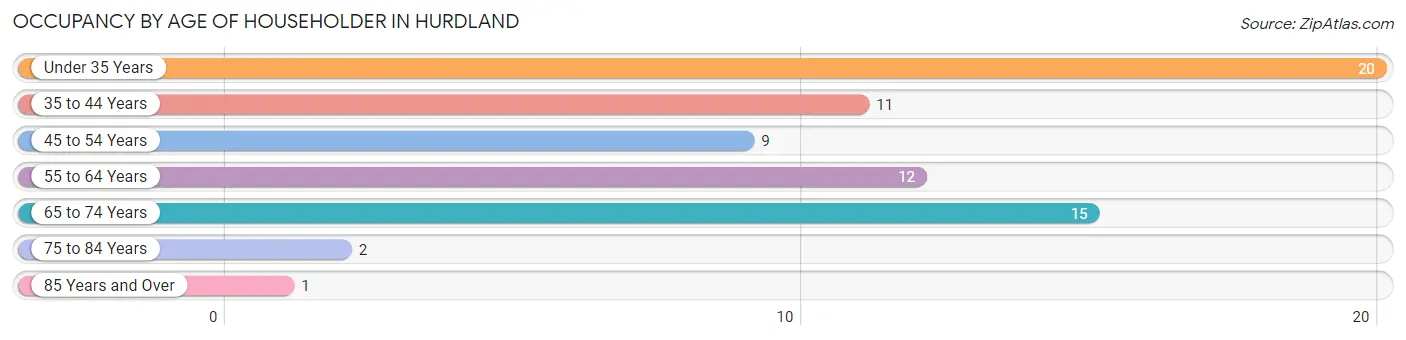
| Age Bracket | # Households | % Households |
| Under 35 Years | 20 | 28.6% |
| 35 to 44 Years | 11 | 15.7% |
| 45 to 54 Years | 9 | 12.9% |
| 55 to 64 Years | 12 | 17.1% |
| 65 to 74 Years | 15 | 21.4% |
| 75 to 84 Years | 2 | 2.9% |
| 85 Years and Over | 1 | 1.4% |
| Total | 70 | 100.0% |
Housing Finances in Hurdland
Median Income by Occupancy in Hurdland
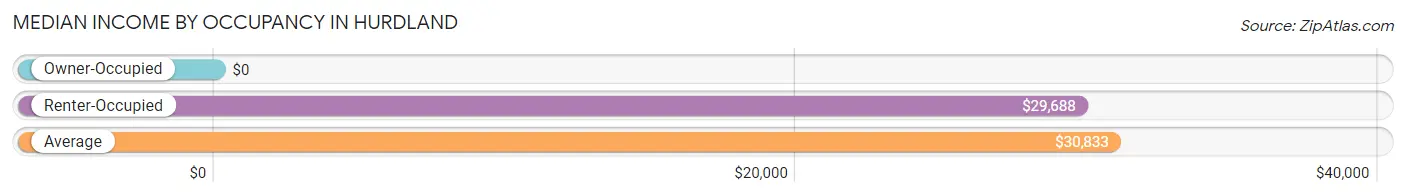
| Occupancy Type | # Households | Median Income |
| Owner-Occupied | 61 (87.1%) | $0 |
| Renter-Occupied | 9 (12.9%) | $29,688 |
| Average | 70 (100.0%) | $30,833 |
Occupancy by Householder Income Bracket in Hurdland
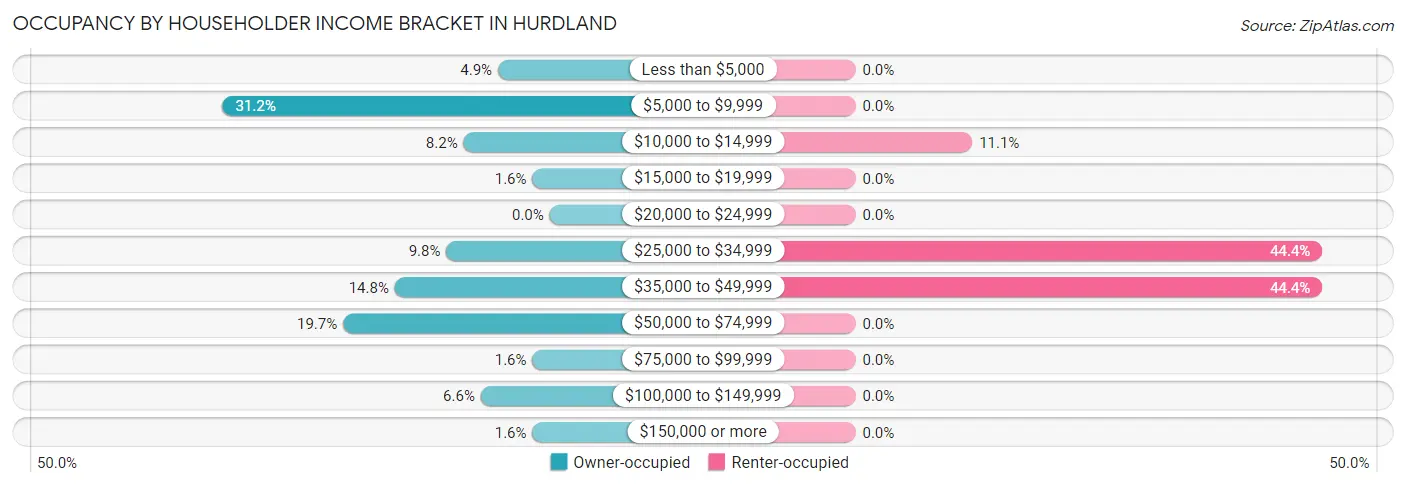
| Income Bracket | Owner-occupied | Renter-occupied |
| Less than $5,000 | 3 (4.9%) | 0 (0.0%) |
| $5,000 to $9,999 | 19 (31.1%) | 0 (0.0%) |
| $10,000 to $14,999 | 5 (8.2%) | 1 (11.1%) |
| $15,000 to $19,999 | 1 (1.6%) | 0 (0.0%) |
| $20,000 to $24,999 | 0 (0.0%) | 0 (0.0%) |
| $25,000 to $34,999 | 6 (9.8%) | 4 (44.4%) |
| $35,000 to $49,999 | 9 (14.7%) | 4 (44.4%) |
| $50,000 to $74,999 | 12 (19.7%) | 0 (0.0%) |
| $75,000 to $99,999 | 1 (1.6%) | 0 (0.0%) |
| $100,000 to $149,999 | 4 (6.6%) | 0 (0.0%) |
| $150,000 or more | 1 (1.6%) | 0 (0.0%) |
| Total | 61 (100.0%) | 9 (100.0%) |
Monthly Housing Cost Tiers in Hurdland
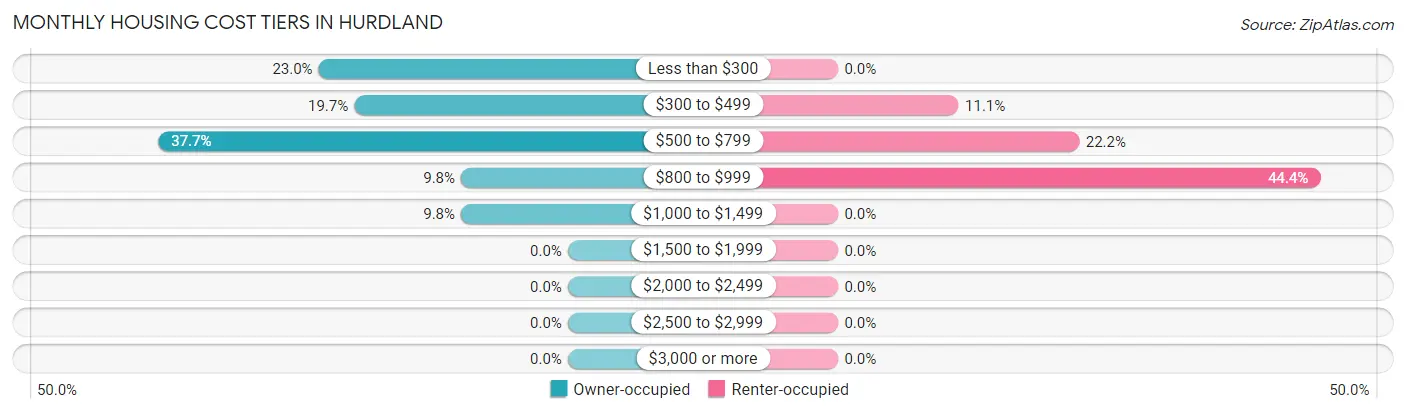
| Monthly Cost | Owner-occupied | Renter-occupied |
| Less than $300 | 14 (23.0%) | 0 (0.0%) |
| $300 to $499 | 12 (19.7%) | 1 (11.1%) |
| $500 to $799 | 23 (37.7%) | 2 (22.2%) |
| $800 to $999 | 6 (9.8%) | 4 (44.4%) |
| $1,000 to $1,499 | 6 (9.8%) | 0 (0.0%) |
| $1,500 to $1,999 | 0 (0.0%) | 0 (0.0%) |
| $2,000 to $2,499 | 0 (0.0%) | 0 (0.0%) |
| $2,500 to $2,999 | 0 (0.0%) | 0 (0.0%) |
| $3,000 or more | 0 (0.0%) | 0 (0.0%) |
| Total | 61 (100.0%) | 9 (100.0%) |
Physical Housing Characteristics in Hurdland
Housing Structures in Hurdland
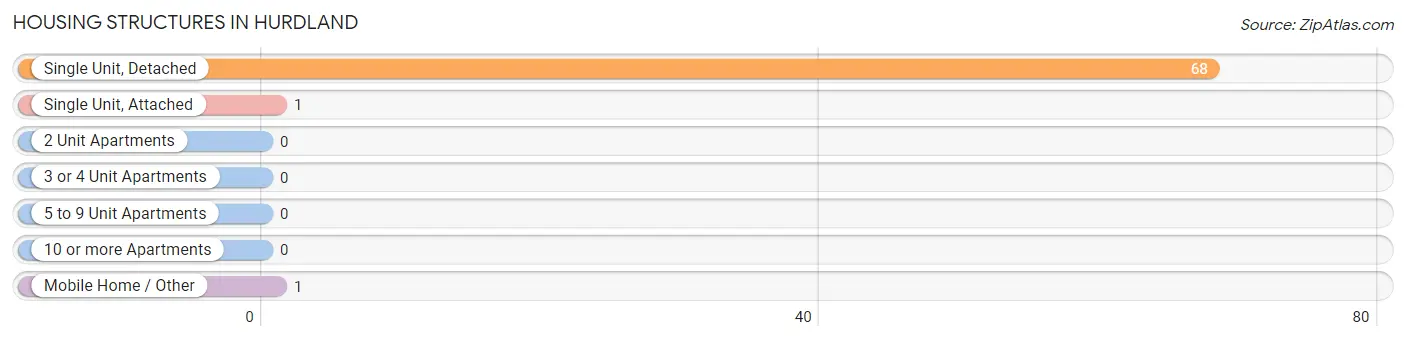
| Structure Type | # Housing Units | % Housing Units |
| Single Unit, Detached | 68 | 97.1% |
| Single Unit, Attached | 1 | 1.4% |
| 2 Unit Apartments | 0 | 0.0% |
| 3 or 4 Unit Apartments | 0 | 0.0% |
| 5 to 9 Unit Apartments | 0 | 0.0% |
| 10 or more Apartments | 0 | 0.0% |
| Mobile Home / Other | 1 | 1.4% |
| Total | 70 | 100.0% |
Housing Structures by Occupancy in Hurdland
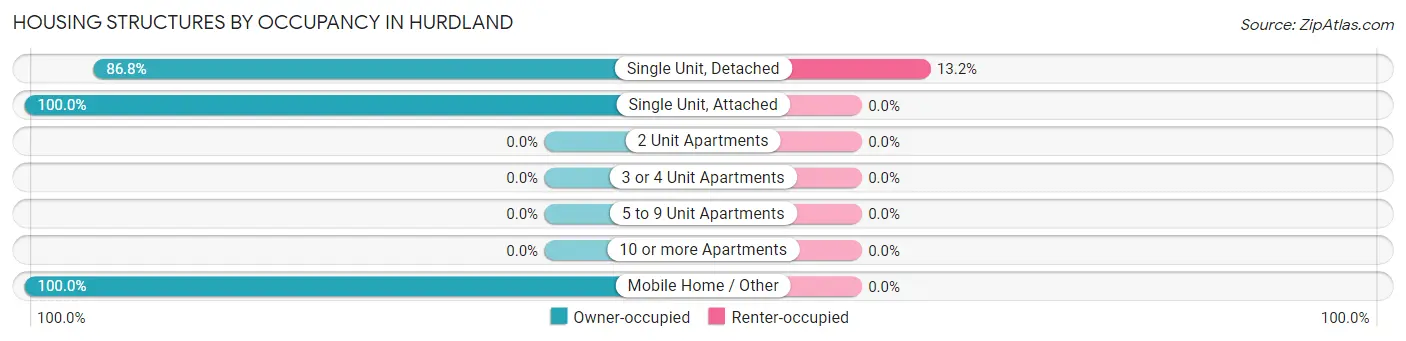
| Structure Type | Owner-occupied | Renter-occupied |
| Single Unit, Detached | 59 (86.8%) | 9 (13.2%) |
| Single Unit, Attached | 1 (100.0%) | 0 (0.0%) |
| 2 Unit Apartments | 0 (0.0%) | 0 (0.0%) |
| 3 or 4 Unit Apartments | 0 (0.0%) | 0 (0.0%) |
| 5 to 9 Unit Apartments | 0 (0.0%) | 0 (0.0%) |
| 10 or more Apartments | 0 (0.0%) | 0 (0.0%) |
| Mobile Home / Other | 1 (100.0%) | 0 (0.0%) |
| Total | 61 (87.1%) | 9 (12.9%) |
Housing Structures by Number of Rooms in Hurdland
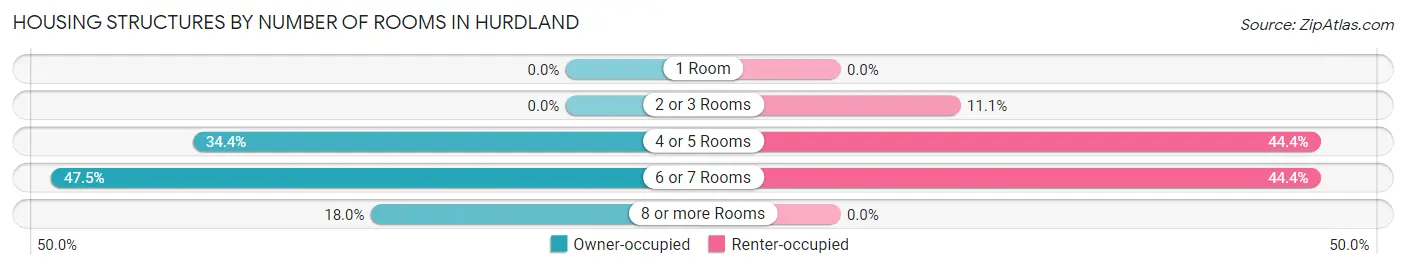
| Number of Rooms | Owner-occupied | Renter-occupied |
| 1 Room | 0 (0.0%) | 0 (0.0%) |
| 2 or 3 Rooms | 0 (0.0%) | 1 (11.1%) |
| 4 or 5 Rooms | 21 (34.4%) | 4 (44.4%) |
| 6 or 7 Rooms | 29 (47.5%) | 4 (44.4%) |
| 8 or more Rooms | 11 (18.0%) | 0 (0.0%) |
| Total | 61 (100.0%) | 9 (100.0%) |
Housing Structure by Heating Type in Hurdland
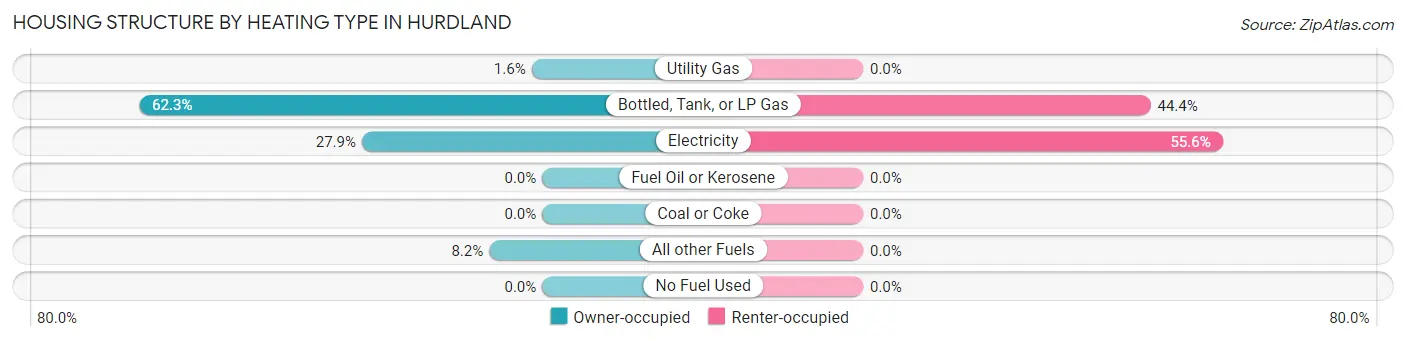
| Heating Type | Owner-occupied | Renter-occupied |
| Utility Gas | 1 (1.6%) | 0 (0.0%) |
| Bottled, Tank, or LP Gas | 38 (62.3%) | 4 (44.4%) |
| Electricity | 17 (27.9%) | 5 (55.6%) |
| Fuel Oil or Kerosene | 0 (0.0%) | 0 (0.0%) |
| Coal or Coke | 0 (0.0%) | 0 (0.0%) |
| All other Fuels | 5 (8.2%) | 0 (0.0%) |
| No Fuel Used | 0 (0.0%) | 0 (0.0%) |
| Total | 61 (100.0%) | 9 (100.0%) |
Household Vehicle Usage in Hurdland
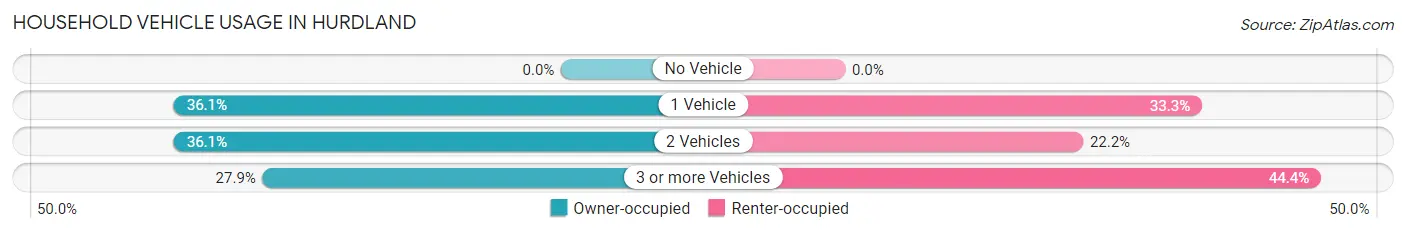
| Vehicles per Household | Owner-occupied | Renter-occupied |
| No Vehicle | 0 (0.0%) | 0 (0.0%) |
| 1 Vehicle | 22 (36.1%) | 3 (33.3%) |
| 2 Vehicles | 22 (36.1%) | 2 (22.2%) |
| 3 or more Vehicles | 17 (27.9%) | 4 (44.4%) |
| Total | 61 (100.0%) | 9 (100.0%) |
Real Estate & Mortgages in Hurdland
Real Estate and Mortgage Overview in Hurdland
| Characteristic | Without Mortgage | With Mortgage |
| Housing Units | 44 | 17 |
| Median Property Value | $42,900 | $84,200 |
| Median Household Income | - | - |
| Monthly Housing Costs | $420 | $0 |
| Real Estate Taxes | $460 | $0 |
Property Value by Mortgage Status in Hurdland
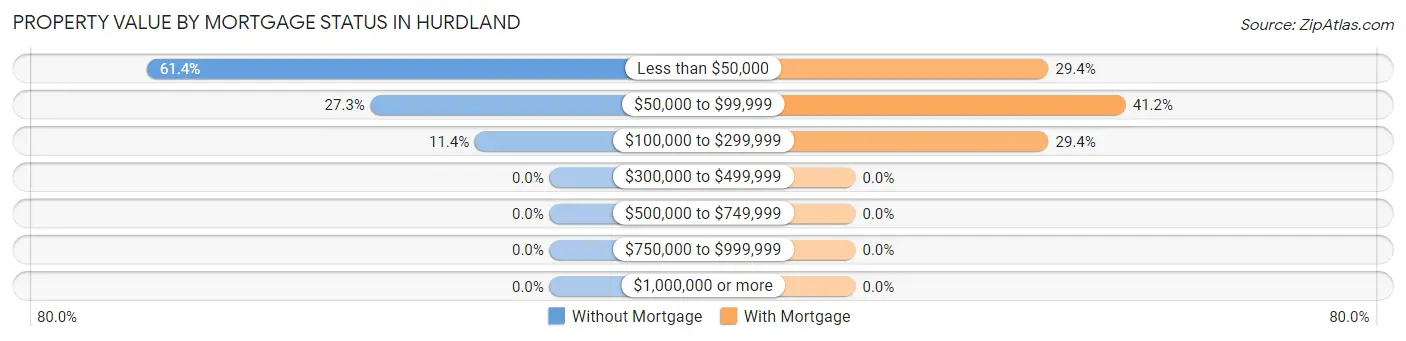
| Property Value | Without Mortgage | With Mortgage |
| Less than $50,000 | 27 (61.4%) | 5 (29.4%) |
| $50,000 to $99,999 | 12 (27.3%) | 7 (41.2%) |
| $100,000 to $299,999 | 5 (11.4%) | 5 (29.4%) |
| $300,000 to $499,999 | 0 (0.0%) | 0 (0.0%) |
| $500,000 to $749,999 | 0 (0.0%) | 0 (0.0%) |
| $750,000 to $999,999 | 0 (0.0%) | 0 (0.0%) |
| $1,000,000 or more | 0 (0.0%) | 0 (0.0%) |
| Total | 44 (100.0%) | 17 (100.0%) |
Household Income by Mortgage Status in Hurdland
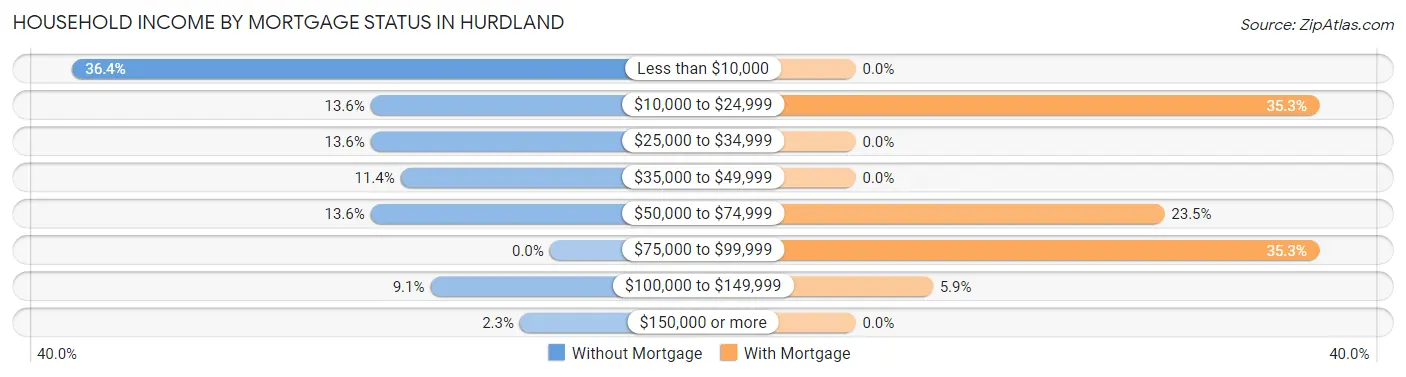
| Household Income | Without Mortgage | With Mortgage |
| Less than $10,000 | 16 (36.4%) | 0 (0.0%) |
| $10,000 to $24,999 | 6 (13.6%) | 6 (35.3%) |
| $25,000 to $34,999 | 6 (13.6%) | 0 (0.0%) |
| $35,000 to $49,999 | 5 (11.4%) | 0 (0.0%) |
| $50,000 to $74,999 | 6 (13.6%) | 4 (23.5%) |
| $75,000 to $99,999 | 0 (0.0%) | 6 (35.3%) |
| $100,000 to $149,999 | 4 (9.1%) | 1 (5.9%) |
| $150,000 or more | 1 (2.3%) | 0 (0.0%) |
| Total | 44 (100.0%) | 17 (100.0%) |
Property Value to Household Income Ratio in Hurdland
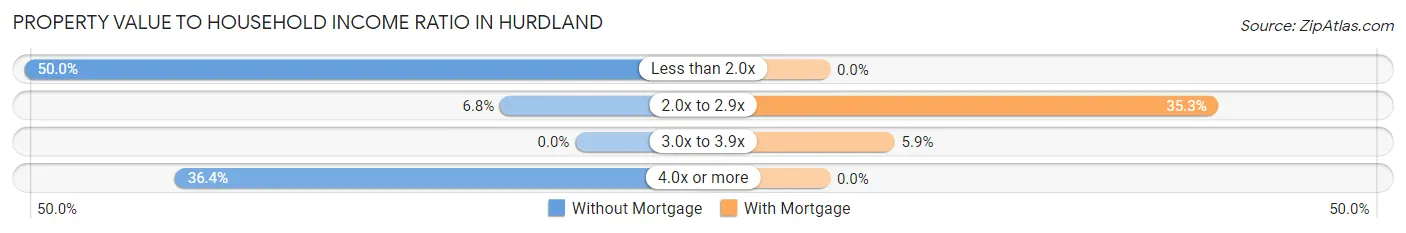
| Value-to-Income Ratio | Without Mortgage | With Mortgage |
| Less than 2.0x | 22 (50.0%) | 0 (0.0%) |
| 2.0x to 2.9x | 3 (6.8%) | 6 (35.3%) |
| 3.0x to 3.9x | 0 (0.0%) | 1 (5.9%) |
| 4.0x or more | 16 (36.4%) | 0 (0.0%) |
| Total | 44 (100.0%) | 17 (100.0%) |
Real Estate Taxes by Mortgage Status in Hurdland
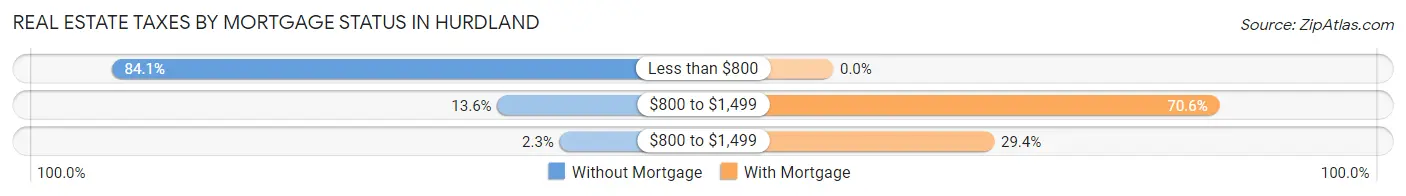
| Property Taxes | Without Mortgage | With Mortgage |
| Less than $800 | 37 (84.1%) | 0 (0.0%) |
| $800 to $1,499 | 6 (13.6%) | 12 (70.6%) |
| $800 to $1,499 | 1 (2.3%) | 5 (29.4%) |
| Total | 44 (100.0%) | 17 (100.0%) |
Health & Disability in Hurdland
Health Insurance Coverage by Age in Hurdland
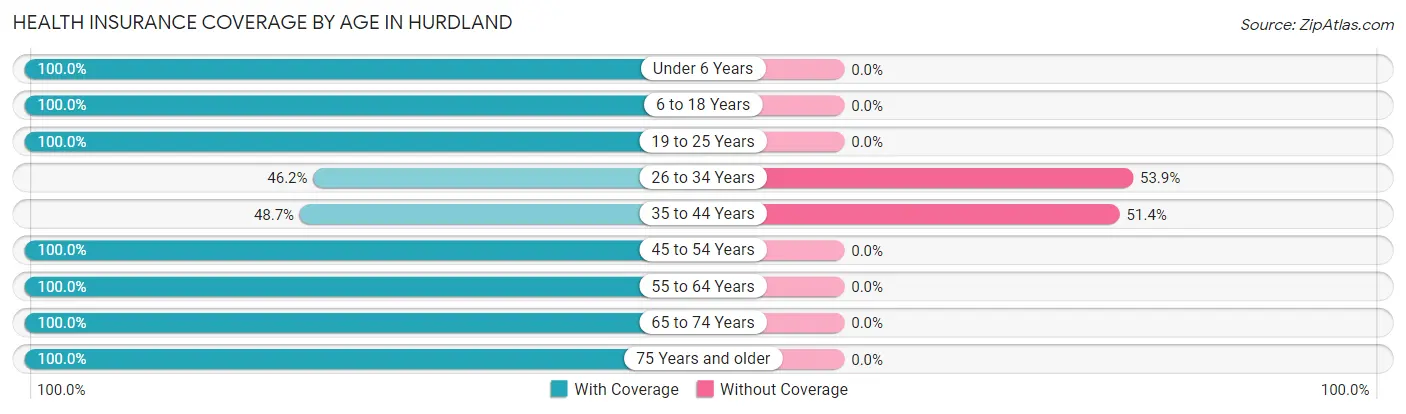
| Age Bracket | With Coverage | Without Coverage |
| Under 6 Years | 8 (100.0%) | 0 (0.0%) |
| 6 to 18 Years | 54 (100.0%) | 0 (0.0%) |
| 19 to 25 Years | 10 (100.0%) | 0 (0.0%) |
| 26 to 34 Years | 12 (46.2%) | 14 (53.8%) |
| 35 to 44 Years | 18 (48.6%) | 19 (51.3%) |
| 45 to 54 Years | 39 (100.0%) | 0 (0.0%) |
| 55 to 64 Years | 27 (100.0%) | 0 (0.0%) |
| 65 to 74 Years | 20 (100.0%) | 0 (0.0%) |
| 75 Years and older | 3 (100.0%) | 0 (0.0%) |
| Total | 191 (85.3%) | 33 (14.7%) |
Health Insurance Coverage by Citizenship Status in Hurdland
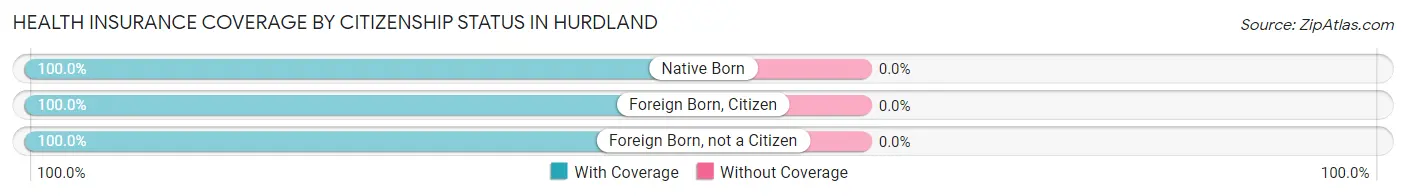
| Citizenship Status | With Coverage | Without Coverage |
| Native Born | 8 (100.0%) | 0 (0.0%) |
| Foreign Born, Citizen | 54 (100.0%) | 0 (0.0%) |
| Foreign Born, not a Citizen | 10 (100.0%) | 0 (0.0%) |
Health Insurance Coverage by Household Income in Hurdland
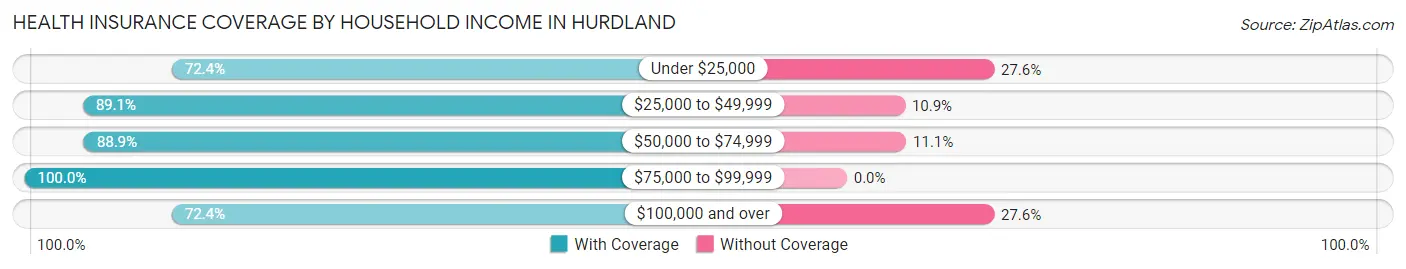
| Household Income | With Coverage | Without Coverage |
| Under $25,000 | 21 (72.4%) | 8 (27.6%) |
| $25,000 to $49,999 | 90 (89.1%) | 11 (10.9%) |
| $50,000 to $74,999 | 48 (88.9%) | 6 (11.1%) |
| $75,000 to $99,999 | 11 (100.0%) | 0 (0.0%) |
| $100,000 and over | 21 (72.4%) | 8 (27.6%) |
Public vs Private Health Insurance Coverage by Age in Hurdland
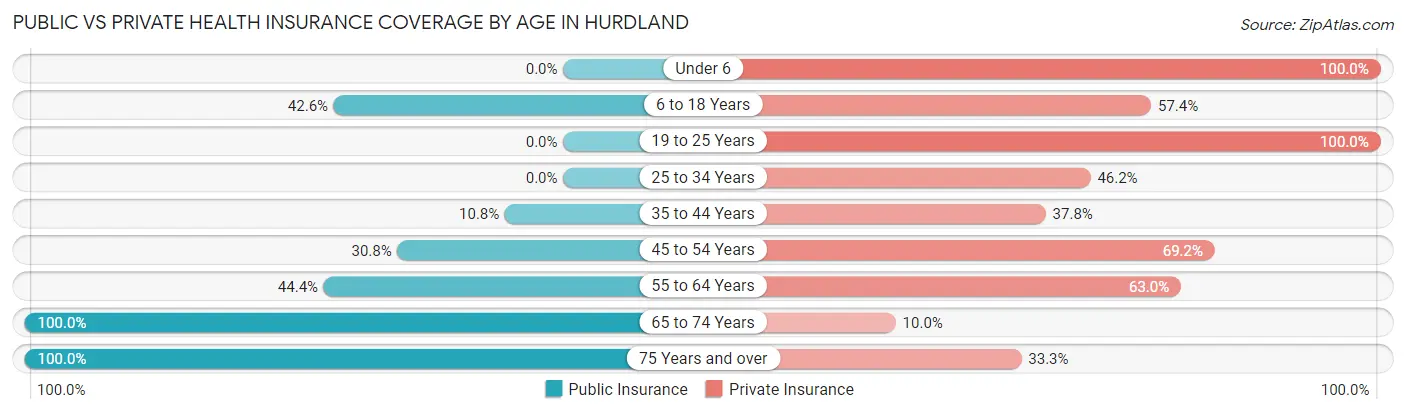
| Age Bracket | Public Insurance | Private Insurance |
| Under 6 | 0 (0.0%) | 8 (100.0%) |
| 6 to 18 Years | 23 (42.6%) | 31 (57.4%) |
| 19 to 25 Years | 0 (0.0%) | 10 (100.0%) |
| 25 to 34 Years | 0 (0.0%) | 12 (46.2%) |
| 35 to 44 Years | 4 (10.8%) | 14 (37.8%) |
| 45 to 54 Years | 12 (30.8%) | 27 (69.2%) |
| 55 to 64 Years | 12 (44.4%) | 17 (63.0%) |
| 65 to 74 Years | 20 (100.0%) | 2 (10.0%) |
| 75 Years and over | 3 (100.0%) | 1 (33.3%) |
| Total | 74 (33.0%) | 122 (54.5%) |
Disability Status by Sex by Age in Hurdland
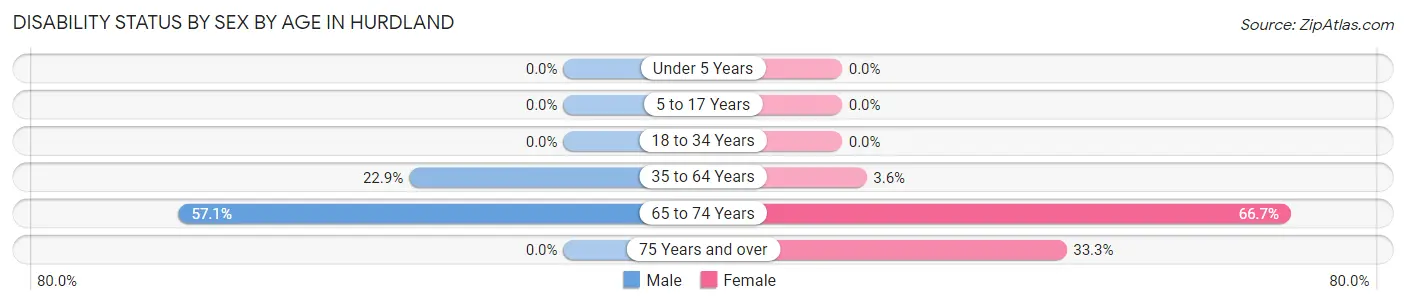
| Age Bracket | Male | Female |
| Under 5 Years | 0 (0.0%) | 0 (0.0%) |
| 5 to 17 Years | 0 (0.0%) | 0 (0.0%) |
| 18 to 34 Years | 0 (0.0%) | 0 (0.0%) |
| 35 to 64 Years | 11 (22.9%) | 2 (3.6%) |
| 65 to 74 Years | 8 (57.1%) | 4 (66.7%) |
| 75 Years and over | 0 (0.0%) | 1 (33.3%) |
Disability Class by Sex by Age in Hurdland
Disability Class: Hearing Difficulty
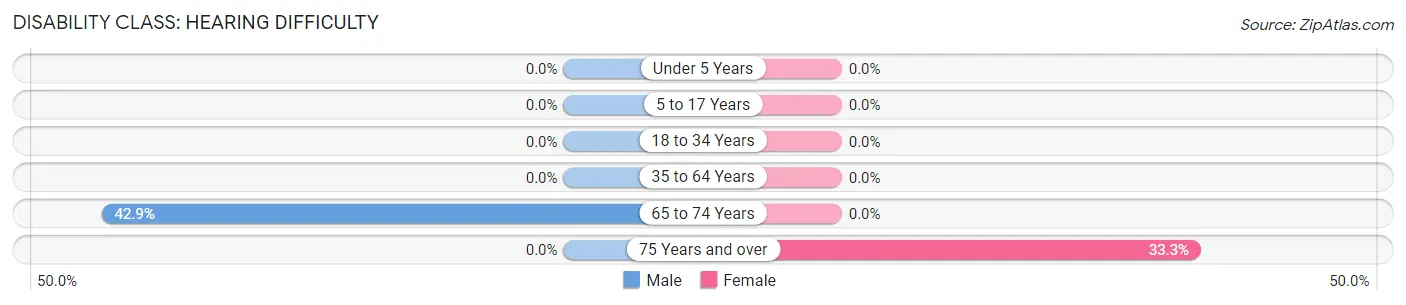
| Age Bracket | Male | Female |
| Under 5 Years | 0 (0.0%) | 0 (0.0%) |
| 5 to 17 Years | 0 (0.0%) | 0 (0.0%) |
| 18 to 34 Years | 0 (0.0%) | 0 (0.0%) |
| 35 to 64 Years | 0 (0.0%) | 0 (0.0%) |
| 65 to 74 Years | 6 (42.9%) | 0 (0.0%) |
| 75 Years and over | 0 (0.0%) | 1 (33.3%) |
Disability Class: Vision Difficulty
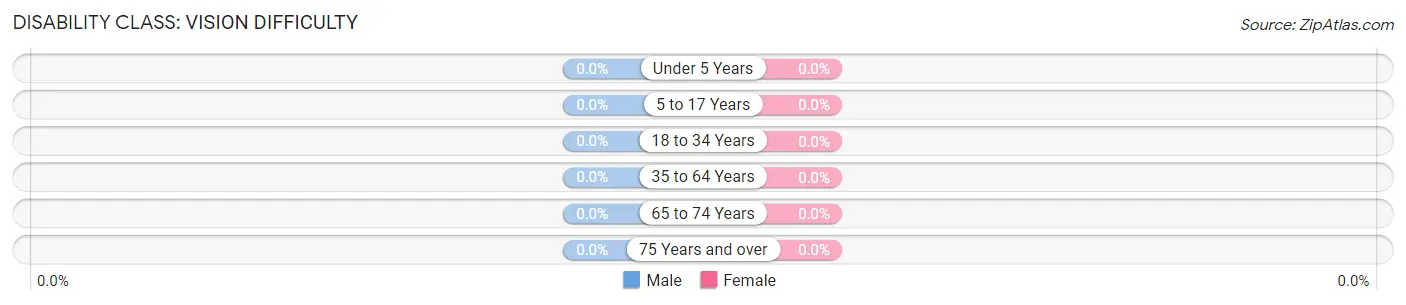
| Age Bracket | Male | Female |
| Under 5 Years | 0 (0.0%) | 0 (0.0%) |
| 5 to 17 Years | 0 (0.0%) | 0 (0.0%) |
| 18 to 34 Years | 0 (0.0%) | 0 (0.0%) |
| 35 to 64 Years | 0 (0.0%) | 0 (0.0%) |
| 65 to 74 Years | 0 (0.0%) | 0 (0.0%) |
| 75 Years and over | 0 (0.0%) | 0 (0.0%) |
Disability Class: Cognitive Difficulty
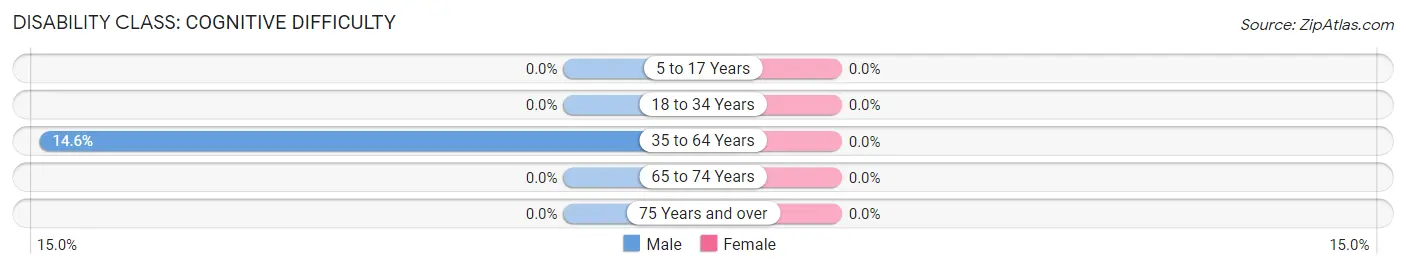
| Age Bracket | Male | Female |
| 5 to 17 Years | 0 (0.0%) | 0 (0.0%) |
| 18 to 34 Years | 0 (0.0%) | 0 (0.0%) |
| 35 to 64 Years | 7 (14.6%) | 0 (0.0%) |
| 65 to 74 Years | 0 (0.0%) | 0 (0.0%) |
| 75 Years and over | 0 (0.0%) | 0 (0.0%) |
Disability Class: Ambulatory Difficulty
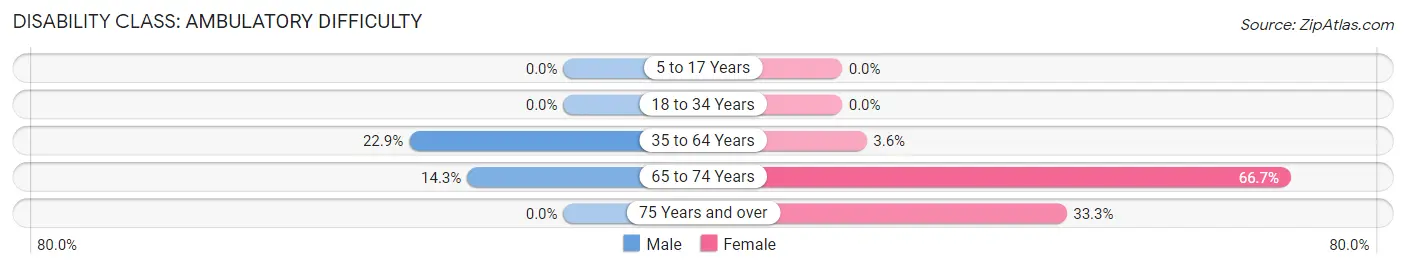
| Age Bracket | Male | Female |
| 5 to 17 Years | 0 (0.0%) | 0 (0.0%) |
| 18 to 34 Years | 0 (0.0%) | 0 (0.0%) |
| 35 to 64 Years | 11 (22.9%) | 2 (3.6%) |
| 65 to 74 Years | 2 (14.3%) | 4 (66.7%) |
| 75 Years and over | 0 (0.0%) | 1 (33.3%) |
Disability Class: Self-Care Difficulty
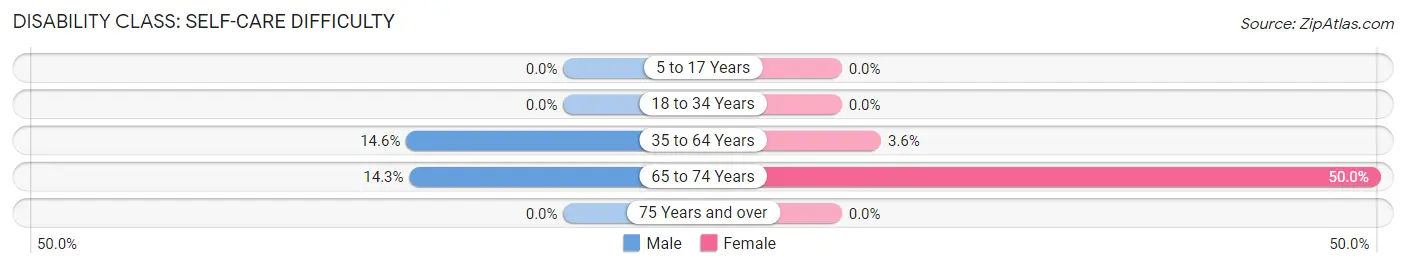
| Age Bracket | Male | Female |
| 5 to 17 Years | 0 (0.0%) | 0 (0.0%) |
| 18 to 34 Years | 0 (0.0%) | 0 (0.0%) |
| 35 to 64 Years | 7 (14.6%) | 2 (3.6%) |
| 65 to 74 Years | 2 (14.3%) | 3 (50.0%) |
| 75 Years and over | 0 (0.0%) | 0 (0.0%) |
Technology Access in Hurdland
Computing Device Access in Hurdland
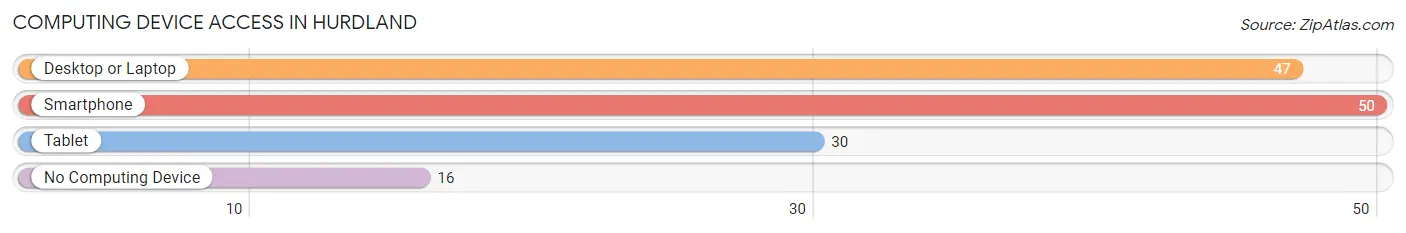
| Device Type | # Households | % Households |
| Desktop or Laptop | 47 | 67.1% |
| Smartphone | 50 | 71.4% |
| Tablet | 30 | 42.9% |
| No Computing Device | 16 | 22.9% |
| Total | 70 | 100.0% |
Internet Access in Hurdland
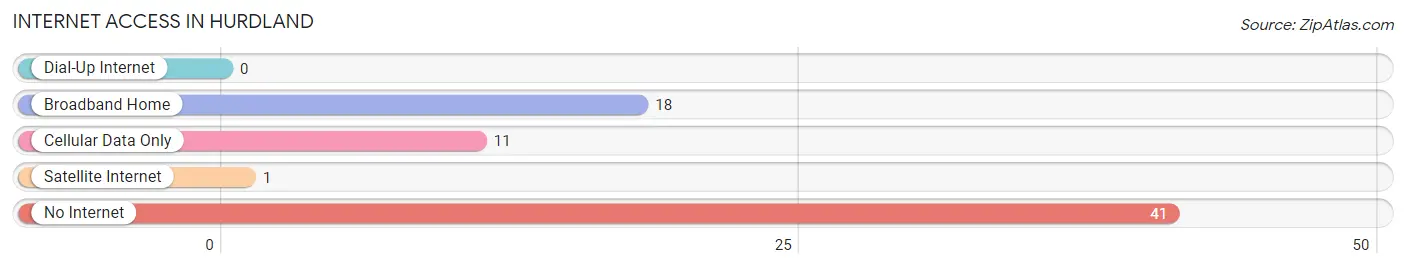
| Internet Type | # Households | % Households |
| Dial-Up Internet | 0 | 0.0% |
| Broadband Home | 18 | 25.7% |
| Cellular Data Only | 11 | 15.7% |
| Satellite Internet | 1 | 1.4% |
| No Internet | 41 | 58.6% |
| Total | 70 | 100.0% |
Hurdland Summary
Hurdland is a small town located in Knox County, Missouri. It is situated in the northeast corner of the state, about 30 miles from the Iowa border. The town was founded in 1871 and has a population of approximately 200 people.
Hurdland is located in the rolling hills of the Ozark Plateau. The town is situated on the banks of the Fabius River, which is a tributary of the Mississippi River. The area is known for its lush forests and abundant wildlife. The climate is temperate, with hot summers and cold winters.
The economy of Hurdland is largely based on agriculture. The town is home to several farms, which produce a variety of crops, including corn, soybeans, wheat, and hay. Livestock production is also important to the local economy. The town also has a few small businesses, including a grocery store, a hardware store, and a restaurant.
The population of Hurdland is predominantly white, with a small African American population. The median household income is approximately $35,000, and the median age is 44. The town is served by the Knox County School District, which includes two elementary schools, a middle school, and a high school.
Hurdland is a small, rural town with a rich history and a strong sense of community. The town is home to several historic sites, including the Hurdland Cemetery, which dates back to the late 1800s. The town also hosts several annual events, such as the Hurdland Harvest Festival and the Hurdland Homecoming.
Hurdland is a great place to live and work. The town offers a peaceful, rural lifestyle with easy access to larger cities and towns. The town is also home to a variety of recreational activities, including fishing, hunting, and camping. The town is a great place to raise a family, with a strong sense of community and a commitment to preserving its rural heritage.
Common Questions
What is Per Capita Income in Hurdland?
Per Capita income in Hurdland is $21,788.
What is the Median Family Income in Hurdland?
Median Family Income in Hurdland is $43,125.
What is the Median Household income in Hurdland?
Median Household Income in Hurdland is $30,833.
What is Inequality or Gini Index in Hurdland?
Inequality or Gini Index in Hurdland is 0.50.
What is the Total Population of Hurdland?
Total Population of Hurdland is 224.
What is the Total Male Population of Hurdland?
Total Male Population of Hurdland is 127.
What is the Total Female Population of Hurdland?
Total Female Population of Hurdland is 97.
What is the Ratio of Males per 100 Females in Hurdland?
There are 130.93 Males per 100 Females in Hurdland.
What is the Ratio of Females per 100 Males in Hurdland?
There are 76.38 Females per 100 Males in Hurdland.
What is the Median Population Age in Hurdland?
Median Population Age in Hurdland is 41.5 Years.
What is the Average Family Size in Hurdland
Average Family Size in Hurdland is 5.1 People.
What is the Average Household Size in Hurdland
Average Household Size in Hurdland is 3.2 People.
How Large is the Labor Force in Hurdland?
There are 113 People in the Labor Forcein in Hurdland.
What is the Percentage of People in the Labor Force in Hurdland?
62.8% of People are in the Labor Force in Hurdland.