Zip Codes with the Highest Percentage of Population with a Degree in Liberal Arts and History in Minneapolis, MN

RELATED REPORTS & OPTIONS

Liberal Arts and History
Population
Families and Households
Female Fertility
Female Fertility (Unmarried)
Race (Community Size)
Race (Percentage)
Ancestry (Community Size)
AfghanAfricanAlaska NativeAlbanianAlsatianAmericanApacheArabArgentineanArmenianAssyrian / Chaldean / SyriacAustralianAustrianBahamianBangladeshiBarbadianBasqueBelgianBelizeanBhutaneseBlackfeetBolivianBrazilianBritishBritish West IndianBulgarianBurmeseCajunCambodianCanadianCape VerdeanCarpatho RusynCelticCentral AmericanCentral American IndianCherokeeCheyenneChickasawChileanChippewaChoctawColombianComancheCosta RicanCreeCreekCroatianCrowCubanCypriotCzechCzechoslovakianDanishDominicanDutchEastern EuropeanEcuadorianEgyptianEnglishEstonianEthiopianEuropeanFijianFilipinoFinnishFrenchFrench American IndianFrench CanadianGermanGerman RussianGhanaianGreekGuamanian / ChamorroGuatemalanGuyaneseHaitianHonduranHungarianIcelanderIndian (Asian)IndonesianInupiatIranianIraqiIrishIroquoisIsraeliItalianJamaicanJapaneseJordanianKenyanKoreanLaotianLatvianLebaneseLiberianLithuanianLuxembourgerMacedonianMalaysianMalteseMenomineeMexicanMexican American IndianMongolianMoroccanNative HawaiianNavajoNicaraguanNigerianNorthern EuropeanNorwegianOkinawanOsagePakistaniPalestinianPanamanianParaguayanPennsylvania GermanPeruvianPolishPortuguesePotawatomiPuerto RicanRomanianRussianSalvadoranSamoanScandinavianScotch-IrishScottishSenegaleseSerbianSierra LeoneanSiouxSlavicSlovakSloveneSomaliSouth AfricanSouth AmericanSouth American IndianSoviet UnionSpaniardSpanishSri LankanSubsaharan AfricanSudaneseSwedishSwissSyrianThaiTonganTrinidadian and TobagonianTurkishUgandanUkrainianUruguayanVenezuelanVietnameseWelshWest IndianYugoslavian
Ancestry (Percentage)
AfghanAfricanAlaska NativeAlbanianAlsatianAmericanApacheArabArgentineanArmenianAssyrian / Chaldean / SyriacAustralianAustrianBahamianBangladeshiBarbadianBasqueBelgianBelizeanBhutaneseBlackfeetBolivianBrazilianBritishBritish West IndianBulgarianBurmeseCajunCambodianCanadianCape VerdeanCarpatho RusynCelticCentral AmericanCentral American IndianCherokeeCheyenneChickasawChileanChippewaChoctawColombianComancheCosta RicanCreeCreekCroatianCrowCubanCypriotCzechCzechoslovakianDanishDominicanDutchEastern EuropeanEcuadorianEgyptianEnglishEstonianEthiopianEuropeanFijianFilipinoFinnishFrenchFrench American IndianFrench CanadianGermanGerman RussianGhanaianGreekGuamanian / ChamorroGuatemalanGuyaneseHaitianHonduranHungarianIcelanderIndian (Asian)IndonesianInupiatIranianIraqiIrishIroquoisIsraeliItalianJamaicanJapaneseJordanianKenyanKoreanLaotianLatvianLebaneseLiberianLithuanianLuxembourgerMacedonianMalaysianMalteseMenomineeMexicanMexican American IndianMongolianMoroccanNative HawaiianNavajoNicaraguanNigerianNorthern EuropeanNorwegianOkinawanOsagePakistaniPalestinianPanamanianParaguayanPennsylvania GermanPeruvianPolishPortuguesePotawatomiPuerto RicanRomanianRussianSalvadoranSamoanScandinavianScotch-IrishScottishSenegaleseSerbianSierra LeoneanSiouxSlavicSlovakSloveneSomaliSouth AfricanSouth AmericanSouth American IndianSoviet UnionSpaniardSpanishSri LankanSubsaharan AfricanSudaneseSwedishSwissSyrianThaiTonganTrinidadian and TobagonianTurkishUgandanUkrainianUruguayanVenezuelanVietnameseWelshWest IndianYugoslavian
Immigrant Origin (Total)
AfghanistanAfricaAlbaniaArgentinaAsiaAustraliaAustriaBahamasBangladeshBarbadosBelarusBelgiumBelizeBoliviaBosnia and HerzegovinaBrazilBulgariaBurma / MyanmarCabo VerdeCambodiaCameroonCanadaCaribbeanCentral AmericaChileChinaColombiaCongoCosta RicaCroatiaCubaCzechoslovakiaDenmarkDominican RepublicEastern AfricaEastern AsiaEastern EuropeEcuadorEgyptEl SalvadorEnglandEritreaEthiopiaEuropeFranceGermanyGhanaGreeceGuatemalaGuyanaHaitiHondurasHong KongHungaryIndiaIndonesiaIranIraqIrelandIsraelItalyJamaicaJapanJordanKazakhstanKenyaKoreaKuwaitLaosLatin AmericaLatviaLebanonLiberiaLithuaniaMalaysiaMexicoMicronesiaMiddle AfricaMoldovaMoroccoNepalNetherlandsNicaraguaNigeriaNorthern AfricaNorthern EuropeNorwayOceaniaPakistanPanamaPeruPhilippinesPolandRomaniaRussiaSaudi ArabiaScotlandSenegalSerbiaSierra LeoneSingaporeSomaliaSouth AfricaSouth AmericaSouth Central AsiaSouth Eastern AsiaSouthern EuropeSpainSri LankaSudanSwedenSwitzerlandSyriaTaiwanThailandTrinidad and TobagoTurkeyUgandaUkraineUruguayUzbekistanVenezuelaVietnamWestern AfricaWestern AsiaWestern EuropeYemenZaireZimbabwe
Immigrant Origin (Percentage)
AfghanistanAfricaAlbaniaArgentinaAsiaAustraliaAustriaBahamasBangladeshBarbadosBelarusBelgiumBelizeBoliviaBosnia and HerzegovinaBrazilBulgariaBurma / MyanmarCabo VerdeCambodiaCameroonCanadaCaribbeanCentral AmericaChileChinaColombiaCongoCosta RicaCroatiaCubaCzechoslovakiaDenmarkDominican RepublicEastern AfricaEastern AsiaEastern EuropeEcuadorEgyptEl SalvadorEnglandEritreaEthiopiaEuropeFranceGermanyGhanaGreeceGuatemalaGuyanaHaitiHondurasHong KongHungaryIndiaIndonesiaIranIraqIrelandIsraelItalyJamaicaJapanJordanKazakhstanKenyaKoreaKuwaitLaosLatin AmericaLatviaLebanonLiberiaLithuaniaMalaysiaMexicoMicronesiaMiddle AfricaMoldovaMoroccoNepalNetherlandsNicaraguaNigeriaNorthern AfricaNorthern EuropeNorwayOceaniaPakistanPanamaPeruPhilippinesPolandRomaniaRussiaSaudi ArabiaScotlandSenegalSerbiaSierra LeoneSingaporeSomaliaSouth AfricaSouth AmericaSouth Central AsiaSouth Eastern AsiaSouthern EuropeSpainSri LankaSudanSwedenSwitzerlandSyriaTaiwanThailandTrinidad and TobagoTurkeyUgandaUkraineUruguayUzbekistanVenezuelaVietnamWestern AfricaWestern AsiaWestern EuropeYemenZaireZimbabwe
Income
Income (Families)
Income (Households)
Poverty
Poverty (Families)
Unemployment
Employment Occupations
Employment Industries
Employer Class
Commute Time
Commute Means
School Enrollment
Education by Degree Field
Occupancy
Finances
Physical Characteristics
Minneapolis
Compare Zip Codes
Comparison Subject

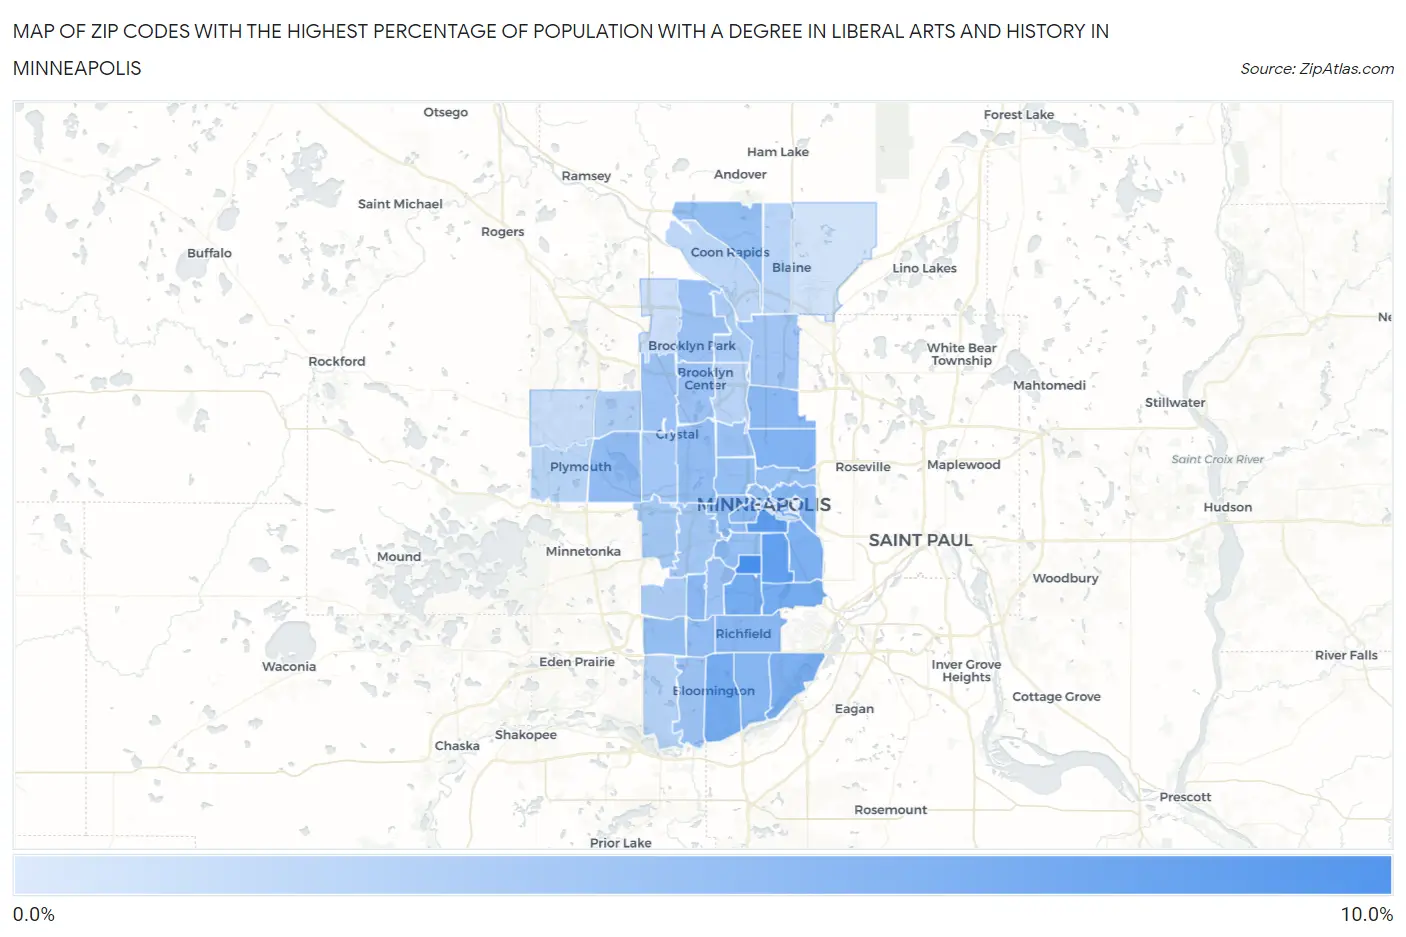
Map of Zip Codes with the Highest Percentage of Population with a Degree in Liberal Arts and History in Minneapolis

0.0%
10.0%
Zip Codes with the Highest Percentage of Population with a Degree in Liberal Arts and History in Minneapolis Map

Zip Codes with the Highest Percentage of Population with a Degree in Liberal Arts and History in Minneapolis, MN

Zip Code % Graduates vs State vs National
1.554099.5%4.4%(+5.08)#444.9%(+4.58)#3,492
2.554048.1%4.4%(+3.75)#654.9%(+3.26)#4,745
3.554077.8%4.4%(+3.44)#724.9%(+2.95)#5,144
4.554196.8%4.4%(+2.45)#1004.9%(+1.95)#6,685
5.554316.7%4.4%(+2.37)#1064.9%(+1.87)#6,847
6.554176.7%4.4%(+2.34)#1084.9%(+1.85)#6,898
7.554066.3%4.4%(+1.90)#1314.9%(+1.41)#7,839
8.554256.2%4.4%(+1.80)#1354.9%(+1.31)#8,070
9.554186.1%4.4%(+1.70)#1434.9%(+1.20)#8,323
10.554145.8%4.4%(+1.46)#1604.9%(+0.961)#8,954
11.554205.7%4.4%(+1.31)#1684.9%(+0.815)#9,333
12.554245.6%4.4%(+1.24)#1714.9%(+0.743)#9,534
13.554235.6%4.4%(+1.19)#1734.9%(+0.692)#9,662
14.554035.6%4.4%(+1.18)#1754.9%(+0.685)#9,677
15.554215.5%4.4%(+1.14)#1804.9%(+0.647)#9,822
16.554415.2%4.4%(+0.847)#2034.9%(+0.352)#10,665
17.554355.1%4.4%(+0.752)#2114.9%(+0.257)#10,931
18.554055.1%4.4%(+0.736)#2124.9%(+0.241)#10,999
19.554225.0%4.4%(+0.666)#2174.9%(+0.171)#11,219
20.554395.0%4.4%(+0.576)#2284.9%(+0.082)#11,481
21.554085.0%4.4%(+0.575)#2294.9%(+0.080)#11,488
22.554015.0%4.4%(+0.575)#2304.9%(+0.080)#11,490
23.554134.9%4.4%(+0.550)#2334.9%(+0.055)#11,567
24.554114.9%4.4%(+0.499)#2354.9%(+0.004)#11,726
25.554484.9%4.4%(+0.490)#2364.9%(-0.005)#11,761
26.554124.8%4.4%(+0.423)#2434.9%(-0.072)#11,964
27.554104.7%4.4%(+0.292)#2594.9%(-0.202)#12,424
28.554374.6%4.4%(+0.260)#2624.9%(-0.235)#12,526
29.554434.6%4.4%(+0.229)#2684.9%(-0.265)#12,623
30.554284.5%4.4%(+0.116)#2904.9%(-0.379)#12,990
31.554294.5%4.4%(+0.084)#2924.9%(-0.411)#13,082
32.554324.2%4.4%(-0.160)#3214.9%(-0.655)#13,944
33.554274.1%4.4%(-0.267)#3324.9%(-0.762)#14,364
34.554264.1%4.4%(-0.274)#3334.9%(-0.769)#14,391
35.554164.1%4.4%(-0.299)#3364.9%(-0.794)#14,480
36.554363.7%4.4%(-0.712)#3884.9%(-1.21)#16,014
37.554443.6%4.4%(-0.729)#3894.9%(-1.22)#16,072
38.554423.5%4.4%(-0.913)#4084.9%(-1.41)#16,736
39.554383.1%4.4%(-1.28)#4484.9%(-1.78)#18,017
40.554303.0%4.4%(-1.36)#4614.9%(-1.86)#18,315
41.554472.9%4.4%(-1.51)#4784.9%(-2.00)#18,778
42.554342.9%4.4%(-1.52)#4794.9%(-2.01)#18,800
43.554332.8%4.4%(-1.62)#4934.9%(-2.11)#19,125
44.554542.1%4.4%(-2.32)#5904.9%(-2.82)#21,222
45.554462.0%4.4%(-2.35)#5964.9%(-2.84)#21,308
46.554452.0%4.4%(-2.38)#6004.9%(-2.87)#21,369
47.554491.6%4.4%(-2.76)#6434.9%(-3.25)#22,249
48.554150.94%4.4%(-3.43)#6974.9%(-3.93)#23,477

Common Questions

What are the Top 10 Zip Codes with the Highest Percentage of Population with a Degree in Liberal Arts and History in Minneapolis, MN?
Top 10 Zip Codes with the Highest Percentage of Population with a Degree in Liberal Arts and History in Minneapolis, MN are:
#1
9.5%
#2
8.1%
#3
7.8%
#4
6.8%
#5
6.7%
#6
6.7%
#7
6.3%
#8
6.2%
#9
6.1%
#10
5.8%
What zip code has the Highest Percentage of Population with a Degree in Liberal Arts and History in Minneapolis, MN?
55409 has the Highest Percentage of Population with a Degree in Liberal Arts and History in Minneapolis, MN with 9.5%.
What is the Percentage of Population with a Degree in Liberal Arts and History in Minneapolis, MN?
Percentage of Population with a Degree in Liberal Arts and History in Minneapolis is 5.8%.
What is the Percentage of Population with a Degree in Liberal Arts and History in Minnesota?
Percentage of Population with a Degree in Liberal Arts and History in Minnesota is 4.4%.
What is the Percentage of Population with a Degree in Liberal Arts and History in the United States?
Percentage of Population with a Degree in Liberal Arts and History in the United States is 4.9%.