Zip Codes with the Highest Percentage of Self-Employed / Not Incorporated in Minneapolis, MN

RELATED REPORTS & OPTIONS

Self-Employed / Not Incorporated
Population
Families and Households
Female Fertility
Female Fertility (Unmarried)
Race (Community Size)
Race (Percentage)
Ancestry (Community Size)
AfghanAfricanAlaska NativeAlbanianAlsatianAmericanApacheArabArgentineanArmenianAssyrian / Chaldean / SyriacAustralianAustrianBahamianBangladeshiBarbadianBasqueBelgianBelizeanBhutaneseBlackfeetBolivianBrazilianBritishBritish West IndianBulgarianBurmeseCajunCambodianCanadianCape VerdeanCarpatho RusynCelticCentral AmericanCentral American IndianCherokeeCheyenneChickasawChileanChippewaChoctawColombianComancheCosta RicanCreeCreekCroatianCrowCubanCypriotCzechCzechoslovakianDanishDominicanDutchEastern EuropeanEcuadorianEgyptianEnglishEstonianEthiopianEuropeanFijianFilipinoFinnishFrenchFrench American IndianFrench CanadianGermanGerman RussianGhanaianGreekGuamanian / ChamorroGuatemalanGuyaneseHaitianHonduranHungarianIcelanderIndian (Asian)IndonesianInupiatIranianIraqiIrishIroquoisIsraeliItalianJamaicanJapaneseJordanianKenyanKoreanLaotianLatvianLebaneseLiberianLithuanianLuxembourgerMacedonianMalaysianMalteseMenomineeMexicanMexican American IndianMongolianMoroccanNative HawaiianNavajoNicaraguanNigerianNorthern EuropeanNorwegianOkinawanOsagePakistaniPalestinianPanamanianParaguayanPennsylvania GermanPeruvianPolishPortuguesePotawatomiPuerto RicanRomanianRussianSalvadoranSamoanScandinavianScotch-IrishScottishSenegaleseSerbianSierra LeoneanSiouxSlavicSlovakSloveneSomaliSouth AfricanSouth AmericanSouth American IndianSoviet UnionSpaniardSpanishSri LankanSubsaharan AfricanSudaneseSwedishSwissSyrianThaiTonganTrinidadian and TobagonianTurkishUgandanUkrainianUruguayanVenezuelanVietnameseWelshWest IndianYugoslavian
Ancestry (Percentage)
AfghanAfricanAlaska NativeAlbanianAlsatianAmericanApacheArabArgentineanArmenianAssyrian / Chaldean / SyriacAustralianAustrianBahamianBangladeshiBarbadianBasqueBelgianBelizeanBhutaneseBlackfeetBolivianBrazilianBritishBritish West IndianBulgarianBurmeseCajunCambodianCanadianCape VerdeanCarpatho RusynCelticCentral AmericanCentral American IndianCherokeeCheyenneChickasawChileanChippewaChoctawColombianComancheCosta RicanCreeCreekCroatianCrowCubanCypriotCzechCzechoslovakianDanishDominicanDutchEastern EuropeanEcuadorianEgyptianEnglishEstonianEthiopianEuropeanFijianFilipinoFinnishFrenchFrench American IndianFrench CanadianGermanGerman RussianGhanaianGreekGuamanian / ChamorroGuatemalanGuyaneseHaitianHonduranHungarianIcelanderIndian (Asian)IndonesianInupiatIranianIraqiIrishIroquoisIsraeliItalianJamaicanJapaneseJordanianKenyanKoreanLaotianLatvianLebaneseLiberianLithuanianLuxembourgerMacedonianMalaysianMalteseMenomineeMexicanMexican American IndianMongolianMoroccanNative HawaiianNavajoNicaraguanNigerianNorthern EuropeanNorwegianOkinawanOsagePakistaniPalestinianPanamanianParaguayanPennsylvania GermanPeruvianPolishPortuguesePotawatomiPuerto RicanRomanianRussianSalvadoranSamoanScandinavianScotch-IrishScottishSenegaleseSerbianSierra LeoneanSiouxSlavicSlovakSloveneSomaliSouth AfricanSouth AmericanSouth American IndianSoviet UnionSpaniardSpanishSri LankanSubsaharan AfricanSudaneseSwedishSwissSyrianThaiTonganTrinidadian and TobagonianTurkishUgandanUkrainianUruguayanVenezuelanVietnameseWelshWest IndianYugoslavian
Immigrant Origin (Total)
AfghanistanAfricaAlbaniaArgentinaAsiaAustraliaAustriaBahamasBangladeshBarbadosBelarusBelgiumBelizeBoliviaBosnia and HerzegovinaBrazilBulgariaBurma / MyanmarCabo VerdeCambodiaCameroonCanadaCaribbeanCentral AmericaChileChinaColombiaCongoCosta RicaCroatiaCubaCzechoslovakiaDenmarkDominican RepublicEastern AfricaEastern AsiaEastern EuropeEcuadorEgyptEl SalvadorEnglandEritreaEthiopiaEuropeFranceGermanyGhanaGreeceGuatemalaGuyanaHaitiHondurasHong KongHungaryIndiaIndonesiaIranIraqIrelandIsraelItalyJamaicaJapanJordanKazakhstanKenyaKoreaKuwaitLaosLatin AmericaLatviaLebanonLiberiaLithuaniaMalaysiaMexicoMicronesiaMiddle AfricaMoldovaMoroccoNepalNetherlandsNicaraguaNigeriaNorthern AfricaNorthern EuropeNorwayOceaniaPakistanPanamaPeruPhilippinesPolandRomaniaRussiaSaudi ArabiaScotlandSenegalSerbiaSierra LeoneSingaporeSomaliaSouth AfricaSouth AmericaSouth Central AsiaSouth Eastern AsiaSouthern EuropeSpainSri LankaSudanSwedenSwitzerlandSyriaTaiwanThailandTrinidad and TobagoTurkeyUgandaUkraineUruguayUzbekistanVenezuelaVietnamWestern AfricaWestern AsiaWestern EuropeYemenZaireZimbabwe
Immigrant Origin (Percentage)
AfghanistanAfricaAlbaniaArgentinaAsiaAustraliaAustriaBahamasBangladeshBarbadosBelarusBelgiumBelizeBoliviaBosnia and HerzegovinaBrazilBulgariaBurma / MyanmarCabo VerdeCambodiaCameroonCanadaCaribbeanCentral AmericaChileChinaColombiaCongoCosta RicaCroatiaCubaCzechoslovakiaDenmarkDominican RepublicEastern AfricaEastern AsiaEastern EuropeEcuadorEgyptEl SalvadorEnglandEritreaEthiopiaEuropeFranceGermanyGhanaGreeceGuatemalaGuyanaHaitiHondurasHong KongHungaryIndiaIndonesiaIranIraqIrelandIsraelItalyJamaicaJapanJordanKazakhstanKenyaKoreaKuwaitLaosLatin AmericaLatviaLebanonLiberiaLithuaniaMalaysiaMexicoMicronesiaMiddle AfricaMoldovaMoroccoNepalNetherlandsNicaraguaNigeriaNorthern AfricaNorthern EuropeNorwayOceaniaPakistanPanamaPeruPhilippinesPolandRomaniaRussiaSaudi ArabiaScotlandSenegalSerbiaSierra LeoneSingaporeSomaliaSouth AfricaSouth AmericaSouth Central AsiaSouth Eastern AsiaSouthern EuropeSpainSri LankaSudanSwedenSwitzerlandSyriaTaiwanThailandTrinidad and TobagoTurkeyUgandaUkraineUruguayUzbekistanVenezuelaVietnamWestern AfricaWestern AsiaWestern EuropeYemenZaireZimbabwe
Income
Income (Families)
Income (Households)
Poverty
Poverty (Families)
Unemployment
Employment Occupations
Employment Industries
Employer Class
Commute Time
Commute Means
School Enrollment
Education by Degree Field
Occupancy
Finances
Physical Characteristics
Minneapolis
Compare Zip Codes
Comparison Subject

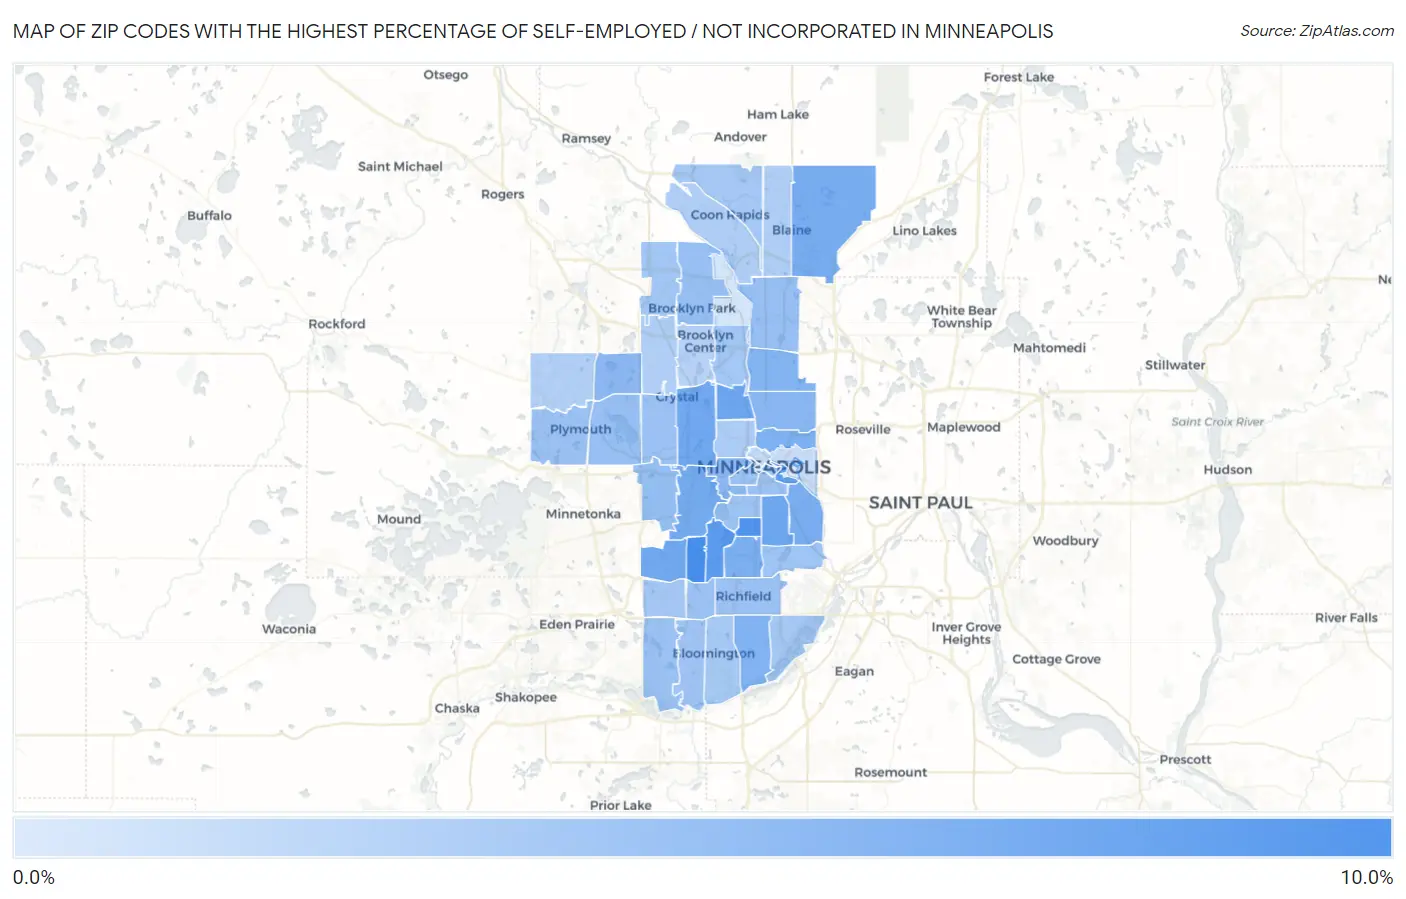
Map of Zip Codes with the Highest Percentage of Self-Employed / Not Incorporated in Minneapolis

0.0%
10.0%
Zip Codes with the Highest Percentage of Self-Employed / Not Incorporated in Minneapolis Map

Zip Codes with the Highest Percentage of Self-Employed / Not Incorporated in Minneapolis, MN

Zip Code % Self-Employed / Not Incorporated vs State vs National
1.554248.1%5.2%(+2.94)#3825.8%(+2.32)#10,374
2.554097.6%5.2%(+2.45)#4185.8%(+1.83)#11,419
3.554107.1%5.2%(+1.92)#4655.8%(+1.30)#12,717
4.554546.9%5.2%(+1.72)#4775.8%(+1.10)#13,273
5.554126.3%5.2%(+1.10)#5205.8%(+0.484)#15,100
6.554076.3%5.2%(+1.10)#5215.8%(+0.478)#15,121
7.554226.2%5.2%(+0.991)#5335.8%(+0.371)#15,462
8.554366.0%5.2%(+0.850)#5445.8%(+0.230)#15,919
9.554165.9%5.2%(+0.729)#5555.8%(+0.109)#16,308
10.554495.9%5.2%(+0.669)#5645.8%(+0.050)#16,501
11.554065.7%5.2%(+0.517)#5725.8%(-0.103)#16,995
12.554195.6%5.2%(+0.433)#5765.8%(-0.187)#17,306
13.554135.5%5.2%(+0.315)#5845.8%(-0.305)#17,736
14.554205.4%5.2%(+0.183)#5915.8%(-0.437)#18,206
15.554215.3%5.2%(+0.123)#6015.8%(-0.497)#18,447
16.554185.0%5.2%(-0.220)#6275.8%(-0.840)#19,759
17.554424.9%5.2%(-0.345)#6385.8%(-0.965)#20,224
18.554054.8%5.2%(-0.349)#6395.8%(-0.969)#20,240
19.554264.5%5.2%(-0.741)#6745.8%(-1.36)#21,761
20.554414.4%5.2%(-0.826)#6815.8%(-1.45)#22,064
21.554434.3%5.2%(-0.856)#6835.8%(-1.48)#22,176
22.554324.3%5.2%(-0.901)#6865.8%(-1.52)#22,342
23.554384.3%5.2%(-0.926)#6885.8%(-1.55)#22,436
24.554274.3%5.2%(-0.945)#6895.8%(-1.57)#22,503
25.554234.2%5.2%(-0.977)#6945.8%(-1.60)#22,619
26.554034.2%5.2%(-1.01)#6985.8%(-1.63)#22,752
27.554354.1%5.2%(-1.09)#7055.8%(-1.71)#23,015
28.554044.1%5.2%(-1.10)#7075.8%(-1.72)#23,057
29.554474.1%5.2%(-1.12)#7095.8%(-1.74)#23,134
30.554174.0%5.2%(-1.17)#7125.8%(-1.79)#23,304
31.554084.0%5.2%(-1.20)#7145.8%(-1.82)#23,392
32.554373.9%5.2%(-1.27)#7215.8%(-1.89)#23,649
33.554453.8%5.2%(-1.36)#7285.8%(-1.98)#23,940
34.554303.8%5.2%(-1.37)#7305.8%(-1.99)#23,981
35.554153.8%5.2%(-1.39)#7345.8%(-2.01)#24,059
36.554393.7%5.2%(-1.45)#7405.8%(-2.07)#24,251
37.554253.7%5.2%(-1.48)#7435.8%(-2.10)#24,367
38.554483.7%5.2%(-1.54)#7495.8%(-2.16)#24,536
39.554313.6%5.2%(-1.57)#7525.8%(-2.19)#24,612
40.554113.4%5.2%(-1.83)#7695.8%(-2.45)#25,414
41.554333.3%5.2%(-1.92)#7805.8%(-2.54)#25,666
42.554343.2%5.2%(-1.96)#7865.8%(-2.58)#25,774
43.554283.1%5.2%(-2.05)#7925.8%(-2.67)#26,011
44.554463.0%5.2%(-2.16)#7965.8%(-2.78)#26,289
45.554292.8%5.2%(-2.35)#8075.8%(-2.97)#26,738
46.554012.3%5.2%(-2.91)#8265.8%(-3.53)#27,798
47.554142.0%5.2%(-3.16)#8345.8%(-3.78)#28,184
48.554441.5%5.2%(-3.71)#8435.8%(-4.33)#28,758
49.554551.2%5.2%(-4.02)#8455.8%(-4.64)#29,006

Common Questions

What are the Top 10 Zip Codes with the Highest Percentage of Self-Employed / Not Incorporated in Minneapolis, MN?
Top 10 Zip Codes with the Highest Percentage of Self-Employed / Not Incorporated in Minneapolis, MN are:
#1
8.1%
#2
7.6%
#3
7.1%
#4
6.9%
#5
6.3%
#6
6.3%
#7
6.2%
#8
6.0%
#9
5.9%
#10
5.9%
What zip code has the Highest Percentage of Self-Employed / Not Incorporated in Minneapolis, MN?
55424 has the Highest Percentage of Self-Employed / Not Incorporated in Minneapolis, MN with 8.1%.
What is the Percentage of Self-Employed / Not Incorporated in Minneapolis, MN?
Percentage of Self-Employed / Not Incorporated in Minneapolis is 4.9%.
What is the Percentage of Self-Employed / Not Incorporated in Minnesota?
Percentage of Self-Employed / Not Incorporated in Minnesota is 5.2%.
What is the Percentage of Self-Employed / Not Incorporated in the United States?
Percentage of Self-Employed / Not Incorporated in the United States is 5.8%.