Zip Codes with the Highest Percentage of Population Employed in Computer & Mathematics in Minneapolis, MN

RELATED REPORTS & OPTIONS

Computer & Mathematics
Population
Families and Households
Female Fertility
Female Fertility (Unmarried)
Race (Community Size)
Race (Percentage)
Ancestry (Community Size)
AfghanAfricanAlaska NativeAlbanianAlsatianAmericanApacheArabArgentineanArmenianAssyrian / Chaldean / SyriacAustralianAustrianBahamianBangladeshiBarbadianBasqueBelgianBelizeanBhutaneseBlackfeetBolivianBrazilianBritishBritish West IndianBulgarianBurmeseCajunCambodianCanadianCape VerdeanCarpatho RusynCelticCentral AmericanCentral American IndianCherokeeCheyenneChickasawChileanChippewaChoctawColombianComancheCosta RicanCreeCreekCroatianCrowCubanCypriotCzechCzechoslovakianDanishDominicanDutchEastern EuropeanEcuadorianEgyptianEnglishEstonianEthiopianEuropeanFijianFilipinoFinnishFrenchFrench American IndianFrench CanadianGermanGerman RussianGhanaianGreekGuamanian / ChamorroGuatemalanGuyaneseHaitianHonduranHungarianIcelanderIndian (Asian)IndonesianInupiatIranianIraqiIrishIroquoisIsraeliItalianJamaicanJapaneseJordanianKenyanKoreanLaotianLatvianLebaneseLiberianLithuanianLuxembourgerMacedonianMalaysianMalteseMenomineeMexicanMexican American IndianMongolianMoroccanNative HawaiianNavajoNicaraguanNigerianNorthern EuropeanNorwegianOkinawanOsagePakistaniPalestinianPanamanianParaguayanPennsylvania GermanPeruvianPolishPortuguesePotawatomiPuerto RicanRomanianRussianSalvadoranSamoanScandinavianScotch-IrishScottishSenegaleseSerbianSierra LeoneanSiouxSlavicSlovakSloveneSomaliSouth AfricanSouth AmericanSouth American IndianSoviet UnionSpaniardSpanishSri LankanSubsaharan AfricanSudaneseSwedishSwissSyrianThaiTonganTrinidadian and TobagonianTurkishUgandanUkrainianUruguayanVenezuelanVietnameseWelshWest IndianYugoslavian
Ancestry (Percentage)
AfghanAfricanAlaska NativeAlbanianAlsatianAmericanApacheArabArgentineanArmenianAssyrian / Chaldean / SyriacAustralianAustrianBahamianBangladeshiBarbadianBasqueBelgianBelizeanBhutaneseBlackfeetBolivianBrazilianBritishBritish West IndianBulgarianBurmeseCajunCambodianCanadianCape VerdeanCarpatho RusynCelticCentral AmericanCentral American IndianCherokeeCheyenneChickasawChileanChippewaChoctawColombianComancheCosta RicanCreeCreekCroatianCrowCubanCypriotCzechCzechoslovakianDanishDominicanDutchEastern EuropeanEcuadorianEgyptianEnglishEstonianEthiopianEuropeanFijianFilipinoFinnishFrenchFrench American IndianFrench CanadianGermanGerman RussianGhanaianGreekGuamanian / ChamorroGuatemalanGuyaneseHaitianHonduranHungarianIcelanderIndian (Asian)IndonesianInupiatIranianIraqiIrishIroquoisIsraeliItalianJamaicanJapaneseJordanianKenyanKoreanLaotianLatvianLebaneseLiberianLithuanianLuxembourgerMacedonianMalaysianMalteseMenomineeMexicanMexican American IndianMongolianMoroccanNative HawaiianNavajoNicaraguanNigerianNorthern EuropeanNorwegianOkinawanOsagePakistaniPalestinianPanamanianParaguayanPennsylvania GermanPeruvianPolishPortuguesePotawatomiPuerto RicanRomanianRussianSalvadoranSamoanScandinavianScotch-IrishScottishSenegaleseSerbianSierra LeoneanSiouxSlavicSlovakSloveneSomaliSouth AfricanSouth AmericanSouth American IndianSoviet UnionSpaniardSpanishSri LankanSubsaharan AfricanSudaneseSwedishSwissSyrianThaiTonganTrinidadian and TobagonianTurkishUgandanUkrainianUruguayanVenezuelanVietnameseWelshWest IndianYugoslavian
Immigrant Origin (Total)
AfghanistanAfricaAlbaniaArgentinaAsiaAustraliaAustriaBahamasBangladeshBarbadosBelarusBelgiumBelizeBoliviaBosnia and HerzegovinaBrazilBulgariaBurma / MyanmarCabo VerdeCambodiaCameroonCanadaCaribbeanCentral AmericaChileChinaColombiaCongoCosta RicaCroatiaCubaCzechoslovakiaDenmarkDominican RepublicEastern AfricaEastern AsiaEastern EuropeEcuadorEgyptEl SalvadorEnglandEritreaEthiopiaEuropeFranceGermanyGhanaGreeceGuatemalaGuyanaHaitiHondurasHong KongHungaryIndiaIndonesiaIranIraqIrelandIsraelItalyJamaicaJapanJordanKazakhstanKenyaKoreaKuwaitLaosLatin AmericaLatviaLebanonLiberiaLithuaniaMalaysiaMexicoMicronesiaMiddle AfricaMoldovaMoroccoNepalNetherlandsNicaraguaNigeriaNorthern AfricaNorthern EuropeNorwayOceaniaPakistanPanamaPeruPhilippinesPolandRomaniaRussiaSaudi ArabiaScotlandSenegalSerbiaSierra LeoneSingaporeSomaliaSouth AfricaSouth AmericaSouth Central AsiaSouth Eastern AsiaSouthern EuropeSpainSri LankaSudanSwedenSwitzerlandSyriaTaiwanThailandTrinidad and TobagoTurkeyUgandaUkraineUruguayUzbekistanVenezuelaVietnamWestern AfricaWestern AsiaWestern EuropeYemenZaireZimbabwe
Immigrant Origin (Percentage)
AfghanistanAfricaAlbaniaArgentinaAsiaAustraliaAustriaBahamasBangladeshBarbadosBelarusBelgiumBelizeBoliviaBosnia and HerzegovinaBrazilBulgariaBurma / MyanmarCabo VerdeCambodiaCameroonCanadaCaribbeanCentral AmericaChileChinaColombiaCongoCosta RicaCroatiaCubaCzechoslovakiaDenmarkDominican RepublicEastern AfricaEastern AsiaEastern EuropeEcuadorEgyptEl SalvadorEnglandEritreaEthiopiaEuropeFranceGermanyGhanaGreeceGuatemalaGuyanaHaitiHondurasHong KongHungaryIndiaIndonesiaIranIraqIrelandIsraelItalyJamaicaJapanJordanKazakhstanKenyaKoreaKuwaitLaosLatin AmericaLatviaLebanonLiberiaLithuaniaMalaysiaMexicoMicronesiaMiddle AfricaMoldovaMoroccoNepalNetherlandsNicaraguaNigeriaNorthern AfricaNorthern EuropeNorwayOceaniaPakistanPanamaPeruPhilippinesPolandRomaniaRussiaSaudi ArabiaScotlandSenegalSerbiaSierra LeoneSingaporeSomaliaSouth AfricaSouth AmericaSouth Central AsiaSouth Eastern AsiaSouthern EuropeSpainSri LankaSudanSwedenSwitzerlandSyriaTaiwanThailandTrinidad and TobagoTurkeyUgandaUkraineUruguayUzbekistanVenezuelaVietnamWestern AfricaWestern AsiaWestern EuropeYemenZaireZimbabwe
Income
Income (Families)
Income (Households)
Poverty
Poverty (Families)
Unemployment
Employment Occupations
Employment Industries
Employer Class
Commute Time
Commute Means
School Enrollment
Education by Degree Field
Occupancy
Finances
Physical Characteristics
Minneapolis
Compare Zip Codes
Comparison Subject

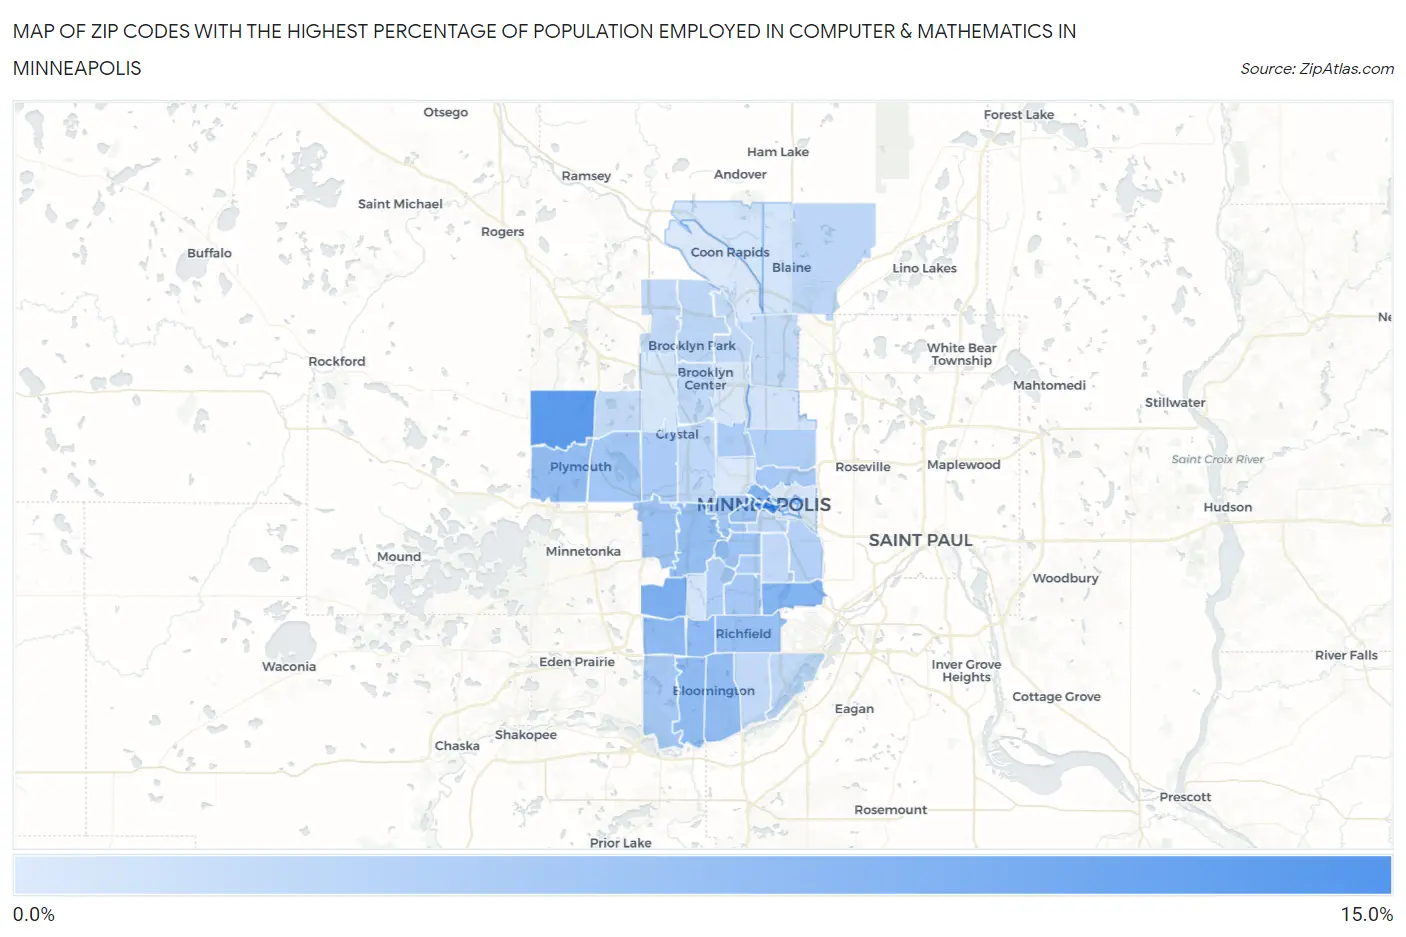
Map of Zip Codes with the Highest Percentage of Population Employed in Computer & Mathematics in Minneapolis

0.0%
15.0%
Zip Codes with the Highest Percentage of Population Employed in Computer & Mathematics in Minneapolis Map

Zip Codes with the Highest Percentage of Population Employed in Computer & Mathematics in Minneapolis, MN

Zip Code % Employed vs State vs National
1.5541512.7%3.9%(+8.80)#23.5%(+9.14)#385
2.5540212.6%3.9%(+8.70)#33.5%(+9.04)#393
3.5544611.2%3.9%(+7.28)#63.5%(+7.63)#542
4.554368.9%3.9%(+5.03)#93.5%(+5.37)#927
5.554178.6%3.9%(+4.70)#103.5%(+5.04)#1,031
6.554018.4%3.9%(+4.48)#133.5%(+4.83)#1,093
7.554357.8%3.9%(+3.94)#173.5%(+4.29)#1,272
8.554397.7%3.9%(+3.84)#183.5%(+4.18)#1,315
9.554377.6%3.9%(+3.70)#213.5%(+4.04)#1,364
10.554477.4%3.9%(+3.57)#243.5%(+3.92)#1,407
11.554317.4%3.9%(+3.57)#253.5%(+3.91)#1,411
12.554167.3%3.9%(+3.39)#293.5%(+3.74)#1,486
13.554237.1%3.9%(+3.27)#323.5%(+3.61)#1,553
14.554036.8%3.9%(+2.96)#363.5%(+3.31)#1,717
15.554266.8%3.9%(+2.92)#373.5%(+3.27)#1,739
16.554086.6%3.9%(+2.75)#423.5%(+3.10)#1,841
17.554056.5%3.9%(+2.59)#453.5%(+2.94)#1,957
18.554416.4%3.9%(+2.54)#473.5%(+2.89)#1,997
19.554136.3%3.9%(+2.41)#513.5%(+2.76)#2,094
20.554386.2%3.9%(+2.30)#543.5%(+2.64)#2,167
21.554196.2%3.9%(+2.29)#553.5%(+2.64)#2,172
22.554275.9%3.9%(+2.02)#593.5%(+2.37)#2,414
23.554095.8%3.9%(+1.90)#623.5%(+2.25)#2,521
24.554125.7%3.9%(+1.87)#633.5%(+2.21)#2,546
25.554105.7%3.9%(+1.79)#663.5%(+2.14)#2,626
26.554185.4%3.9%(+1.54)#703.5%(+1.89)#2,879
27.554065.4%3.9%(+1.50)#713.5%(+1.85)#2,922
28.554494.8%3.9%(+0.904)#873.5%(+1.25)#3,676
29.554044.8%3.9%(+0.899)#893.5%(+1.25)#3,684
30.554434.7%3.9%(+0.778)#953.5%(+1.13)#3,868
31.554224.6%3.9%(+0.727)#1003.5%(+1.07)#3,945
32.554454.5%3.9%(+0.600)#1043.5%(+0.948)#4,128
33.554074.5%3.9%(+0.583)#1053.5%(+0.931)#4,165
34.554254.4%3.9%(+0.563)#1063.5%(+0.911)#4,210
35.554444.4%3.9%(+0.558)#1073.5%(+0.906)#4,217
36.554294.4%3.9%(+0.526)#1083.5%(+0.874)#4,272
37.554204.4%3.9%(+0.522)#1093.5%(+0.869)#4,281
38.554424.3%3.9%(+0.452)#1133.5%(+0.799)#4,385
39.554324.3%3.9%(+0.439)#1143.5%(+0.787)#4,416
40.554213.5%3.9%(-0.419)#1503.5%(-0.072)#6,335
41.554343.3%3.9%(-0.572)#1583.5%(-0.225)#6,781
42.554543.3%3.9%(-0.605)#1633.5%(-0.258)#6,887
43.554483.2%3.9%(-0.703)#1713.5%(-0.355)#7,196
44.554243.2%3.9%(-0.710)#1733.5%(-0.362)#7,217
45.554283.1%3.9%(-0.731)#1763.5%(-0.383)#7,290
46.554303.0%3.9%(-0.908)#1953.5%(-0.561)#7,869
47.554142.9%3.9%(-0.961)#2023.5%(-0.614)#8,065
48.554332.8%3.9%(-1.04)#2113.5%(-0.694)#8,346
49.554112.8%3.9%(-1.05)#2143.5%(-0.698)#8,362
50.554552.6%3.9%(-1.23)#2293.5%(-0.880)#9,040

Common Questions

What are the Top 10 Zip Codes with the Highest Percentage of Population Employed in Computer & Mathematics in Minneapolis, MN?
Top 10 Zip Codes with the Highest Percentage of Population Employed in Computer & Mathematics in Minneapolis, MN are:
#1
12.7%
#2
12.6%
#3
11.2%
#4
8.9%
#5
8.6%
#6
8.4%
#7
7.8%
#8
7.7%
#9
7.6%
#10
7.4%
What zip code has the Highest Percentage of Population Employed in Computer & Mathematics in Minneapolis, MN?
55415 has the Highest Percentage of Population Employed in Computer & Mathematics in Minneapolis, MN with 12.7%.
What is the Percentage of Population Employed in Computer & Mathematics in Minneapolis, MN?
Percentage of Population Employed in Computer & Mathematics in Minneapolis is 5.7%.
What is the Percentage of Population Employed in Computer & Mathematics in Minnesota?
Percentage of Population Employed in Computer & Mathematics in Minnesota is 3.9%.
What is the Percentage of Population Employed in Computer & Mathematics in the United States?
Percentage of Population Employed in Computer & Mathematics in the United States is 3.5%.