Zip Codes with the Highest Percentage of Families with Income Below $10,000 in Minneapolis, MN

RELATED REPORTS & OPTIONS

Family Income | $0-10k
Population
Families and Households
Female Fertility
Female Fertility (Unmarried)
Race (Community Size)
Race (Percentage)
Ancestry (Community Size)
AfghanAfricanAlaska NativeAlbanianAlsatianAmericanApacheArabArgentineanArmenianAssyrian / Chaldean / SyriacAustralianAustrianBahamianBangladeshiBarbadianBasqueBelgianBelizeanBhutaneseBlackfeetBolivianBrazilianBritishBritish West IndianBulgarianBurmeseCajunCambodianCanadianCape VerdeanCarpatho RusynCelticCentral AmericanCentral American IndianCherokeeCheyenneChickasawChileanChippewaChoctawColombianComancheCosta RicanCreeCreekCroatianCrowCubanCypriotCzechCzechoslovakianDanishDominicanDutchEastern EuropeanEcuadorianEgyptianEnglishEstonianEthiopianEuropeanFijianFilipinoFinnishFrenchFrench American IndianFrench CanadianGermanGerman RussianGhanaianGreekGuamanian / ChamorroGuatemalanGuyaneseHaitianHonduranHungarianIcelanderIndian (Asian)IndonesianInupiatIranianIraqiIrishIroquoisIsraeliItalianJamaicanJapaneseJordanianKenyanKoreanLaotianLatvianLebaneseLiberianLithuanianLuxembourgerMacedonianMalaysianMalteseMenomineeMexicanMexican American IndianMongolianMoroccanNative HawaiianNavajoNicaraguanNigerianNorthern EuropeanNorwegianOkinawanOsagePakistaniPalestinianPanamanianParaguayanPennsylvania GermanPeruvianPolishPortuguesePotawatomiPuerto RicanRomanianRussianSalvadoranSamoanScandinavianScotch-IrishScottishSenegaleseSerbianSierra LeoneanSiouxSlavicSlovakSloveneSomaliSouth AfricanSouth AmericanSouth American IndianSoviet UnionSpaniardSpanishSri LankanSubsaharan AfricanSudaneseSwedishSwissSyrianThaiTonganTrinidadian and TobagonianTurkishUgandanUkrainianUruguayanVenezuelanVietnameseWelshWest IndianYugoslavian
Ancestry (Percentage)
AfghanAfricanAlaska NativeAlbanianAlsatianAmericanApacheArabArgentineanArmenianAssyrian / Chaldean / SyriacAustralianAustrianBahamianBangladeshiBarbadianBasqueBelgianBelizeanBhutaneseBlackfeetBolivianBrazilianBritishBritish West IndianBulgarianBurmeseCajunCambodianCanadianCape VerdeanCarpatho RusynCelticCentral AmericanCentral American IndianCherokeeCheyenneChickasawChileanChippewaChoctawColombianComancheCosta RicanCreeCreekCroatianCrowCubanCypriotCzechCzechoslovakianDanishDominicanDutchEastern EuropeanEcuadorianEgyptianEnglishEstonianEthiopianEuropeanFijianFilipinoFinnishFrenchFrench American IndianFrench CanadianGermanGerman RussianGhanaianGreekGuamanian / ChamorroGuatemalanGuyaneseHaitianHonduranHungarianIcelanderIndian (Asian)IndonesianInupiatIranianIraqiIrishIroquoisIsraeliItalianJamaicanJapaneseJordanianKenyanKoreanLaotianLatvianLebaneseLiberianLithuanianLuxembourgerMacedonianMalaysianMalteseMenomineeMexicanMexican American IndianMongolianMoroccanNative HawaiianNavajoNicaraguanNigerianNorthern EuropeanNorwegianOkinawanOsagePakistaniPalestinianPanamanianParaguayanPennsylvania GermanPeruvianPolishPortuguesePotawatomiPuerto RicanRomanianRussianSalvadoranSamoanScandinavianScotch-IrishScottishSenegaleseSerbianSierra LeoneanSiouxSlavicSlovakSloveneSomaliSouth AfricanSouth AmericanSouth American IndianSoviet UnionSpaniardSpanishSri LankanSubsaharan AfricanSudaneseSwedishSwissSyrianThaiTonganTrinidadian and TobagonianTurkishUgandanUkrainianUruguayanVenezuelanVietnameseWelshWest IndianYugoslavian
Immigrant Origin (Total)
AfghanistanAfricaAlbaniaArgentinaAsiaAustraliaAustriaBahamasBangladeshBarbadosBelarusBelgiumBelizeBoliviaBosnia and HerzegovinaBrazilBulgariaBurma / MyanmarCabo VerdeCambodiaCameroonCanadaCaribbeanCentral AmericaChileChinaColombiaCongoCosta RicaCroatiaCubaCzechoslovakiaDenmarkDominican RepublicEastern AfricaEastern AsiaEastern EuropeEcuadorEgyptEl SalvadorEnglandEritreaEthiopiaEuropeFranceGermanyGhanaGreeceGuatemalaGuyanaHaitiHondurasHong KongHungaryIndiaIndonesiaIranIraqIrelandIsraelItalyJamaicaJapanJordanKazakhstanKenyaKoreaKuwaitLaosLatin AmericaLatviaLebanonLiberiaLithuaniaMalaysiaMexicoMicronesiaMiddle AfricaMoldovaMoroccoNepalNetherlandsNicaraguaNigeriaNorthern AfricaNorthern EuropeNorwayOceaniaPakistanPanamaPeruPhilippinesPolandRomaniaRussiaSaudi ArabiaScotlandSenegalSerbiaSierra LeoneSingaporeSomaliaSouth AfricaSouth AmericaSouth Central AsiaSouth Eastern AsiaSouthern EuropeSpainSri LankaSudanSwedenSwitzerlandSyriaTaiwanThailandTrinidad and TobagoTurkeyUgandaUkraineUruguayUzbekistanVenezuelaVietnamWestern AfricaWestern AsiaWestern EuropeYemenZaireZimbabwe
Immigrant Origin (Percentage)
AfghanistanAfricaAlbaniaArgentinaAsiaAustraliaAustriaBahamasBangladeshBarbadosBelarusBelgiumBelizeBoliviaBosnia and HerzegovinaBrazilBulgariaBurma / MyanmarCabo VerdeCambodiaCameroonCanadaCaribbeanCentral AmericaChileChinaColombiaCongoCosta RicaCroatiaCubaCzechoslovakiaDenmarkDominican RepublicEastern AfricaEastern AsiaEastern EuropeEcuadorEgyptEl SalvadorEnglandEritreaEthiopiaEuropeFranceGermanyGhanaGreeceGuatemalaGuyanaHaitiHondurasHong KongHungaryIndiaIndonesiaIranIraqIrelandIsraelItalyJamaicaJapanJordanKazakhstanKenyaKoreaKuwaitLaosLatin AmericaLatviaLebanonLiberiaLithuaniaMalaysiaMexicoMicronesiaMiddle AfricaMoldovaMoroccoNepalNetherlandsNicaraguaNigeriaNorthern AfricaNorthern EuropeNorwayOceaniaPakistanPanamaPeruPhilippinesPolandRomaniaRussiaSaudi ArabiaScotlandSenegalSerbiaSierra LeoneSingaporeSomaliaSouth AfricaSouth AmericaSouth Central AsiaSouth Eastern AsiaSouthern EuropeSpainSri LankaSudanSwedenSwitzerlandSyriaTaiwanThailandTrinidad and TobagoTurkeyUgandaUkraineUruguayUzbekistanVenezuelaVietnamWestern AfricaWestern AsiaWestern EuropeYemenZaireZimbabwe
Income
Income (Families)
Income (Households)
Poverty
Poverty (Families)
Unemployment
Employment Occupations
Employment Industries
Employer Class
Commute Time
Commute Means
School Enrollment
Education by Degree Field
Occupancy
Finances
Physical Characteristics
Minneapolis
Compare Zip Codes
Comparison Subject

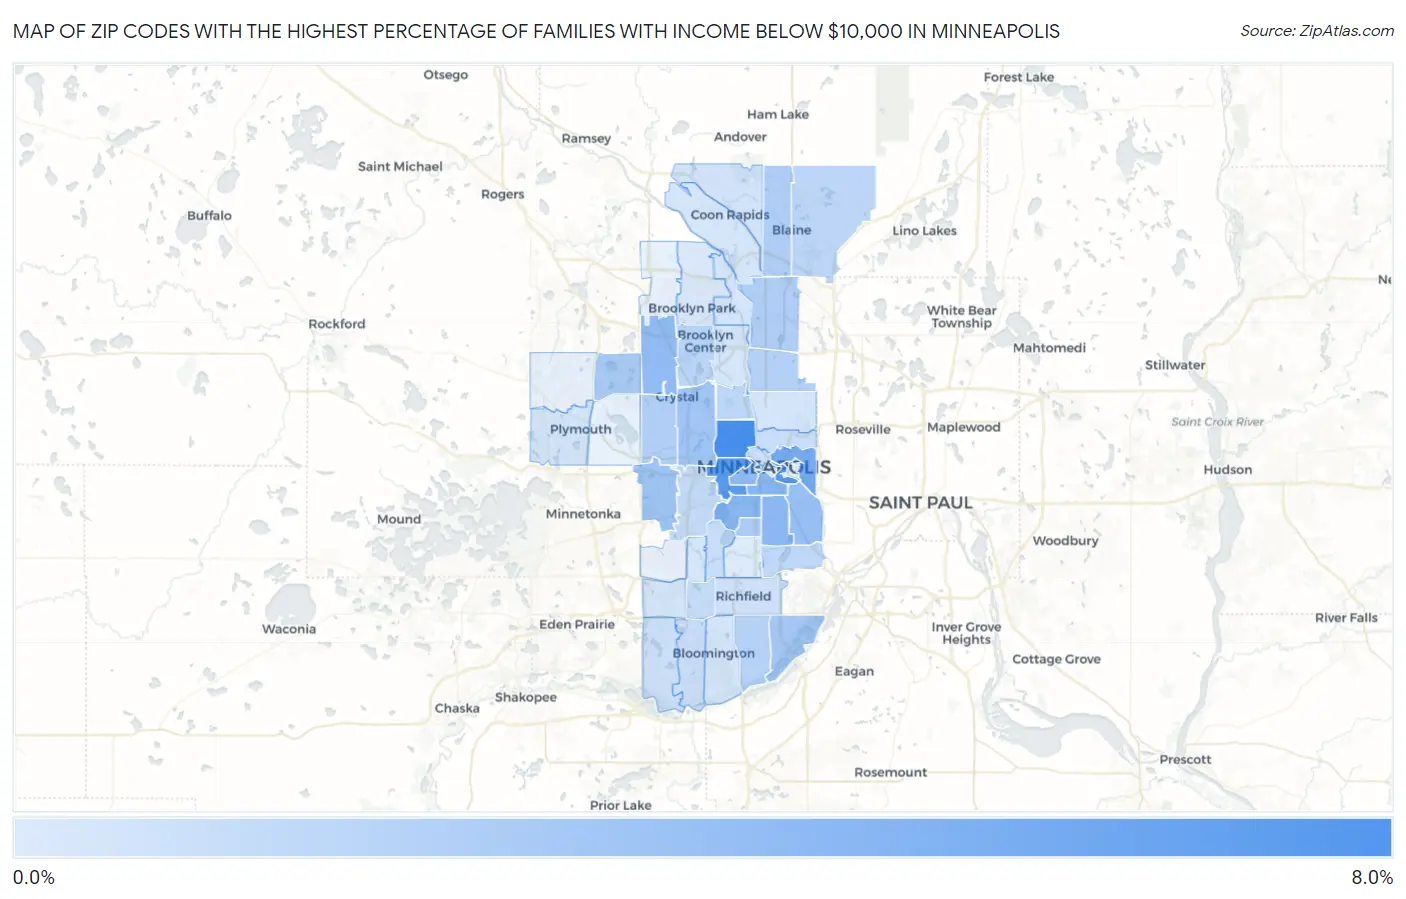
Map of Zip Codes with the Highest Percentage of Families with Income Below $10,000 in Minneapolis

0.0%
8.0%
Zip Codes with the Highest Percentage of Families with Income Below $10,000 in Minneapolis Map

Zip Codes with the Highest Percentage of Families with Income Below $10,000 in Minneapolis, MN

Zip Code Families with Income < $10k vs State vs National
1.554117.8%1.8%(+6.00)#293.1%(+4.70)#3,078
2.554547.1%1.8%(+5.30)#353.1%(+4.00)#3,565
3.554057.0%1.8%(+5.20)#363.1%(+3.90)#3,636
4.554145.4%1.8%(+3.60)#613.1%(+2.30)#5,446
5.554044.5%1.8%(+2.70)#803.1%(+1.40)#7,009
6.554084.4%1.8%(+2.60)#813.1%(+1.30)#7,223
7.554074.2%1.8%(+2.40)#863.1%(+1.10)#7,645
8.554284.0%1.8%(+2.20)#963.1%(+0.900)#8,149
9.554034.0%1.8%(+2.20)#973.1%(+0.900)#8,193
10.554063.6%1.8%(+1.80)#1193.1%(+0.500)#9,237
11.554263.3%1.8%(+1.50)#1493.1%(+0.200)#10,155
12.554223.2%1.8%(+1.40)#1573.1%(+0.100)#10,462
13.554252.9%1.8%(+1.10)#1863.1%(-0.200)#11,569
14.554422.8%1.8%(+1.000)#1963.1%(-0.300)#11,945
15.554092.7%1.8%(+0.900)#2053.1%(-0.400)#12,376
16.554342.5%1.8%(+0.700)#2163.1%(-0.600)#13,078
17.554322.5%1.8%(+0.700)#2173.1%(-0.600)#13,079
18.554272.4%1.8%(+0.600)#2333.1%(-0.700)#13,516
19.554212.3%1.8%(+0.500)#2503.1%(-0.800)#13,939
20.554202.1%1.8%(+0.300)#2793.1%(-1.000)#14,890
21.554291.9%1.8%(+0.100)#3143.1%(-1.20)#15,811
22.554491.8%1.8%(=0.000)#3333.1%(-1.30)#16,272
23.554121.8%1.8%(=0.000)#3363.1%(-1.30)#16,307
24.554171.7%1.8%(-0.100)#3533.1%(-1.40)#16,789
25.554161.4%1.8%(-0.400)#4083.1%(-1.70)#18,212
26.554351.4%1.8%(-0.400)#4113.1%(-1.70)#18,349
27.554101.2%1.8%(-0.600)#4473.1%(-1.90)#19,332
28.554131.2%1.8%(-0.600)#4533.1%(-1.90)#19,381
29.554371.1%1.8%(-0.700)#4773.1%(-2.00)#19,811
30.554381.0%1.8%(-0.800)#5113.1%(-2.10)#20,345
31.554230.90%1.8%(-0.900)#5263.1%(-2.20)#20,734
32.554010.90%1.8%(-0.900)#5353.1%(-2.20)#20,874
33.554480.80%1.8%(-1.00)#5493.1%(-2.30)#21,240
34.554300.70%1.8%(-1.10)#5733.1%(-2.40)#21,717
35.554310.70%1.8%(-1.10)#5773.1%(-2.40)#21,741
36.554390.70%1.8%(-1.10)#5793.1%(-2.40)#21,824
37.554180.60%1.8%(-1.20)#6113.1%(-2.50)#22,180
38.554470.60%1.8%(-1.20)#6123.1%(-2.50)#22,218
39.554440.60%1.8%(-1.20)#6133.1%(-2.50)#22,243
40.554330.50%1.8%(-1.30)#6303.1%(-2.60)#22,612
41.554240.50%1.8%(-1.30)#6353.1%(-2.60)#22,741
42.554430.30%1.8%(-1.50)#6643.1%(-2.80)#23,353
43.554190.20%1.8%(-1.60)#6763.1%(-2.90)#23,653

Common Questions

What are the Top 10 Zip Codes with the Highest Percentage of Families with Income Below $10,000 in Minneapolis, MN?
Top 10 Zip Codes with the Highest Percentage of Families with Income Below $10,000 in Minneapolis, MN are:
#1
7.8%
#2
7.1%
#3
7.0%
#4
5.4%
#5
4.5%
#6
4.4%
#7
4.2%
#8
4.0%
#9
4.0%
#10
3.6%
What zip code has the Highest Percentage of Families with Income Below $10,000 in Minneapolis, MN?
55411 has the Highest Percentage of Families with Income Below $10,000 in Minneapolis, MN with 7.8%.
What is the Percentage of Families with Income Below $10,000 in Minneapolis, MN?
Percentage of Families with Income Below $10,000 in Minneapolis is 3.0%.
What is the Percentage of Families with Income Below $10,000 in Minnesota?
Percentage of Families with Income Below $10,000 in Minnesota is 1.8%.
What is the Percentage of Families with Income Below $10,000 in the United States?
Percentage of Families with Income Below $10,000 in the United States is 3.1%.