Zip Codes with the Highest Percentage of Population Employed in Architecture & Engineering in Minneapolis, MN
RELATED REPORTS & OPTIONS
Architecture & Engineering
Minneapolis
Compare Zip Codes
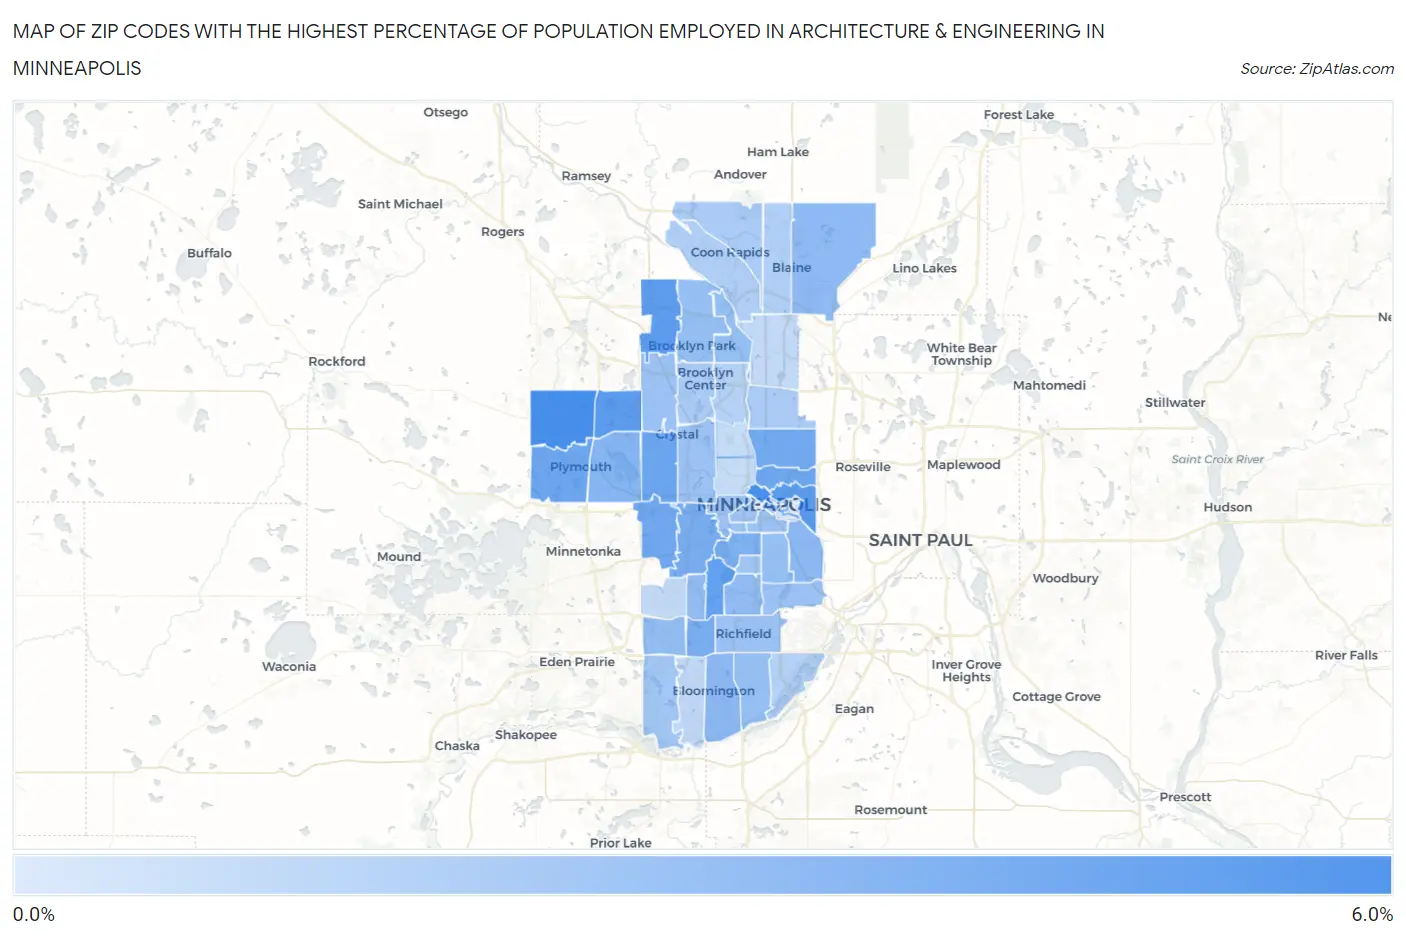
Map of Zip Codes with the Highest Percentage of Population Employed in Architecture & Engineering in Minneapolis
0.68%
5.1%
Zip Codes with the Highest Percentage of Population Employed in Architecture & Engineering in Minneapolis, MN
| Zip Code | % Employed | vs State | vs National | |
| 1. | 55446 | 5.1% | 2.4%(+2.77)#13 | 2.1%(+2.99)#1,579 |
| 2. | 55401 | 5.1% | 2.4%(+2.72)#15 | 2.1%(+2.94)#1,603 |
| 3. | 55442 | 4.5% | 2.4%(+2.17)#31 | 2.1%(+2.39)#2,082 |
| 4. | 55414 | 4.5% | 2.4%(+2.12)#33 | 2.1%(+2.33)#2,148 |
| 5. | 55445 | 4.4% | 2.4%(+2.06)#36 | 2.1%(+2.28)#2,215 |
| 6. | 55410 | 4.3% | 2.4%(+1.92)#41 | 2.1%(+2.14)#2,382 |
| 7. | 55427 | 4.0% | 2.4%(+1.63)#45 | 2.1%(+1.85)#2,765 |
| 8. | 55413 | 3.9% | 2.4%(+1.58)#49 | 2.1%(+1.80)#2,854 |
| 9. | 55447 | 3.9% | 2.4%(+1.57)#51 | 2.1%(+1.79)#2,875 |
| 10. | 55426 | 3.9% | 2.4%(+1.53)#52 | 2.1%(+1.75)#2,938 |
| 11. | 55418 | 3.8% | 2.4%(+1.44)#55 | 2.1%(+1.66)#3,071 |
| 12. | 55435 | 3.7% | 2.4%(+1.28)#62 | 2.1%(+1.50)#3,397 |
| 13. | 55416 | 3.6% | 2.4%(+1.22)#66 | 2.1%(+1.43)#3,541 |
| 14. | 55408 | 3.5% | 2.4%(+1.11)#77 | 2.1%(+1.33)#3,802 |
| 15. | 55441 | 3.2% | 2.4%(+0.858)#96 | 2.1%(+1.08)#4,396 |
| 16. | 55431 | 3.1% | 2.4%(+0.713)#109 | 2.1%(+0.932)#4,786 |
| 17. | 55406 | 3.0% | 2.4%(+0.655)#116 | 2.1%(+0.874)#4,976 |
| 18. | 55449 | 3.0% | 2.4%(+0.599)#120 | 2.1%(+0.818)#5,171 |
| 19. | 55419 | 2.9% | 2.4%(+0.570)#127 | 2.1%(+0.789)#5,282 |
| 20. | 55424 | 2.9% | 2.4%(+0.539)#129 | 2.1%(+0.758)#5,394 |
| 21. | 55439 | 2.9% | 2.4%(+0.485)#134 | 2.1%(+0.704)#5,573 |
| 22. | 55420 | 2.8% | 2.4%(+0.389)#148 | 2.1%(+0.608)#5,936 |
| 23. | 55443 | 2.8% | 2.4%(+0.387)#149 | 2.1%(+0.607)#5,941 |
| 24. | 55444 | 2.8% | 2.4%(+0.385)#150 | 2.1%(+0.604)#5,951 |
| 25. | 55407 | 2.8% | 2.4%(+0.385)#151 | 2.1%(+0.604)#5,953 |
| 26. | 55404 | 2.7% | 2.4%(+0.304)#156 | 2.1%(+0.523)#6,273 |
| 27. | 55423 | 2.7% | 2.4%(+0.290)#158 | 2.1%(+0.509)#6,337 |
| 28. | 55428 | 2.7% | 2.4%(+0.282)#162 | 2.1%(+0.501)#6,365 |
| 29. | 55422 | 2.6% | 2.4%(+0.274)#164 | 2.1%(+0.493)#6,400 |
| 30. | 55417 | 2.6% | 2.4%(+0.222)#173 | 2.1%(+0.441)#6,610 |
| 31. | 55415 | 2.5% | 2.4%(+0.171)#176 | 2.1%(+0.390)#6,838 |
| 32. | 55405 | 2.5% | 2.4%(+0.140)#178 | 2.1%(+0.359)#6,955 |
| 33. | 55409 | 2.5% | 2.4%(+0.093)#188 | 2.1%(+0.312)#7,172 |
| 34. | 55403 | 2.5% | 2.4%(+0.089)#189 | 2.1%(+0.308)#7,191 |
| 35. | 55438 | 2.3% | 2.4%(-0.027)#205 | 2.1%(+0.192)#7,757 |
| 36. | 55429 | 2.2% | 2.4%(-0.183)#234 | 2.1%(+0.036)#8,566 |
| 37. | 55448 | 2.1% | 2.4%(-0.220)#241 | 2.1%(-0.001)#8,766 |
| 38. | 55421 | 2.1% | 2.4%(-0.233)#243 | 2.1%(-0.014)#8,834 |
| 39. | 55433 | 2.0% | 2.4%(-0.329)#269 | 2.1%(-0.110)#9,378 |
| 40. | 55434 | 1.9% | 2.4%(-0.426)#298 | 2.1%(-0.207)#9,966 |
| 41. | 55425 | 1.8% | 2.4%(-0.566)#327 | 2.1%(-0.347)#10,804 |
| 42. | 55430 | 1.8% | 2.4%(-0.572)#329 | 2.1%(-0.353)#10,847 |
| 43. | 55437 | 1.5% | 2.4%(-0.851)#394 | 2.1%(-0.632)#12,757 |
| 44. | 55432 | 1.5% | 2.4%(-0.895)#406 | 2.1%(-0.676)#13,073 |
| 45. | 55436 | 1.4% | 2.4%(-0.959)#424 | 2.1%(-0.740)#13,522 |
| 46. | 55412 | 1.4% | 2.4%(-0.986)#430 | 2.1%(-0.767)#13,717 |
| 47. | 55411 | 1.4% | 2.4%(-1.00)#436 | 2.1%(-0.783)#13,833 |
| 48. | 55454 | 0.82% | 2.4%(-1.54)#564 | 2.1%(-1.32)#17,953 |
| 49. | 55455 | 0.68% | 2.4%(-1.69)#608 | 2.1%(-1.47)#19,069 |
1
Common Questions
What are the Top 10 Zip Codes with the Highest Percentage of Population Employed in Architecture & Engineering in Minneapolis, MN?
Top 10 Zip Codes with the Highest Percentage of Population Employed in Architecture & Engineering in Minneapolis, MN are:
What zip code has the Highest Percentage of Population Employed in Architecture & Engineering in Minneapolis, MN?
55446 has the Highest Percentage of Population Employed in Architecture & Engineering in Minneapolis, MN with 5.1%.
What is the Percentage of Population Employed in Architecture & Engineering in Minneapolis, MN?
Percentage of Population Employed in Architecture & Engineering in Minneapolis is 3.0%.
What is the Percentage of Population Employed in Architecture & Engineering in Minnesota?
Percentage of Population Employed in Architecture & Engineering in Minnesota is 2.4%.
What is the Percentage of Population Employed in Architecture & Engineering in the United States?
Percentage of Population Employed in Architecture & Engineering in the United States is 2.1%.