Zip Codes with the Highest Percentage of Not-for-profit Organizations in Minneapolis, MN

RELATED REPORTS & OPTIONS

Not-for-profit Organizations
Population
Families and Households
Female Fertility
Female Fertility (Unmarried)
Race (Community Size)
Race (Percentage)
Ancestry (Community Size)
AfghanAfricanAlaska NativeAlbanianAlsatianAmericanApacheArabArgentineanArmenianAssyrian / Chaldean / SyriacAustralianAustrianBahamianBangladeshiBarbadianBasqueBelgianBelizeanBhutaneseBlackfeetBolivianBrazilianBritishBritish West IndianBulgarianBurmeseCajunCambodianCanadianCape VerdeanCarpatho RusynCelticCentral AmericanCentral American IndianCherokeeCheyenneChickasawChileanChippewaChoctawColombianComancheCosta RicanCreeCreekCroatianCrowCubanCypriotCzechCzechoslovakianDanishDominicanDutchEastern EuropeanEcuadorianEgyptianEnglishEstonianEthiopianEuropeanFijianFilipinoFinnishFrenchFrench American IndianFrench CanadianGermanGerman RussianGhanaianGreekGuamanian / ChamorroGuatemalanGuyaneseHaitianHonduranHungarianIcelanderIndian (Asian)IndonesianInupiatIranianIraqiIrishIroquoisIsraeliItalianJamaicanJapaneseJordanianKenyanKoreanLaotianLatvianLebaneseLiberianLithuanianLuxembourgerMacedonianMalaysianMalteseMenomineeMexicanMexican American IndianMongolianMoroccanNative HawaiianNavajoNicaraguanNigerianNorthern EuropeanNorwegianOkinawanOsagePakistaniPalestinianPanamanianParaguayanPennsylvania GermanPeruvianPolishPortuguesePotawatomiPuerto RicanRomanianRussianSalvadoranSamoanScandinavianScotch-IrishScottishSenegaleseSerbianSierra LeoneanSiouxSlavicSlovakSloveneSomaliSouth AfricanSouth AmericanSouth American IndianSoviet UnionSpaniardSpanishSri LankanSubsaharan AfricanSudaneseSwedishSwissSyrianThaiTonganTrinidadian and TobagonianTurkishUgandanUkrainianUruguayanVenezuelanVietnameseWelshWest IndianYugoslavian
Ancestry (Percentage)
AfghanAfricanAlaska NativeAlbanianAlsatianAmericanApacheArabArgentineanArmenianAssyrian / Chaldean / SyriacAustralianAustrianBahamianBangladeshiBarbadianBasqueBelgianBelizeanBhutaneseBlackfeetBolivianBrazilianBritishBritish West IndianBulgarianBurmeseCajunCambodianCanadianCape VerdeanCarpatho RusynCelticCentral AmericanCentral American IndianCherokeeCheyenneChickasawChileanChippewaChoctawColombianComancheCosta RicanCreeCreekCroatianCrowCubanCypriotCzechCzechoslovakianDanishDominicanDutchEastern EuropeanEcuadorianEgyptianEnglishEstonianEthiopianEuropeanFijianFilipinoFinnishFrenchFrench American IndianFrench CanadianGermanGerman RussianGhanaianGreekGuamanian / ChamorroGuatemalanGuyaneseHaitianHonduranHungarianIcelanderIndian (Asian)IndonesianInupiatIranianIraqiIrishIroquoisIsraeliItalianJamaicanJapaneseJordanianKenyanKoreanLaotianLatvianLebaneseLiberianLithuanianLuxembourgerMacedonianMalaysianMalteseMenomineeMexicanMexican American IndianMongolianMoroccanNative HawaiianNavajoNicaraguanNigerianNorthern EuropeanNorwegianOkinawanOsagePakistaniPalestinianPanamanianParaguayanPennsylvania GermanPeruvianPolishPortuguesePotawatomiPuerto RicanRomanianRussianSalvadoranSamoanScandinavianScotch-IrishScottishSenegaleseSerbianSierra LeoneanSiouxSlavicSlovakSloveneSomaliSouth AfricanSouth AmericanSouth American IndianSoviet UnionSpaniardSpanishSri LankanSubsaharan AfricanSudaneseSwedishSwissSyrianThaiTonganTrinidadian and TobagonianTurkishUgandanUkrainianUruguayanVenezuelanVietnameseWelshWest IndianYugoslavian
Immigrant Origin (Total)
AfghanistanAfricaAlbaniaArgentinaAsiaAustraliaAustriaBahamasBangladeshBarbadosBelarusBelgiumBelizeBoliviaBosnia and HerzegovinaBrazilBulgariaBurma / MyanmarCabo VerdeCambodiaCameroonCanadaCaribbeanCentral AmericaChileChinaColombiaCongoCosta RicaCroatiaCubaCzechoslovakiaDenmarkDominican RepublicEastern AfricaEastern AsiaEastern EuropeEcuadorEgyptEl SalvadorEnglandEritreaEthiopiaEuropeFranceGermanyGhanaGreeceGuatemalaGuyanaHaitiHondurasHong KongHungaryIndiaIndonesiaIranIraqIrelandIsraelItalyJamaicaJapanJordanKazakhstanKenyaKoreaKuwaitLaosLatin AmericaLatviaLebanonLiberiaLithuaniaMalaysiaMexicoMicronesiaMiddle AfricaMoldovaMoroccoNepalNetherlandsNicaraguaNigeriaNorthern AfricaNorthern EuropeNorwayOceaniaPakistanPanamaPeruPhilippinesPolandRomaniaRussiaSaudi ArabiaScotlandSenegalSerbiaSierra LeoneSingaporeSomaliaSouth AfricaSouth AmericaSouth Central AsiaSouth Eastern AsiaSouthern EuropeSpainSri LankaSudanSwedenSwitzerlandSyriaTaiwanThailandTrinidad and TobagoTurkeyUgandaUkraineUruguayUzbekistanVenezuelaVietnamWestern AfricaWestern AsiaWestern EuropeYemenZaireZimbabwe
Immigrant Origin (Percentage)
AfghanistanAfricaAlbaniaArgentinaAsiaAustraliaAustriaBahamasBangladeshBarbadosBelarusBelgiumBelizeBoliviaBosnia and HerzegovinaBrazilBulgariaBurma / MyanmarCabo VerdeCambodiaCameroonCanadaCaribbeanCentral AmericaChileChinaColombiaCongoCosta RicaCroatiaCubaCzechoslovakiaDenmarkDominican RepublicEastern AfricaEastern AsiaEastern EuropeEcuadorEgyptEl SalvadorEnglandEritreaEthiopiaEuropeFranceGermanyGhanaGreeceGuatemalaGuyanaHaitiHondurasHong KongHungaryIndiaIndonesiaIranIraqIrelandIsraelItalyJamaicaJapanJordanKazakhstanKenyaKoreaKuwaitLaosLatin AmericaLatviaLebanonLiberiaLithuaniaMalaysiaMexicoMicronesiaMiddle AfricaMoldovaMoroccoNepalNetherlandsNicaraguaNigeriaNorthern AfricaNorthern EuropeNorwayOceaniaPakistanPanamaPeruPhilippinesPolandRomaniaRussiaSaudi ArabiaScotlandSenegalSerbiaSierra LeoneSingaporeSomaliaSouth AfricaSouth AmericaSouth Central AsiaSouth Eastern AsiaSouthern EuropeSpainSri LankaSudanSwedenSwitzerlandSyriaTaiwanThailandTrinidad and TobagoTurkeyUgandaUkraineUruguayUzbekistanVenezuelaVietnamWestern AfricaWestern AsiaWestern EuropeYemenZaireZimbabwe
Income
Income (Families)
Income (Households)
Poverty
Poverty (Families)
Unemployment
Employment Occupations
Employment Industries
Employer Class
Commute Time
Commute Means
School Enrollment
Education by Degree Field
Occupancy
Finances
Physical Characteristics
Minneapolis
Compare Zip Codes
Comparison Subject

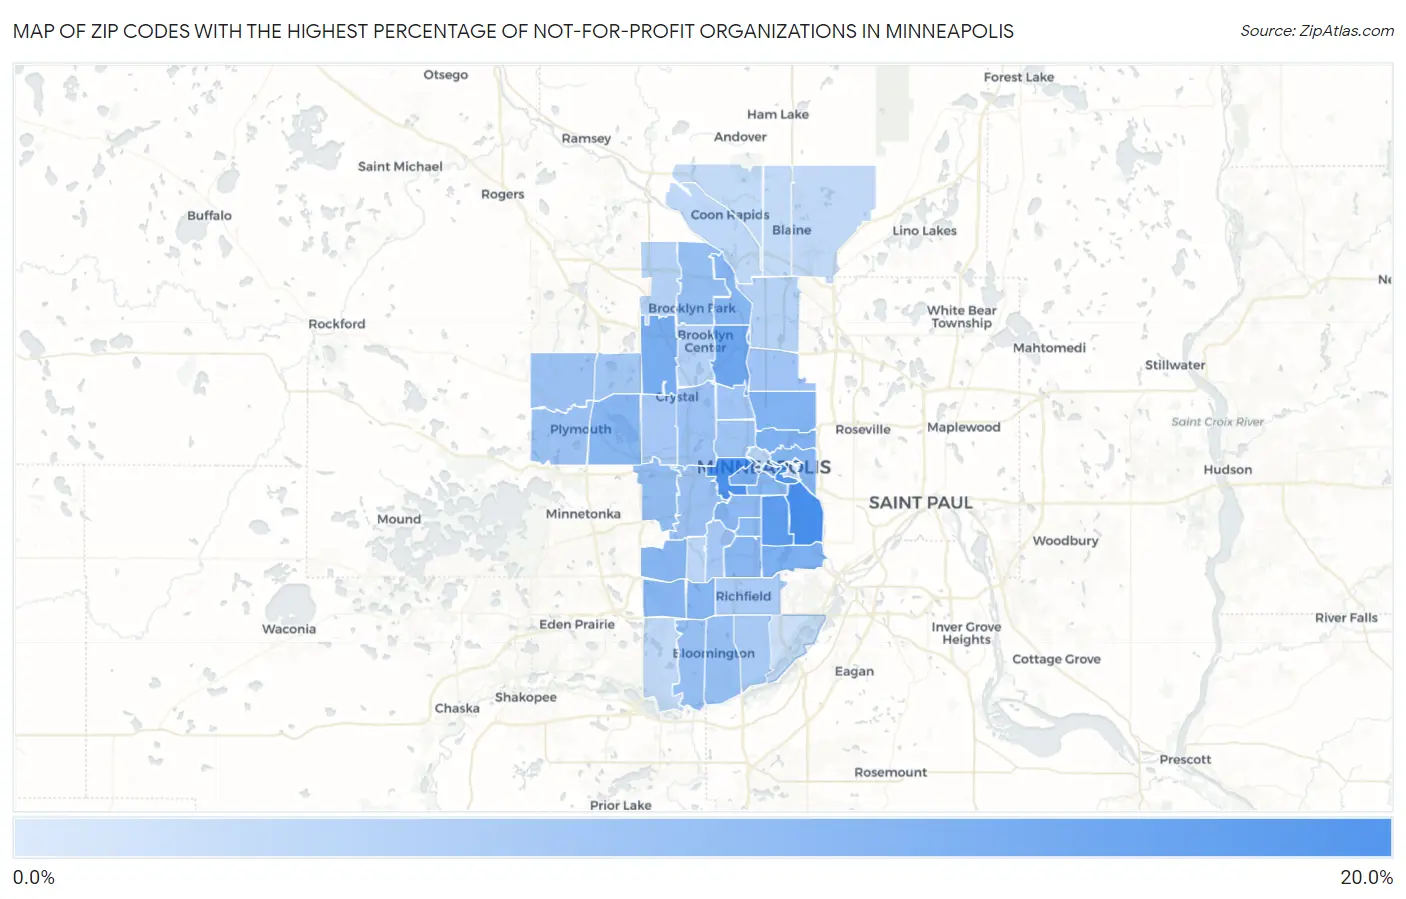
Map of Zip Codes with the Highest Percentage of Not-for-profit Organizations in Minneapolis

0.0%
20.0%
Zip Codes with the Highest Percentage of Not-for-profit Organizations in Minneapolis Map

Zip Codes with the Highest Percentage of Not-for-profit Organizations in Minneapolis, MN

Zip Code % Employed in Not-for-profit vs State vs National
1.5540619.5%11.8%(+7.74)#398.4%(+11.1)#1,381
2.5540519.1%11.8%(+7.33)#448.4%(+10.7)#1,460
3.5545418.3%11.8%(+6.49)#488.4%(+9.84)#1,632
4.5540717.3%11.8%(+5.56)#618.4%(+8.91)#1,920
5.5543015.8%11.8%(+4.02)#858.4%(+7.37)#2,527
6.5542814.8%11.8%(+3.04)#1118.4%(+6.38)#3,041
7.5540314.8%11.8%(+3.00)#1128.4%(+6.35)#3,062
8.5541714.5%11.8%(+2.66)#1228.4%(+6.01)#3,267
9.5541314.2%11.8%(+2.40)#1288.4%(+5.75)#3,442
10.5541814.0%11.8%(+2.24)#1338.4%(+5.59)#3,566
11.5541513.8%11.8%(+2.04)#1428.4%(+5.39)#3,725
12.5541413.6%11.8%(+1.85)#1538.4%(+5.20)#3,899
13.5543513.5%11.8%(+1.72)#1598.4%(+5.07)#3,998
14.5544413.4%11.8%(+1.61)#1668.4%(+4.96)#4,117
15.5543613.3%11.8%(+1.53)#1698.4%(+4.88)#4,197
16.5543913.3%11.8%(+1.52)#1708.4%(+4.87)#4,211
17.5540413.3%11.8%(+1.52)#1718.4%(+4.86)#4,215
18.5544113.3%11.8%(+1.48)#1748.4%(+4.82)#4,245
19.5541913.2%11.8%(+1.43)#1778.4%(+4.78)#4,286
20.5540913.0%11.8%(+1.19)#1908.4%(+4.54)#4,524
21.5540812.7%11.8%(+0.941)#2048.4%(+4.29)#4,797
22.5542612.3%11.8%(+0.460)#2338.4%(+3.81)#5,311
23.5544312.0%11.8%(+0.241)#2438.4%(+3.59)#5,597
24.5543711.9%11.8%(+0.091)#2568.4%(+3.44)#5,782
25.5543111.8%11.8%(+0.034)#2618.4%(+3.38)#5,857
26.5542211.7%11.8%(-0.044)#2698.4%(+3.31)#5,970
27.5544611.6%11.8%(-0.217)#2838.4%(+3.13)#6,211
28.5541611.5%11.8%(-0.307)#2908.4%(+3.04)#6,331
29.5544711.4%11.8%(-0.358)#2938.4%(+2.99)#6,404
30.5541111.3%11.8%(-0.473)#3018.4%(+2.88)#6,547
31.5541211.0%11.8%(-0.795)#3228.4%(+2.55)#7,073
32.5542111.0%11.8%(-0.820)#3258.4%(+2.53)#7,110
33.5544210.8%11.8%(-1.02)#3408.4%(+2.33)#7,423
34.5541010.7%11.8%(-1.10)#3458.4%(+2.25)#7,563
35.5542710.5%11.8%(-1.27)#3598.4%(+2.08)#7,853
36.5542010.3%11.8%(-1.45)#3818.4%(+1.90)#8,221
37.5542310.3%11.8%(-1.50)#3878.4%(+1.85)#8,304
38.554459.2%11.8%(-2.57)#4828.4%(+0.778)#10,545
39.554299.2%11.8%(-2.58)#4838.4%(+0.773)#10,562
40.554329.1%11.8%(-2.69)#4888.4%(+0.656)#10,822
41.554019.0%11.8%(-2.80)#5008.4%(+0.549)#11,080
42.554248.4%11.8%(-3.36)#5478.4%(-0.006)#12,447
43.554338.3%11.8%(-3.46)#5568.4%(-0.109)#12,719
44.554388.1%11.8%(-3.65)#5718.4%(-0.297)#13,240
45.554558.1%11.8%(-3.67)#5758.4%(-0.325)#13,313
46.554498.1%11.8%(-3.70)#5778.4%(-0.353)#13,382
47.554488.0%11.8%(-3.78)#5848.4%(-0.428)#13,586
48.554347.9%11.8%(-3.86)#5918.4%(-0.509)#13,802
49.554257.1%11.8%(-4.68)#6628.4%(-1.33)#16,225
50.554025.7%11.8%(-6.10)#7528.4%(-2.75)#20,391

Common Questions

What are the Top 10 Zip Codes with the Highest Percentage of Not-for-profit Organizations in Minneapolis, MN?
Top 10 Zip Codes with the Highest Percentage of Not-for-profit Organizations in Minneapolis, MN are:
#1
19.5%
#2
19.1%
#3
18.3%
#4
17.3%
#5
15.8%
#6
14.8%
#7
14.8%
#8
14.5%
#9
14.2%
#10
14.0%
What zip code has the Highest Percentage of Not-for-profit Organizations in Minneapolis, MN?
55406 has the Highest Percentage of Not-for-profit Organizations in Minneapolis, MN with 19.5%.
What is the Percentage of Not-for-profit Organizations in Minneapolis, MN?
Percentage of Not-for-profit Organizations in Minneapolis is 14.1%.
What is the Percentage of Not-for-profit Organizations in Minnesota?
Percentage of Not-for-profit Organizations in Minnesota is 11.8%.
What is the Percentage of Not-for-profit Organizations in the United States?
Percentage of Not-for-profit Organizations in the United States is 8.4%.