Zip Codes with the Highest Percentage of Households with Income Above $100,000 in Minneapolis, MN

RELATED REPORTS & OPTIONS

Household Income | $100k+
Population
Families and Households
Female Fertility
Female Fertility (Unmarried)
Race (Community Size)
Race (Percentage)
Ancestry (Community Size)
AfghanAfricanAlaska NativeAlbanianAlsatianAmericanApacheArabArgentineanArmenianAssyrian / Chaldean / SyriacAustralianAustrianBahamianBangladeshiBarbadianBasqueBelgianBelizeanBhutaneseBlackfeetBolivianBrazilianBritishBritish West IndianBulgarianBurmeseCajunCambodianCanadianCape VerdeanCarpatho RusynCelticCentral AmericanCentral American IndianCherokeeCheyenneChickasawChileanChippewaChoctawColombianComancheCosta RicanCreeCreekCroatianCrowCubanCypriotCzechCzechoslovakianDanishDominicanDutchEastern EuropeanEcuadorianEgyptianEnglishEstonianEthiopianEuropeanFijianFilipinoFinnishFrenchFrench American IndianFrench CanadianGermanGerman RussianGhanaianGreekGuamanian / ChamorroGuatemalanGuyaneseHaitianHonduranHungarianIcelanderIndian (Asian)IndonesianInupiatIranianIraqiIrishIroquoisIsraeliItalianJamaicanJapaneseJordanianKenyanKoreanLaotianLatvianLebaneseLiberianLithuanianLuxembourgerMacedonianMalaysianMalteseMenomineeMexicanMexican American IndianMongolianMoroccanNative HawaiianNavajoNicaraguanNigerianNorthern EuropeanNorwegianOkinawanOsagePakistaniPalestinianPanamanianParaguayanPennsylvania GermanPeruvianPolishPortuguesePotawatomiPuerto RicanRomanianRussianSalvadoranSamoanScandinavianScotch-IrishScottishSenegaleseSerbianSierra LeoneanSiouxSlavicSlovakSloveneSomaliSouth AfricanSouth AmericanSouth American IndianSoviet UnionSpaniardSpanishSri LankanSubsaharan AfricanSudaneseSwedishSwissSyrianThaiTonganTrinidadian and TobagonianTurkishUgandanUkrainianUruguayanVenezuelanVietnameseWelshWest IndianYugoslavian
Ancestry (Percentage)
AfghanAfricanAlaska NativeAlbanianAlsatianAmericanApacheArabArgentineanArmenianAssyrian / Chaldean / SyriacAustralianAustrianBahamianBangladeshiBarbadianBasqueBelgianBelizeanBhutaneseBlackfeetBolivianBrazilianBritishBritish West IndianBulgarianBurmeseCajunCambodianCanadianCape VerdeanCarpatho RusynCelticCentral AmericanCentral American IndianCherokeeCheyenneChickasawChileanChippewaChoctawColombianComancheCosta RicanCreeCreekCroatianCrowCubanCypriotCzechCzechoslovakianDanishDominicanDutchEastern EuropeanEcuadorianEgyptianEnglishEstonianEthiopianEuropeanFijianFilipinoFinnishFrenchFrench American IndianFrench CanadianGermanGerman RussianGhanaianGreekGuamanian / ChamorroGuatemalanGuyaneseHaitianHonduranHungarianIcelanderIndian (Asian)IndonesianInupiatIranianIraqiIrishIroquoisIsraeliItalianJamaicanJapaneseJordanianKenyanKoreanLaotianLatvianLebaneseLiberianLithuanianLuxembourgerMacedonianMalaysianMalteseMenomineeMexicanMexican American IndianMongolianMoroccanNative HawaiianNavajoNicaraguanNigerianNorthern EuropeanNorwegianOkinawanOsagePakistaniPalestinianPanamanianParaguayanPennsylvania GermanPeruvianPolishPortuguesePotawatomiPuerto RicanRomanianRussianSalvadoranSamoanScandinavianScotch-IrishScottishSenegaleseSerbianSierra LeoneanSiouxSlavicSlovakSloveneSomaliSouth AfricanSouth AmericanSouth American IndianSoviet UnionSpaniardSpanishSri LankanSubsaharan AfricanSudaneseSwedishSwissSyrianThaiTonganTrinidadian and TobagonianTurkishUgandanUkrainianUruguayanVenezuelanVietnameseWelshWest IndianYugoslavian
Immigrant Origin (Total)
AfghanistanAfricaAlbaniaArgentinaAsiaAustraliaAustriaBahamasBangladeshBarbadosBelarusBelgiumBelizeBoliviaBosnia and HerzegovinaBrazilBulgariaBurma / MyanmarCabo VerdeCambodiaCameroonCanadaCaribbeanCentral AmericaChileChinaColombiaCongoCosta RicaCroatiaCubaCzechoslovakiaDenmarkDominican RepublicEastern AfricaEastern AsiaEastern EuropeEcuadorEgyptEl SalvadorEnglandEritreaEthiopiaEuropeFranceGermanyGhanaGreeceGuatemalaGuyanaHaitiHondurasHong KongHungaryIndiaIndonesiaIranIraqIrelandIsraelItalyJamaicaJapanJordanKazakhstanKenyaKoreaKuwaitLaosLatin AmericaLatviaLebanonLiberiaLithuaniaMalaysiaMexicoMicronesiaMiddle AfricaMoldovaMoroccoNepalNetherlandsNicaraguaNigeriaNorthern AfricaNorthern EuropeNorwayOceaniaPakistanPanamaPeruPhilippinesPolandRomaniaRussiaSaudi ArabiaScotlandSenegalSerbiaSierra LeoneSingaporeSomaliaSouth AfricaSouth AmericaSouth Central AsiaSouth Eastern AsiaSouthern EuropeSpainSri LankaSudanSwedenSwitzerlandSyriaTaiwanThailandTrinidad and TobagoTurkeyUgandaUkraineUruguayUzbekistanVenezuelaVietnamWestern AfricaWestern AsiaWestern EuropeYemenZaireZimbabwe
Immigrant Origin (Percentage)
AfghanistanAfricaAlbaniaArgentinaAsiaAustraliaAustriaBahamasBangladeshBarbadosBelarusBelgiumBelizeBoliviaBosnia and HerzegovinaBrazilBulgariaBurma / MyanmarCabo VerdeCambodiaCameroonCanadaCaribbeanCentral AmericaChileChinaColombiaCongoCosta RicaCroatiaCubaCzechoslovakiaDenmarkDominican RepublicEastern AfricaEastern AsiaEastern EuropeEcuadorEgyptEl SalvadorEnglandEritreaEthiopiaEuropeFranceGermanyGhanaGreeceGuatemalaGuyanaHaitiHondurasHong KongHungaryIndiaIndonesiaIranIraqIrelandIsraelItalyJamaicaJapanJordanKazakhstanKenyaKoreaKuwaitLaosLatin AmericaLatviaLebanonLiberiaLithuaniaMalaysiaMexicoMicronesiaMiddle AfricaMoldovaMoroccoNepalNetherlandsNicaraguaNigeriaNorthern AfricaNorthern EuropeNorwayOceaniaPakistanPanamaPeruPhilippinesPolandRomaniaRussiaSaudi ArabiaScotlandSenegalSerbiaSierra LeoneSingaporeSomaliaSouth AfricaSouth AmericaSouth Central AsiaSouth Eastern AsiaSouthern EuropeSpainSri LankaSudanSwedenSwitzerlandSyriaTaiwanThailandTrinidad and TobagoTurkeyUgandaUkraineUruguayUzbekistanVenezuelaVietnamWestern AfricaWestern AsiaWestern EuropeYemenZaireZimbabwe
Income
Income (Families)
Income (Households)
Poverty
Poverty (Families)
Unemployment
Employment Occupations
Employment Industries
Employer Class
Commute Time
Commute Means
School Enrollment
Education by Degree Field
Occupancy
Finances
Physical Characteristics
Minneapolis
Compare Zip Codes
Comparison Subject

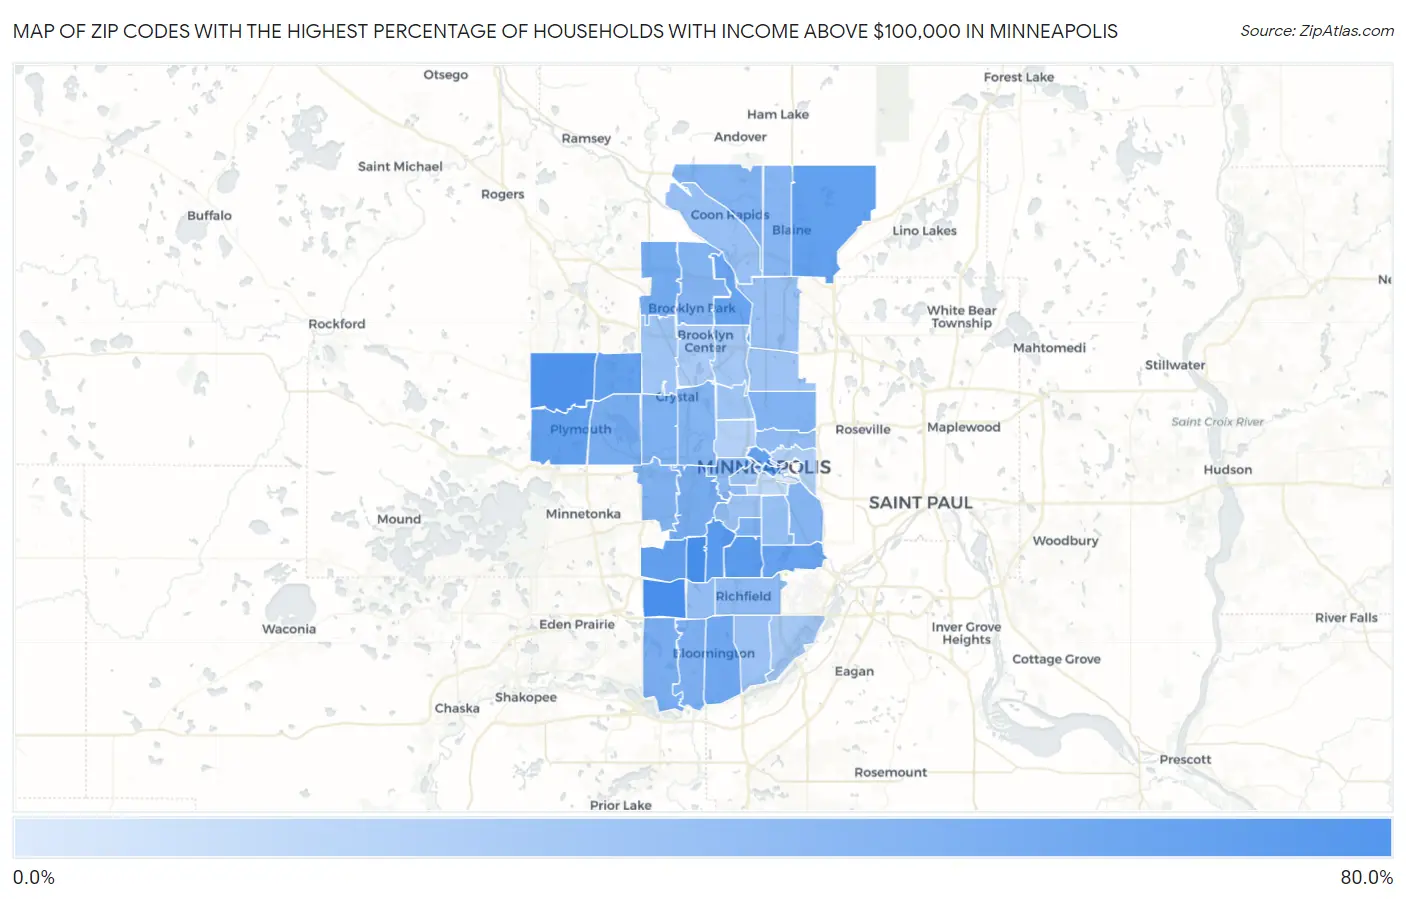
Map of Zip Codes with the Highest Percentage of Households with Income Above $100,000 in Minneapolis

0.0%
80.0%
Zip Codes with the Highest Percentage of Households with Income Above $100,000 in Minneapolis Map

Zip Codes with the Highest Percentage of Households with Income Above $100,000 in Minneapolis, MN

Zip Code Households with Income > $100k vs State vs National
1.5542476.8%41.9%(+34.9)#337.3%(+39.5)#477
2.5543974.9%41.9%(+33.0)#437.3%(+37.6)#581
3.5544670.9%41.9%(+29.0)#737.3%(+33.6)#880
4.5541964.6%41.9%(+22.7)#2737.3%(+27.3)#1,590
5.5541064.4%41.9%(+22.5)#2937.3%(+27.1)#1,630
6.5544761.0%41.9%(+19.1)#3837.3%(+23.7)#2,180
7.5544960.7%41.9%(+18.8)#4137.3%(+23.4)#2,225
8.5543660.6%41.9%(+18.7)#4237.3%(+23.3)#2,248
9.5544258.9%41.9%(+17.0)#5037.3%(+21.6)#2,586
10.5541757.8%41.9%(+15.9)#5537.3%(+20.5)#2,804
11.5540157.7%41.9%(+15.8)#5637.3%(+20.4)#2,830
12.5544456.9%41.9%(+15.0)#6237.3%(+19.6)#3,004
13.5541556.9%41.9%(+15.0)#6337.3%(+19.6)#3,007
14.5543152.9%41.9%(+11.0)#8737.3%(+15.6)#3,989
15.5544550.9%41.9%(+9.00)#10437.3%(+13.6)#4,572
16.5541649.9%41.9%(+8.00)#11537.3%(+12.6)#4,882
17.5544149.3%41.9%(+7.40)#11937.3%(+12.0)#5,086
18.5543848.6%41.9%(+6.70)#13037.3%(+11.3)#5,293
19.5540946.7%41.9%(+4.80)#15437.3%(+9.40)#5,948
20.5542746.2%41.9%(+4.30)#16037.3%(+8.90)#6,123
21.5543745.9%41.9%(+4.00)#16437.3%(+8.60)#6,254
22.5542645.1%41.9%(+3.20)#17437.3%(+7.80)#6,577
23.5541844.8%41.9%(+2.90)#17937.3%(+7.50)#6,697
24.5544844.4%41.9%(+2.50)#18337.3%(+7.10)#6,847
25.5542244.1%41.9%(+2.20)#18837.3%(+6.80)#6,961
26.5544343.3%41.9%(+1.40)#20137.3%(+6.00)#7,289
27.5540642.9%41.9%(+1.00)#21137.3%(+5.60)#7,476
28.5543442.6%41.9%(+0.700)#21737.3%(+5.30)#7,609
29.5542338.2%41.9%(-3.70)#28637.3%(+0.900)#9,860
30.5540537.5%41.9%(-4.40)#30137.3%(+0.200)#10,263
31.5541336.6%41.9%(-5.30)#31937.3%(-0.700)#10,823
32.5543535.4%41.9%(-6.50)#35437.3%(-1.90)#11,533
33.5540734.8%41.9%(-7.10)#36537.3%(-2.50)#11,881
34.5543333.6%41.9%(-8.30)#39937.3%(-3.70)#12,704
35.5540233.4%41.9%(-8.50)#40837.3%(-3.90)#12,854
36.5543233.3%41.9%(-8.60)#40937.3%(-4.00)#12,873
37.5542033.0%41.9%(-8.90)#42137.3%(-4.30)#13,105
38.5540832.5%41.9%(-9.40)#44437.3%(-4.80)#13,454
39.5542830.9%41.9%(-11.0)#49837.3%(-6.40)#14,713
40.5542130.3%41.9%(-11.6)#52737.3%(-7.00)#15,186
41.5541230.3%41.9%(-11.6)#52837.3%(-7.00)#15,187
42.5540330.0%41.9%(-11.9)#54037.3%(-7.30)#15,452
43.5543028.8%41.9%(-13.1)#57437.3%(-8.50)#16,410
44.5542527.2%41.9%(-14.7)#62537.3%(-10.1)#17,813
45.5542925.6%41.9%(-16.3)#66637.3%(-11.7)#19,213
46.5541422.0%41.9%(-19.9)#75237.3%(-15.3)#22,385
47.5541121.3%41.9%(-20.6)#76537.3%(-16.0)#22,981
48.5540416.8%41.9%(-25.1)#81637.3%(-20.5)#26,361
49.554545.2%41.9%(-36.7)#85937.3%(-32.1)#31,020

Common Questions

What are the Top 10 Zip Codes with the Highest Percentage of Households with Income Above $100,000 in Minneapolis, MN?
Top 10 Zip Codes with the Highest Percentage of Households with Income Above $100,000 in Minneapolis, MN are:
#1
76.8%
#2
74.9%
#3
70.9%
#4
64.6%
#5
64.4%
#6
61.0%
#7
60.7%
#8
60.6%
#9
58.9%
#10
57.8%
What zip code has the Highest Percentage of Households with Income Above $100,000 in Minneapolis, MN?
55424 has the Highest Percentage of Households with Income Above $100,000 in Minneapolis, MN with 76.8%.
What is the Percentage of Households with Income Above $100,000 in Minneapolis, MN?
Percentage of Households with Income Above $100,000 in Minneapolis is 38.3%.
What is the Percentage of Households with Income Above $100,000 in Minnesota?
Percentage of Households with Income Above $100,000 in Minnesota is 41.9%.
What is the Percentage of Households with Income Above $100,000 in the United States?
Percentage of Households with Income Above $100,000 in the United States is 37.3%.