Zip Codes with the Highest Percentage of Population Employed in Agriculture, Fishing & Hunting in Warren, MI
RELATED REPORTS & OPTIONS
Agriculture, Fishing & Hunting
Warren
Compare Zip Codes
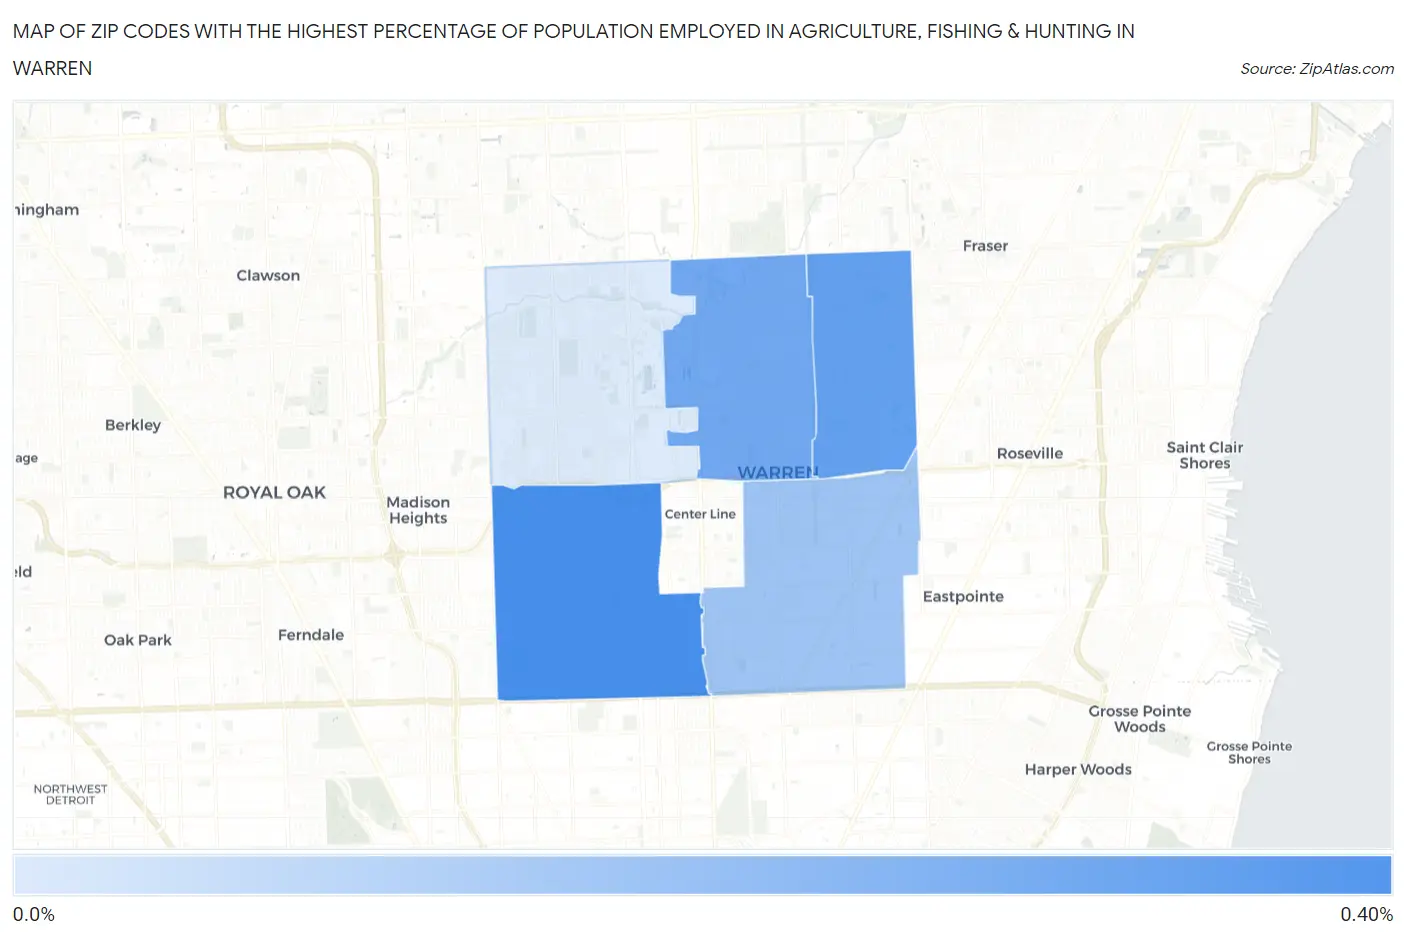
Map of Zip Codes with the Highest Percentage of Population Employed in Agriculture, Fishing & Hunting in Warren
0.044%
0.34%
Zip Codes with the Highest Percentage of Population Employed in Agriculture, Fishing & Hunting in Warren, MI
| Zip Code | % Employed | vs State | vs National | |
| 1. | 48091 | 0.34% | 0.98%(-0.642)#684 | 1.2%(-0.857)#20,723 |
| 2. | 48088 | 0.29% | 0.98%(-0.697)#704 | 1.2%(-0.912)#21,319 |
| 3. | 48093 | 0.26% | 0.98%(-0.723)#721 | 1.2%(-0.938)#21,639 |
| 4. | 48089 | 0.17% | 0.98%(-0.815)#755 | 1.2%(-1.03)#22,729 |
| 5. | 48092 | 0.044% | 0.98%(-0.940)#814 | 1.2%(-1.16)#24,411 |
1
Common Questions
What are the Top 3 Zip Codes with the Highest Percentage of Population Employed in Agriculture, Fishing & Hunting in Warren, MI?
Top 3 Zip Codes with the Highest Percentage of Population Employed in Agriculture, Fishing & Hunting in Warren, MI are:
What zip code has the Highest Percentage of Population Employed in Agriculture, Fishing & Hunting in Warren, MI?
48091 has the Highest Percentage of Population Employed in Agriculture, Fishing & Hunting in Warren, MI with 0.34%.
What is the Percentage of Population Employed in Agriculture, Fishing & Hunting in Warren, MI?
Percentage of Population Employed in Agriculture, Fishing & Hunting in Warren is 0.22%.
What is the Percentage of Population Employed in Agriculture, Fishing & Hunting in Michigan?
Percentage of Population Employed in Agriculture, Fishing & Hunting in Michigan is 0.98%.
What is the Percentage of Population Employed in Agriculture, Fishing & Hunting in the United States?
Percentage of Population Employed in Agriculture, Fishing & Hunting in the United States is 1.2%.