Zip Codes with the Highest Percentage of Population Employed in Security & Protection in Warren, MI
RELATED REPORTS & OPTIONS
Security & Protection
Warren
Compare Zip Codes
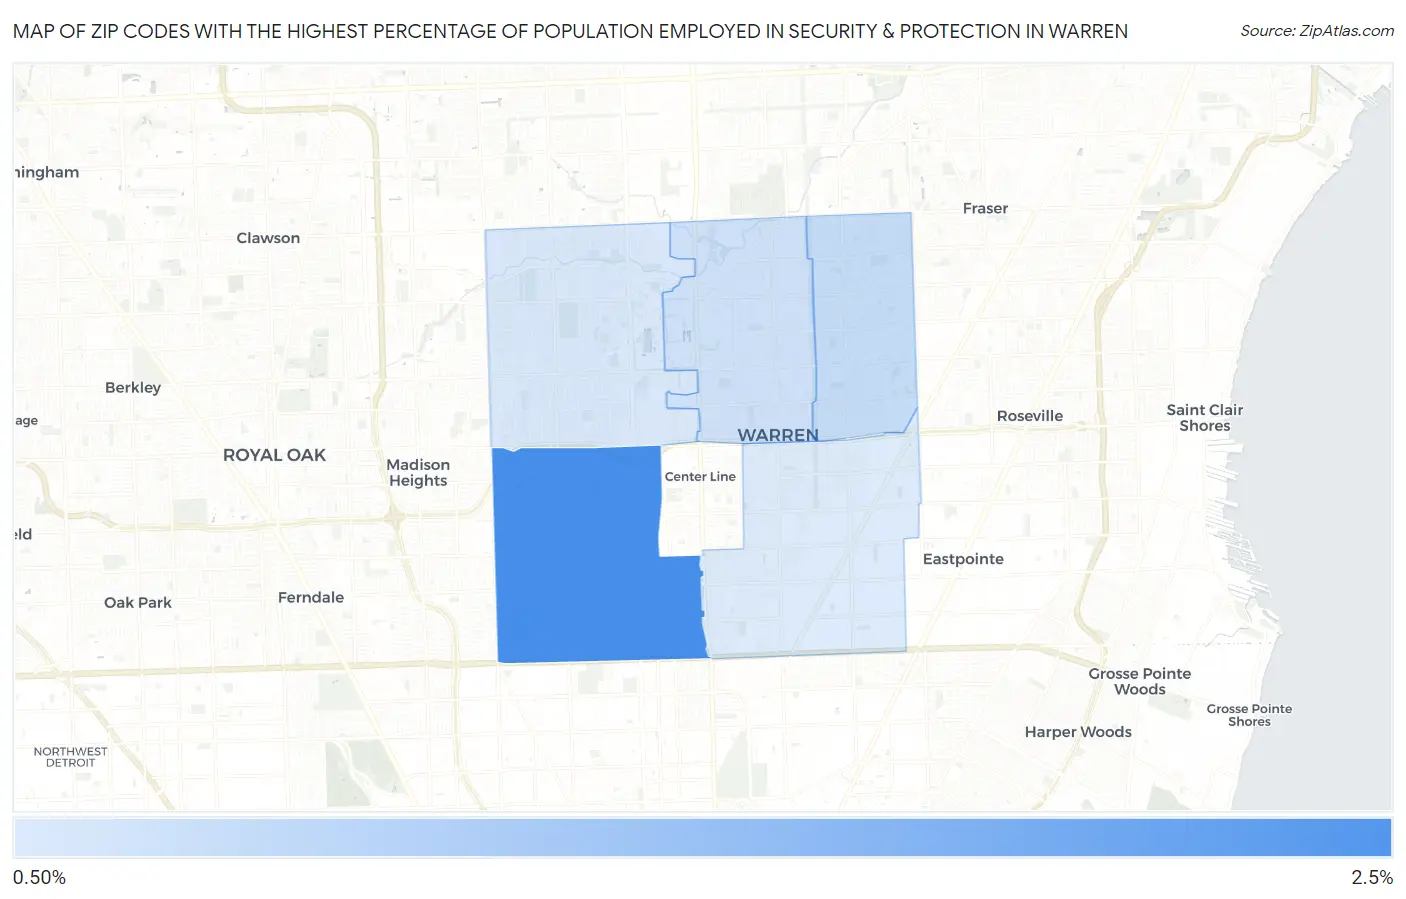
Map of Zip Codes with the Highest Percentage of Population Employed in Security & Protection in Warren
1.1%
2.5%
Zip Codes with the Highest Percentage of Population Employed in Security & Protection in Warren, MI
| Zip Code | % Employed | vs State | vs National | |
| 1. | 48091 | 2.5% | 1.6%(+0.849)#192 | 2.1%(+0.342)#9,562 |
| 2. | 48088 | 1.4% | 1.6%(-0.287)#497 | 2.1%(-0.794)#17,300 |
| 3. | 48093 | 1.3% | 1.6%(-0.380)#531 | 2.1%(-0.887)#18,053 |
| 4. | 48092 | 1.2% | 1.6%(-0.470)#557 | 2.1%(-0.977)#18,731 |
| 5. | 48089 | 1.1% | 1.6%(-0.501)#568 | 2.1%(-1.01)#18,984 |
1
Common Questions
What are the Top 3 Zip Codes with the Highest Percentage of Population Employed in Security & Protection in Warren, MI?
Top 3 Zip Codes with the Highest Percentage of Population Employed in Security & Protection in Warren, MI are:
What zip code has the Highest Percentage of Population Employed in Security & Protection in Warren, MI?
48091 has the Highest Percentage of Population Employed in Security & Protection in Warren, MI with 2.5%.
What is the Percentage of Population Employed in Security & Protection in Warren, MI?
Percentage of Population Employed in Security & Protection in Warren is 1.5%.
What is the Percentage of Population Employed in Security & Protection in Michigan?
Percentage of Population Employed in Security & Protection in Michigan is 1.6%.
What is the Percentage of Population Employed in Security & Protection in the United States?
Percentage of Population Employed in Security & Protection in the United States is 2.1%.