Zip Codes with the Highest Percentage of Population Employed in Health Diagnosing & Treating in Quincy, IL
RELATED REPORTS & OPTIONS
Health Diagnosing & Treating
Quincy
Compare Zip Codes
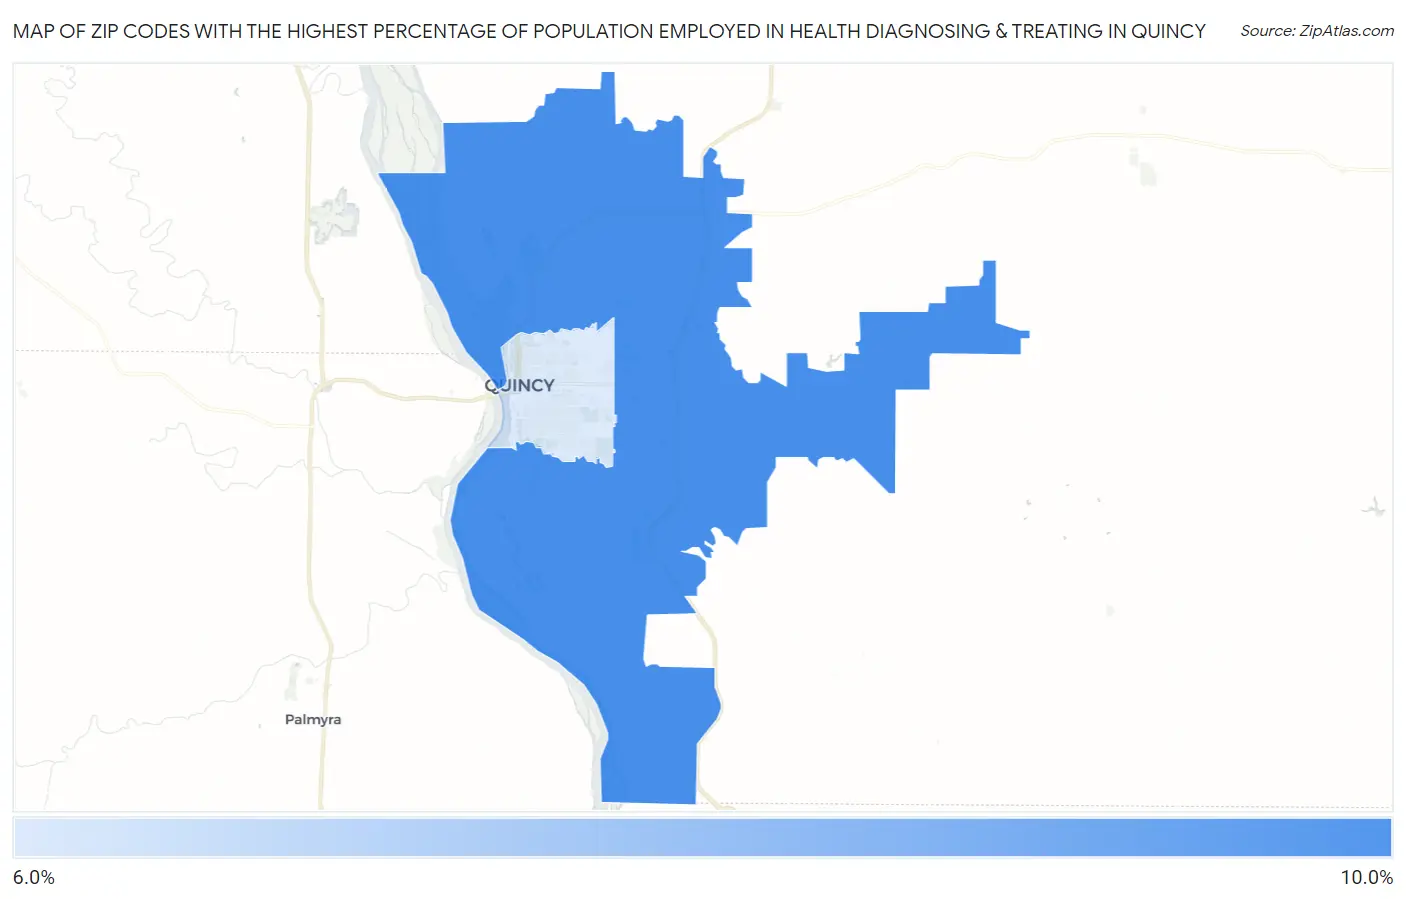
Map of Zip Codes with the Highest Percentage of Population Employed in Health Diagnosing & Treating in Quincy
6.2%
9.8%
Zip Codes with the Highest Percentage of Population Employed in Health Diagnosing & Treating in Quincy, IL
| Zip Code | % Employed | vs State | vs National | |
| 1. | 62305 | 9.8% | 6.2%(+3.54)#202 | 6.2%(+3.53)#4,140 |
| 2. | 62301 | 6.2% | 6.2%(-0.068)#619 | 6.2%(-0.076)#13,273 |
1
Common Questions
What are the Top Zip Codes with the Highest Percentage of Population Employed in Health Diagnosing & Treating in Quincy, IL?
Top Zip Codes with the Highest Percentage of Population Employed in Health Diagnosing & Treating in Quincy, IL are:
What zip code has the Highest Percentage of Population Employed in Health Diagnosing & Treating in Quincy, IL?
62305 has the Highest Percentage of Population Employed in Health Diagnosing & Treating in Quincy, IL with 9.8%.
What is the Percentage of Population Employed in Health Diagnosing & Treating in Quincy, IL?
Percentage of Population Employed in Health Diagnosing & Treating in Quincy is 6.8%.
What is the Percentage of Population Employed in Health Diagnosing & Treating in Illinois?
Percentage of Population Employed in Health Diagnosing & Treating in Illinois is 6.2%.
What is the Percentage of Population Employed in Health Diagnosing & Treating in the United States?
Percentage of Population Employed in Health Diagnosing & Treating in the United States is 6.2%.