Zip Codes with the Highest Percentage of Population Employed in Arts, Entertainment & Recreation in Quincy, IL
RELATED REPORTS & OPTIONS
Arts, Entertainment & Recreation
Quincy
Compare Zip Codes
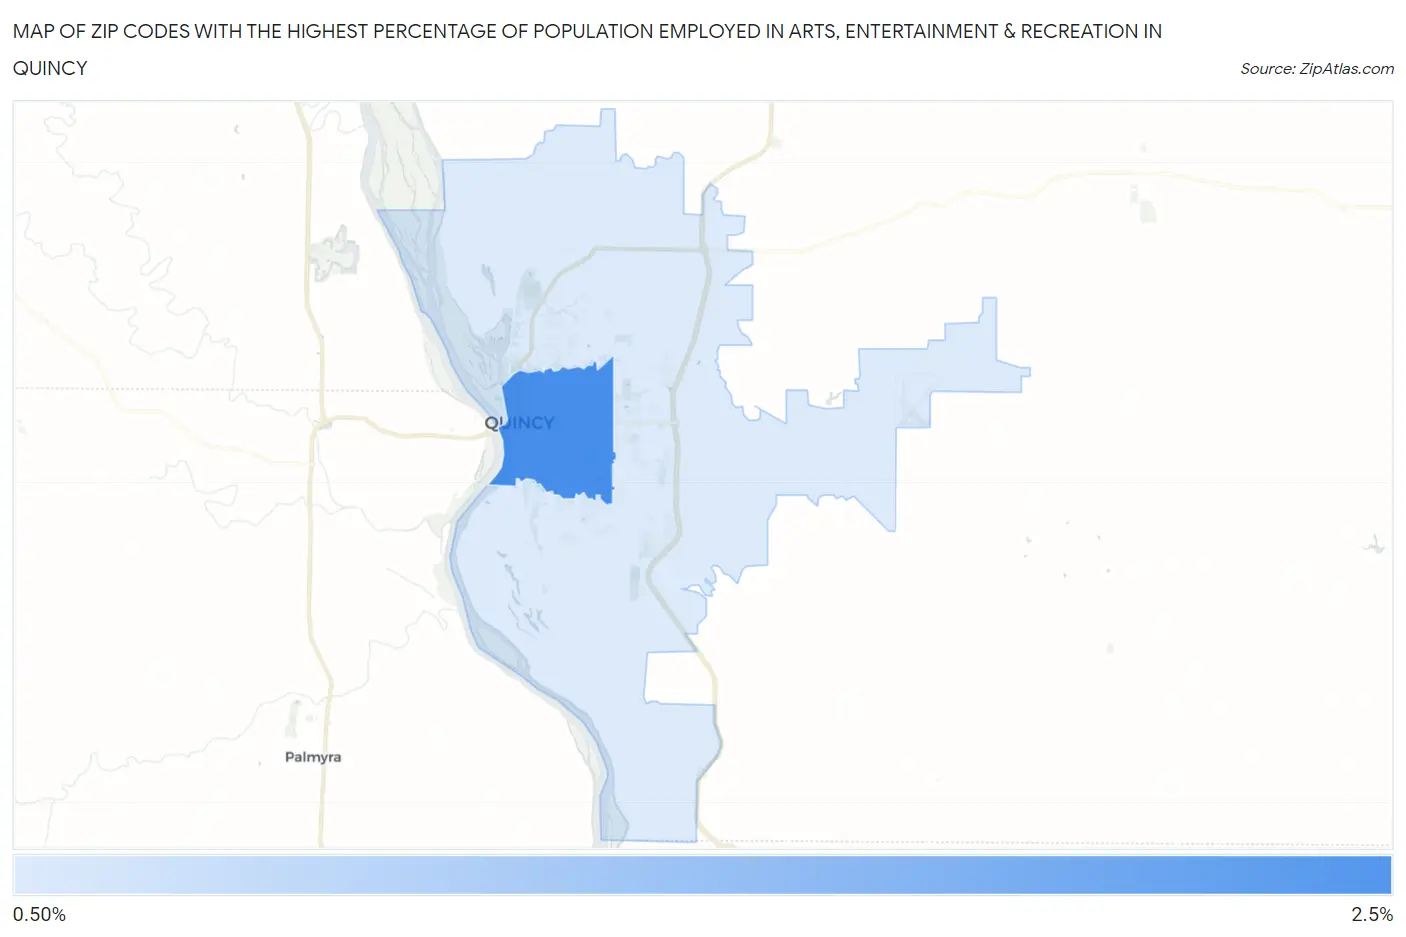
Map of Zip Codes with the Highest Percentage of Population Employed in Arts, Entertainment & Recreation in Quincy
0.85%
2.0%
Zip Codes with the Highest Percentage of Population Employed in Arts, Entertainment & Recreation in Quincy, IL
| Zip Code | % Employed | vs State | vs National | |
| 1. | 62301 | 2.0% | 1.9%(+0.082)#333 | 2.1%(-0.066)#9,673 |
| 2. | 62305 | 0.85% | 1.9%(-1.09)#699 | 2.1%(-1.23)#18,063 |
1
Common Questions
What are the Top Zip Codes with the Highest Percentage of Population Employed in Arts, Entertainment & Recreation in Quincy, IL?
Top Zip Codes with the Highest Percentage of Population Employed in Arts, Entertainment & Recreation in Quincy, IL are:
What zip code has the Highest Percentage of Population Employed in Arts, Entertainment & Recreation in Quincy, IL?
62301 has the Highest Percentage of Population Employed in Arts, Entertainment & Recreation in Quincy, IL with 2.0%.
What is the Percentage of Population Employed in Arts, Entertainment & Recreation in Quincy, IL?
Percentage of Population Employed in Arts, Entertainment & Recreation in Quincy is 1.7%.
What is the Percentage of Population Employed in Arts, Entertainment & Recreation in Illinois?
Percentage of Population Employed in Arts, Entertainment & Recreation in Illinois is 1.9%.
What is the Percentage of Population Employed in Arts, Entertainment & Recreation in the United States?
Percentage of Population Employed in Arts, Entertainment & Recreation in the United States is 2.1%.