Zip Codes with the Highest Percentage of Population with a Degree in Visual and Performing Arts in Quincy, IL
RELATED REPORTS & OPTIONS
Visual and Performing Arts
Quincy
Compare Zip Codes
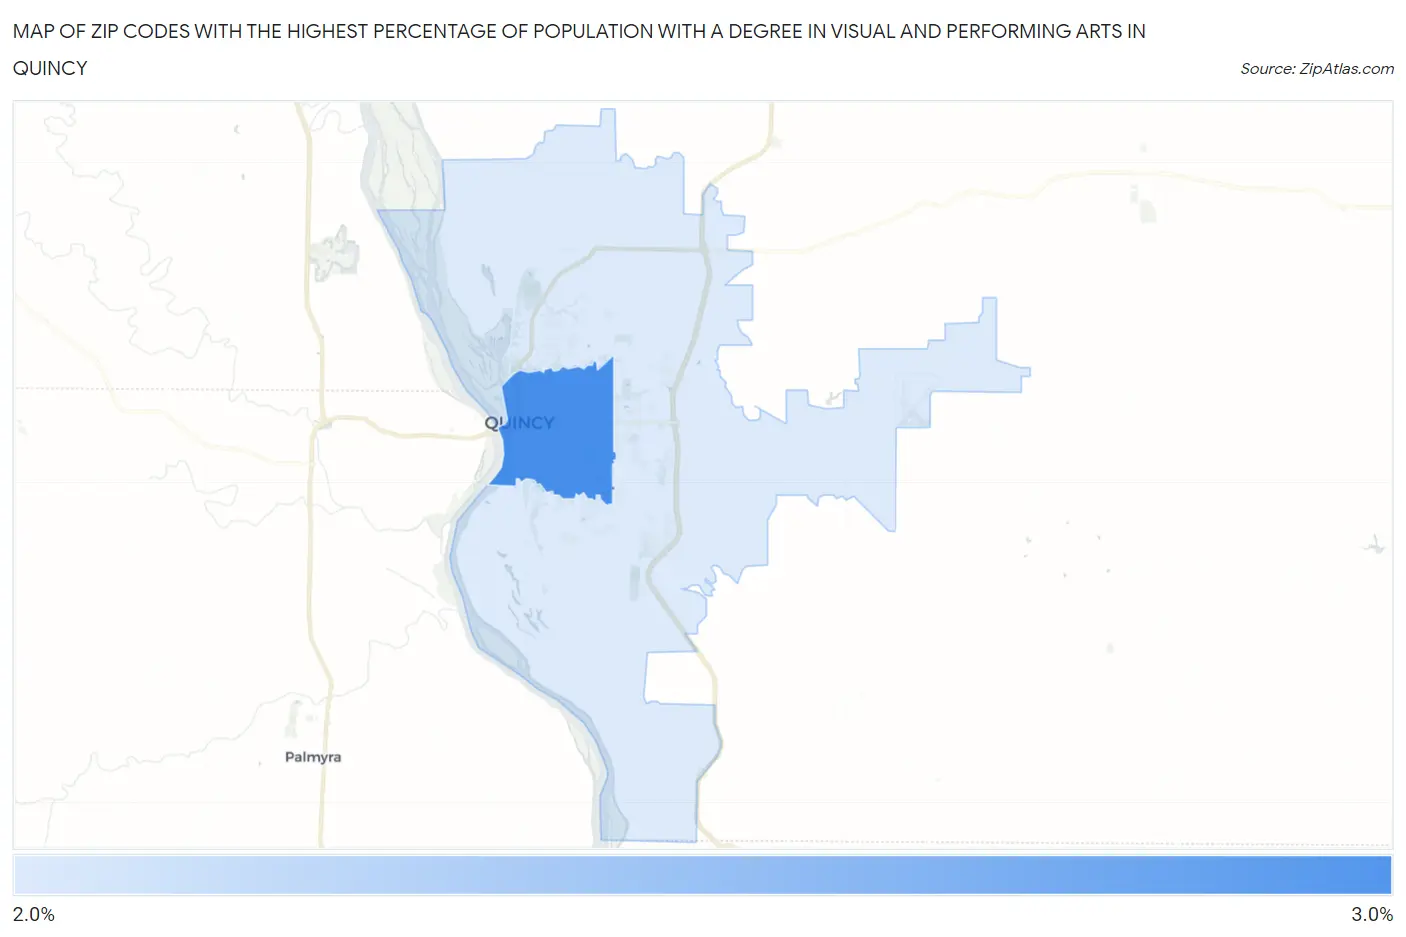
Map of Zip Codes with the Highest Percentage of Population with a Degree in Visual and Performing Arts in Quincy
2.7%
3.0%
Zip Codes with the Highest Percentage of Population with a Degree in Visual and Performing Arts in Quincy, IL
| Zip Code | % Graduates | vs State | vs National | |
| 1. | 62301 | 3.0% | 4.4%(-1.49)#526 | 4.3%(-1.30)#12,896 |
| 2. | 62305 | 2.7% | 4.4%(-1.78)#573 | 4.3%(-1.58)#14,001 |
1
Common Questions
What are the Top Zip Codes with the Highest Percentage of Population with a Degree in Visual and Performing Arts in Quincy, IL?
Top Zip Codes with the Highest Percentage of Population with a Degree in Visual and Performing Arts in Quincy, IL are:
What zip code has the Highest Percentage of Population with a Degree in Visual and Performing Arts in Quincy, IL?
62301 has the Highest Percentage of Population with a Degree in Visual and Performing Arts in Quincy, IL with 3.0%.
What is the Percentage of Population with a Degree in Visual and Performing Arts in Quincy, IL?
Percentage of Population with a Degree in Visual and Performing Arts in Quincy is 2.8%.
What is the Percentage of Population with a Degree in Visual and Performing Arts in Illinois?
Percentage of Population with a Degree in Visual and Performing Arts in Illinois is 4.4%.
What is the Percentage of Population with a Degree in Visual and Performing Arts in the United States?
Percentage of Population with a Degree in Visual and Performing Arts in the United States is 4.3%.