Zip Codes with the Highest Percentage of Population Employed in Accommodation & Food Services in Quincy, IL
RELATED REPORTS & OPTIONS
Accommodation & Food Services
Quincy
Compare Zip Codes
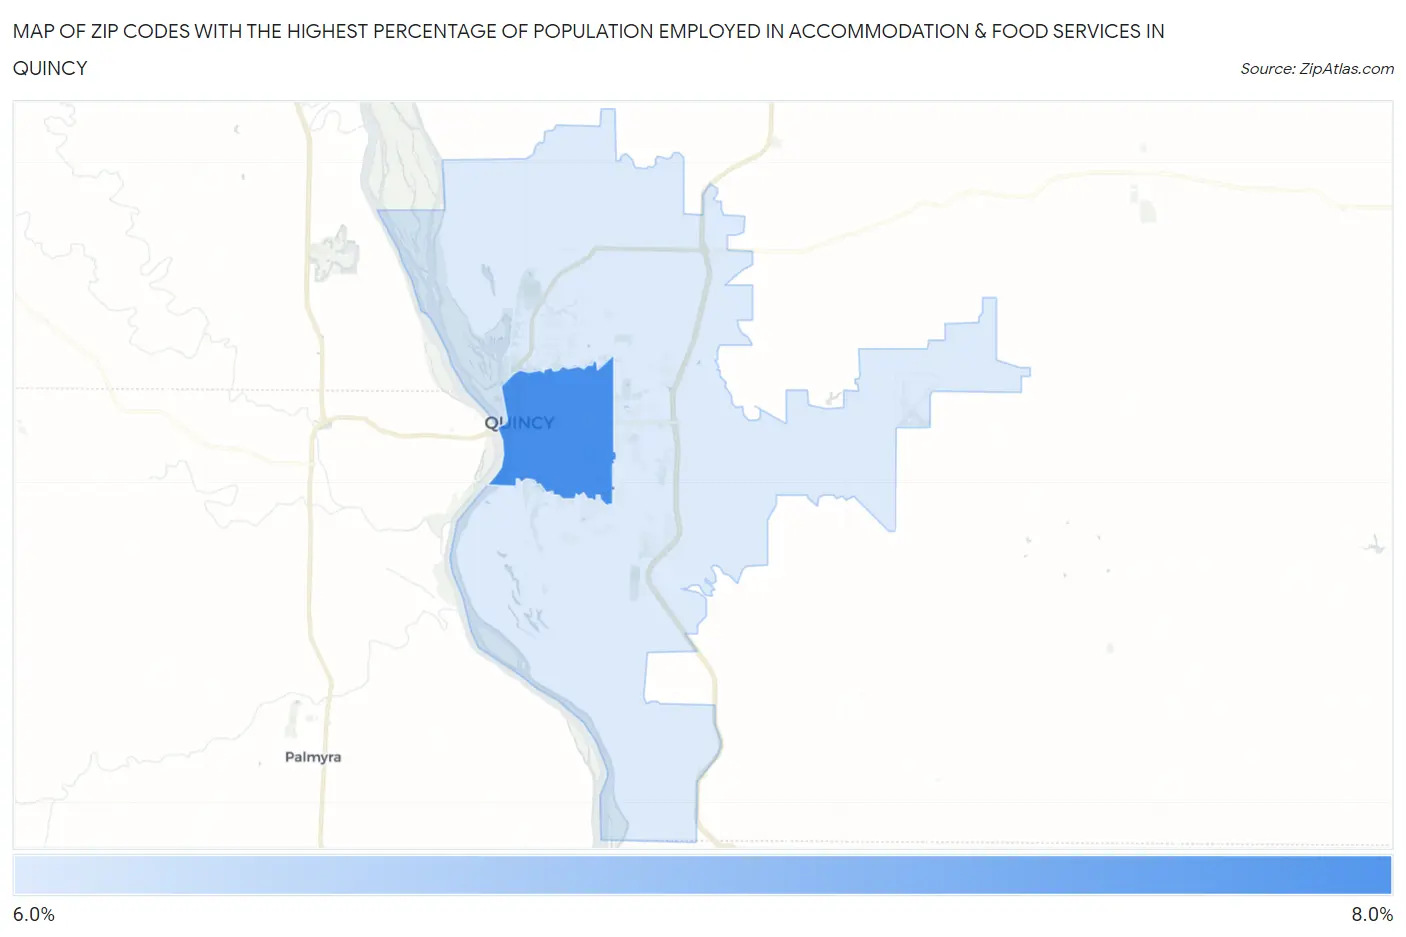
Map of Zip Codes with the Highest Percentage of Population Employed in Accommodation & Food Services in Quincy
6.9%
7.6%
Zip Codes with the Highest Percentage of Population Employed in Accommodation & Food Services in Quincy, IL
| Zip Code | % Employed | vs State | vs National | |
| 1. | 62301 | 7.6% | 6.5%(+1.14)#319 | 6.9%(+0.731)#8,721 |
| 2. | 62305 | 6.9% | 6.5%(+0.413)#390 | 6.9%(+0.001)#10,633 |
1
Common Questions
What are the Top Zip Codes with the Highest Percentage of Population Employed in Accommodation & Food Services in Quincy, IL?
Top Zip Codes with the Highest Percentage of Population Employed in Accommodation & Food Services in Quincy, IL are:
What zip code has the Highest Percentage of Population Employed in Accommodation & Food Services in Quincy, IL?
62301 has the Highest Percentage of Population Employed in Accommodation & Food Services in Quincy, IL with 7.6%.
What is the Percentage of Population Employed in Accommodation & Food Services in Quincy, IL?
Percentage of Population Employed in Accommodation & Food Services in Quincy is 7.5%.
What is the Percentage of Population Employed in Accommodation & Food Services in Illinois?
Percentage of Population Employed in Accommodation & Food Services in Illinois is 6.5%.
What is the Percentage of Population Employed in Accommodation & Food Services in the United States?
Percentage of Population Employed in Accommodation & Food Services in the United States is 6.9%.