Cities with the Highest Percentage of Population Employed in Agriculture, Fishing & Hunting in Iowa
RELATED REPORTS & OPTIONS
Agriculture, Fishing & Hunting
Iowa
Compare Cities
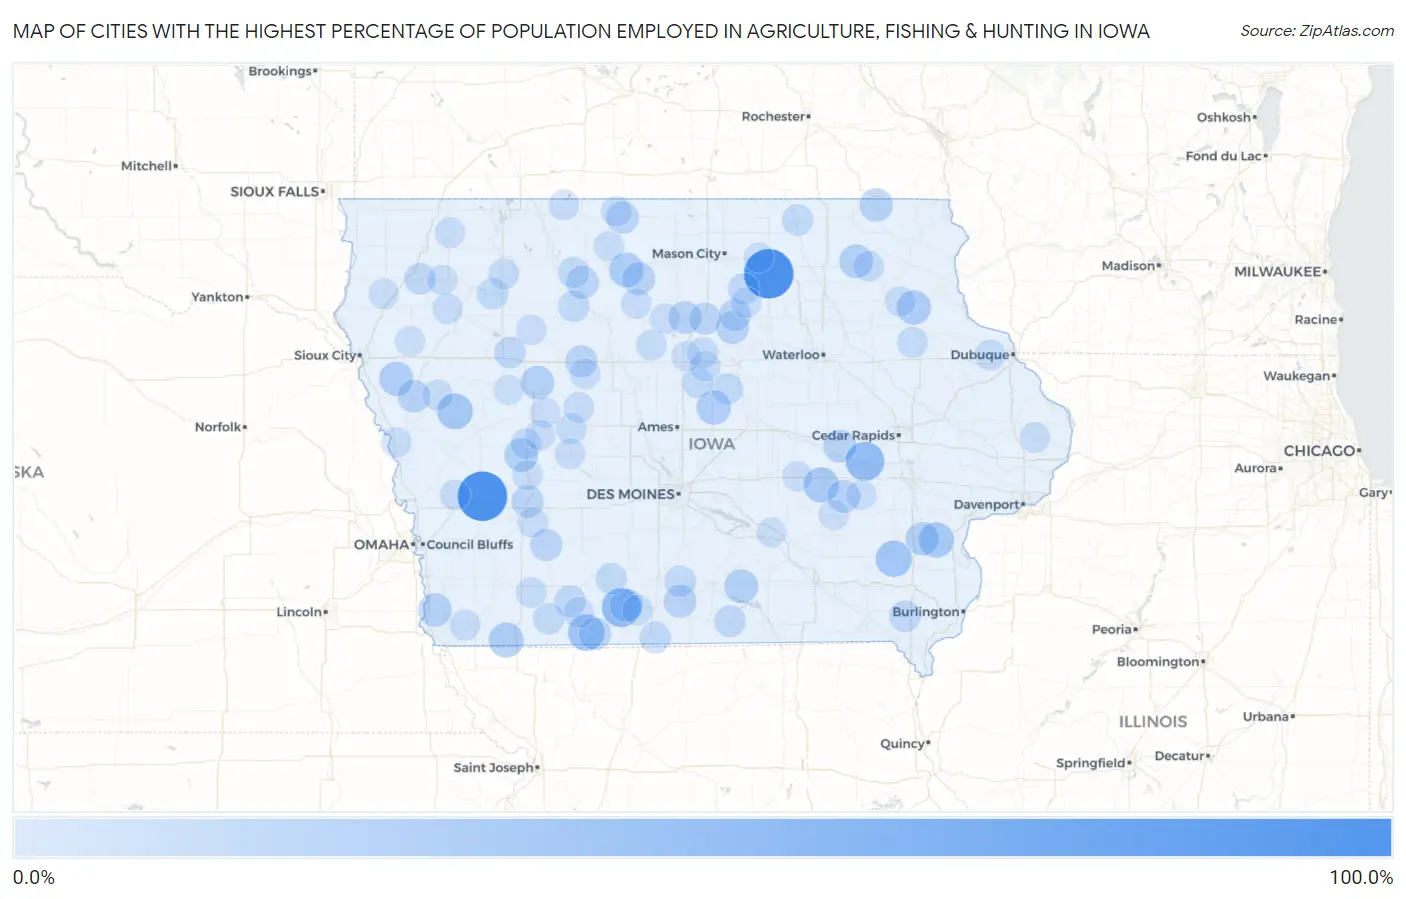
Map of Cities with the Highest Percentage of Population Employed in Agriculture, Fishing & Hunting in Iowa
0.0%
100.0%
Cities with the Highest Percentage of Population Employed in Agriculture, Fishing & Hunting in Iowa
| City | % Employed | vs State | vs National | |
| 1. | Roseville | 100.0% | 3.5%(+96.5)#1 | 1.2%(+98.8)#61 |
| 2. | Plainview | 100.0% | 3.5%(+96.5)#2 | 1.2%(+98.8)#64 |
| 3. | Corley | 100.0% | 3.5%(+96.5)#3 | 1.2%(+98.8)#72 |
| 4. | Ellston | 50.0% | 3.5%(+46.5)#4 | 1.2%(+48.8)#199 |
| 5. | West Amana | 48.8% | 3.5%(+45.3)#5 | 1.2%(+47.6)#215 |
| 6. | Maloy | 39.5% | 3.5%(+36.0)#6 | 1.2%(+38.3)#315 |
| 7. | Coppock | 37.5% | 3.5%(+34.0)#7 | 1.2%(+36.3)#346 |
| 8. | Ricketts | 35.3% | 3.5%(+31.8)#8 | 1.2%(+34.1)#383 |
| 9. | Guernsey | 33.3% | 3.5%(+29.8)#9 | 1.2%(+32.1)#421 |
| 10. | Fredonia | 32.9% | 3.5%(+29.4)#10 | 1.2%(+31.7)#442 |
| 11. | College Springs | 30.8% | 3.5%(+27.3)#11 | 1.2%(+29.6)#500 |
| 12. | St Benedict | 29.6% | 3.5%(+26.1)#12 | 1.2%(+28.4)#543 |
| 13. | Volga | 29.1% | 3.5%(+25.6)#13 | 1.2%(+27.9)#555 |
| 14. | Zearing | 29.0% | 3.5%(+25.5)#14 | 1.2%(+27.8)#559 |
| 15. | Climbing Hill | 28.0% | 3.5%(+24.5)#15 | 1.2%(+26.8)#597 |
| 16. | Melrose | 26.9% | 3.5%(+23.4)#16 | 1.2%(+25.7)#641 |
| 17. | Gray | 26.7% | 3.5%(+23.2)#17 | 1.2%(+25.5)#656 |
| 18. | Jackson Junction | 26.3% | 3.5%(+22.8)#18 | 1.2%(+25.1)#671 |
| 19. | Thurman | 25.3% | 3.5%(+21.8)#19 | 1.2%(+24.1)#707 |
| 20. | Cotter | 25.0% | 3.5%(+21.5)#20 | 1.2%(+23.8)#731 |
| 21. | Yetter | 25.0% | 3.5%(+21.5)#21 | 1.2%(+23.8)#732 |
| 22. | Burr Oak | 24.5% | 3.5%(+21.0)#22 | 1.2%(+23.3)#744 |
| 23. | Sun Valley Lake | 23.4% | 3.5%(+19.9)#23 | 1.2%(+22.2)#797 |
| 24. | Luzerne | 22.9% | 3.5%(+19.4)#24 | 1.2%(+21.7)#824 |
| 25. | Geneva | 22.7% | 3.5%(+19.2)#25 | 1.2%(+21.5)#829 |
| 26. | Corwith | 22.4% | 3.5%(+19.0)#26 | 1.2%(+21.2)#847 |
| 27. | Rowan | 22.2% | 3.5%(+18.7)#27 | 1.2%(+21.0)#859 |
| 28. | Le Roy | 22.2% | 3.5%(+18.7)#28 | 1.2%(+21.0)#870 |
| 29. | Smithland | 22.1% | 3.5%(+18.6)#29 | 1.2%(+20.9)#879 |
| 30. | Millersburg | 22.1% | 3.5%(+18.6)#30 | 1.2%(+20.9)#880 |
| 31. | West Bend | 21.5% | 3.5%(+18.0)#31 | 1.2%(+20.3)#903 |
| 32. | Lowell | 20.5% | 3.5%(+17.0)#32 | 1.2%(+19.3)#974 |
| 33. | Lakota | 20.3% | 3.5%(+16.8)#33 | 1.2%(+19.1)#983 |
| 34. | Brayton | 20.0% | 3.5%(+16.5)#34 | 1.2%(+18.8)#1,009 |
| 35. | Delphos | 20.0% | 3.5%(+16.5)#35 | 1.2%(+18.8)#1,018 |
| 36. | Knierim | 19.6% | 3.5%(+16.1)#36 | 1.2%(+18.4)#1,043 |
| 37. | Massena | 19.2% | 3.5%(+15.7)#37 | 1.2%(+18.0)#1,072 |
| 38. | Coulter | 18.9% | 3.5%(+15.5)#38 | 1.2%(+17.7)#1,091 |
| 39. | Hansell | 18.9% | 3.5%(+15.4)#39 | 1.2%(+17.7)#1,097 |
| 40. | Promise City | 17.2% | 3.5%(+13.7)#40 | 1.2%(+16.0)#1,239 |
| 41. | Lenox | 17.2% | 3.5%(+13.7)#41 | 1.2%(+16.0)#1,242 |
| 42. | Granville | 17.1% | 3.5%(+13.6)#42 | 1.2%(+15.9)#1,244 |
| 43. | Nemaha | 17.1% | 3.5%(+13.6)#43 | 1.2%(+15.9)#1,246 |
| 44. | Houghton | 17.1% | 3.5%(+13.6)#44 | 1.2%(+15.9)#1,249 |
| 45. | Oak Hills | 17.0% | 3.5%(+13.5)#45 | 1.2%(+15.8)#1,262 |
| 46. | Davis City | 16.8% | 3.5%(+13.3)#46 | 1.2%(+15.6)#1,278 |
| 47. | Woodburn | 16.7% | 3.5%(+13.2)#47 | 1.2%(+15.5)#1,292 |
| 48. | Linn Grove | 16.7% | 3.5%(+13.2)#48 | 1.2%(+15.5)#1,294 |
| 49. | Rolfe | 16.5% | 3.5%(+13.0)#49 | 1.2%(+15.3)#1,322 |
| 50. | Riceville | 16.5% | 3.5%(+13.0)#50 | 1.2%(+15.3)#1,326 |
| 51. | Afton | 16.3% | 3.5%(+12.8)#51 | 1.2%(+15.1)#1,337 |
| 52. | New Providence | 16.2% | 3.5%(+12.7)#52 | 1.2%(+15.0)#1,363 |
| 53. | Gravity | 16.1% | 3.5%(+12.6)#53 | 1.2%(+14.9)#1,367 |
| 54. | Dougherty | 15.8% | 3.5%(+12.3)#54 | 1.2%(+14.6)#1,397 |
| 55. | Rodman | 15.4% | 3.5%(+11.9)#55 | 1.2%(+14.2)#1,449 |
| 56. | Radcliffe | 15.1% | 3.5%(+11.6)#56 | 1.2%(+13.9)#1,470 |
| 57. | Dundee | 14.3% | 3.5%(+10.8)#57 | 1.2%(+13.1)#1,567 |
| 58. | Alden | 14.0% | 3.5%(+10.5)#58 | 1.2%(+12.8)#1,603 |
| 59. | Greenville | 13.9% | 3.5%(+10.4)#59 | 1.2%(+12.7)#1,623 |
| 60. | Nodaway | 13.6% | 3.5%(+10.1)#60 | 1.2%(+12.4)#1,651 |
| 61. | Scranton | 13.6% | 3.5%(+10.1)#61 | 1.2%(+12.4)#1,664 |
| 62. | Woolstock | 13.5% | 3.5%(+9.99)#62 | 1.2%(+12.3)#1,674 |
| 63. | Farragut | 13.5% | 3.5%(+9.97)#63 | 1.2%(+12.3)#1,676 |
| 64. | Persia | 13.4% | 3.5%(+9.93)#64 | 1.2%(+12.2)#1,681 |
| 65. | St Lucas | 13.3% | 3.5%(+9.84)#65 | 1.2%(+12.1)#1,695 |
| 66. | Dolliver | 13.3% | 3.5%(+9.84)#66 | 1.2%(+12.1)#1,696 |
| 67. | Danbury | 13.1% | 3.5%(+9.64)#67 | 1.2%(+11.9)#1,730 |
| 68. | Templeton | 13.1% | 3.5%(+9.59)#68 | 1.2%(+11.9)#1,736 |
| 69. | Ledyard | 13.0% | 3.5%(+9.55)#69 | 1.2%(+11.8)#1,747 |
| 70. | Graf | 13.0% | 3.5%(+9.55)#70 | 1.2%(+11.8)#1,750 |
| 71. | Churdan | 12.9% | 3.5%(+9.42)#71 | 1.2%(+11.7)#1,765 |
| 72. | Charlotte | 12.7% | 3.5%(+9.19)#72 | 1.2%(+11.5)#1,796 |
| 73. | Somers | 12.5% | 3.5%(+9.01)#73 | 1.2%(+11.3)#1,832 |
| 74. | Meriden | 12.5% | 3.5%(+9.01)#74 | 1.2%(+11.3)#1,833 |
| 75. | Aredale | 12.5% | 3.5%(+9.01)#75 | 1.2%(+11.3)#1,839 |
| 76. | Melvin | 12.4% | 3.5%(+8.92)#76 | 1.2%(+11.2)#1,851 |
| 77. | Clarion | 12.3% | 3.5%(+8.80)#77 | 1.2%(+11.1)#1,873 |
| 78. | Audubon | 12.3% | 3.5%(+8.80)#78 | 1.2%(+11.1)#1,878 |
| 79. | Buckeye | 12.2% | 3.5%(+8.70)#79 | 1.2%(+11.0)#1,891 |
| 80. | Clearfield | 12.2% | 3.5%(+8.69)#80 | 1.2%(+11.0)#1,893 |
| 81. | Renwick | 12.0% | 3.5%(+8.55)#81 | 1.2%(+10.8)#1,908 |
| 82. | Lidderdale | 12.0% | 3.5%(+8.55)#82 | 1.2%(+10.8)#1,909 |
| 83. | Willey | 11.9% | 3.5%(+8.45)#83 | 1.2%(+10.7)#1,928 |
| 84. | Bayard | 11.9% | 3.5%(+8.40)#84 | 1.2%(+10.7)#1,937 |
| 85. | Malcom | 11.9% | 3.5%(+8.39)#85 | 1.2%(+10.7)#1,940 |
| 86. | Paullina | 11.9% | 3.5%(+8.38)#86 | 1.2%(+10.7)#1,941 |
| 87. | Wadena | 11.8% | 3.5%(+8.35)#87 | 1.2%(+10.6)#1,946 |
| 88. | Blencoe | 11.8% | 3.5%(+8.32)#88 | 1.2%(+10.6)#1,951 |
| 89. | Wiota | 11.8% | 3.5%(+8.27)#89 | 1.2%(+10.6)#1,965 |
| 90. | Struble | 11.8% | 3.5%(+8.27)#90 | 1.2%(+10.6)#1,966 |
| 91. | Varina | 11.8% | 3.5%(+8.27)#91 | 1.2%(+10.6)#1,969 |
| 92. | Parnell | 11.7% | 3.5%(+8.23)#92 | 1.2%(+10.5)#1,975 |
| 93. | Grand River | 11.6% | 3.5%(+8.10)#93 | 1.2%(+10.4)#2,005 |
| 94. | Burt | 11.3% | 3.5%(+7.77)#94 | 1.2%(+10.1)#2,078 |
| 95. | Kingsley | 11.1% | 3.5%(+7.57)#95 | 1.2%(+9.87)#2,137 |
| 96. | Williams | 10.8% | 3.5%(+7.34)#96 | 1.2%(+9.64)#2,192 |
| 97. | Leighton | 10.7% | 3.5%(+7.22)#97 | 1.2%(+9.51)#2,229 |
| 98. | Wall Lake | 10.5% | 3.5%(+7.05)#98 | 1.2%(+9.34)#2,267 |
| 99. | Rudd | 10.5% | 3.5%(+6.96)#99 | 1.2%(+9.25)#2,290 |
| 100. | Keswick | 10.3% | 3.5%(+6.85)#100 | 1.2%(+9.15)#2,328 |
Common Questions
What are the Top 10 Cities with the Highest Percentage of Population Employed in Agriculture, Fishing & Hunting in Iowa?
Top 10 Cities with the Highest Percentage of Population Employed in Agriculture, Fishing & Hunting in Iowa are:
#1
100.0%
#2
100.0%
#3
50.0%
#4
48.8%
#5
39.5%
#6
37.5%
#7
35.3%
#8
33.3%
#9
32.9%
#10
30.8%
What city has the Highest Percentage of Population Employed in Agriculture, Fishing & Hunting in Iowa?
Roseville has the Highest Percentage of Population Employed in Agriculture, Fishing & Hunting in Iowa with 100.0%.
What is the Percentage of Population Employed in Agriculture, Fishing & Hunting in the State of Iowa?
Percentage of Population Employed in Agriculture, Fishing & Hunting in Iowa is 3.5%.
What is the Percentage of Population Employed in Agriculture, Fishing & Hunting in the United States?
Percentage of Population Employed in Agriculture, Fishing & Hunting in the United States is 1.2%.