Massena, IA Map & Demographics
Massena Map
Massena Overview
$31,202
PER CAPITA INCOME
$82,000
AVG FAMILY INCOME
$63,393
AVG HOUSEHOLD INCOME
0.8%
WAGE / INCOME GAP [ % ]
99.2¢/ $1
WAGE / INCOME GAP [ $ ]
0.40
INEQUALITY / GINI INDEX
390
TOTAL POPULATION
181
MALE POPULATION
209
FEMALE POPULATION
86.60
MALES / 100 FEMALES
115.47
FEMALES / 100 MALES
33.9
MEDIAN AGE
3.3
AVG FAMILY SIZE
2.5
AVG HOUSEHOLD SIZE
187
LABOR FORCE [ PEOPLE ]
60.3%
PERCENT IN LABOR FORCE
5.3%
UNEMPLOYMENT RATE
Massena Zip Codes
Massena Area Codes
Income in Massena
Income Overview in Massena
Per Capita Income in Massena is $31,202, while median incomes of families and households are $82,000 and $63,393 respectively.
| Characteristic | Number | Measure |
| Per Capita Income | 390 | $31,202 |
| Median Family Income | 100 | $82,000 |
| Mean Family Income | 100 | $98,160 |
| Median Household Income | 159 | $63,393 |
| Mean Household Income | 159 | $73,217 |
| Income Deficit | 100 | $0 |
| Wage / Income Gap (%) | 390 | 0.83% |
| Wage / Income Gap ($) | 390 | 99.17¢ per $1 |
| Gini / Inequality Index | 390 | 0.40 |
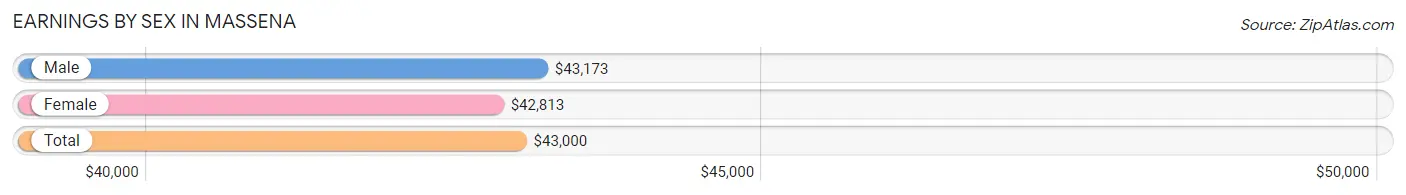
Earnings by Sex in Massena
Average Earnings in Massena are $43,000, $43,173 for men and $42,813 for women, a difference of 0.8%.
| Sex | Number | Average Earnings |
| Male | 135 (60.8%) | $43,173 |
| Female | 87 (39.2%) | $42,813 |
| Total | 222 (100.0%) | $43,000 |
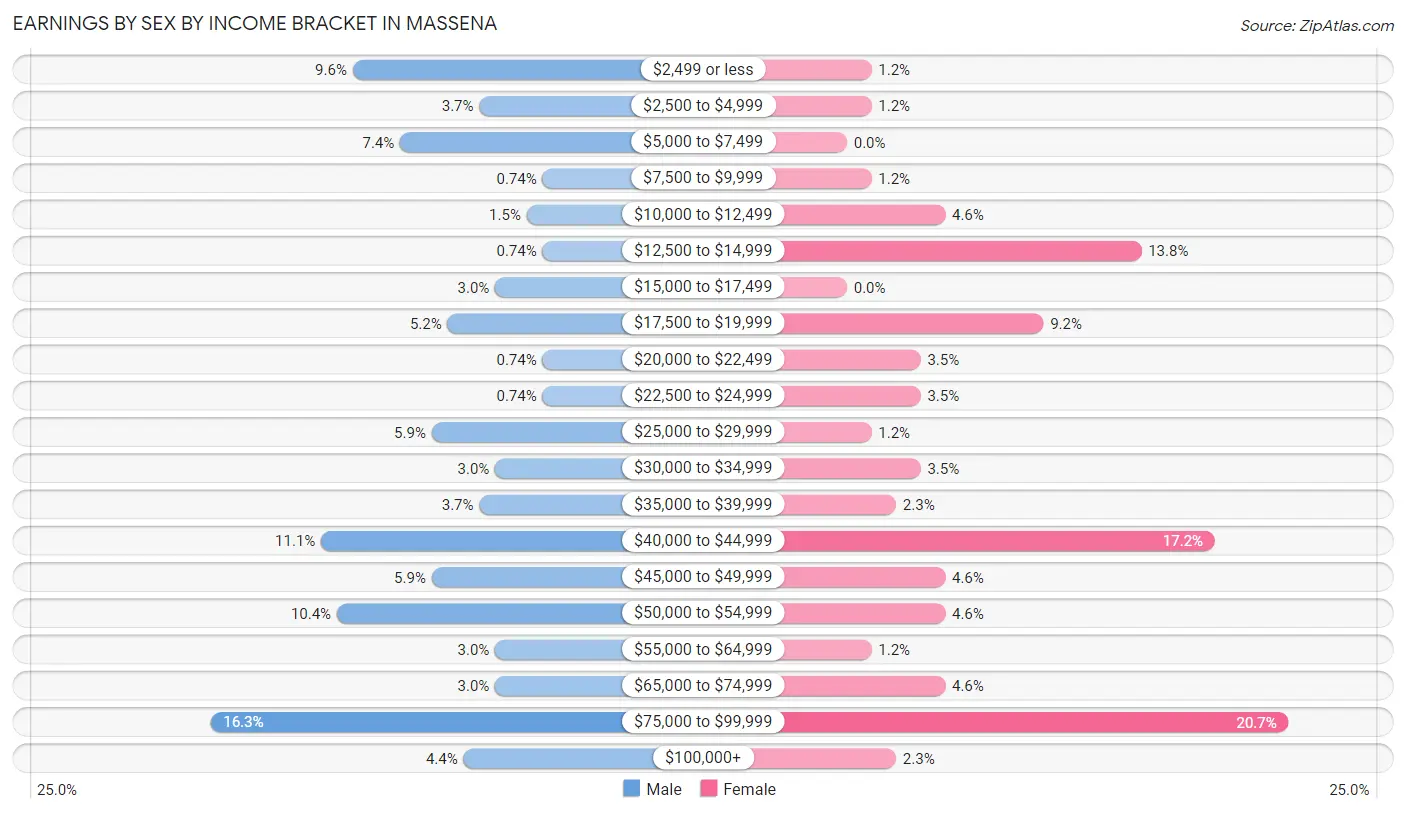
Earnings by Sex by Income Bracket in Massena
The most common earnings brackets in Massena are $75,000 to $99,999 for men (22 | 16.3%) and $75,000 to $99,999 for women (18 | 20.7%).
| Income | Male | Female |
| $2,499 or less | 13 (9.6%) | 1 (1.1%) |
| $2,500 to $4,999 | 5 (3.7%) | 1 (1.1%) |
| $5,000 to $7,499 | 10 (7.4%) | 0 (0.0%) |
| $7,500 to $9,999 | 1 (0.7%) | 1 (1.1%) |
| $10,000 to $12,499 | 2 (1.5%) | 4 (4.6%) |
| $12,500 to $14,999 | 1 (0.7%) | 12 (13.8%) |
| $15,000 to $17,499 | 4 (3.0%) | 0 (0.0%) |
| $17,500 to $19,999 | 7 (5.2%) | 8 (9.2%) |
| $20,000 to $22,499 | 1 (0.7%) | 3 (3.5%) |
| $22,500 to $24,999 | 1 (0.7%) | 3 (3.5%) |
| $25,000 to $29,999 | 8 (5.9%) | 1 (1.1%) |
| $30,000 to $34,999 | 4 (3.0%) | 3 (3.5%) |
| $35,000 to $39,999 | 5 (3.7%) | 2 (2.3%) |
| $40,000 to $44,999 | 15 (11.1%) | 15 (17.2%) |
| $45,000 to $49,999 | 8 (5.9%) | 4 (4.6%) |
| $50,000 to $54,999 | 14 (10.4%) | 4 (4.6%) |
| $55,000 to $64,999 | 4 (3.0%) | 1 (1.1%) |
| $65,000 to $74,999 | 4 (3.0%) | 4 (4.6%) |
| $75,000 to $99,999 | 22 (16.3%) | 18 (20.7%) |
| $100,000+ | 6 (4.4%) | 2 (2.3%) |
| Total | 135 (100.0%) | 87 (100.0%) |
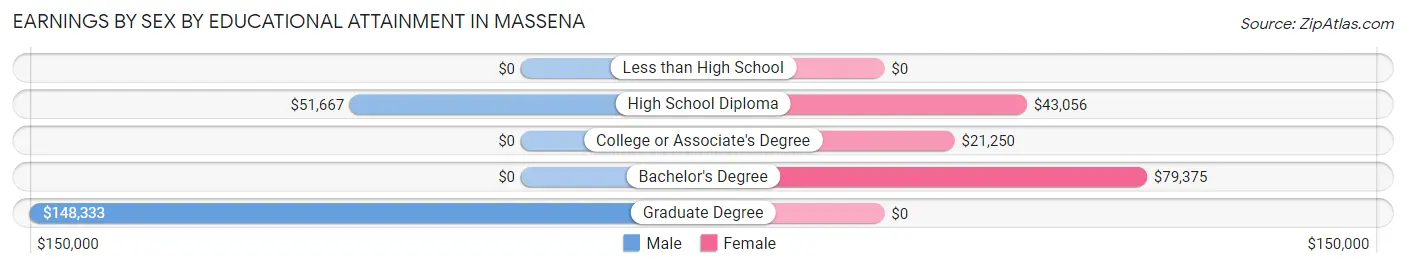
Earnings by Sex by Educational Attainment in Massena
Average earnings in Massena are $44,615 for men and $44,028 for women, a difference of 1.3%. Men with an educational attainment of graduate degree enjoy the highest average annual earnings of $148,333, while those with high school diploma education earn the least with $51,667. Women with an educational attainment of bachelor's degree earn the most with the average annual earnings of $79,375, while those with college or associate's degree education have the smallest earnings of $21,250.
| Educational Attainment | Male Income | Female Income |
| Less than High School | - | - |
| High School Diploma | $51,667 | $43,056 |
| College or Associate's Degree | - | - |
| Bachelor's Degree | - | - |
| Graduate Degree | $148,333 | $0 |
| Total | $44,615 | $44,028 |
Family Income in Massena
Family Income Brackets in Massena
According to the Massena family income data, there are 26 families falling into the $75,000 to $99,999 income range, which is the most common income bracket and makes up 26.0% of all families.
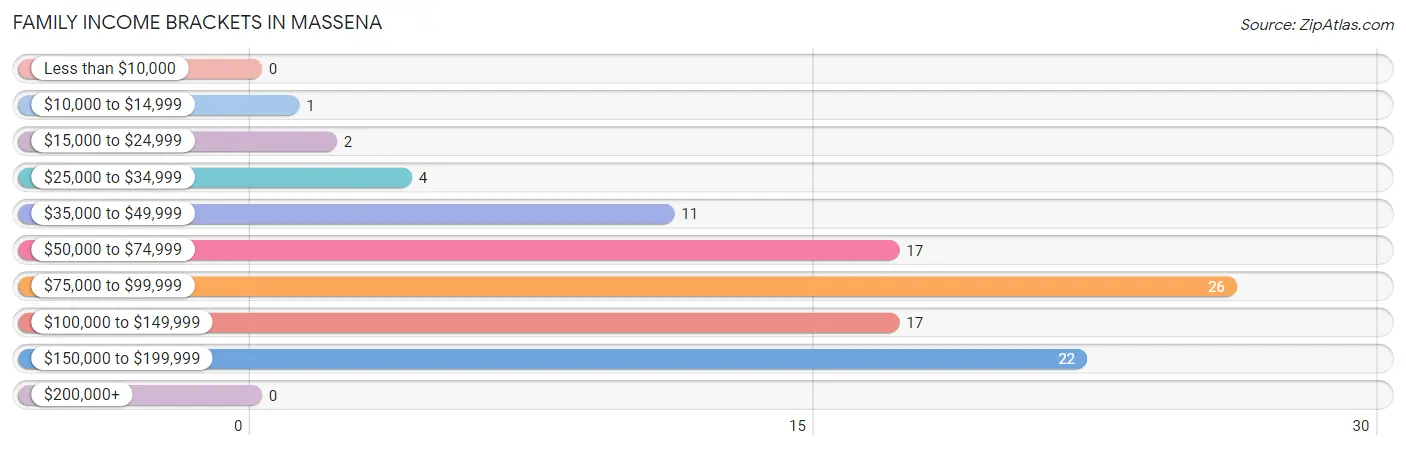
| Income Bracket | # Families | % Families |
| Less than $10,000 | 0 | 0.0% |
| $10,000 to $14,999 | 1 | 1.0% |
| $15,000 to $24,999 | 2 | 2.0% |
| $25,000 to $34,999 | 4 | 4.0% |
| $35,000 to $49,999 | 11 | 11.0% |
| $50,000 to $74,999 | 17 | 17.0% |
| $75,000 to $99,999 | 26 | 26.0% |
| $100,000 to $149,999 | 17 | 17.0% |
| $150,000 to $199,999 | 22 | 22.0% |
| $200,000+ | 0 | 0.0% |
Family Income by Famaliy Size in Massena
4-person families (22 | 22.0%) account for the highest median family income in Massena with $170,385 per family, while 4-person families (22 | 22.0%) have the highest median income of $42,596 per family member.
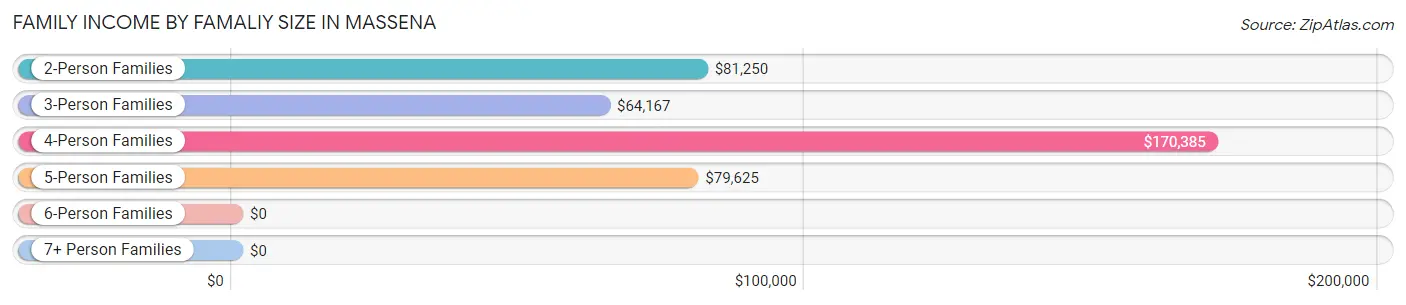
| Income Bracket | # Families | Median Income |
| 2-Person Families | 41 (41.0%) | $81,250 |
| 3-Person Families | 18 (18.0%) | $64,167 |
| 4-Person Families | 22 (22.0%) | $170,385 |
| 5-Person Families | 17 (17.0%) | $79,625 |
| 6-Person Families | 2 (2.0%) | $0 |
| 7+ Person Families | 0 (0.0%) | $0 |
| Total | 100 (100.0%) | $82,000 |
Family Income by Number of Earners in Massena
The median family income in Massena is $82,000, with families comprising 2 earners (50) having the highest median family income of $130,682, while families with no earners (6) have the lowest median family income of $47,500, accounting for 50.0% and 6.0% of families, respectively.
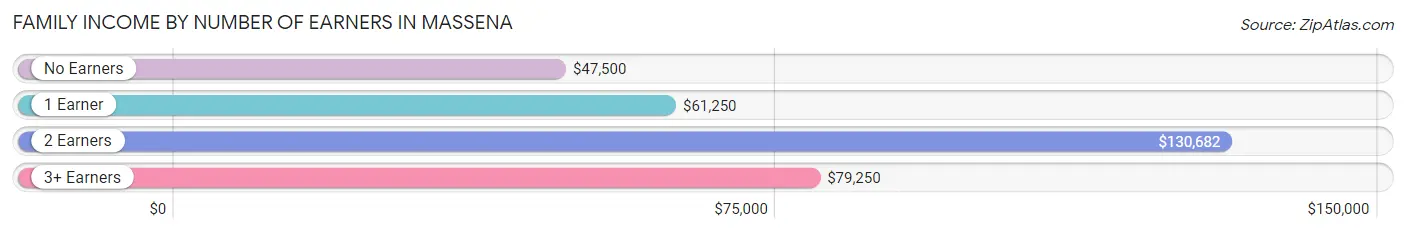
| Number of Earners | # Families | Median Income |
| No Earners | 6 (6.0%) | $47,500 |
| 1 Earner | 30 (30.0%) | $61,250 |
| 2 Earners | 50 (50.0%) | $130,682 |
| 3+ Earners | 14 (14.0%) | $79,250 |
| Total | 100 (100.0%) | $82,000 |
Household Income in Massena
Household Income Brackets in Massena
With 28 households falling in the category, the $75,000 to $99,999 income range is the most frequent in Massena, accounting for 17.6% of all households.
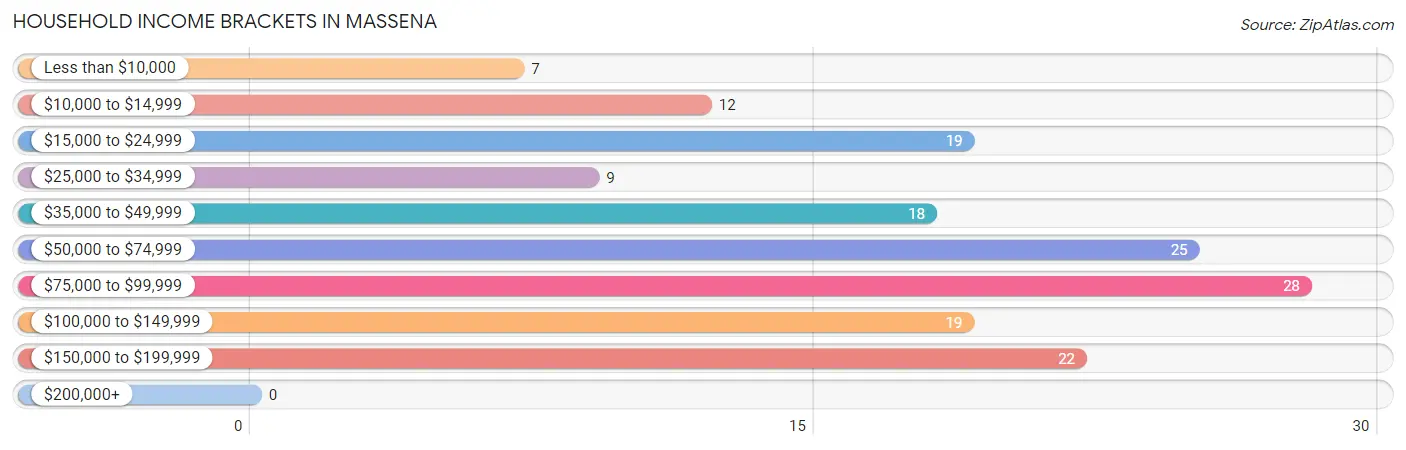
| Income Bracket | # Households | % Households |
| Less than $10,000 | 7 | 4.4% |
| $10,000 to $14,999 | 12 | 7.5% |
| $15,000 to $24,999 | 19 | 11.9% |
| $25,000 to $34,999 | 9 | 5.7% |
| $35,000 to $49,999 | 18 | 11.3% |
| $50,000 to $74,999 | 25 | 15.7% |
| $75,000 to $99,999 | 28 | 17.6% |
| $100,000 to $149,999 | 19 | 11.9% |
| $150,000 to $199,999 | 22 | 13.8% |
| $200,000+ | 0 | 0.0% |
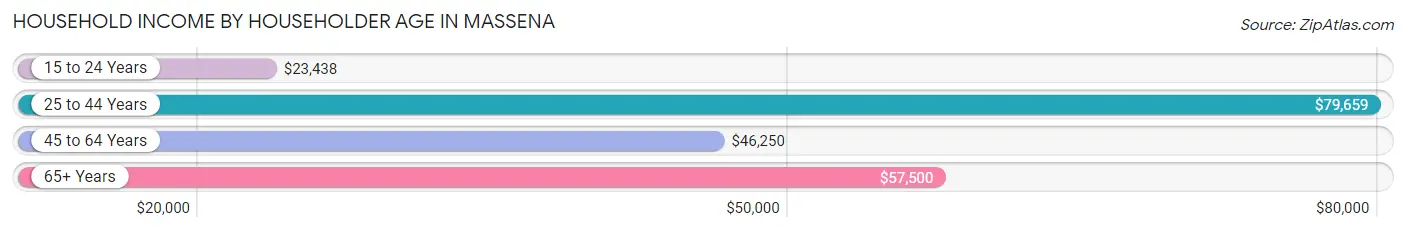
Household Income by Householder Age in Massena
The median household income in Massena is $63,393, with the highest median household income of $79,659 found in the 25 to 44 years age bracket for the primary householder. A total of 57 households (35.8%) fall into this category. Meanwhile, the 15 to 24 years age bracket for the primary householder has the lowest median household income of $23,438, with 16 households (10.1%) in this group.
| Income Bracket | # Households | Median Income |
| 15 to 24 Years | 16 (10.1%) | $23,438 |
| 25 to 44 Years | 57 (35.8%) | $79,659 |
| 45 to 64 Years | 46 (28.9%) | $46,250 |
| 65+ Years | 40 (25.2%) | $57,500 |
| Total | 159 (100.0%) | $63,393 |
Poverty in Massena
Income Below Poverty by Sex and Age in Massena
With 6.1% poverty level for males and 5.7% for females among the residents of Massena, 45 to 54 year old males and 75 year old and over females are the most vulnerable to poverty, with 6 males (22.2%) and 3 females (23.1%) in their respective age groups living below the poverty level.
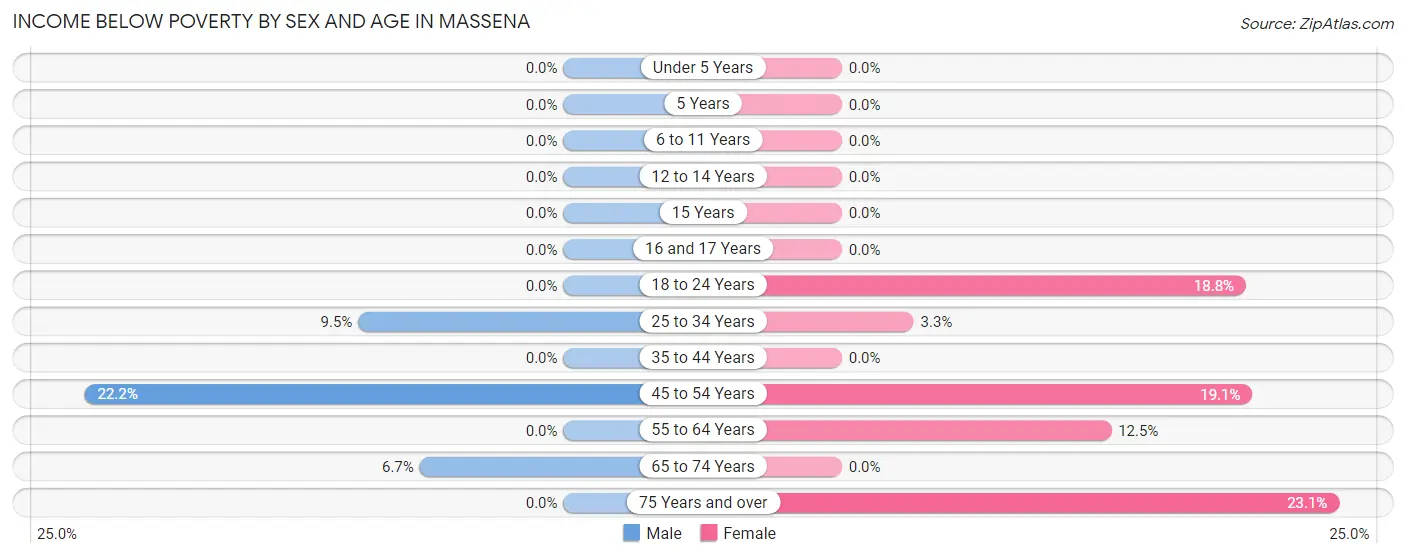
| Age Bracket | Male | Female |
| Under 5 Years | 0 (0.0%) | 0 (0.0%) |
| 5 Years | 0 (0.0%) | 0 (0.0%) |
| 6 to 11 Years | 0 (0.0%) | 0 (0.0%) |
| 12 to 14 Years | 0 (0.0%) | 0 (0.0%) |
| 15 Years | 0 (0.0%) | 0 (0.0%) |
| 16 and 17 Years | 0 (0.0%) | 0 (0.0%) |
| 18 to 24 Years | 0 (0.0%) | 3 (18.8%) |
| 25 to 34 Years | 4 (9.5%) | 1 (3.3%) |
| 35 to 44 Years | 0 (0.0%) | 0 (0.0%) |
| 45 to 54 Years | 6 (22.2%) | 4 (19.1%) |
| 55 to 64 Years | 0 (0.0%) | 1 (12.5%) |
| 65 to 74 Years | 1 (6.7%) | 0 (0.0%) |
| 75 Years and over | 0 (0.0%) | 3 (23.1%) |
| Total | 11 (6.1%) | 12 (5.7%) |
Income Above Poverty by Sex and Age in Massena
According to the poverty statistics in Massena, males aged under 5 years and females aged under 5 years are the age groups that are most secure financially, with 100.0% of males and 100.0% of females in these age groups living above the poverty line.
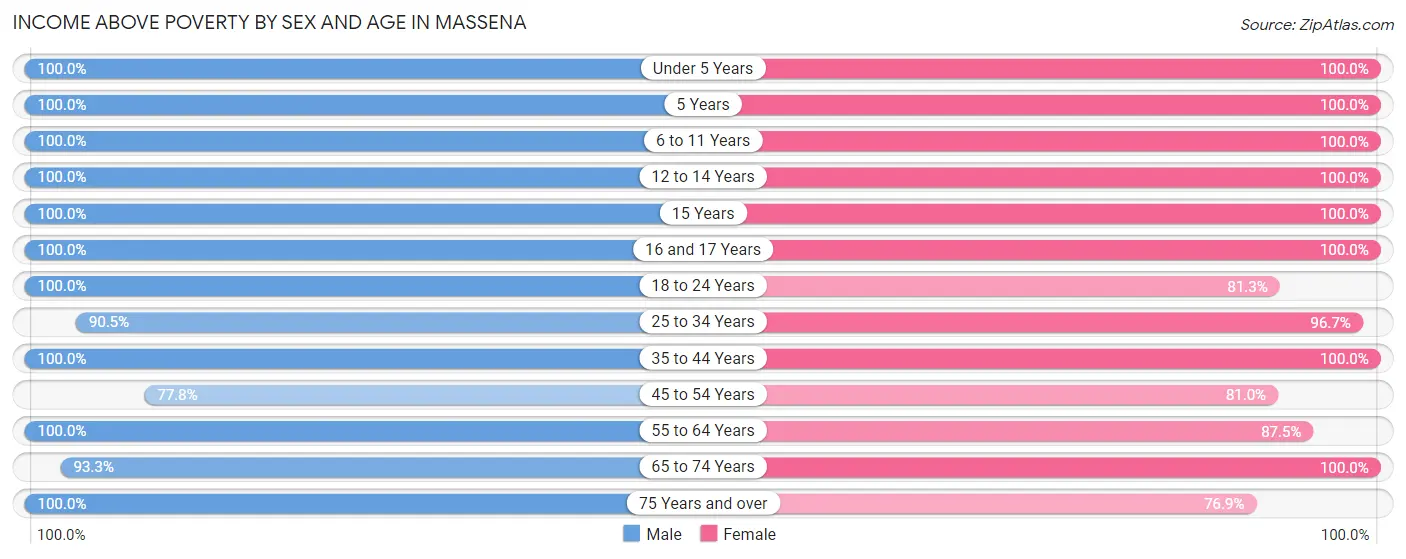
| Age Bracket | Male | Female |
| Under 5 Years | 11 (100.0%) | 20 (100.0%) |
| 5 Years | 2 (100.0%) | 2 (100.0%) |
| 6 to 11 Years | 10 (100.0%) | 7 (100.0%) |
| 12 to 14 Years | 8 (100.0%) | 17 (100.0%) |
| 15 Years | 1 (100.0%) | 2 (100.0%) |
| 16 and 17 Years | 4 (100.0%) | 15 (100.0%) |
| 18 to 24 Years | 11 (100.0%) | 13 (81.2%) |
| 25 to 34 Years | 38 (90.5%) | 29 (96.7%) |
| 35 to 44 Years | 23 (100.0%) | 21 (100.0%) |
| 45 to 54 Years | 21 (77.8%) | 17 (80.9%) |
| 55 to 64 Years | 15 (100.0%) | 7 (87.5%) |
| 65 to 74 Years | 14 (93.3%) | 37 (100.0%) |
| 75 Years and over | 12 (100.0%) | 10 (76.9%) |
| Total | 170 (93.9%) | 197 (94.3%) |
Income Below Poverty Among Married-Couple Families in Massena
The poverty statistics for married-couple families in Massena show that 1.1% or 1 of the total 92 families live below the poverty line. Families with no children have the highest poverty rate of 2.5%, comprising of 1 families. On the other hand, families with 1 or 2 children have the lowest poverty rate of 0.0%, which includes 0 families.
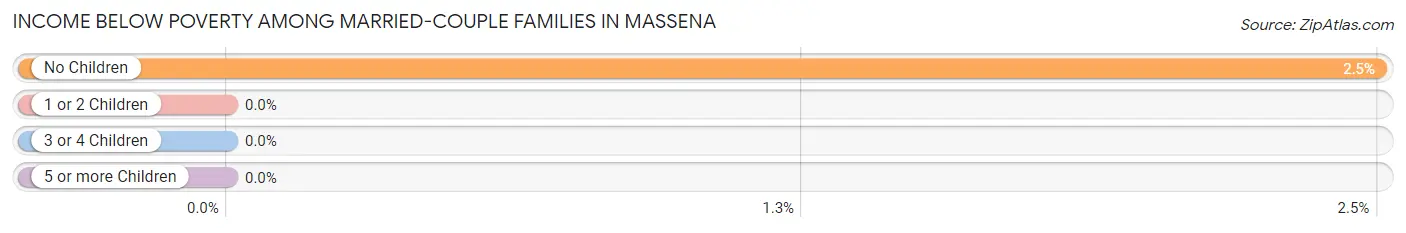
| Children | Above Poverty | Below Poverty |
| No Children | 39 (97.5%) | 1 (2.5%) |
| 1 or 2 Children | 43 (100.0%) | 0 (0.0%) |
| 3 or 4 Children | 9 (100.0%) | 0 (0.0%) |
| 5 or more Children | 0 (0.0%) | 0 (0.0%) |
| Total | 91 (98.9%) | 1 (1.1%) |
Income Below Poverty Among Single-Parent Households in Massena
| Children | Single Father | Single Mother |
| No Children | 0 (0.0%) | 0 (0.0%) |
| 1 or 2 Children | 0 (0.0%) | 0 (0.0%) |
| 3 or 4 Children | 0 (0.0%) | 0 (0.0%) |
| 5 or more Children | 0 (0.0%) | 0 (0.0%) |
| Total | 0 (0.0%) | 0 (0.0%) |
Income Below Poverty Among Married-Couple vs Single-Parent Households in Massena
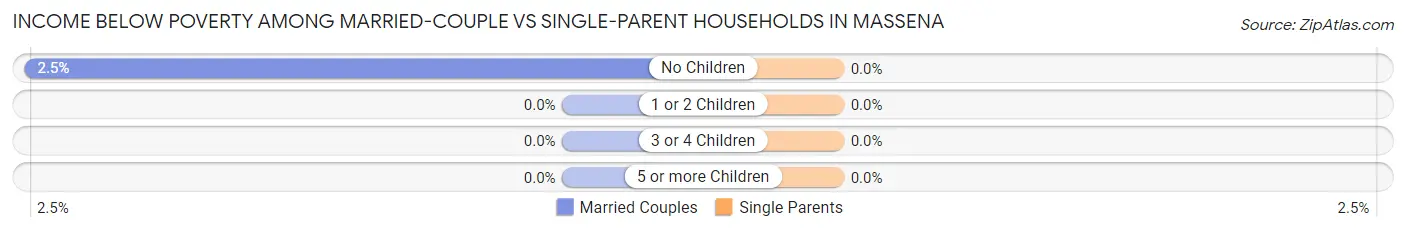
| Children | Married-Couple Families | Single-Parent Households |
| No Children | 1 (2.5%) | 0 (0.0%) |
| 1 or 2 Children | 0 (0.0%) | 0 (0.0%) |
| 3 or 4 Children | 0 (0.0%) | 0 (0.0%) |
| 5 or more Children | 0 (0.0%) | 0 (0.0%) |
| Total | 1 (1.1%) | 0 (0.0%) |
Race in Massena
The most populous races in Massena are White / Caucasian (352 | 90.3%), Hispanic or Latino (27 | 6.9%), and Some other Race (27 | 6.9%).
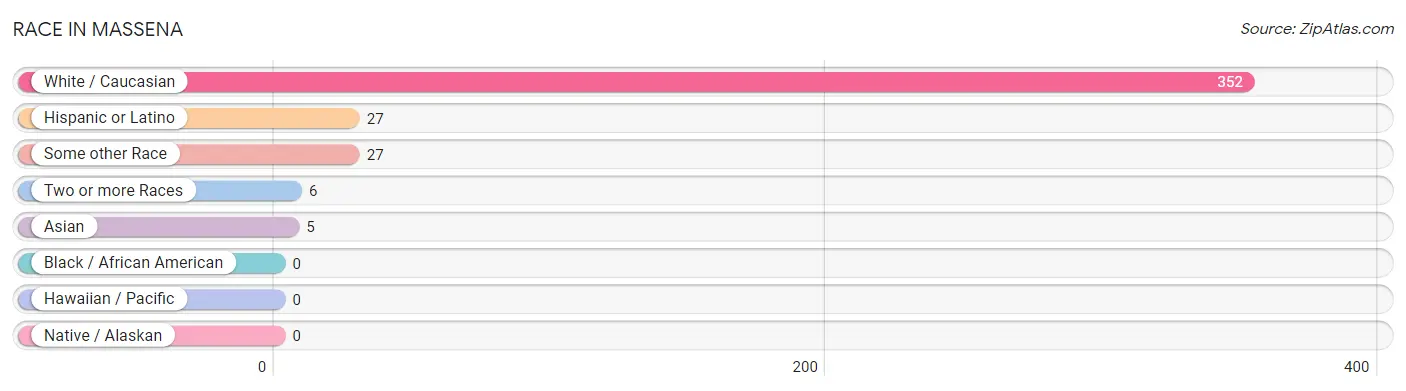
| Race | # Population | % Population |
| Asian | 5 | 1.3% |
| Black / African American | 0 | 0.0% |
| Hawaiian / Pacific | 0 | 0.0% |
| Hispanic or Latino | 27 | 6.9% |
| Native / Alaskan | 0 | 0.0% |
| White / Caucasian | 352 | 90.3% |
| Two or more Races | 6 | 1.5% |
| Some other Race | 27 | 6.9% |
| Total | 390 | 100.0% |
Ancestry in Massena
The most populous ancestries reported in Massena are German (127 | 32.6%), Irish (57 | 14.6%), English (50 | 12.8%), Italian (47 | 12.0%), and Mexican (27 | 6.9%), together accounting for 79.0% of all Massena residents.
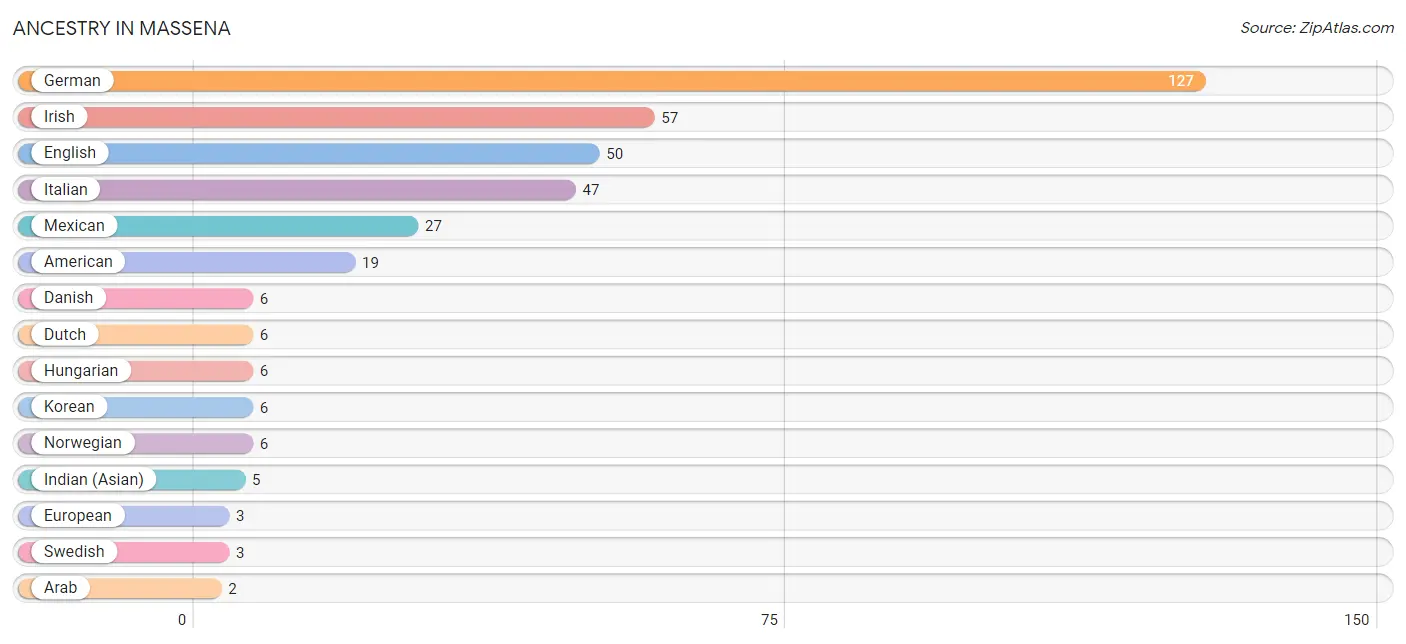
| Ancestry | # Population | % Population |
| American | 19 | 4.9% |
| Arab | 2 | 0.5% |
| Czech | 1 | 0.3% |
| Danish | 6 | 1.5% |
| Dutch | 6 | 1.5% |
| English | 50 | 12.8% |
| European | 3 | 0.8% |
| French | 2 | 0.5% |
| German | 127 | 32.6% |
| Hungarian | 6 | 1.5% |
| Indian (Asian) | 5 | 1.3% |
| Irish | 57 | 14.6% |
| Italian | 47 | 12.0% |
| Korean | 6 | 1.5% |
| Luxembourger | 2 | 0.5% |
| Mexican | 27 | 6.9% |
| Norwegian | 6 | 1.5% |
| Pennsylvania German | 1 | 0.3% |
| Polish | 1 | 0.3% |
| Portuguese | 1 | 0.3% |
| Scandinavian | 1 | 0.3% |
| Scottish | 2 | 0.5% |
| Swedish | 3 | 0.8% |
| Swiss | 1 | 0.3% | View All 24 Rows |
Immigrants in Massena
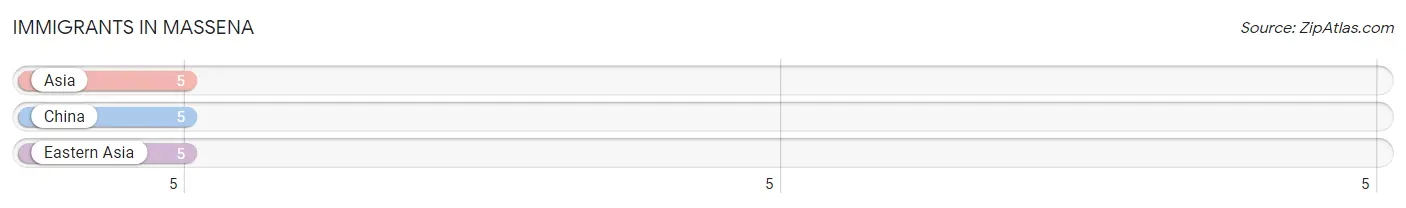
The most numerous immigrant groups reported in Massena came from Asia (5 | 1.3%), China (5 | 1.3%), and Eastern Asia (5 | 1.3%), together accounting for 3.8% of all Massena residents.
| Immigration Origin | # Population | % Population |
| Asia | 5 | 1.3% |
| China | 5 | 1.3% |
| Eastern Asia | 5 | 1.3% | View All 3 Rows |
Sex and Age in Massena
Sex and Age in Massena
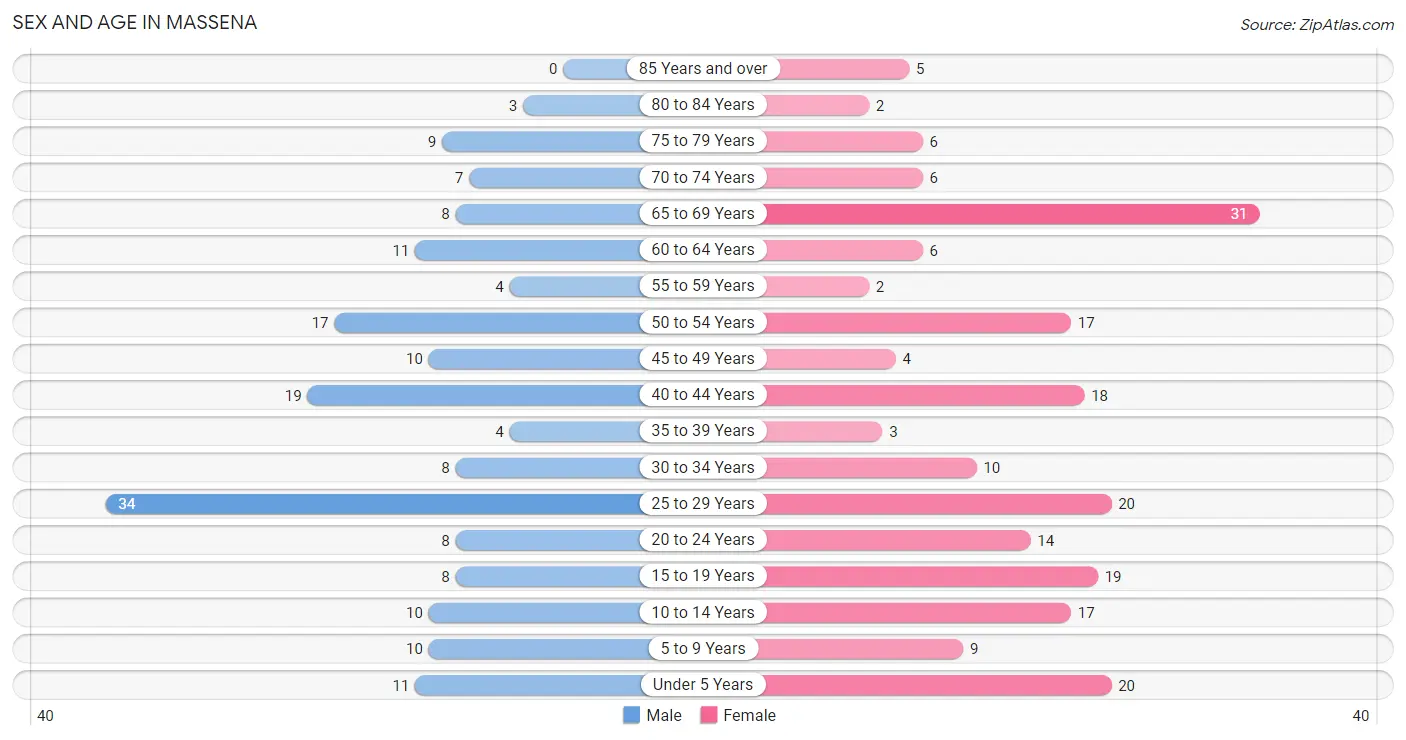
The most populous age groups in Massena are 25 to 29 Years (34 | 18.8%) for men and 65 to 69 Years (31 | 14.8%) for women.
| Age Bracket | Male | Female |
| Under 5 Years | 11 (6.1%) | 20 (9.6%) |
| 5 to 9 Years | 10 (5.5%) | 9 (4.3%) |
| 10 to 14 Years | 10 (5.5%) | 17 (8.1%) |
| 15 to 19 Years | 8 (4.4%) | 19 (9.1%) |
| 20 to 24 Years | 8 (4.4%) | 14 (6.7%) |
| 25 to 29 Years | 34 (18.8%) | 20 (9.6%) |
| 30 to 34 Years | 8 (4.4%) | 10 (4.8%) |
| 35 to 39 Years | 4 (2.2%) | 3 (1.4%) |
| 40 to 44 Years | 19 (10.5%) | 18 (8.6%) |
| 45 to 49 Years | 10 (5.5%) | 4 (1.9%) |
| 50 to 54 Years | 17 (9.4%) | 17 (8.1%) |
| 55 to 59 Years | 4 (2.2%) | 2 (1.0%) |
| 60 to 64 Years | 11 (6.1%) | 6 (2.9%) |
| 65 to 69 Years | 8 (4.4%) | 31 (14.8%) |
| 70 to 74 Years | 7 (3.9%) | 6 (2.9%) |
| 75 to 79 Years | 9 (5.0%) | 6 (2.9%) |
| 80 to 84 Years | 3 (1.7%) | 2 (1.0%) |
| 85 Years and over | 0 (0.0%) | 5 (2.4%) |
| Total | 181 (100.0%) | 209 (100.0%) |
Families and Households in Massena
Median Family Size in Massena
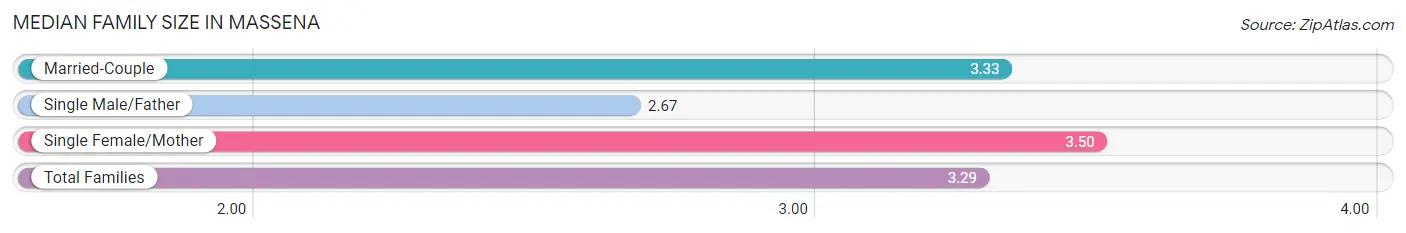
The median family size in Massena is 3.29 persons per family, with single female/mother families (2 | 2.0%) accounting for the largest median family size of 3.5 persons per family. On the other hand, single male/father families (6 | 6.0%) represent the smallest median family size with 2.67 persons per family.
| Family Type | # Families | Family Size |
| Married-Couple | 92 (92.0%) | 3.33 |
| Single Male/Father | 6 (6.0%) | 2.67 |
| Single Female/Mother | 2 (2.0%) | 3.50 |
| Total Families | 100 (100.0%) | 3.29 |
Median Household Size in Massena
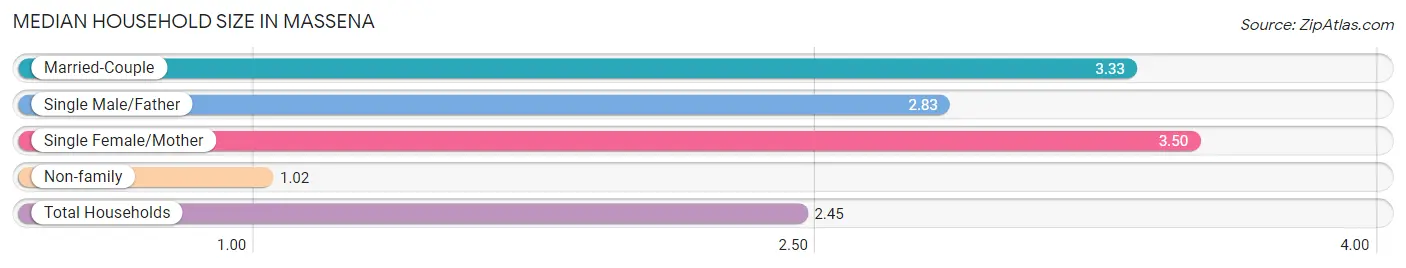
The median household size in Massena is 2.45 persons per household, with single female/mother households (2 | 1.3%) accounting for the largest median household size of 3.5 persons per household. non-family households (59 | 37.1%) represent the smallest median household size with 1.02 persons per household.
| Household Type | # Households | Household Size |
| Married-Couple | 92 (57.9%) | 3.33 |
| Single Male/Father | 6 (3.8%) | 2.83 |
| Single Female/Mother | 2 (1.3%) | 3.50 |
| Non-family | 59 (37.1%) | 1.02 |
| Total Households | 159 (100.0%) | 2.45 |
Household Size by Marriage Status in Massena
Out of a total of 159 households in Massena, 100 (62.9%) are family households, while 59 (37.1%) are nonfamily households. The most numerous type of family households are 2-person households, comprising 40, and the most common type of nonfamily households are 1-person households, comprising 57.
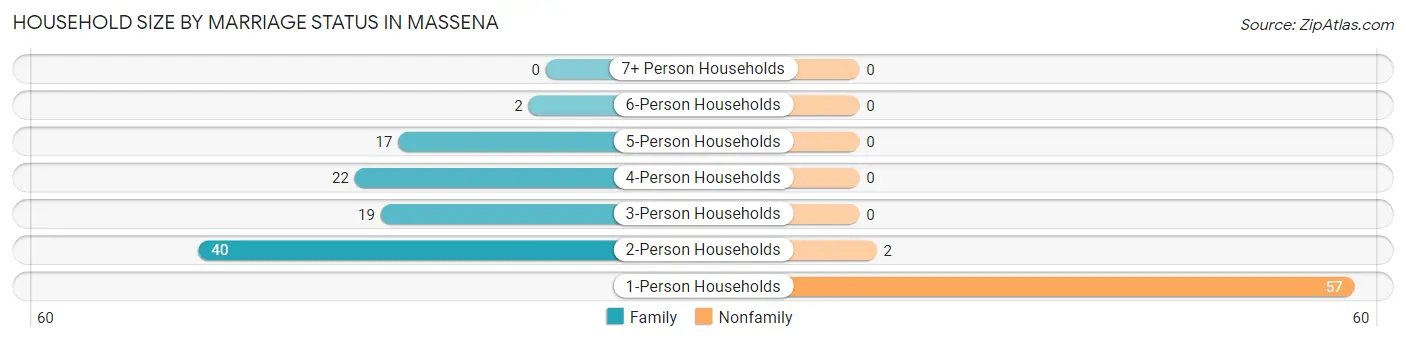
| Household Size | Family Households | Nonfamily Households |
| 1-Person Households | - | 57 (35.8%) |
| 2-Person Households | 40 (25.2%) | 2 (1.3%) |
| 3-Person Households | 19 (11.9%) | 0 (0.0%) |
| 4-Person Households | 22 (13.8%) | 0 (0.0%) |
| 5-Person Households | 17 (10.7%) | 0 (0.0%) |
| 6-Person Households | 2 (1.3%) | 0 (0.0%) |
| 7+ Person Households | 0 (0.0%) | 0 (0.0%) |
| Total | 100 (62.9%) | 59 (37.1%) |
Female Fertility in Massena
Fertility by Age in Massena
Average fertility rate in Massena is 189.0 births per 1,000 women. Women in the age bracket of 20 to 34 years have the highest fertility rate with 386.0 births per 1,000 women. Women in the age bracket of 20 to 34 years acount for 100.0% of all women with births.
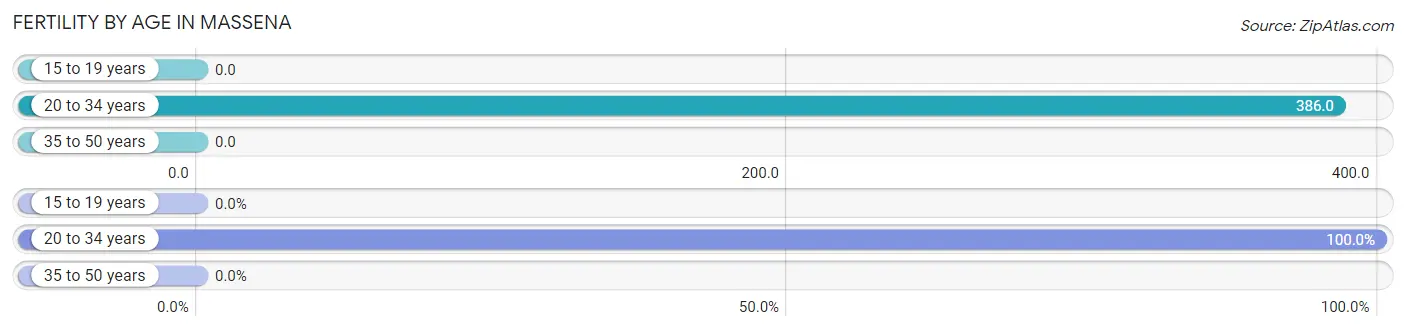
| Age Bracket | Women with Births | Births / 1,000 Women |
| 15 to 19 years | 0 (0.0%) | 0.0 |
| 20 to 34 years | 17 (100.0%) | 386.0 |
| 35 to 50 years | 0 (0.0%) | 0.0 |
| Total | 17 (100.0%) | 189.0 |
Fertility by Age by Marriage Status in Massena
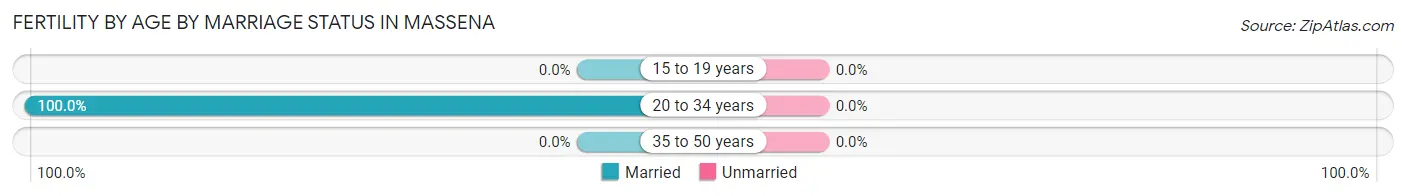
| Age Bracket | Married | Unmarried |
| 15 to 19 years | 0 (0.0%) | 0 (0.0%) |
| 20 to 34 years | 17 (100.0%) | 0 (0.0%) |
| 35 to 50 years | 0 (0.0%) | 0 (0.0%) |
| Total | 17 (100.0%) | 0 (0.0%) |
Fertility by Education in Massena
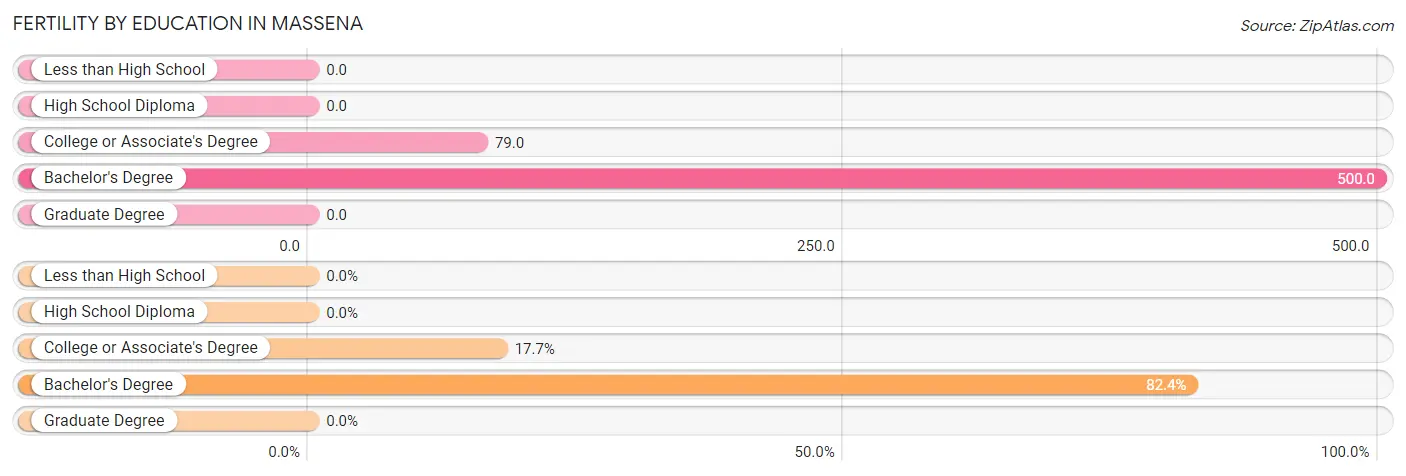
| Educational Attainment | Women with Births | Births / 1,000 Women |
| Less than High School | 0 (0.0%) | 0.0 |
| High School Diploma | 0 (0.0%) | 0.0 |
| College or Associate's Degree | 3 (17.6%) | 79.0 |
| Bachelor's Degree | 14 (82.4%) | 500.0 |
| Graduate Degree | 0 (0.0%) | 0.0 |
| Total | 17 (100.0%) | 189.0 |
Fertility by Education by Marriage Status in Massena
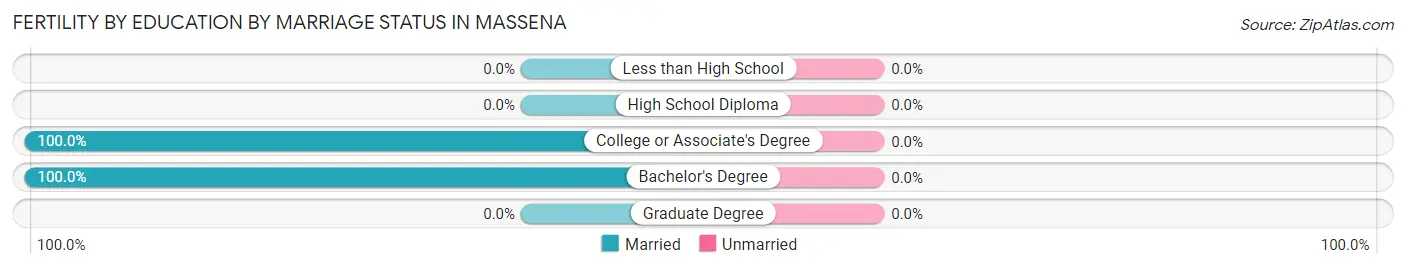
| Educational Attainment | Married | Unmarried |
| Less than High School | 0 (0.0%) | 0 (0.0%) |
| High School Diploma | 0 (0.0%) | 0 (0.0%) |
| College or Associate's Degree | 3 (100.0%) | 0 (0.0%) |
| Bachelor's Degree | 14 (100.0%) | 0 (0.0%) |
| Graduate Degree | 0 (0.0%) | 0 (0.0%) |
| Total | 17 (100.0%) | 0 (0.0%) |
Employment Characteristics in Massena
Employment by Class of Employer in Massena
Among the 177 employed individuals in Massena, private company employees (130 | 73.5%), self-employed (not incorporated) (20 | 11.3%), and not-for-profit organizations (9 | 5.1%) make up the most common classes of employment.
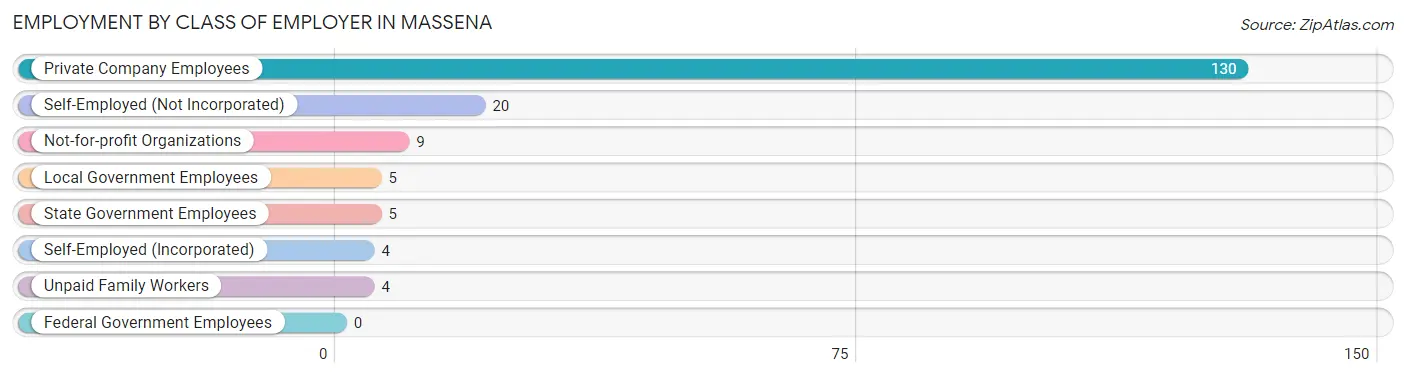
| Employer Class | # Employees | % Employees |
| Private Company Employees | 130 | 73.5% |
| Self-Employed (Incorporated) | 4 | 2.3% |
| Self-Employed (Not Incorporated) | 20 | 11.3% |
| Not-for-profit Organizations | 9 | 5.1% |
| Local Government Employees | 5 | 2.8% |
| State Government Employees | 5 | 2.8% |
| Federal Government Employees | 0 | 0.0% |
| Unpaid Family Workers | 4 | 2.3% |
| Total | 177 | 100.0% |
Employment Status by Age in Massena
According to the labor force statistics for Massena, out of the total population over 16 years of age (310), 60.3% or 187 individuals are in the labor force, with 5.3% or 10 of them unemployed. The age group with the highest labor force participation rate is 20 to 24 years, with 100.0% or 22 individuals in the labor force. Within the labor force, the 35 to 44 years age range has the highest percentage of unemployed individuals, with 34.5% or 10 of them being unemployed.
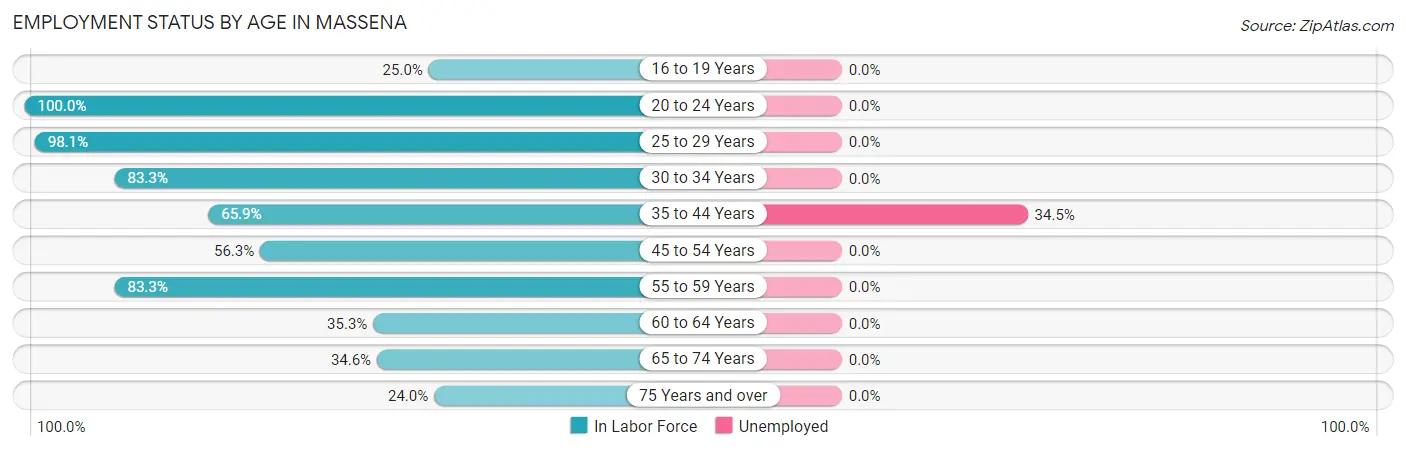
| Age Bracket | In Labor Force | Unemployed |
| 16 to 19 Years | 6 (25.0%) | 0 (0.0%) |
| 20 to 24 Years | 22 (100.0%) | 0 (0.0%) |
| 25 to 29 Years | 53 (98.1%) | 0 (0.0%) |
| 30 to 34 Years | 15 (83.3%) | 0 (0.0%) |
| 35 to 44 Years | 29 (65.9%) | 10 (34.5%) |
| 45 to 54 Years | 27 (56.3%) | 0 (0.0%) |
| 55 to 59 Years | 5 (83.3%) | 0 (0.0%) |
| 60 to 64 Years | 6 (35.3%) | 0 (0.0%) |
| 65 to 74 Years | 18 (34.6%) | 0 (0.0%) |
| 75 Years and over | 6 (24.0%) | 0 (0.0%) |
| Total | 187 (60.3%) | 10 (5.3%) |
Employment Status by Educational Attainment in Massena
According to labor force statistics for Massena, 72.2% of individuals (135) out of the total population between 25 and 64 years of age (187) are in the labor force, with 7.4% or 10 of them being unemployed. The group with the highest labor force participation rate are those with the educational attainment of less than high school, with 100.0% or 2 individuals in the labor force. Within the labor force, individuals with high school diploma education have the highest percentage of unemployment, with 20.8% or 10 of them being unemployed.
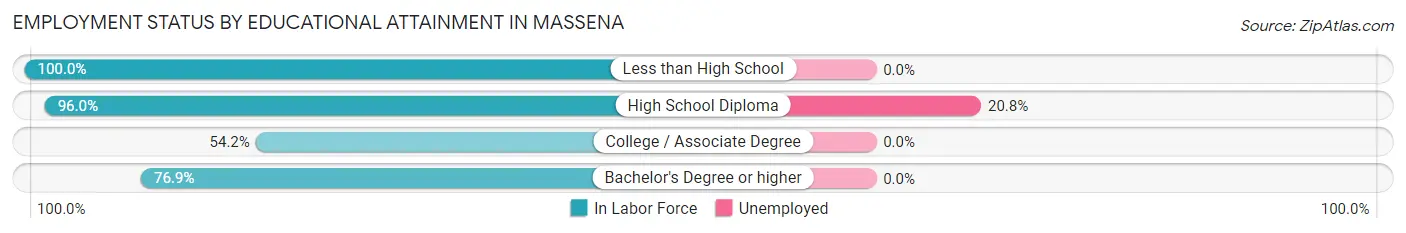
| Educational Attainment | In Labor Force | Unemployed |
| Less than High School | 2 (100.0%) | 0 (0.0%) |
| High School Diploma | 48 (96.0%) | 10 (20.8%) |
| College / Associate Degree | 45 (54.2%) | 0 (0.0%) |
| Bachelor's Degree or higher | 40 (76.9%) | 0 (0.0%) |
| Total | 135 (72.2%) | 14 (7.4%) |
Employment Occupations by Sex in Massena
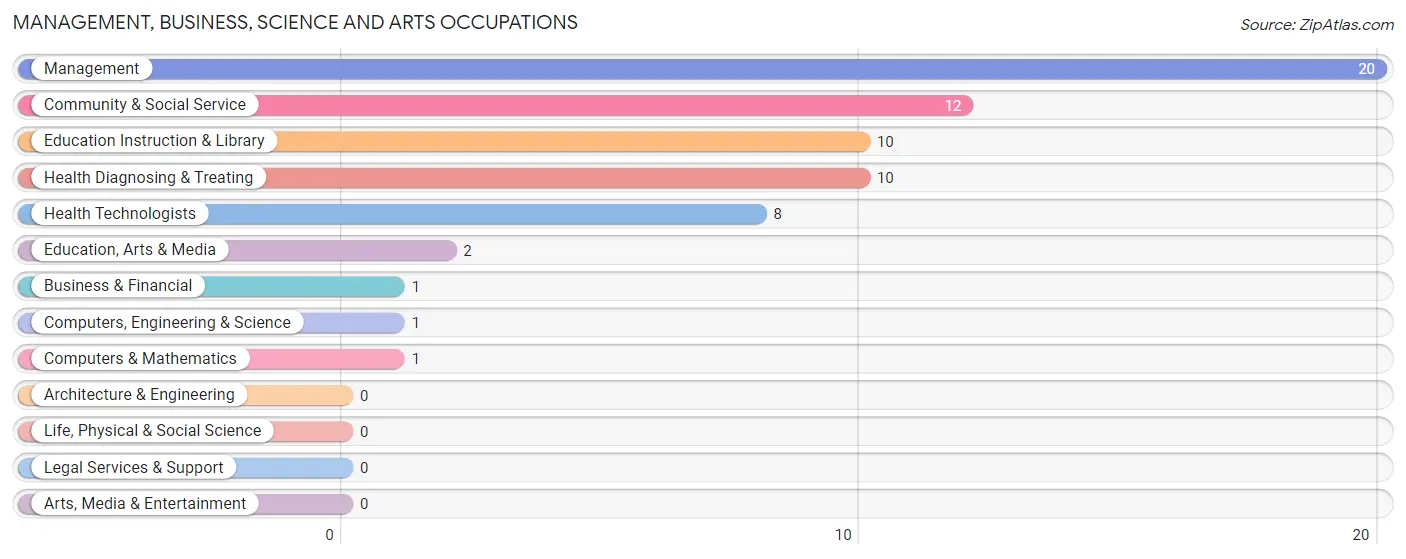
Management, Business, Science and Arts Occupations
The most common Management, Business, Science and Arts occupations in Massena are Management (20 | 11.3%), Community & Social Service (12 | 6.8%), Education Instruction & Library (10 | 5.7%), Health Diagnosing & Treating (10 | 5.7%), and Health Technologists (8 | 4.5%).
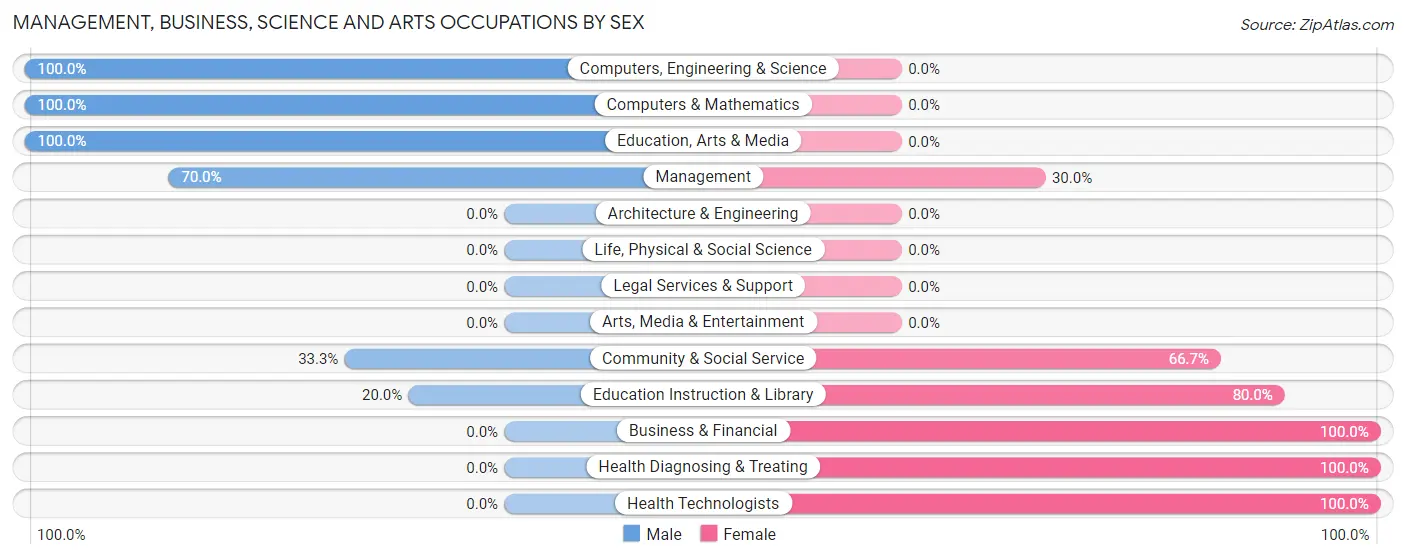
Management, Business, Science and Arts Occupations by Sex
Within the Management, Business, Science and Arts occupations in Massena, the most male-oriented occupations are Computers, Engineering & Science (100.0%), Computers & Mathematics (100.0%), and Education, Arts & Media (100.0%), while the most female-oriented occupations are Business & Financial (100.0%), Health Diagnosing & Treating (100.0%), and Health Technologists (100.0%).
| Occupation | Male | Female |
| Management | 14 (70.0%) | 6 (30.0%) |
| Business & Financial | 0 (0.0%) | 1 (100.0%) |
| Computers, Engineering & Science | 1 (100.0%) | 0 (0.0%) |
| Computers & Mathematics | 1 (100.0%) | 0 (0.0%) |
| Architecture & Engineering | 0 (0.0%) | 0 (0.0%) |
| Life, Physical & Social Science | 0 (0.0%) | 0 (0.0%) |
| Community & Social Service | 4 (33.3%) | 8 (66.7%) |
| Education, Arts & Media | 2 (100.0%) | 0 (0.0%) |
| Legal Services & Support | 0 (0.0%) | 0 (0.0%) |
| Education Instruction & Library | 2 (20.0%) | 8 (80.0%) |
| Arts, Media & Entertainment | 0 (0.0%) | 0 (0.0%) |
| Health Diagnosing & Treating | 0 (0.0%) | 10 (100.0%) |
| Health Technologists | 0 (0.0%) | 8 (100.0%) |
| Total (Category) | 19 (43.2%) | 25 (56.8%) |
| Total (Overall) | 105 (59.3%) | 72 (40.7%) |
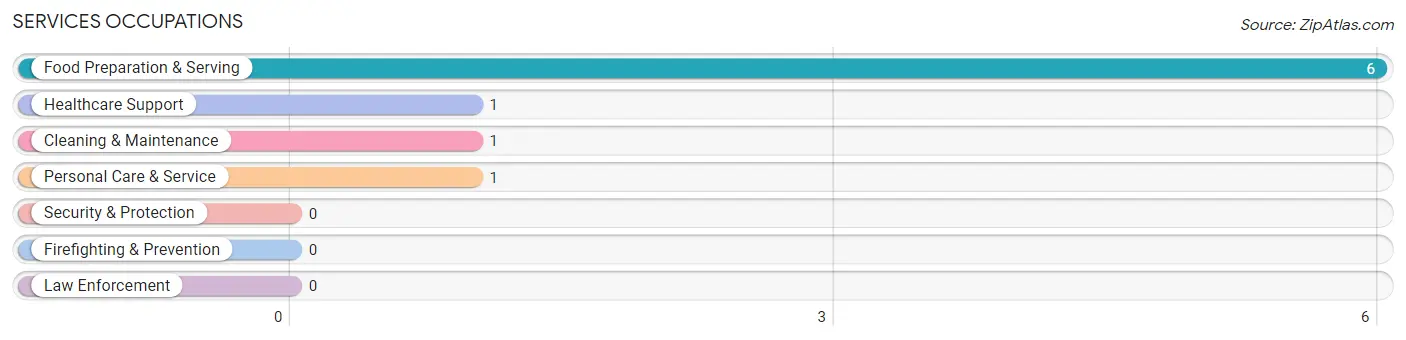
Services Occupations
The most common Services occupations in Massena are Food Preparation & Serving (6 | 3.4%), Healthcare Support (1 | 0.6%), Cleaning & Maintenance (1 | 0.6%), and Personal Care & Service (1 | 0.6%).
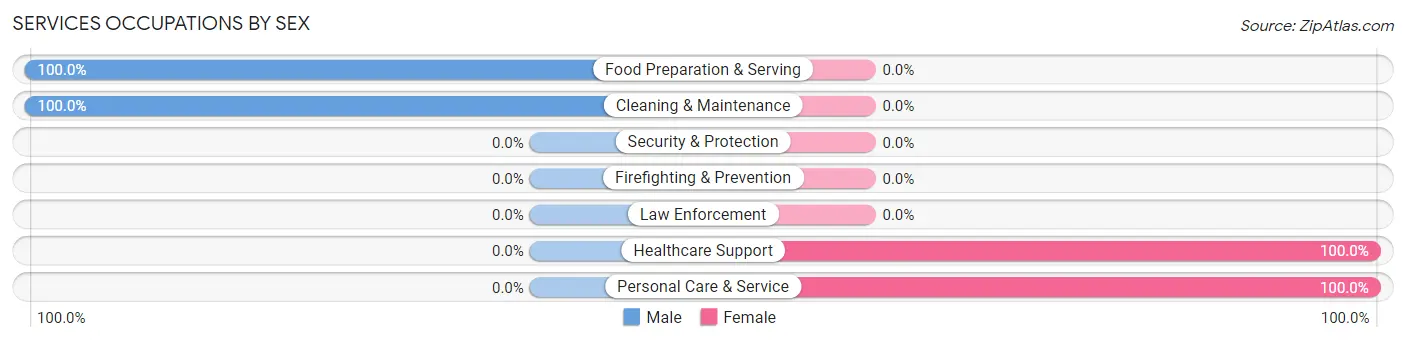
Services Occupations by Sex
Within the Services occupations in Massena, the most male-oriented occupations are Food Preparation & Serving (100.0%), and Cleaning & Maintenance (100.0%), while the most female-oriented occupations are Healthcare Support (100.0%), and Personal Care & Service (100.0%).
| Occupation | Male | Female |
| Healthcare Support | 0 (0.0%) | 1 (100.0%) |
| Security & Protection | 0 (0.0%) | 0 (0.0%) |
| Firefighting & Prevention | 0 (0.0%) | 0 (0.0%) |
| Law Enforcement | 0 (0.0%) | 0 (0.0%) |
| Food Preparation & Serving | 6 (100.0%) | 0 (0.0%) |
| Cleaning & Maintenance | 1 (100.0%) | 0 (0.0%) |
| Personal Care & Service | 0 (0.0%) | 1 (100.0%) |
| Total (Category) | 7 (77.8%) | 2 (22.2%) |
| Total (Overall) | 105 (59.3%) | 72 (40.7%) |
Sales and Office Occupations
The most common Sales and Office occupations in Massena are Sales & Related (27 | 15.2%), and Office & Administration (18 | 10.2%).
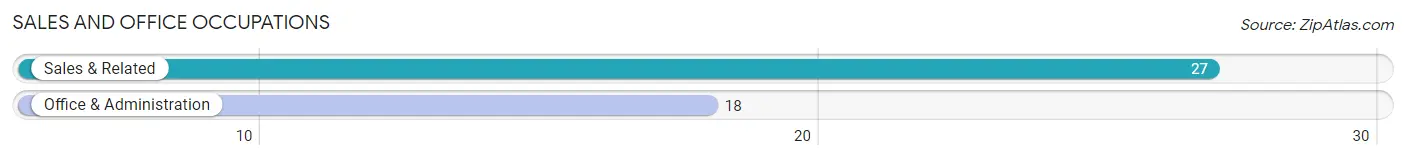
Sales and Office Occupations by Sex
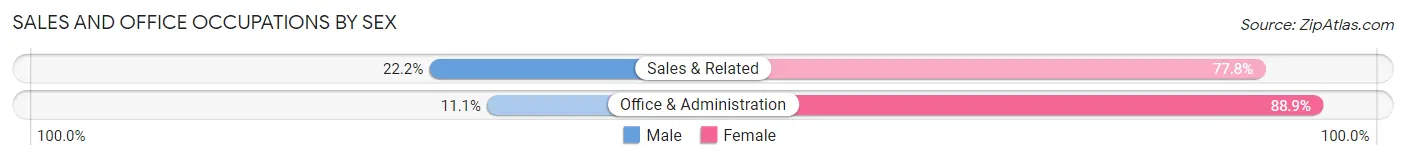
| Occupation | Male | Female |
| Sales & Related | 6 (22.2%) | 21 (77.8%) |
| Office & Administration | 2 (11.1%) | 16 (88.9%) |
| Total (Category) | 8 (17.8%) | 37 (82.2%) |
| Total (Overall) | 105 (59.3%) | 72 (40.7%) |
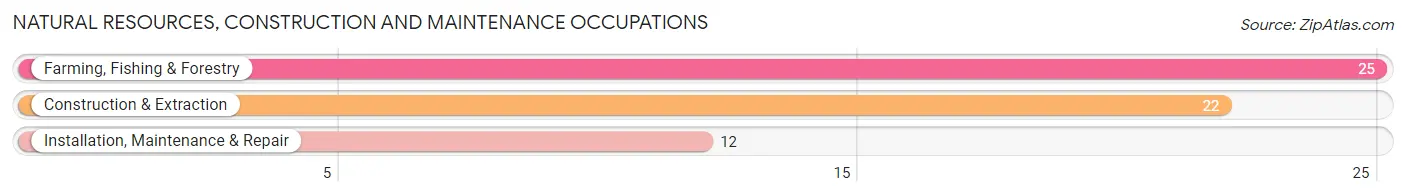
Natural Resources, Construction and Maintenance Occupations
The most common Natural Resources, Construction and Maintenance occupations in Massena are Farming, Fishing & Forestry (25 | 14.1%), Construction & Extraction (22 | 12.4%), and Installation, Maintenance & Repair (12 | 6.8%).
Natural Resources, Construction and Maintenance Occupations by Sex
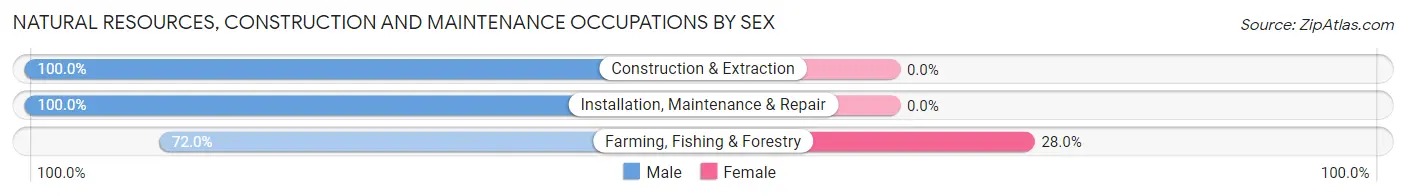
| Occupation | Male | Female |
| Farming, Fishing & Forestry | 18 (72.0%) | 7 (28.0%) |
| Construction & Extraction | 22 (100.0%) | 0 (0.0%) |
| Installation, Maintenance & Repair | 12 (100.0%) | 0 (0.0%) |
| Total (Category) | 52 (88.1%) | 7 (11.9%) |
| Total (Overall) | 105 (59.3%) | 72 (40.7%) |
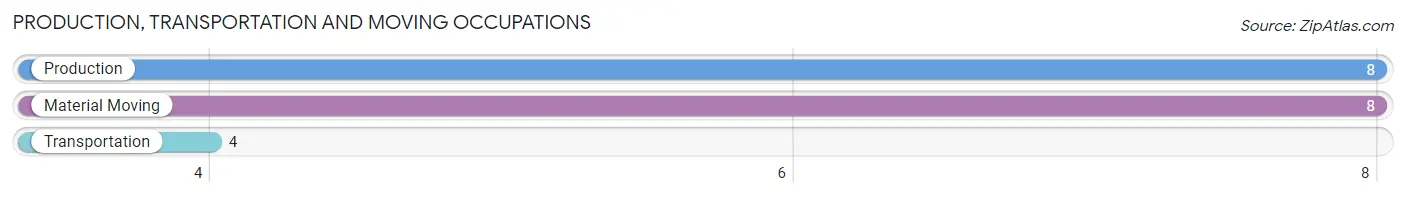
Production, Transportation and Moving Occupations
The most common Production, Transportation and Moving occupations in Massena are Production (8 | 4.5%), Material Moving (8 | 4.5%), and Transportation (4 | 2.3%).
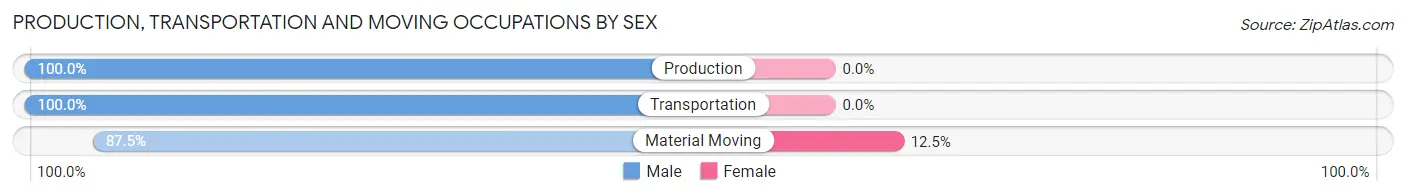
Production, Transportation and Moving Occupations by Sex
| Occupation | Male | Female |
| Production | 8 (100.0%) | 0 (0.0%) |
| Transportation | 4 (100.0%) | 0 (0.0%) |
| Material Moving | 7 (87.5%) | 1 (12.5%) |
| Total (Category) | 19 (95.0%) | 1 (5.0%) |
| Total (Overall) | 105 (59.3%) | 72 (40.7%) |
Employment Industries by Sex in Massena
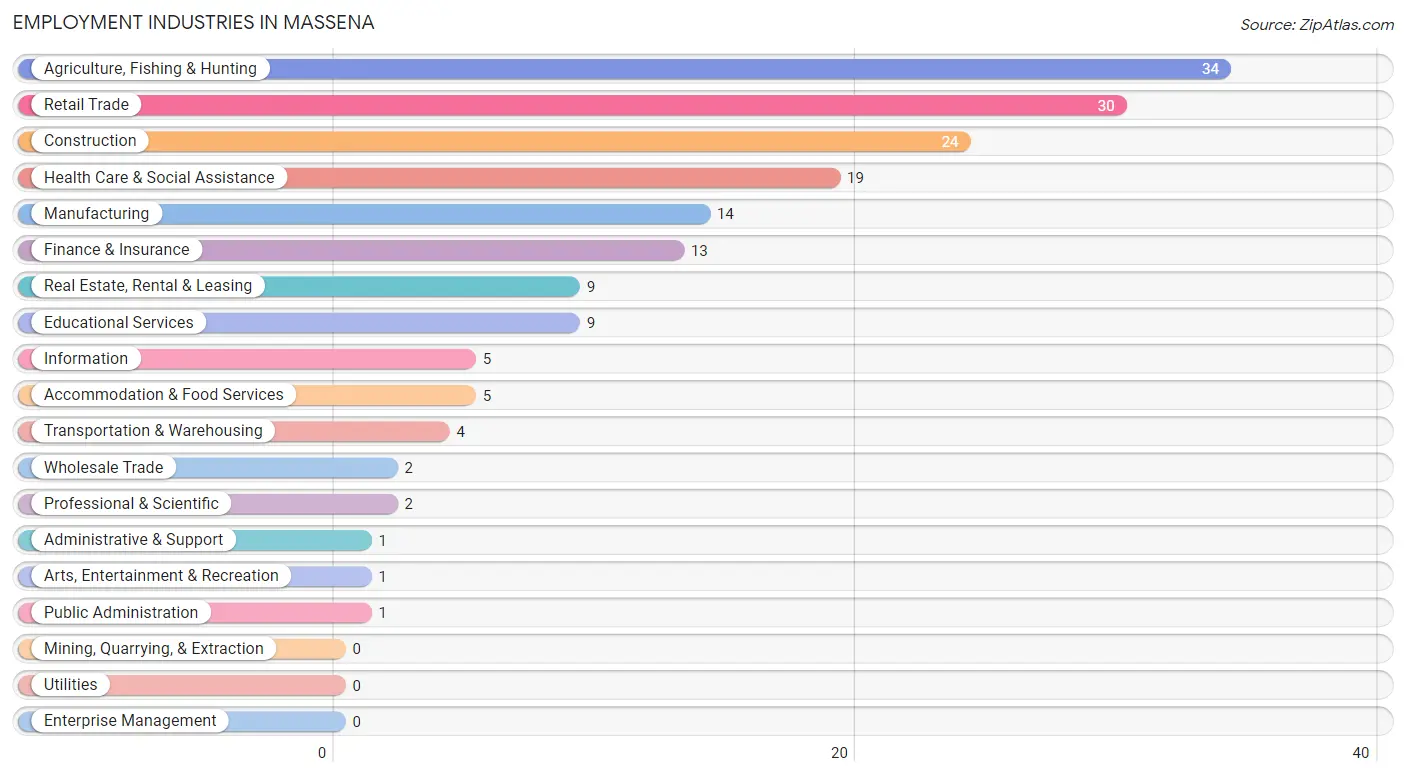
Employment Industries in Massena
The major employment industries in Massena include Agriculture, Fishing & Hunting (34 | 19.2%), Retail Trade (30 | 17.0%), Construction (24 | 13.6%), Health Care & Social Assistance (19 | 10.7%), and Manufacturing (14 | 7.9%).
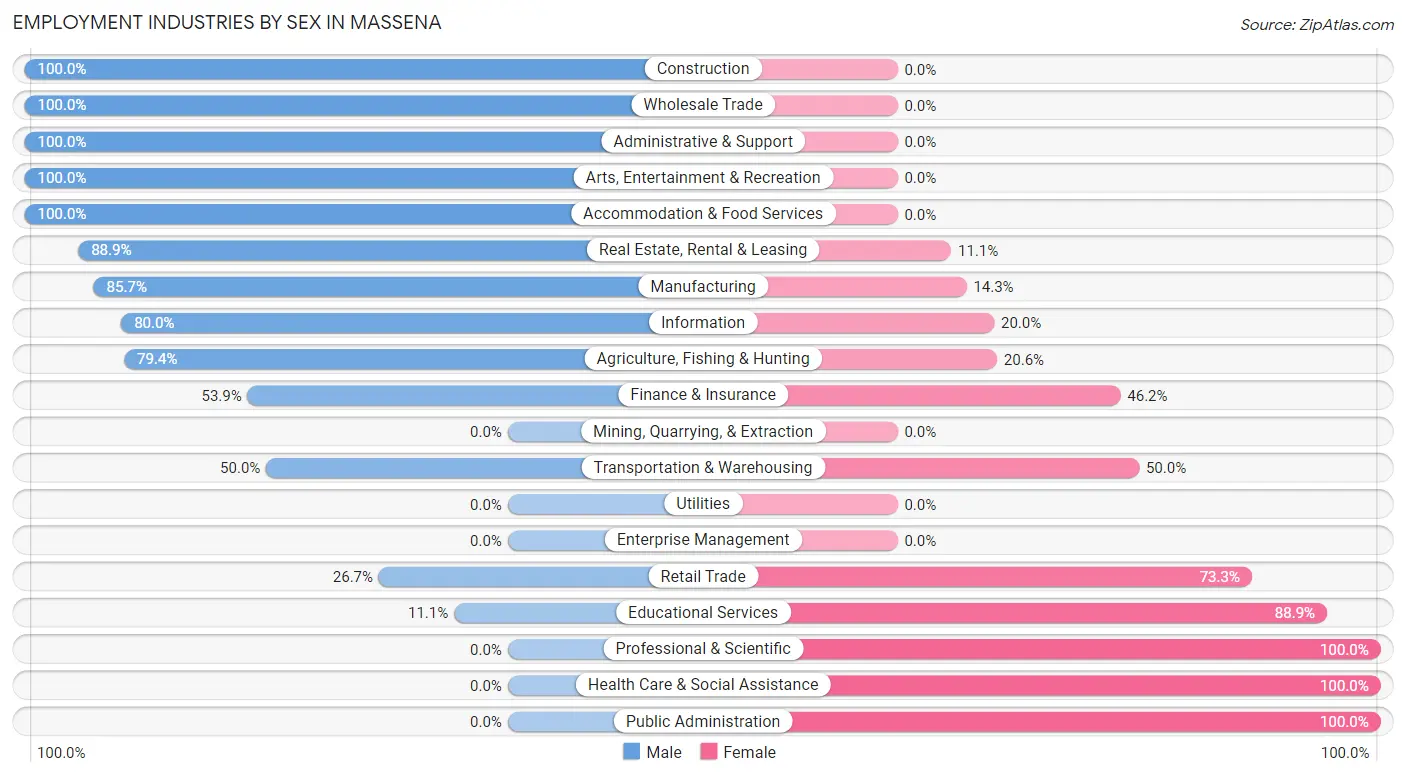
Employment Industries by Sex in Massena
The Massena industries that see more men than women are Construction (100.0%), Wholesale Trade (100.0%), and Administrative & Support (100.0%), whereas the industries that tend to have a higher number of women are Professional & Scientific (100.0%), Health Care & Social Assistance (100.0%), and Public Administration (100.0%).
| Industry | Male | Female |
| Agriculture, Fishing & Hunting | 27 (79.4%) | 7 (20.6%) |
| Mining, Quarrying, & Extraction | 0 (0.0%) | 0 (0.0%) |
| Construction | 24 (100.0%) | 0 (0.0%) |
| Manufacturing | 12 (85.7%) | 2 (14.3%) |
| Wholesale Trade | 2 (100.0%) | 0 (0.0%) |
| Retail Trade | 8 (26.7%) | 22 (73.3%) |
| Transportation & Warehousing | 2 (50.0%) | 2 (50.0%) |
| Utilities | 0 (0.0%) | 0 (0.0%) |
| Information | 4 (80.0%) | 1 (20.0%) |
| Finance & Insurance | 7 (53.8%) | 6 (46.2%) |
| Real Estate, Rental & Leasing | 8 (88.9%) | 1 (11.1%) |
| Professional & Scientific | 0 (0.0%) | 2 (100.0%) |
| Enterprise Management | 0 (0.0%) | 0 (0.0%) |
| Administrative & Support | 1 (100.0%) | 0 (0.0%) |
| Educational Services | 1 (11.1%) | 8 (88.9%) |
| Health Care & Social Assistance | 0 (0.0%) | 19 (100.0%) |
| Arts, Entertainment & Recreation | 1 (100.0%) | 0 (0.0%) |
| Accommodation & Food Services | 5 (100.0%) | 0 (0.0%) |
| Public Administration | 0 (0.0%) | 1 (100.0%) |
| Total | 105 (59.3%) | 72 (40.7%) |
Education in Massena
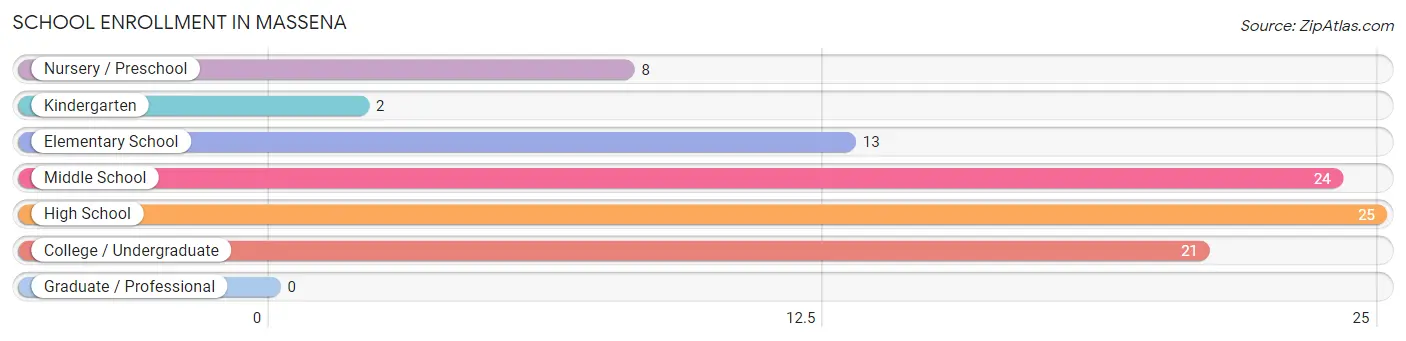
School Enrollment in Massena
The most common levels of schooling among the 93 students in Massena are high school (25 | 26.9%), middle school (24 | 25.8%), and college / undergraduate (21 | 22.6%).
| School Level | # Students | % Students |
| Nursery / Preschool | 8 | 8.6% |
| Kindergarten | 2 | 2.1% |
| Elementary School | 13 | 14.0% |
| Middle School | 24 | 25.8% |
| High School | 25 | 26.9% |
| College / Undergraduate | 21 | 22.6% |
| Graduate / Professional | 0 | 0.0% |
| Total | 93 | 100.0% |
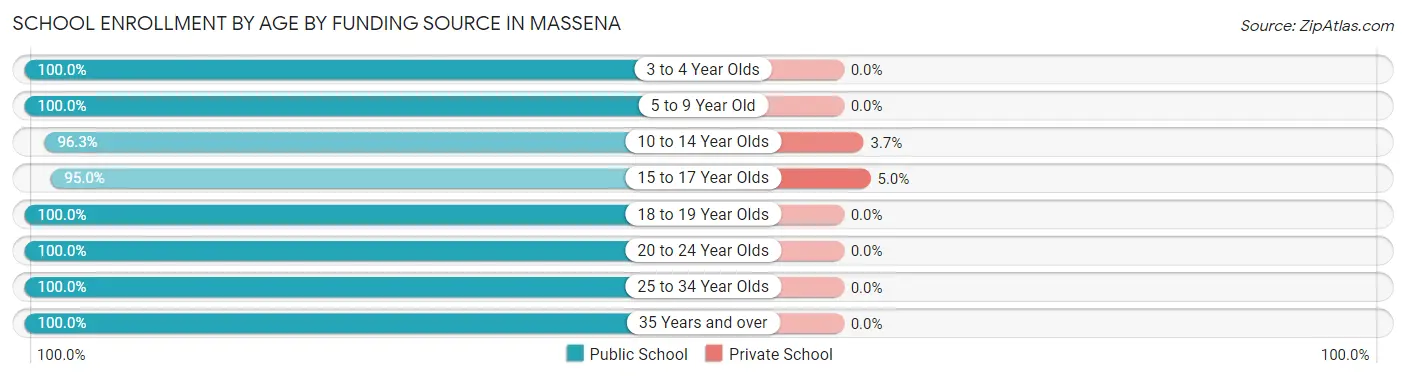
School Enrollment by Age by Funding Source in Massena
Out of a total of 93 students who are enrolled in schools in Massena, 2 (2.2%) attend a private institution, while the remaining 91 (97.8%) are enrolled in public schools. The age group of 15 to 17 year olds has the highest likelihood of being enrolled in private schools, with 1 (5.0% in the age bracket) enrolled. Conversely, the age group of 3 to 4 year olds has the lowest likelihood of being enrolled in a private school, with 4 (100.0% in the age bracket) attending a public institution.
| Age Bracket | Public School | Private School |
| 3 to 4 Year Olds | 4 (100.0%) | 0 (0.0%) |
| 5 to 9 Year Old | 19 (100.0%) | 0 (0.0%) |
| 10 to 14 Year Olds | 26 (96.3%) | 1 (3.7%) |
| 15 to 17 Year Olds | 19 (95.0%) | 1 (5.0%) |
| 18 to 19 Year Olds | 2 (100.0%) | 0 (0.0%) |
| 20 to 24 Year Olds | 16 (100.0%) | 0 (0.0%) |
| 25 to 34 Year Olds | 3 (100.0%) | 0 (0.0%) |
| 35 Years and over | 2 (100.0%) | 0 (0.0%) |
| Total | 91 (97.8%) | 2 (2.2%) |
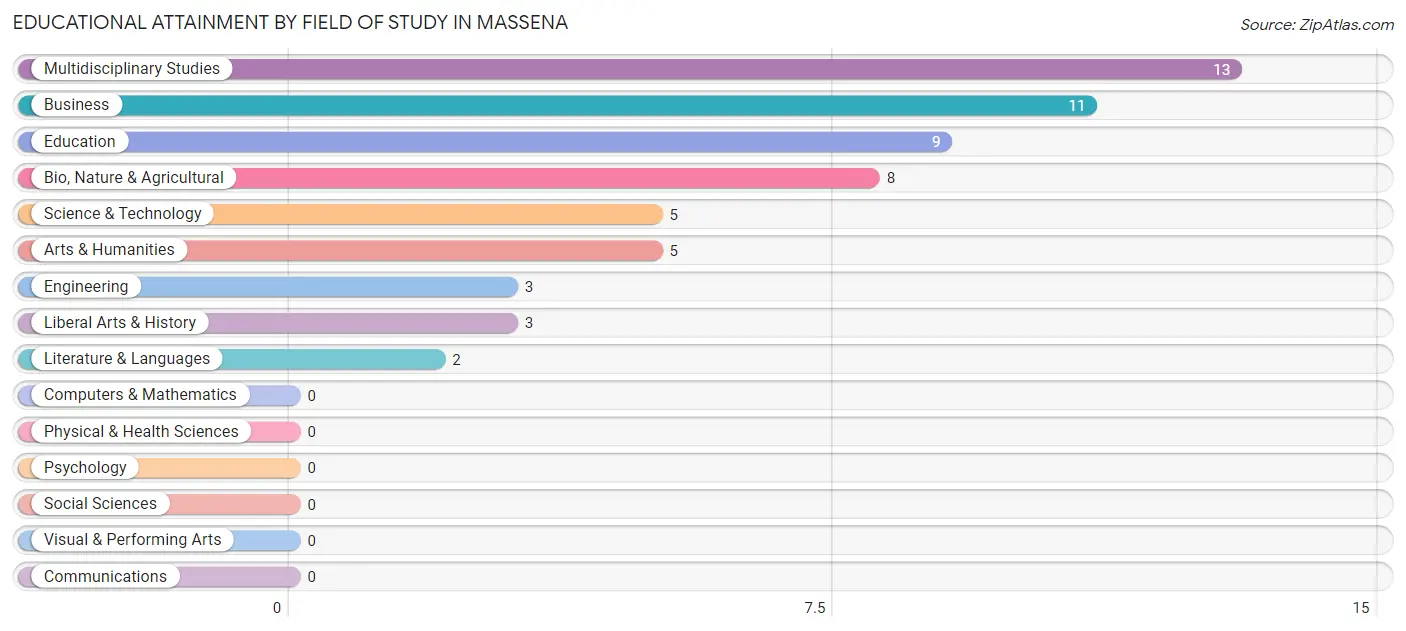
Educational Attainment by Field of Study in Massena
Multidisciplinary studies (13 | 22.0%), business (11 | 18.6%), education (9 | 15.2%), bio, nature & agricultural (8 | 13.6%), and science & technology (5 | 8.5%) are the most common fields of study among 59 individuals in Massena who have obtained a bachelor's degree or higher.
| Field of Study | # Graduates | % Graduates |
| Computers & Mathematics | 0 | 0.0% |
| Bio, Nature & Agricultural | 8 | 13.6% |
| Physical & Health Sciences | 0 | 0.0% |
| Psychology | 0 | 0.0% |
| Social Sciences | 0 | 0.0% |
| Engineering | 3 | 5.1% |
| Multidisciplinary Studies | 13 | 22.0% |
| Science & Technology | 5 | 8.5% |
| Business | 11 | 18.6% |
| Education | 9 | 15.2% |
| Literature & Languages | 2 | 3.4% |
| Liberal Arts & History | 3 | 5.1% |
| Visual & Performing Arts | 0 | 0.0% |
| Communications | 0 | 0.0% |
| Arts & Humanities | 5 | 8.5% |
| Total | 59 | 100.0% |
Transportation & Commute in Massena
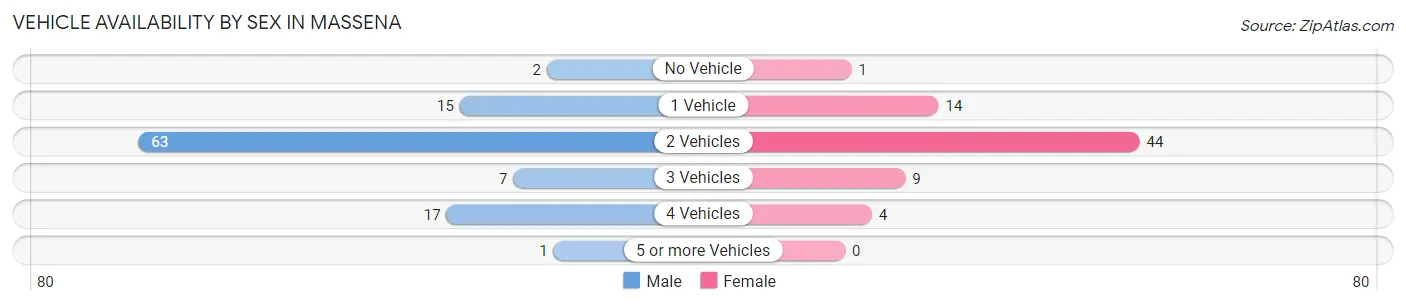
Vehicle Availability by Sex in Massena
The most prevalent vehicle ownership categories in Massena are males with 2 vehicles (63, accounting for 60.0%) and females with 2 vehicles (44, making up 87.5%).
| Vehicles Available | Male | Female |
| No Vehicle | 2 (1.9%) | 1 (1.4%) |
| 1 Vehicle | 15 (14.3%) | 14 (19.4%) |
| 2 Vehicles | 63 (60.0%) | 44 (61.1%) |
| 3 Vehicles | 7 (6.7%) | 9 (12.5%) |
| 4 Vehicles | 17 (16.2%) | 4 (5.6%) |
| 5 or more Vehicles | 1 (0.9%) | 0 (0.0%) |
| Total | 105 (100.0%) | 72 (100.0%) |
Commute Time in Massena
The most frequently occuring commute durations in Massena are less than 5 minutes (28 commuters, 16.1%), 30 to 34 minutes (27 commuters, 15.5%), and 20 to 24 minutes (26 commuters, 14.9%).
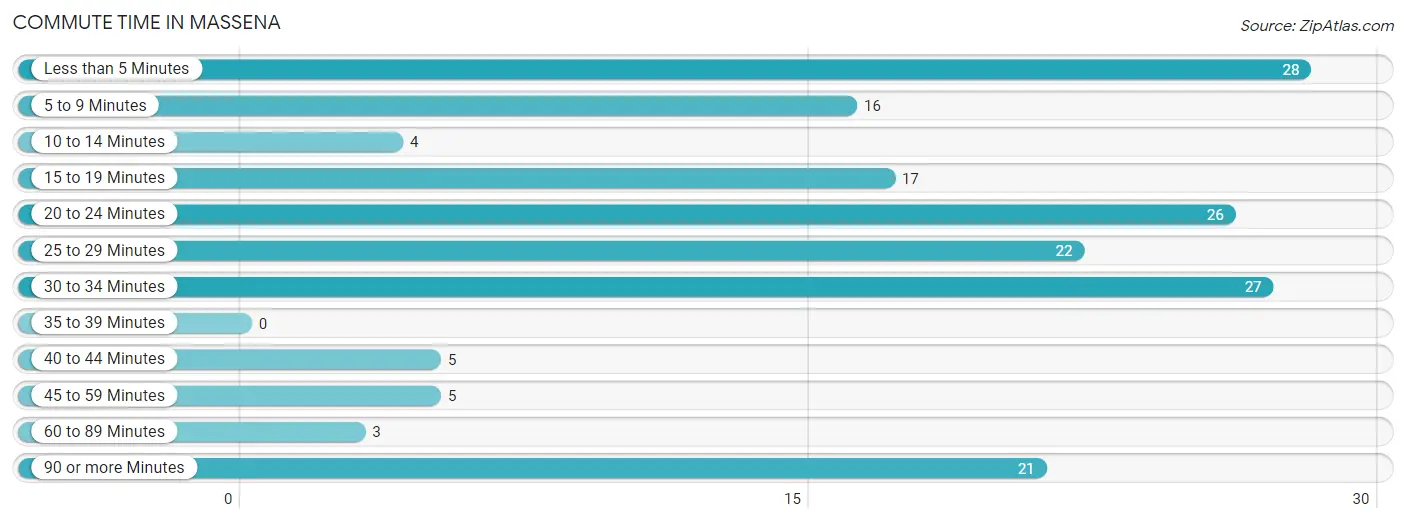
| Commute Time | # Commuters | % Commuters |
| Less than 5 Minutes | 28 | 16.1% |
| 5 to 9 Minutes | 16 | 9.2% |
| 10 to 14 Minutes | 4 | 2.3% |
| 15 to 19 Minutes | 17 | 9.8% |
| 20 to 24 Minutes | 26 | 14.9% |
| 25 to 29 Minutes | 22 | 12.6% |
| 30 to 34 Minutes | 27 | 15.5% |
| 35 to 39 Minutes | 0 | 0.0% |
| 40 to 44 Minutes | 5 | 2.9% |
| 45 to 59 Minutes | 5 | 2.9% |
| 60 to 89 Minutes | 3 | 1.7% |
| 90 or more Minutes | 21 | 12.1% |
Commute Time by Sex in Massena
The most common commute times in Massena are 20 to 24 minutes (24 commuters, 23.1%) for males and less than 5 minutes (18 commuters, 25.7%) for females.
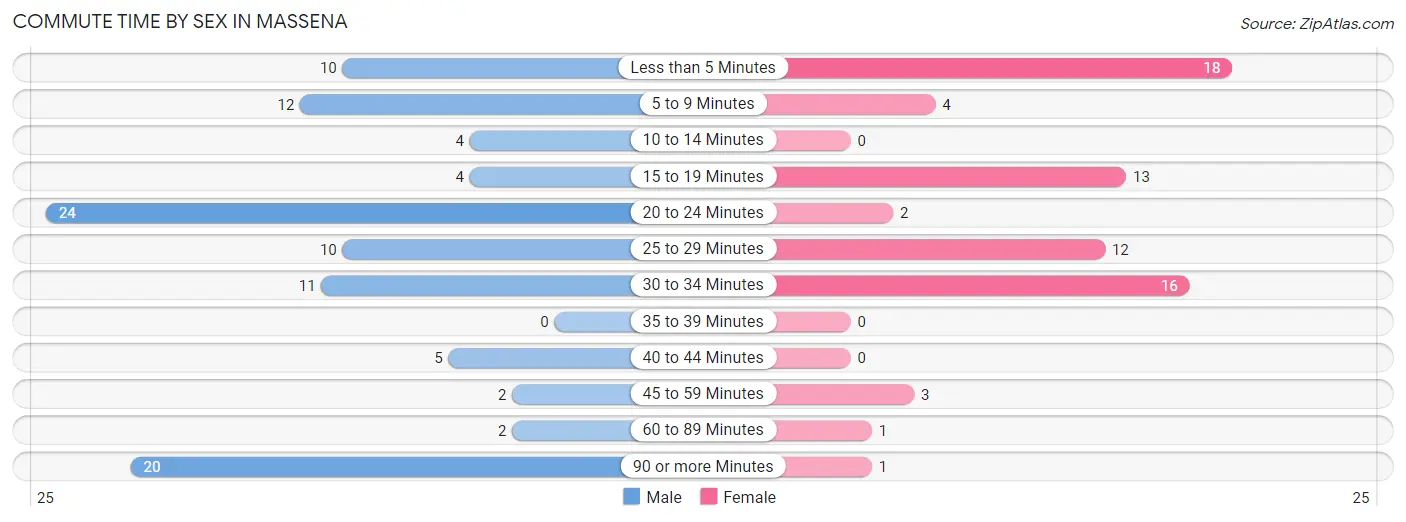
| Commute Time | Male | Female |
| Less than 5 Minutes | 10 (9.6%) | 18 (25.7%) |
| 5 to 9 Minutes | 12 (11.5%) | 4 (5.7%) |
| 10 to 14 Minutes | 4 (3.8%) | 0 (0.0%) |
| 15 to 19 Minutes | 4 (3.8%) | 13 (18.6%) |
| 20 to 24 Minutes | 24 (23.1%) | 2 (2.9%) |
| 25 to 29 Minutes | 10 (9.6%) | 12 (17.1%) |
| 30 to 34 Minutes | 11 (10.6%) | 16 (22.9%) |
| 35 to 39 Minutes | 0 (0.0%) | 0 (0.0%) |
| 40 to 44 Minutes | 5 (4.8%) | 0 (0.0%) |
| 45 to 59 Minutes | 2 (1.9%) | 3 (4.3%) |
| 60 to 89 Minutes | 2 (1.9%) | 1 (1.4%) |
| 90 or more Minutes | 20 (19.2%) | 1 (1.4%) |
Time of Departure to Work by Sex in Massena
The most frequent times of departure to work in Massena are 7:00 AM to 7:29 AM (30, 28.8%) for males and 7:00 AM to 7:29 AM (27, 38.6%) for females.
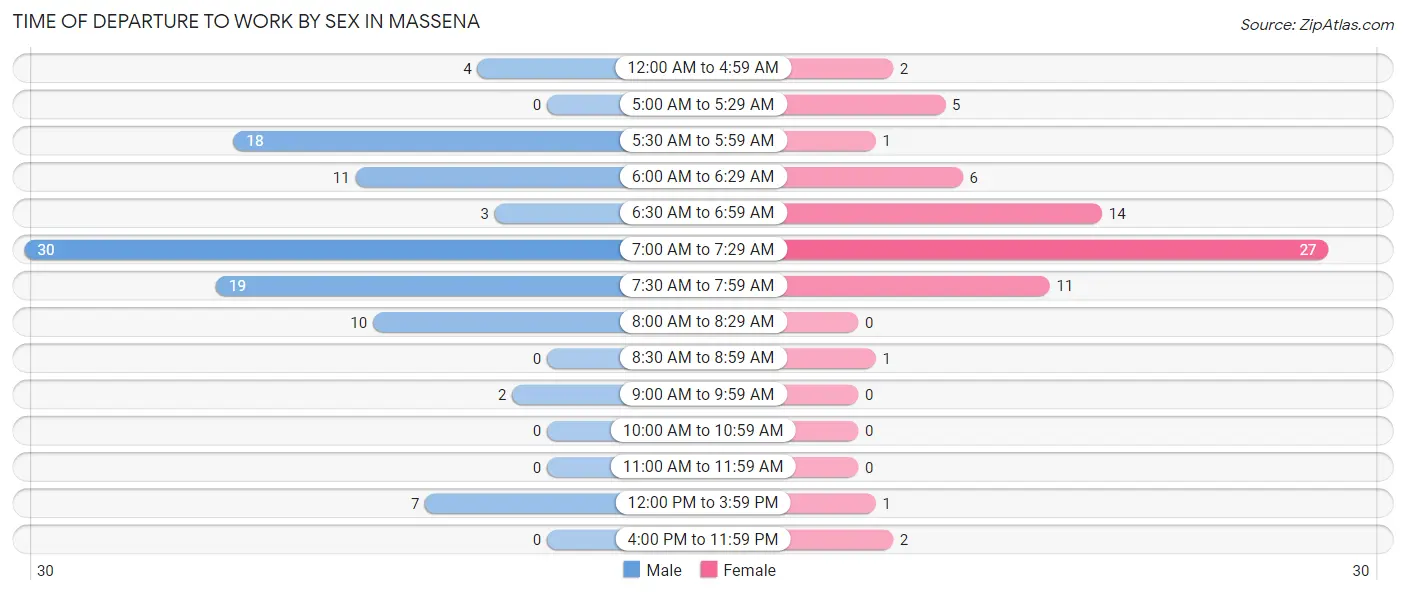
| Time of Departure | Male | Female |
| 12:00 AM to 4:59 AM | 4 (3.8%) | 2 (2.9%) |
| 5:00 AM to 5:29 AM | 0 (0.0%) | 5 (7.1%) |
| 5:30 AM to 5:59 AM | 18 (17.3%) | 1 (1.4%) |
| 6:00 AM to 6:29 AM | 11 (10.6%) | 6 (8.6%) |
| 6:30 AM to 6:59 AM | 3 (2.9%) | 14 (20.0%) |
| 7:00 AM to 7:29 AM | 30 (28.8%) | 27 (38.6%) |
| 7:30 AM to 7:59 AM | 19 (18.3%) | 11 (15.7%) |
| 8:00 AM to 8:29 AM | 10 (9.6%) | 0 (0.0%) |
| 8:30 AM to 8:59 AM | 0 (0.0%) | 1 (1.4%) |
| 9:00 AM to 9:59 AM | 2 (1.9%) | 0 (0.0%) |
| 10:00 AM to 10:59 AM | 0 (0.0%) | 0 (0.0%) |
| 11:00 AM to 11:59 AM | 0 (0.0%) | 0 (0.0%) |
| 12:00 PM to 3:59 PM | 7 (6.7%) | 1 (1.4%) |
| 4:00 PM to 11:59 PM | 0 (0.0%) | 2 (2.9%) |
| Total | 104 (100.0%) | 70 (100.0%) |
Housing Occupancy in Massena
Occupancy by Ownership in Massena
Of the total 159 dwellings in Massena, owner-occupied units account for 107 (67.3%), while renter-occupied units make up 52 (32.7%).
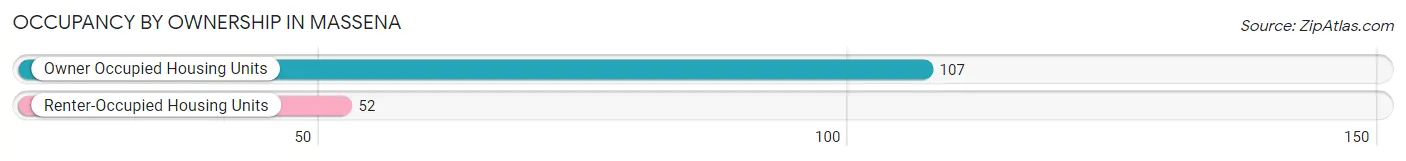
| Occupancy | # Housing Units | % Housing Units |
| Owner Occupied Housing Units | 107 | 67.3% |
| Renter-Occupied Housing Units | 52 | 32.7% |
| Total Occupied Housing Units | 159 | 100.0% |
Occupancy by Household Size in Massena
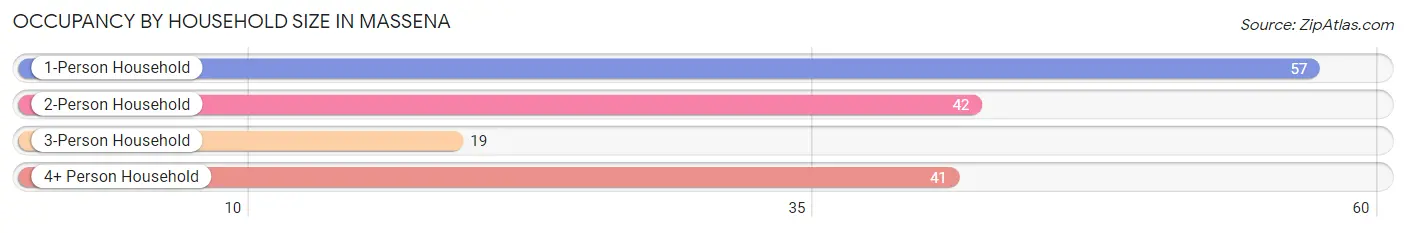
| Household Size | # Housing Units | % Housing Units |
| 1-Person Household | 57 | 35.8% |
| 2-Person Household | 42 | 26.4% |
| 3-Person Household | 19 | 11.9% |
| 4+ Person Household | 41 | 25.8% |
| Total Housing Units | 159 | 100.0% |
Occupancy by Ownership by Household Size in Massena
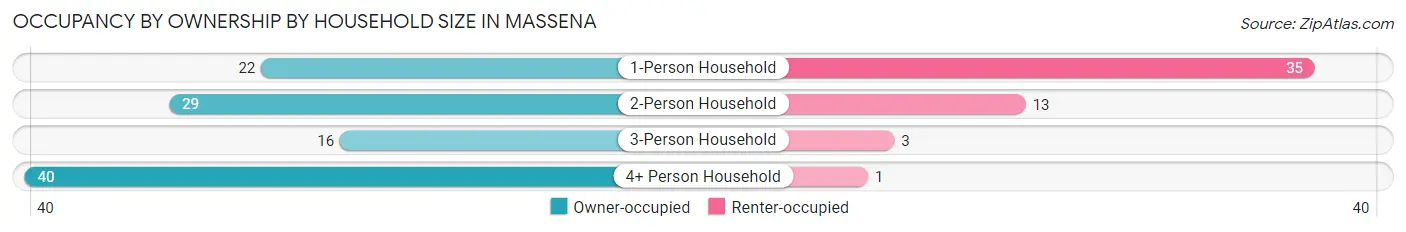
| Household Size | Owner-occupied | Renter-occupied |
| 1-Person Household | 22 (38.6%) | 35 (61.4%) |
| 2-Person Household | 29 (69.1%) | 13 (30.9%) |
| 3-Person Household | 16 (84.2%) | 3 (15.8%) |
| 4+ Person Household | 40 (97.6%) | 1 (2.4%) |
| Total Housing Units | 107 (67.3%) | 52 (32.7%) |
Occupancy by Educational Attainment in Massena
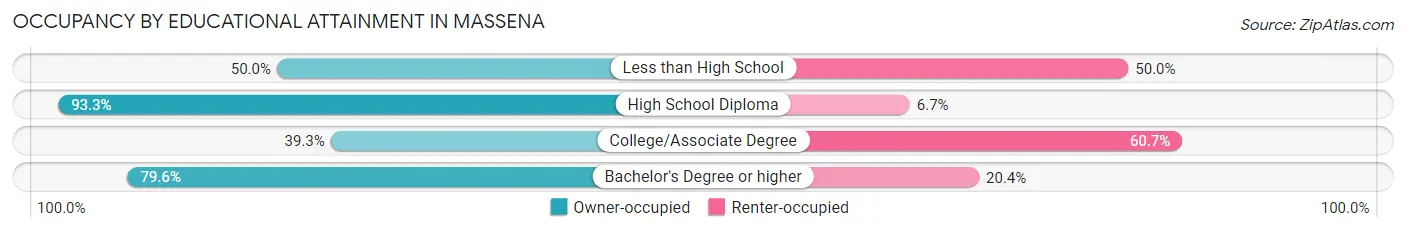
| Household Size | Owner-occupied | Renter-occupied |
| Less than High School | 2 (50.0%) | 2 (50.0%) |
| High School Diploma | 42 (93.3%) | 3 (6.7%) |
| College/Associate Degree | 24 (39.3%) | 37 (60.7%) |
| Bachelor's Degree or higher | 39 (79.6%) | 10 (20.4%) |
Occupancy by Age of Householder in Massena
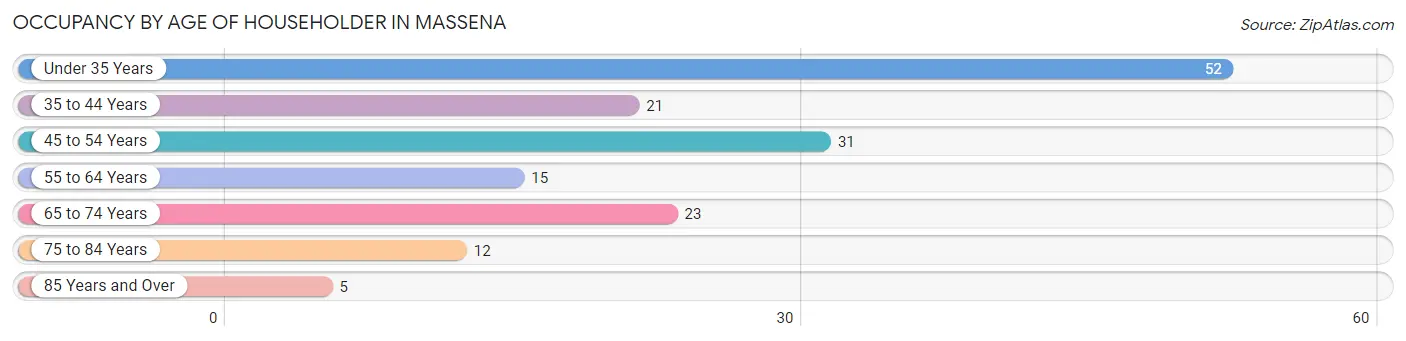
| Age Bracket | # Households | % Households |
| Under 35 Years | 52 | 32.7% |
| 35 to 44 Years | 21 | 13.2% |
| 45 to 54 Years | 31 | 19.5% |
| 55 to 64 Years | 15 | 9.4% |
| 65 to 74 Years | 23 | 14.5% |
| 75 to 84 Years | 12 | 7.5% |
| 85 Years and Over | 5 | 3.1% |
| Total | 159 | 100.0% |
Housing Finances in Massena
Median Income by Occupancy in Massena
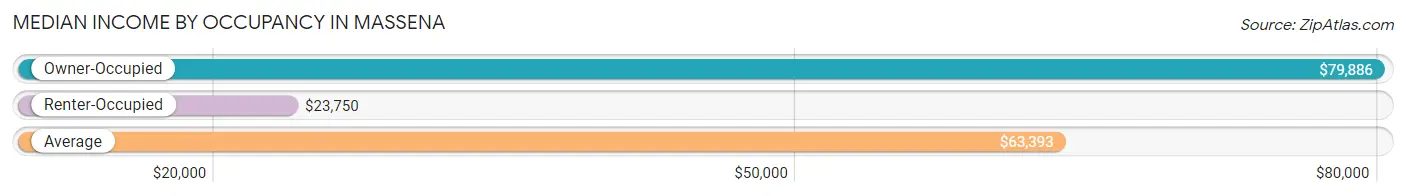
| Occupancy Type | # Households | Median Income |
| Owner-Occupied | 107 (67.3%) | $79,886 |
| Renter-Occupied | 52 (32.7%) | $23,750 |
| Average | 159 (100.0%) | $63,393 |
Occupancy by Householder Income Bracket in Massena
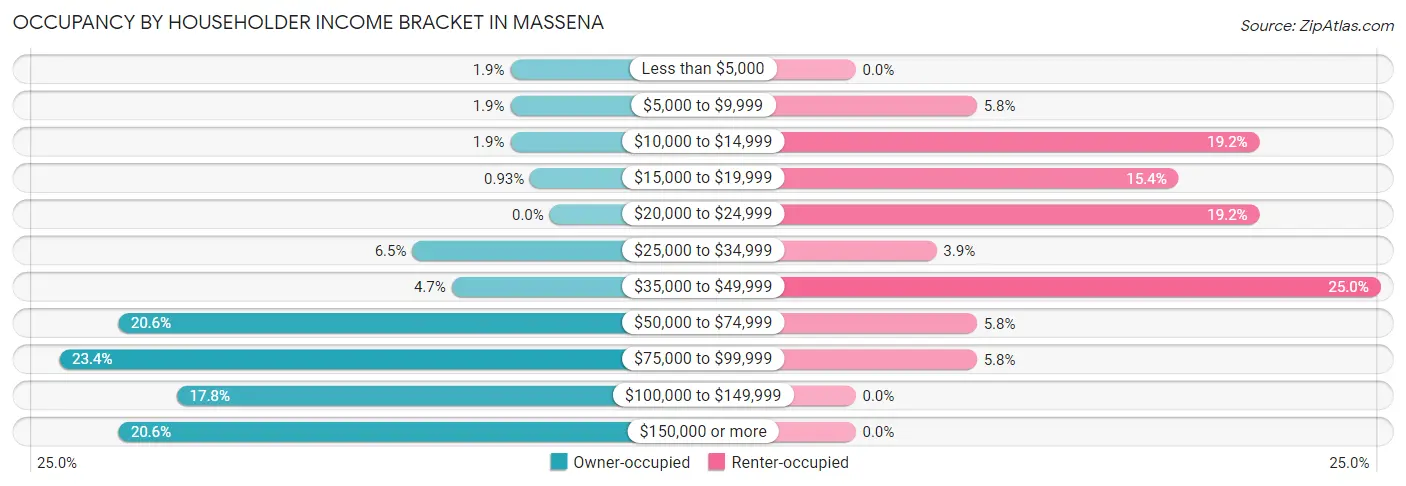
| Income Bracket | Owner-occupied | Renter-occupied |
| Less than $5,000 | 2 (1.9%) | 0 (0.0%) |
| $5,000 to $9,999 | 2 (1.9%) | 3 (5.8%) |
| $10,000 to $14,999 | 2 (1.9%) | 10 (19.2%) |
| $15,000 to $19,999 | 1 (0.9%) | 8 (15.4%) |
| $20,000 to $24,999 | 0 (0.0%) | 10 (19.2%) |
| $25,000 to $34,999 | 7 (6.5%) | 2 (3.8%) |
| $35,000 to $49,999 | 5 (4.7%) | 13 (25.0%) |
| $50,000 to $74,999 | 22 (20.6%) | 3 (5.8%) |
| $75,000 to $99,999 | 25 (23.4%) | 3 (5.8%) |
| $100,000 to $149,999 | 19 (17.8%) | 0 (0.0%) |
| $150,000 or more | 22 (20.6%) | 0 (0.0%) |
| Total | 107 (100.0%) | 52 (100.0%) |
Monthly Housing Cost Tiers in Massena
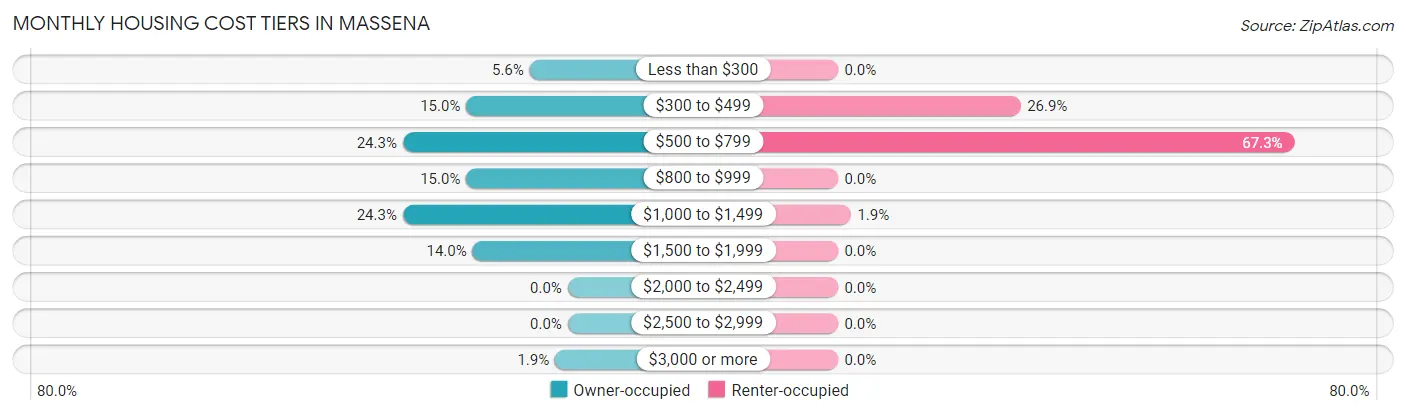
| Monthly Cost | Owner-occupied | Renter-occupied |
| Less than $300 | 6 (5.6%) | 0 (0.0%) |
| $300 to $499 | 16 (14.9%) | 14 (26.9%) |
| $500 to $799 | 26 (24.3%) | 35 (67.3%) |
| $800 to $999 | 16 (14.9%) | 0 (0.0%) |
| $1,000 to $1,499 | 26 (24.3%) | 1 (1.9%) |
| $1,500 to $1,999 | 15 (14.0%) | 0 (0.0%) |
| $2,000 to $2,499 | 0 (0.0%) | 0 (0.0%) |
| $2,500 to $2,999 | 0 (0.0%) | 0 (0.0%) |
| $3,000 or more | 2 (1.9%) | 0 (0.0%) |
| Total | 107 (100.0%) | 52 (100.0%) |
Physical Housing Characteristics in Massena
Housing Structures in Massena
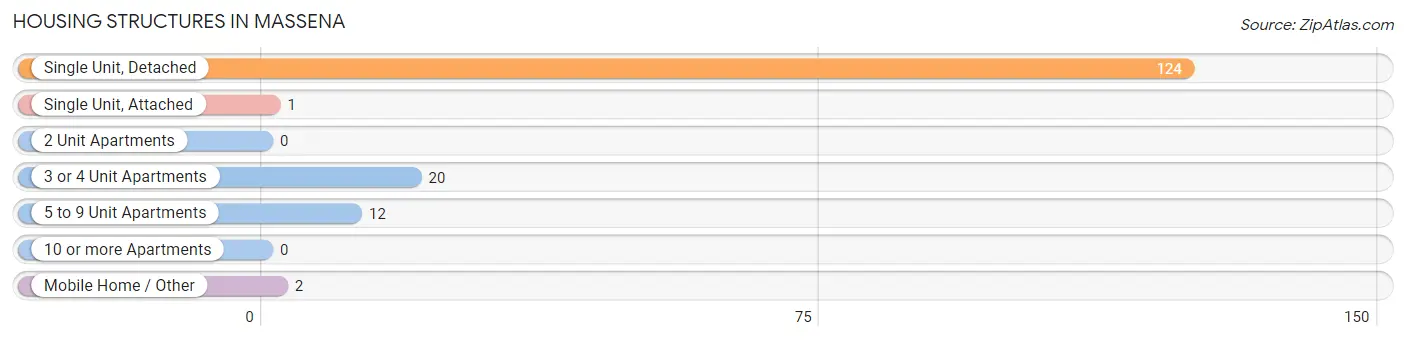
| Structure Type | # Housing Units | % Housing Units |
| Single Unit, Detached | 124 | 78.0% |
| Single Unit, Attached | 1 | 0.6% |
| 2 Unit Apartments | 0 | 0.0% |
| 3 or 4 Unit Apartments | 20 | 12.6% |
| 5 to 9 Unit Apartments | 12 | 7.5% |
| 10 or more Apartments | 0 | 0.0% |
| Mobile Home / Other | 2 | 1.3% |
| Total | 159 | 100.0% |
Housing Structures by Occupancy in Massena
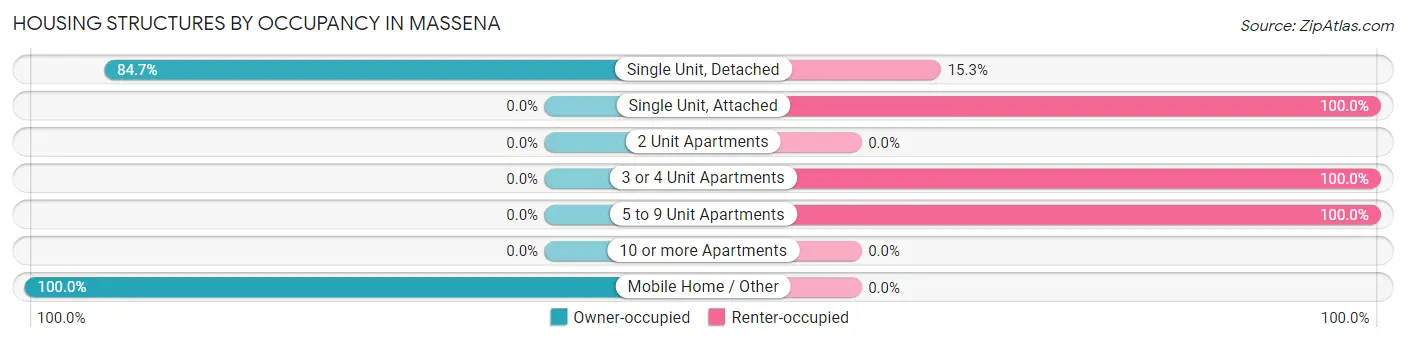
| Structure Type | Owner-occupied | Renter-occupied |
| Single Unit, Detached | 105 (84.7%) | 19 (15.3%) |
| Single Unit, Attached | 0 (0.0%) | 1 (100.0%) |
| 2 Unit Apartments | 0 (0.0%) | 0 (0.0%) |
| 3 or 4 Unit Apartments | 0 (0.0%) | 20 (100.0%) |
| 5 to 9 Unit Apartments | 0 (0.0%) | 12 (100.0%) |
| 10 or more Apartments | 0 (0.0%) | 0 (0.0%) |
| Mobile Home / Other | 2 (100.0%) | 0 (0.0%) |
| Total | 107 (67.3%) | 52 (32.7%) |
Housing Structures by Number of Rooms in Massena
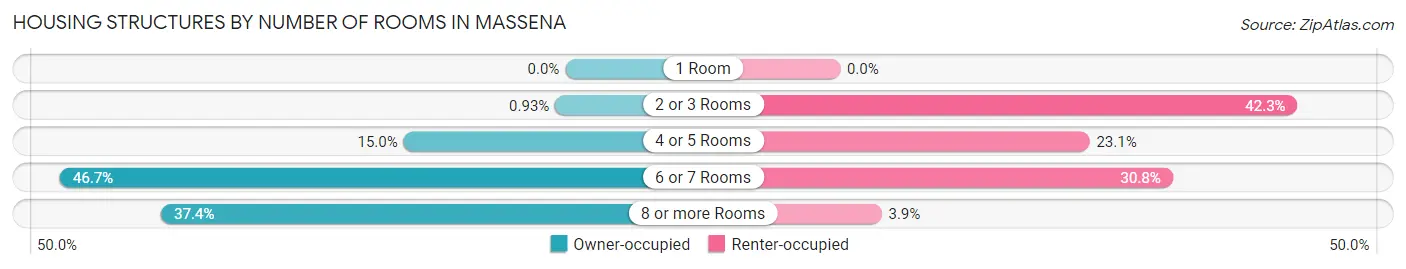
| Number of Rooms | Owner-occupied | Renter-occupied |
| 1 Room | 0 (0.0%) | 0 (0.0%) |
| 2 or 3 Rooms | 1 (0.9%) | 22 (42.3%) |
| 4 or 5 Rooms | 16 (14.9%) | 12 (23.1%) |
| 6 or 7 Rooms | 50 (46.7%) | 16 (30.8%) |
| 8 or more Rooms | 40 (37.4%) | 2 (3.8%) |
| Total | 107 (100.0%) | 52 (100.0%) |
Housing Structure by Heating Type in Massena
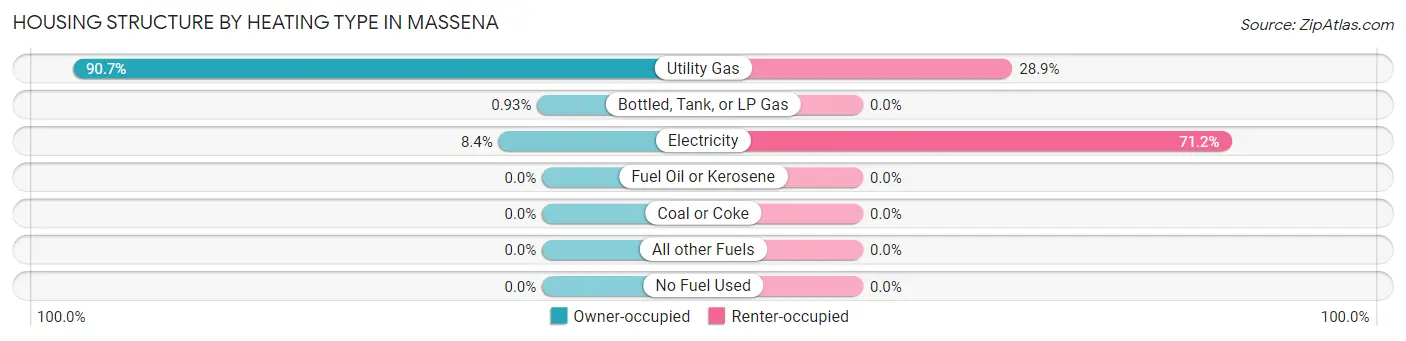
| Heating Type | Owner-occupied | Renter-occupied |
| Utility Gas | 97 (90.6%) | 15 (28.8%) |
| Bottled, Tank, or LP Gas | 1 (0.9%) | 0 (0.0%) |
| Electricity | 9 (8.4%) | 37 (71.2%) |
| Fuel Oil or Kerosene | 0 (0.0%) | 0 (0.0%) |
| Coal or Coke | 0 (0.0%) | 0 (0.0%) |
| All other Fuels | 0 (0.0%) | 0 (0.0%) |
| No Fuel Used | 0 (0.0%) | 0 (0.0%) |
| Total | 107 (100.0%) | 52 (100.0%) |
Household Vehicle Usage in Massena
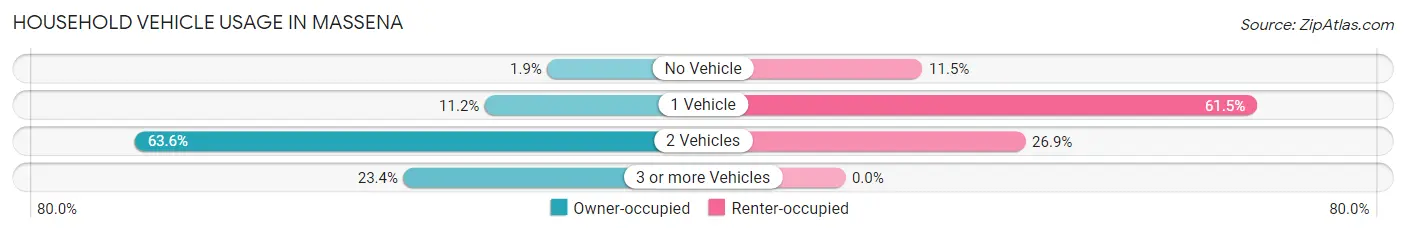
| Vehicles per Household | Owner-occupied | Renter-occupied |
| No Vehicle | 2 (1.9%) | 6 (11.5%) |
| 1 Vehicle | 12 (11.2%) | 32 (61.5%) |
| 2 Vehicles | 68 (63.5%) | 14 (26.9%) |
| 3 or more Vehicles | 25 (23.4%) | 0 (0.0%) |
| Total | 107 (100.0%) | 52 (100.0%) |
Real Estate & Mortgages in Massena
Real Estate and Mortgage Overview in Massena
| Characteristic | Without Mortgage | With Mortgage |
| Housing Units | 45 | 62 |
| Median Property Value | $90,600 | $100,000 |
| Median Household Income | $60,938 | $18 |
| Monthly Housing Costs | $504 | $1 |
| Real Estate Taxes | $1,196 | $1 |
Property Value by Mortgage Status in Massena
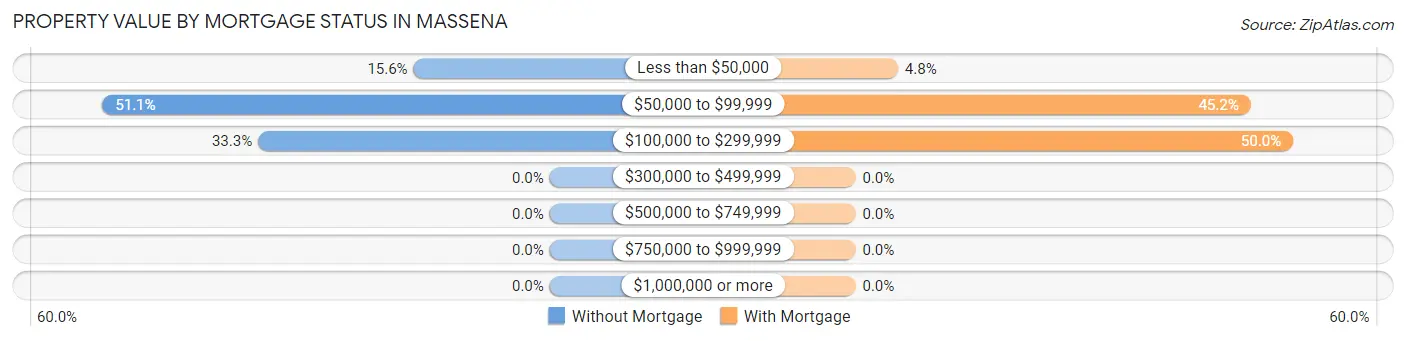
| Property Value | Without Mortgage | With Mortgage |
| Less than $50,000 | 7 (15.6%) | 3 (4.8%) |
| $50,000 to $99,999 | 23 (51.1%) | 28 (45.2%) |
| $100,000 to $299,999 | 15 (33.3%) | 31 (50.0%) |
| $300,000 to $499,999 | 0 (0.0%) | 0 (0.0%) |
| $500,000 to $749,999 | 0 (0.0%) | 0 (0.0%) |
| $750,000 to $999,999 | 0 (0.0%) | 0 (0.0%) |
| $1,000,000 or more | 0 (0.0%) | 0 (0.0%) |
| Total | 45 (100.0%) | 62 (100.0%) |
Household Income by Mortgage Status in Massena
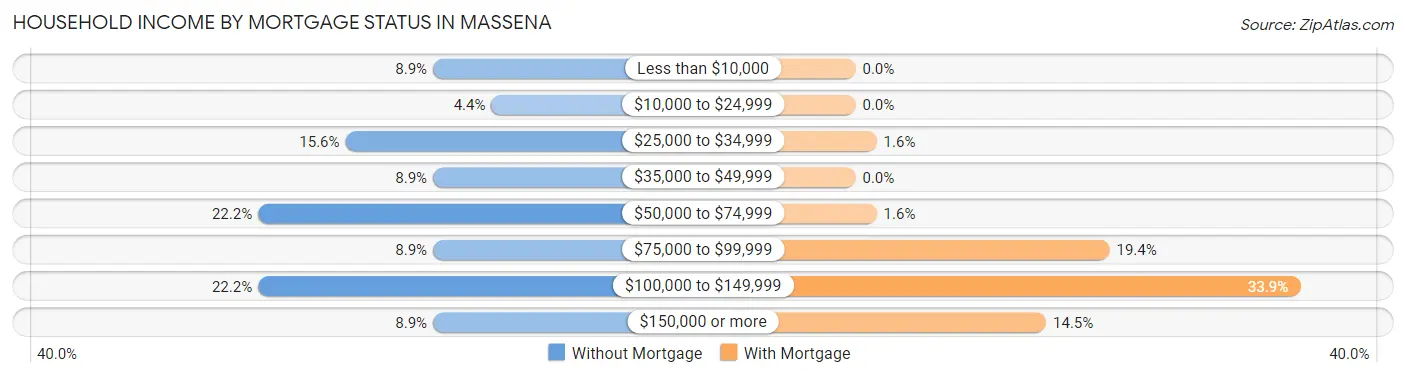
| Household Income | Without Mortgage | With Mortgage |
| Less than $10,000 | 4 (8.9%) | 0 (0.0%) |
| $10,000 to $24,999 | 2 (4.4%) | 0 (0.0%) |
| $25,000 to $34,999 | 7 (15.6%) | 1 (1.6%) |
| $35,000 to $49,999 | 4 (8.9%) | 0 (0.0%) |
| $50,000 to $74,999 | 10 (22.2%) | 1 (1.6%) |
| $75,000 to $99,999 | 4 (8.9%) | 12 (19.4%) |
| $100,000 to $149,999 | 10 (22.2%) | 21 (33.9%) |
| $150,000 or more | 4 (8.9%) | 9 (14.5%) |
| Total | 45 (100.0%) | 62 (100.0%) |
Property Value to Household Income Ratio in Massena
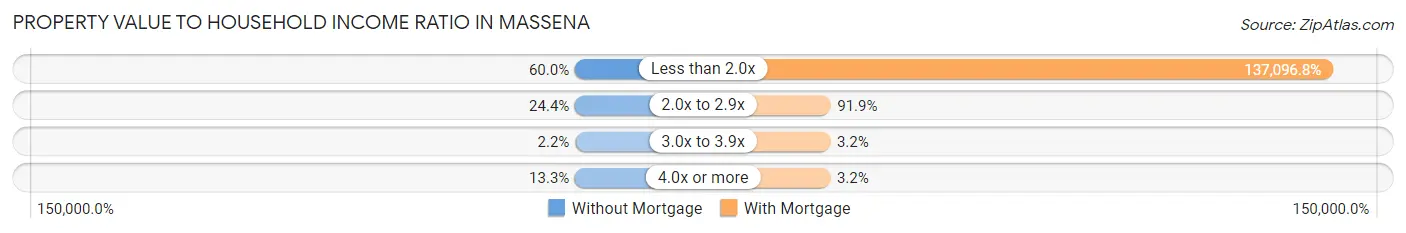
| Value-to-Income Ratio | Without Mortgage | With Mortgage |
| Less than 2.0x | 27 (60.0%) | 85,000 (137,096.8%) |
| 2.0x to 2.9x | 11 (24.4%) | 57 (91.9%) |
| 3.0x to 3.9x | 1 (2.2%) | 2 (3.2%) |
| 4.0x or more | 6 (13.3%) | 2 (3.2%) |
| Total | 45 (100.0%) | 62 (100.0%) |
Real Estate Taxes by Mortgage Status in Massena
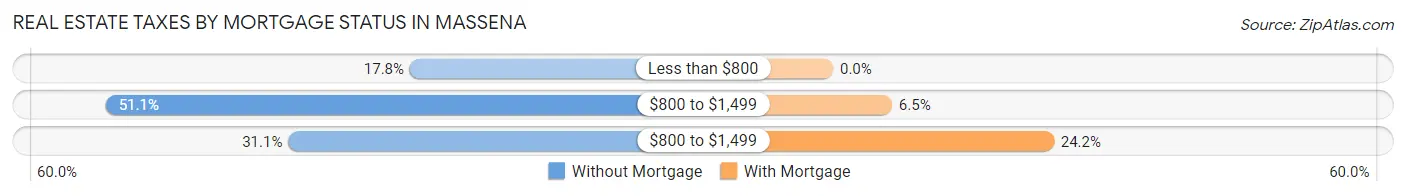
| Property Taxes | Without Mortgage | With Mortgage |
| Less than $800 | 8 (17.8%) | 0 (0.0%) |
| $800 to $1,499 | 23 (51.1%) | 4 (6.5%) |
| $800 to $1,499 | 14 (31.1%) | 15 (24.2%) |
| Total | 45 (100.0%) | 62 (100.0%) |
Health & Disability in Massena
Health Insurance Coverage by Age in Massena
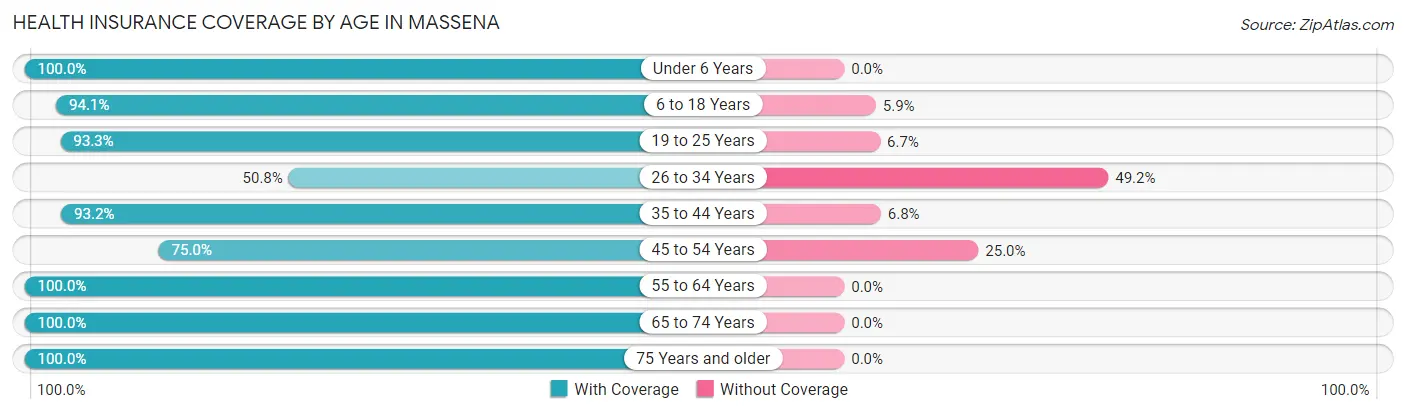
| Age Bracket | With Coverage | Without Coverage |
| Under 6 Years | 35 (100.0%) | 0 (0.0%) |
| 6 to 18 Years | 64 (94.1%) | 4 (5.9%) |
| 19 to 25 Years | 28 (93.3%) | 2 (6.7%) |
| 26 to 34 Years | 33 (50.8%) | 32 (49.2%) |
| 35 to 44 Years | 41 (93.2%) | 3 (6.8%) |
| 45 to 54 Years | 36 (75.0%) | 12 (25.0%) |
| 55 to 64 Years | 23 (100.0%) | 0 (0.0%) |
| 65 to 74 Years | 52 (100.0%) | 0 (0.0%) |
| 75 Years and older | 25 (100.0%) | 0 (0.0%) |
| Total | 337 (86.4%) | 53 (13.6%) |
Health Insurance Coverage by Citizenship Status in Massena
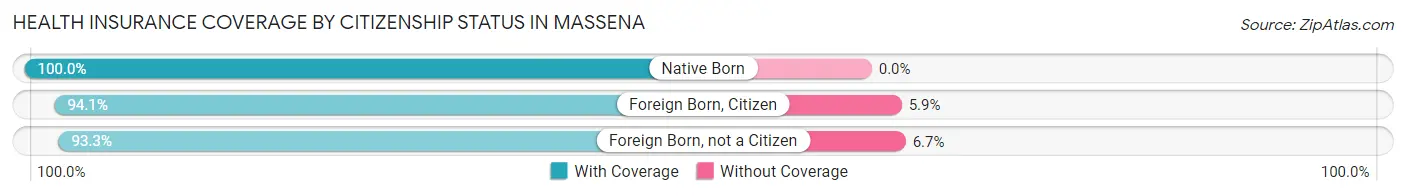
| Citizenship Status | With Coverage | Without Coverage |
| Native Born | 35 (100.0%) | 0 (0.0%) |
| Foreign Born, Citizen | 64 (94.1%) | 4 (5.9%) |
| Foreign Born, not a Citizen | 28 (93.3%) | 2 (6.7%) |
Health Insurance Coverage by Household Income in Massena
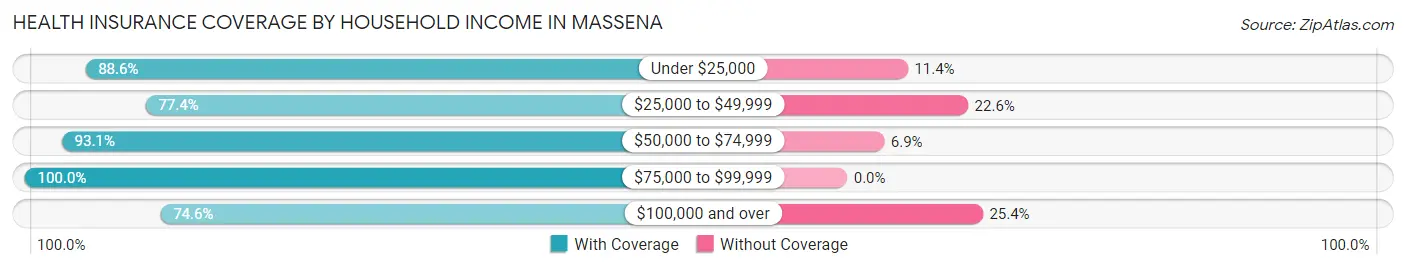
| Household Income | With Coverage | Without Coverage |
| Under $25,000 | 39 (88.6%) | 5 (11.4%) |
| $25,000 to $49,999 | 41 (77.4%) | 12 (22.6%) |
| $50,000 to $74,999 | 67 (93.1%) | 5 (6.9%) |
| $75,000 to $99,999 | 99 (100.0%) | 0 (0.0%) |
| $100,000 and over | 91 (74.6%) | 31 (25.4%) |
Public vs Private Health Insurance Coverage by Age in Massena
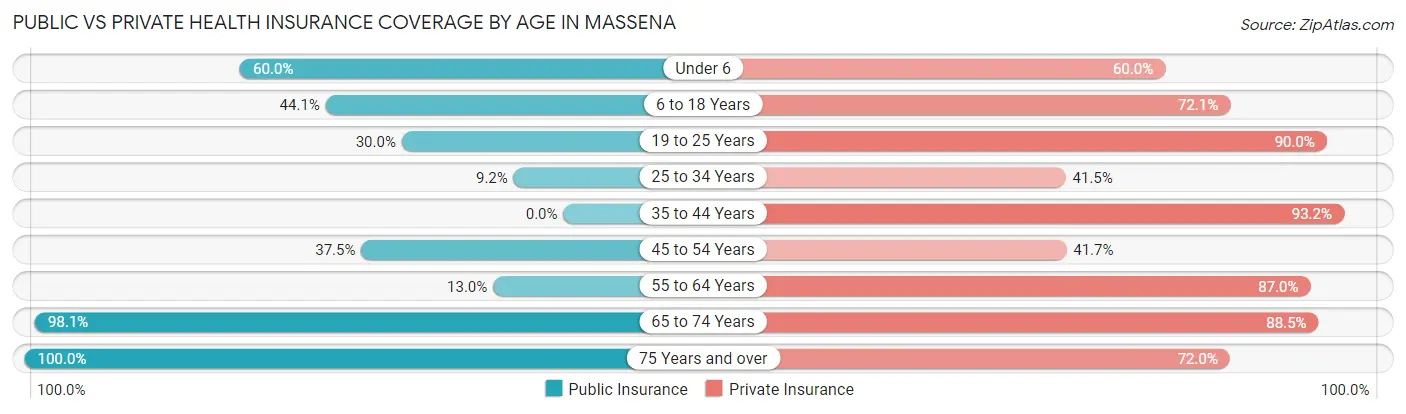
| Age Bracket | Public Insurance | Private Insurance |
| Under 6 | 21 (60.0%) | 21 (60.0%) |
| 6 to 18 Years | 30 (44.1%) | 49 (72.1%) |
| 19 to 25 Years | 9 (30.0%) | 27 (90.0%) |
| 25 to 34 Years | 6 (9.2%) | 27 (41.5%) |
| 35 to 44 Years | 0 (0.0%) | 41 (93.2%) |
| 45 to 54 Years | 18 (37.5%) | 20 (41.7%) |
| 55 to 64 Years | 3 (13.0%) | 20 (87.0%) |
| 65 to 74 Years | 51 (98.1%) | 46 (88.5%) |
| 75 Years and over | 25 (100.0%) | 18 (72.0%) |
| Total | 163 (41.8%) | 269 (69.0%) |
Disability Status by Sex by Age in Massena
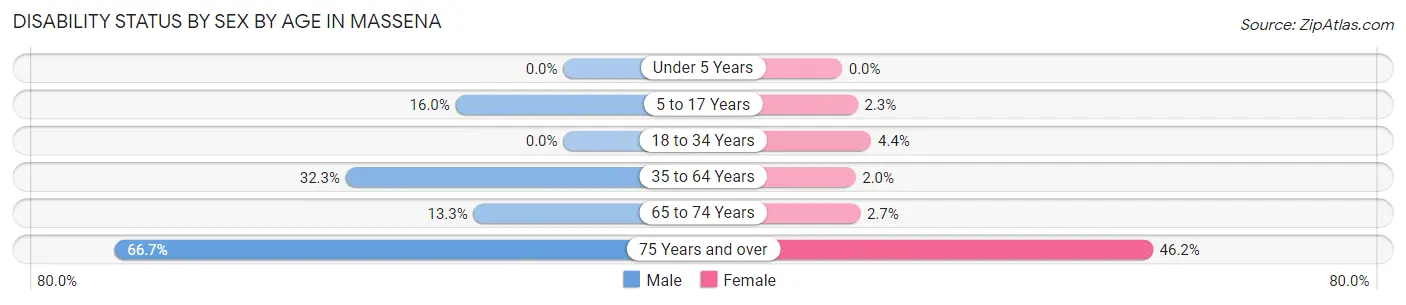
| Age Bracket | Male | Female |
| Under 5 Years | 0 (0.0%) | 0 (0.0%) |
| 5 to 17 Years | 4 (16.0%) | 1 (2.3%) |
| 18 to 34 Years | 0 (0.0%) | 2 (4.3%) |
| 35 to 64 Years | 21 (32.3%) | 1 (2.0%) |
| 65 to 74 Years | 2 (13.3%) | 1 (2.7%) |
| 75 Years and over | 8 (66.7%) | 6 (46.2%) |
Disability Class by Sex by Age in Massena
Disability Class: Hearing Difficulty
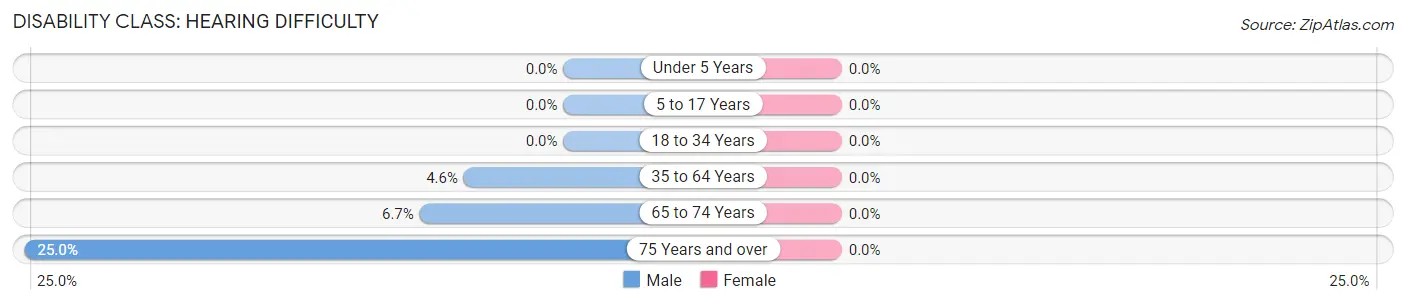
| Age Bracket | Male | Female |
| Under 5 Years | 0 (0.0%) | 0 (0.0%) |
| 5 to 17 Years | 0 (0.0%) | 0 (0.0%) |
| 18 to 34 Years | 0 (0.0%) | 0 (0.0%) |
| 35 to 64 Years | 3 (4.6%) | 0 (0.0%) |
| 65 to 74 Years | 1 (6.7%) | 0 (0.0%) |
| 75 Years and over | 3 (25.0%) | 0 (0.0%) |
Disability Class: Vision Difficulty
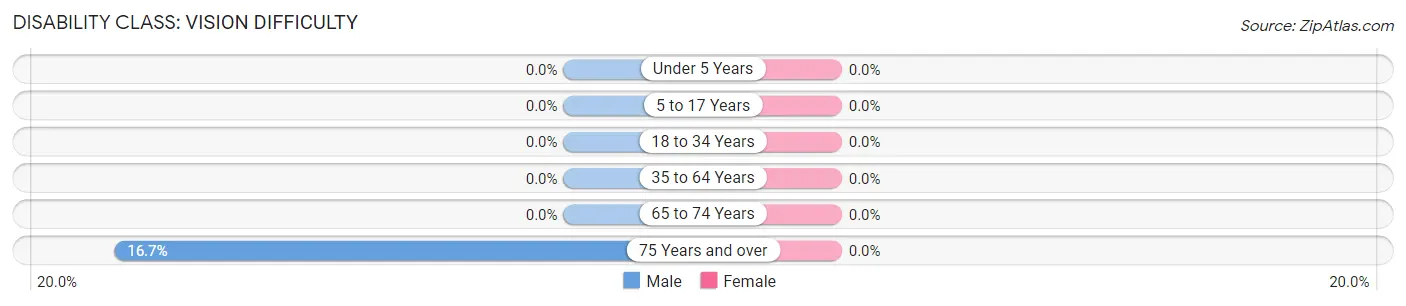
| Age Bracket | Male | Female |
| Under 5 Years | 0 (0.0%) | 0 (0.0%) |
| 5 to 17 Years | 0 (0.0%) | 0 (0.0%) |
| 18 to 34 Years | 0 (0.0%) | 0 (0.0%) |
| 35 to 64 Years | 0 (0.0%) | 0 (0.0%) |
| 65 to 74 Years | 0 (0.0%) | 0 (0.0%) |
| 75 Years and over | 2 (16.7%) | 0 (0.0%) |
Disability Class: Cognitive Difficulty
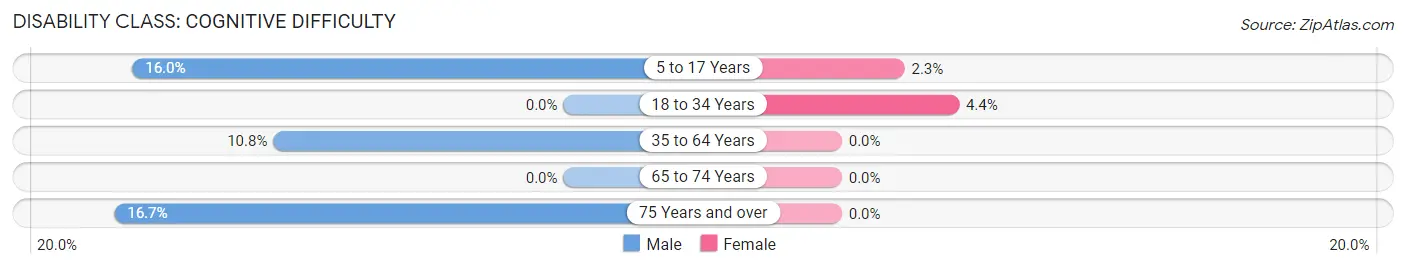
| Age Bracket | Male | Female |
| 5 to 17 Years | 4 (16.0%) | 1 (2.3%) |
| 18 to 34 Years | 0 (0.0%) | 2 (4.3%) |
| 35 to 64 Years | 7 (10.8%) | 0 (0.0%) |
| 65 to 74 Years | 0 (0.0%) | 0 (0.0%) |
| 75 Years and over | 2 (16.7%) | 0 (0.0%) |
Disability Class: Ambulatory Difficulty
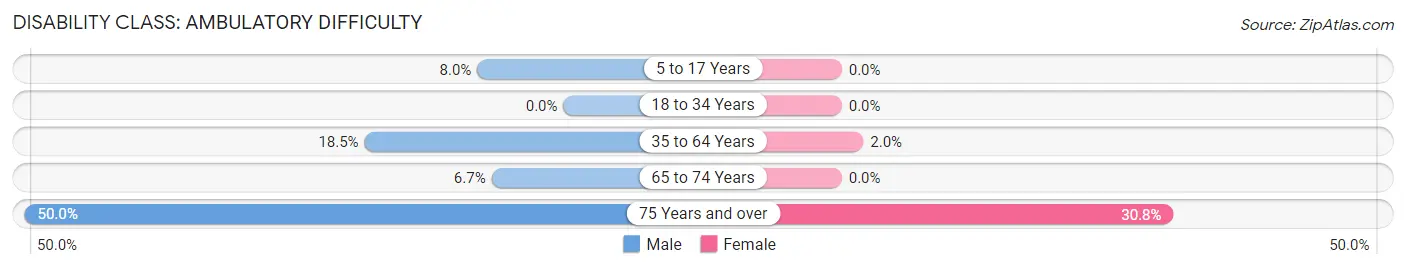
| Age Bracket | Male | Female |
| 5 to 17 Years | 2 (8.0%) | 0 (0.0%) |
| 18 to 34 Years | 0 (0.0%) | 0 (0.0%) |
| 35 to 64 Years | 12 (18.5%) | 1 (2.0%) |
| 65 to 74 Years | 1 (6.7%) | 0 (0.0%) |
| 75 Years and over | 6 (50.0%) | 4 (30.8%) |
Disability Class: Self-Care Difficulty
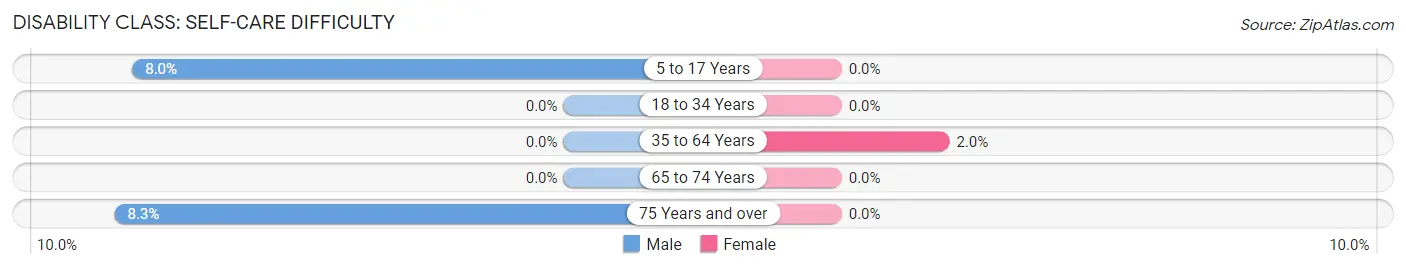
| Age Bracket | Male | Female |
| 5 to 17 Years | 2 (8.0%) | 0 (0.0%) |
| 18 to 34 Years | 0 (0.0%) | 0 (0.0%) |
| 35 to 64 Years | 0 (0.0%) | 1 (2.0%) |
| 65 to 74 Years | 0 (0.0%) | 0 (0.0%) |
| 75 Years and over | 1 (8.3%) | 0 (0.0%) |
Technology Access in Massena
Computing Device Access in Massena
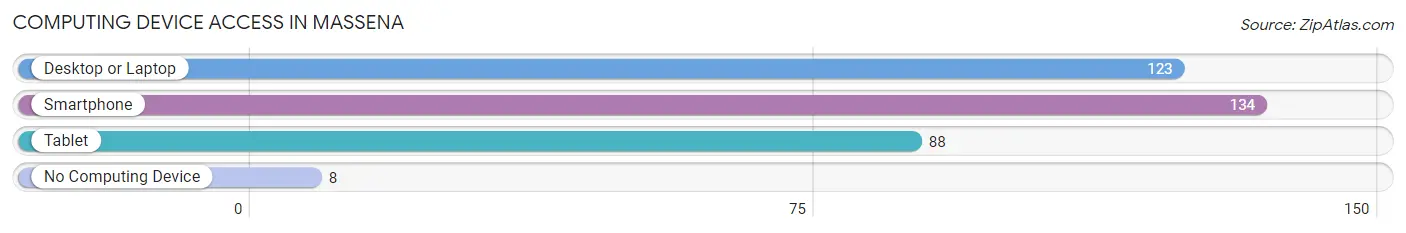
| Device Type | # Households | % Households |
| Desktop or Laptop | 123 | 77.4% |
| Smartphone | 134 | 84.3% |
| Tablet | 88 | 55.3% |
| No Computing Device | 8 | 5.0% |
| Total | 159 | 100.0% |
Internet Access in Massena
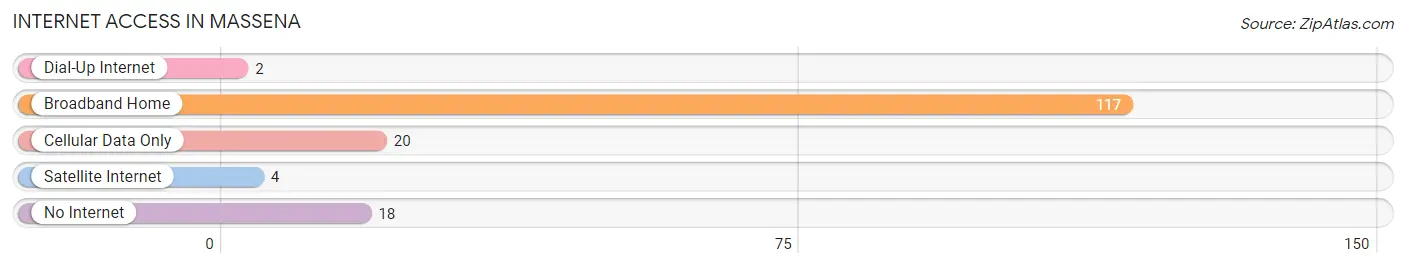
| Internet Type | # Households | % Households |
| Dial-Up Internet | 2 | 1.3% |
| Broadband Home | 117 | 73.6% |
| Cellular Data Only | 20 | 12.6% |
| Satellite Internet | 4 | 2.5% |
| No Internet | 18 | 11.3% |
| Total | 159 | 100.0% |
Massena Summary
History
Massena is a small town located in Cass County, Iowa. It was founded in 1856 by a group of settlers from Ohio. The town was named after a French general, Jean-Baptiste Massena, who fought in the Napoleonic Wars. The town was originally a farming community, but it soon developed into a small manufacturing center. The first industry in Massena was a sawmill, which was built in 1858. This was followed by a grist mill, a woolen mill, a brickyard, and a furniture factory.
In the late 19th century, Massena was a thriving community with a population of over 1,000 people. The town had several churches, a school, a bank, a post office, and a variety of stores and businesses. The town was also home to a number of fraternal organizations, including the Odd Fellows, the Masons, and the Knights of Pythias.
In the early 20th century, Massena experienced a period of decline. The sawmill and grist mill closed, and the furniture factory moved away. The population of the town decreased to just over 500 people by the 1950s.
In the late 20th century, Massena began to experience a resurgence. The town was revitalized by the construction of a new school, a new library, and a new community center. The population of the town has grown to over 1,000 people in recent years.
Geography
Massena is located in the rolling hills of southwestern Iowa. The town is situated on the banks of the North Raccoon River, which flows through the town. The town is surrounded by farmland, and the nearby towns of Anita, Atlantic, and Audubon are all within a few miles of Massena.
The climate in Massena is typical of the Midwest, with hot summers and cold winters. The average temperature in the summer is around 75 degrees Fahrenheit, and the average temperature in the winter is around 25 degrees Fahrenheit.
Economy
The economy of Massena is largely based on agriculture. The town is surrounded by farmland, and many of the town’s residents are employed in the agricultural industry. The town also has a number of small businesses, including a grocery store, a hardware store, and a restaurant.
The town is also home to a number of manufacturing companies, including a furniture factory, a plastics factory, and a metal fabrication plant. These companies provide employment for many of the town’s residents.
Demographics
As of the 2010 census, the population of Massena was 1,092. The town has a median age of 41.7 years, and the median household income is $45,000. The town is predominantly white, with 92.3% of the population identifying as white. The town also has a small Hispanic population, with 4.3% of the population identifying as Hispanic or Latino.
Massena is a small town with a rich history and a bright future. The town has experienced a period of revitalization in recent years, and it is now a thriving community with a diverse economy and a vibrant culture.
Common Questions
What is Per Capita Income in Massena?
Per Capita income in Massena is $31,202.
What is the Median Family Income in Massena?
Median Family Income in Massena is $82,000.
What is the Median Household income in Massena?
Median Household Income in Massena is $63,393.
What is Income or Wage Gap in Massena?
Income or Wage Gap in Massena is 0.8%.
Women in Massena earn 99.2 cents for every dollar earned by a man.
What is Inequality or Gini Index in Massena?
Inequality or Gini Index in Massena is 0.40.
What is the Total Population of Massena?
Total Population of Massena is 390.
What is the Total Male Population of Massena?
Total Male Population of Massena is 181.
What is the Total Female Population of Massena?
Total Female Population of Massena is 209.
What is the Ratio of Males per 100 Females in Massena?
There are 86.60 Males per 100 Females in Massena.
What is the Ratio of Females per 100 Males in Massena?
There are 115.47 Females per 100 Males in Massena.
What is the Median Population Age in Massena?
Median Population Age in Massena is 33.9 Years.
What is the Average Family Size in Massena
Average Family Size in Massena is 3.3 People.
What is the Average Household Size in Massena
Average Household Size in Massena is 2.5 People.
How Large is the Labor Force in Massena?
There are 187 People in the Labor Forcein in Massena.
What is the Percentage of People in the Labor Force in Massena?
60.3% of People are in the Labor Force in Massena.
What is the Unemployment Rate in Massena?
Unemployment Rate in Massena is 5.3%.