Brayton, IA
Brayton Map
Brayton Overview
104
TOTAL POPULATION
58
MALE POPULATION
46
FEMALE POPULATION
126.09
MALES / 100 FEMALES
79.31
FEMALES / 100 MALES
45.0
MEDIAN AGE
2.8
AVG FAMILY SIZE
2.3
AVG HOUSEHOLD SIZE
$35,960
PER CAPITA INCOME
$81,667
AVG FAMILY INCOME
$73,750
AVG HOUSEHOLD INCOME
10.3%
WAGE / INCOME GAP [ % ]
89.7¢/ $1
WAGE / INCOME GAP [ $ ]
0.42
INEQUALITY / GINI INDEX
71
LABOR FORCE [ PEOPLE ]
74.0%
PERCENT IN LABOR FORCE
1.4%
UNEMPLOYMENT RATE
Brayton Zip Codes
Brayton Area Codes
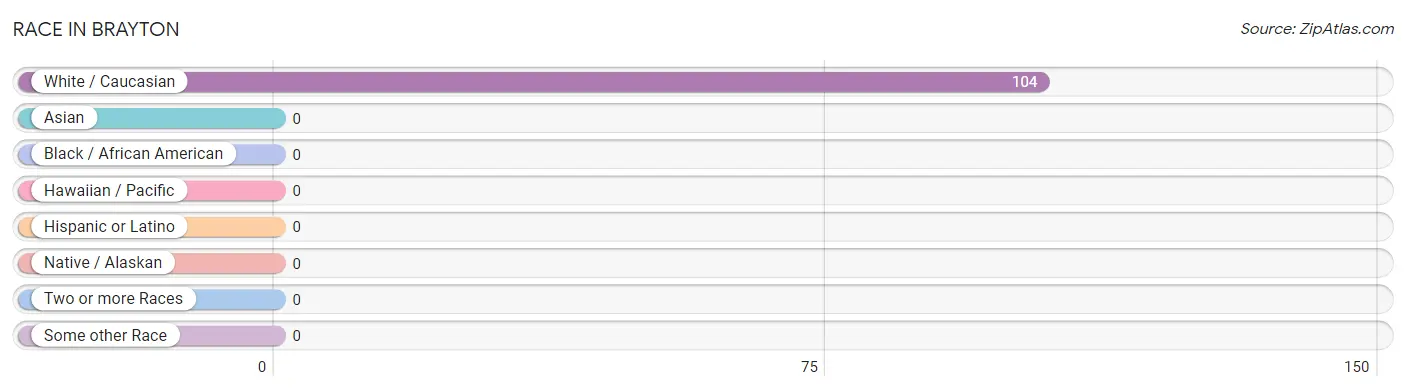
Race in Brayton
The most populous races in Brayton are , and White / Caucasian (104 | 100.0%).
| Race | # Population | % Population |
| Asian | 0 | 0.0% |
| Black / African American | 0 | 0.0% |
| Hawaiian / Pacific | 0 | 0.0% |
| Hispanic or Latino | 0 | 0.0% |
| Native / Alaskan | 0 | 0.0% |
| White / Caucasian | 104 | 100.0% |
| Two or more Races | 0 | 0.0% |
| Some other Race | 0 | 0.0% |
| Total | 104 | 100.0% |
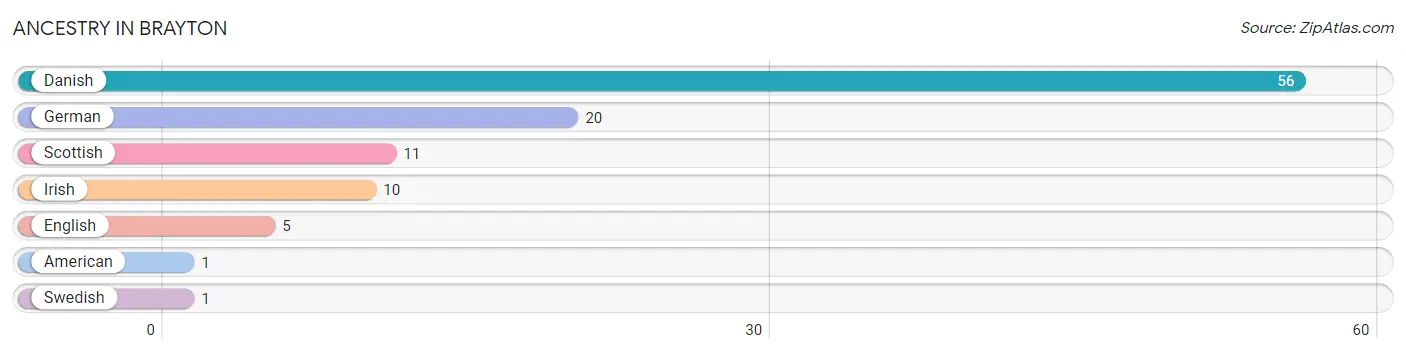
Ancestry in Brayton
The most populous ancestries reported in Brayton are Danish (56 | 53.8%), German (20 | 19.2%), Scottish (11 | 10.6%), Irish (10 | 9.6%), and English (5 | 4.8%), together accounting for 98.1% of all Brayton residents.
| Ancestry | # Population | % Population |
| American | 1 | 1.0% |
| Danish | 56 | 53.8% |
| English | 5 | 4.8% |
| German | 20 | 19.2% |
| Irish | 10 | 9.6% |
| Scottish | 11 | 10.6% |
| Swedish | 1 | 1.0% | View All 7 Rows |
Immigrants in Brayton

| Immigration Origin | # Population | % Population | View All 0 Rows |
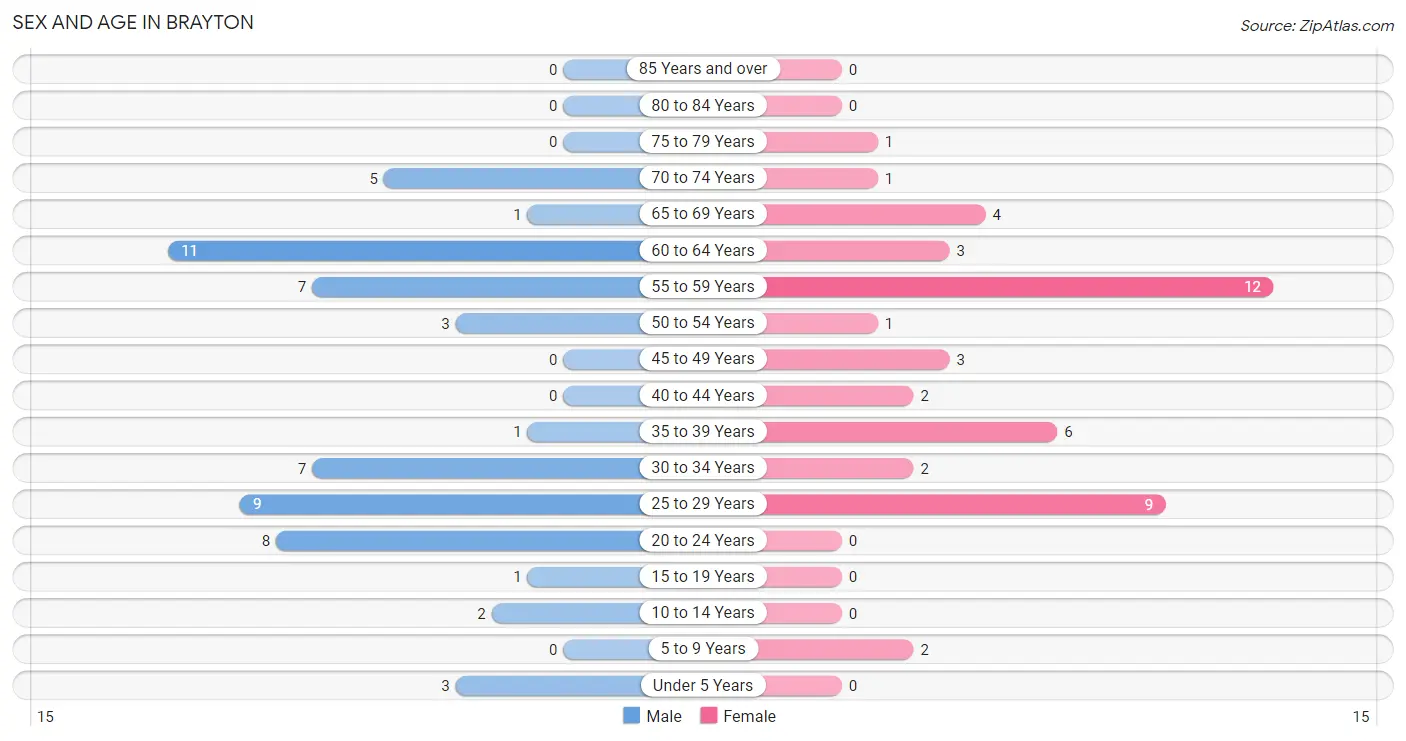
Sex and Age in Brayton
Sex and Age in Brayton
The most populous age groups in Brayton are 60 to 64 Years (11 | 19.0%) for men and 55 to 59 Years (12 | 26.1%) for women.
| Age Bracket | Male | Female |
| Under 5 Years | 3 (5.2%) | 0 (0.0%) |
| 5 to 9 Years | 0 (0.0%) | 2 (4.3%) |
| 10 to 14 Years | 2 (3.5%) | 0 (0.0%) |
| 15 to 19 Years | 1 (1.7%) | 0 (0.0%) |
| 20 to 24 Years | 8 (13.8%) | 0 (0.0%) |
| 25 to 29 Years | 9 (15.5%) | 9 (19.6%) |
| 30 to 34 Years | 7 (12.1%) | 2 (4.3%) |
| 35 to 39 Years | 1 (1.7%) | 6 (13.0%) |
| 40 to 44 Years | 0 (0.0%) | 2 (4.3%) |
| 45 to 49 Years | 0 (0.0%) | 3 (6.5%) |
| 50 to 54 Years | 3 (5.2%) | 1 (2.2%) |
| 55 to 59 Years | 7 (12.1%) | 12 (26.1%) |
| 60 to 64 Years | 11 (19.0%) | 3 (6.5%) |
| 65 to 69 Years | 1 (1.7%) | 4 (8.7%) |
| 70 to 74 Years | 5 (8.6%) | 1 (2.2%) |
| 75 to 79 Years | 0 (0.0%) | 1 (2.2%) |
| 80 to 84 Years | 0 (0.0%) | 0 (0.0%) |
| 85 Years and over | 0 (0.0%) | 0 (0.0%) |
| Total | 58 (100.0%) | 46 (100.0%) |
Families and Households in Brayton
Median Family Size in Brayton
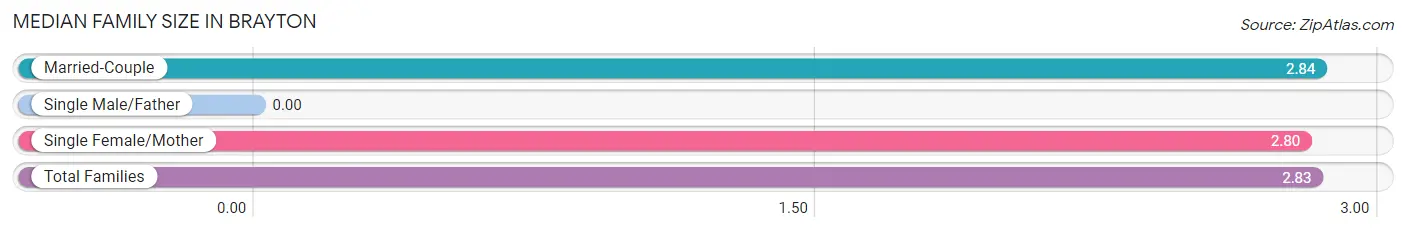
| Family Type | # Families | Family Size |
| Married-Couple | 25 (83.3%) | 2.84 |
| Single Male/Father | 0 (0.0%) | - |
| Single Female/Mother | 5 (16.7%) | 2.80 |
| Total Families | 30 (100.0%) | 2.83 |
Median Household Size in Brayton
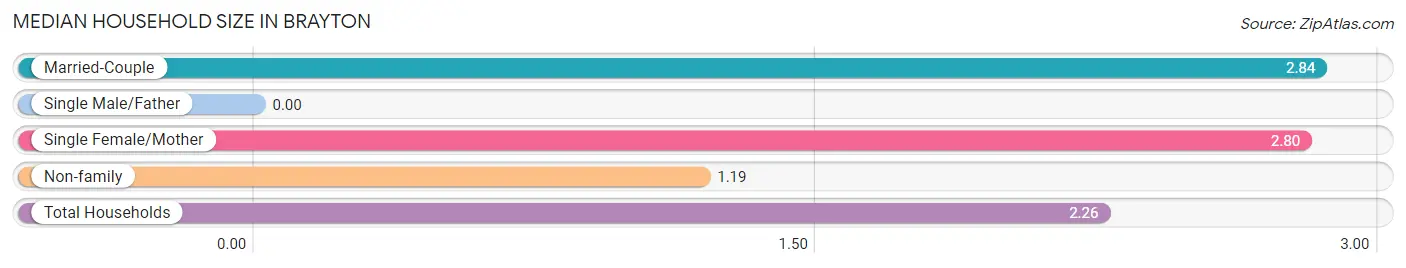
| Household Type | # Households | Household Size |
| Married-Couple | 25 (54.3%) | 2.84 |
| Single Male/Father | 0 (0.0%) | - |
| Single Female/Mother | 5 (10.9%) | 2.80 |
| Non-family | 16 (34.8%) | 1.19 |
| Total Households | 46 (100.0%) | 2.26 |
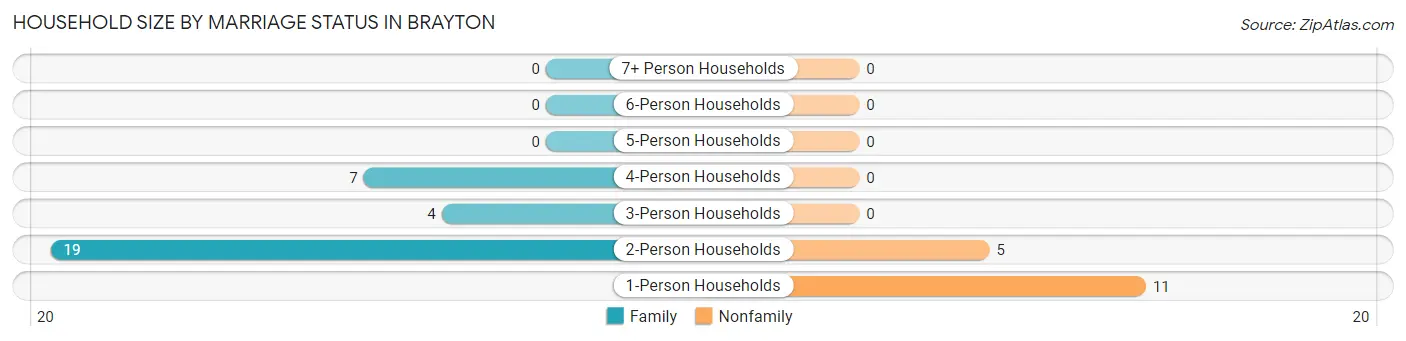
Household Size by Marriage Status in Brayton
Out of a total of 46 households in Brayton, 30 (65.2%) are family households, while 16 (34.8%) are nonfamily households. The most numerous type of family households are 2-person households, comprising 19, and the most common type of nonfamily households are 1-person households, comprising 11.
| Household Size | Family Households | Nonfamily Households |
| 1-Person Households | - | 11 (23.9%) |
| 2-Person Households | 19 (41.3%) | 5 (10.9%) |
| 3-Person Households | 4 (8.7%) | 0 (0.0%) |
| 4-Person Households | 7 (15.2%) | 0 (0.0%) |
| 5-Person Households | 0 (0.0%) | 0 (0.0%) |
| 6-Person Households | 0 (0.0%) | 0 (0.0%) |
| 7+ Person Households | 0 (0.0%) | 0 (0.0%) |
| Total | 30 (65.2%) | 16 (34.8%) |
Female Fertility in Brayton
Fertility by Age in Brayton
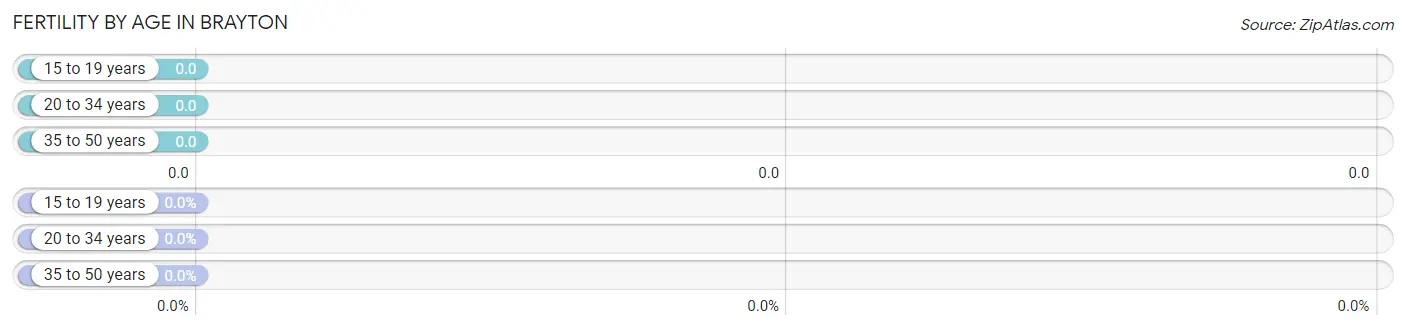
| Age Bracket | Women with Births | Births / 1,000 Women |
| 15 to 19 years | 0 (0.0%) | 0.0 |
| 20 to 34 years | 0 (0.0%) | 0.0 |
| 35 to 50 years | 0 (0.0%) | 0.0 |
| Total | 0 (0.0%) | 0.0 |
Fertility by Age by Marriage Status in Brayton
| Age Bracket | Married | Unmarried |
| 15 to 19 years | 0 (0.0%) | 0 (0.0%) |
| 20 to 34 years | 0 (0.0%) | 0 (0.0%) |
| 35 to 50 years | 0 (0.0%) | 0 (0.0%) |
| Total | 0 (0.0%) | 0 (0.0%) |
Fertility by Education in Brayton
| Educational Attainment | Women with Births | Births / 1,000 Women |
| Less than High School | 0 (0.0%) | 0.0 |
| High School Diploma | 0 (0.0%) | 0.0 |
| College or Associate's Degree | 0 (0.0%) | 0.0 |
| Bachelor's Degree | 0 (0.0%) | 0.0 |
| Graduate Degree | 0 (0.0%) | 0.0 |
| Total | 0 (0.0%) | 0.0 |
Fertility by Education by Marriage Status in Brayton
| Educational Attainment | Married | Unmarried |
| Less than High School | 0 (0.0%) | 0 (0.0%) |
| High School Diploma | 0 (0.0%) | 0 (0.0%) |
| College or Associate's Degree | 0 (0.0%) | 0 (0.0%) |
| Bachelor's Degree | 0 (0.0%) | 0 (0.0%) |
| Graduate Degree | 0 (0.0%) | 0 (0.0%) |
| Total | 0 (0.0%) | 0 (0.0%) |
Income in Brayton
Income Overview in Brayton
Per Capita Income in Brayton is $35,960, while median incomes of families and households are $81,667 and $73,750 respectively.
| Characteristic | Number | Measure |
| Per Capita Income | 104 | $35,960 |
| Median Family Income | 30 | $81,667 |
| Mean Family Income | 30 | $100,713 |
| Median Household Income | 46 | $73,750 |
| Mean Household Income | 46 | $84,378 |
| Income Deficit | 30 | $0 |
| Wage / Income Gap (%) | 104 | 10.31% |
| Wage / Income Gap ($) | 104 | 89.69¢ per $1 |
| Gini / Inequality Index | 104 | 0.42 |
Earnings by Sex in Brayton
Average Earnings in Brayton are $27,500, $28,571 for men and $25,625 for women, a difference of 10.3%.
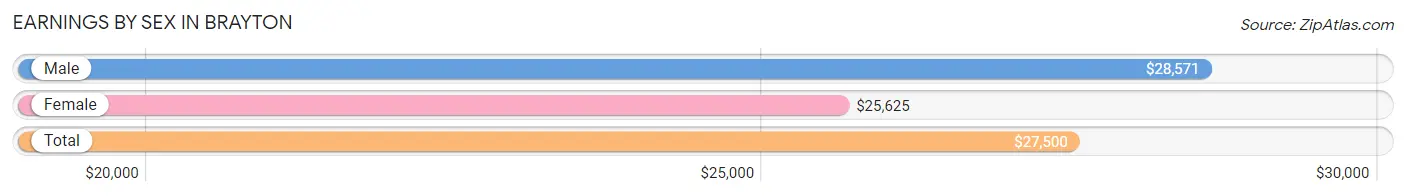
| Sex | Number | Average Earnings |
| Male | 46 (59.0%) | $28,571 |
| Female | 32 (41.0%) | $25,625 |
| Total | 78 (100.0%) | $27,500 |
Earnings by Sex by Income Bracket in Brayton
The most common earnings brackets in Brayton are $25,000 to $29,999 for men (12 | 26.1%) and $45,000 to $49,999 for women (9 | 28.1%).
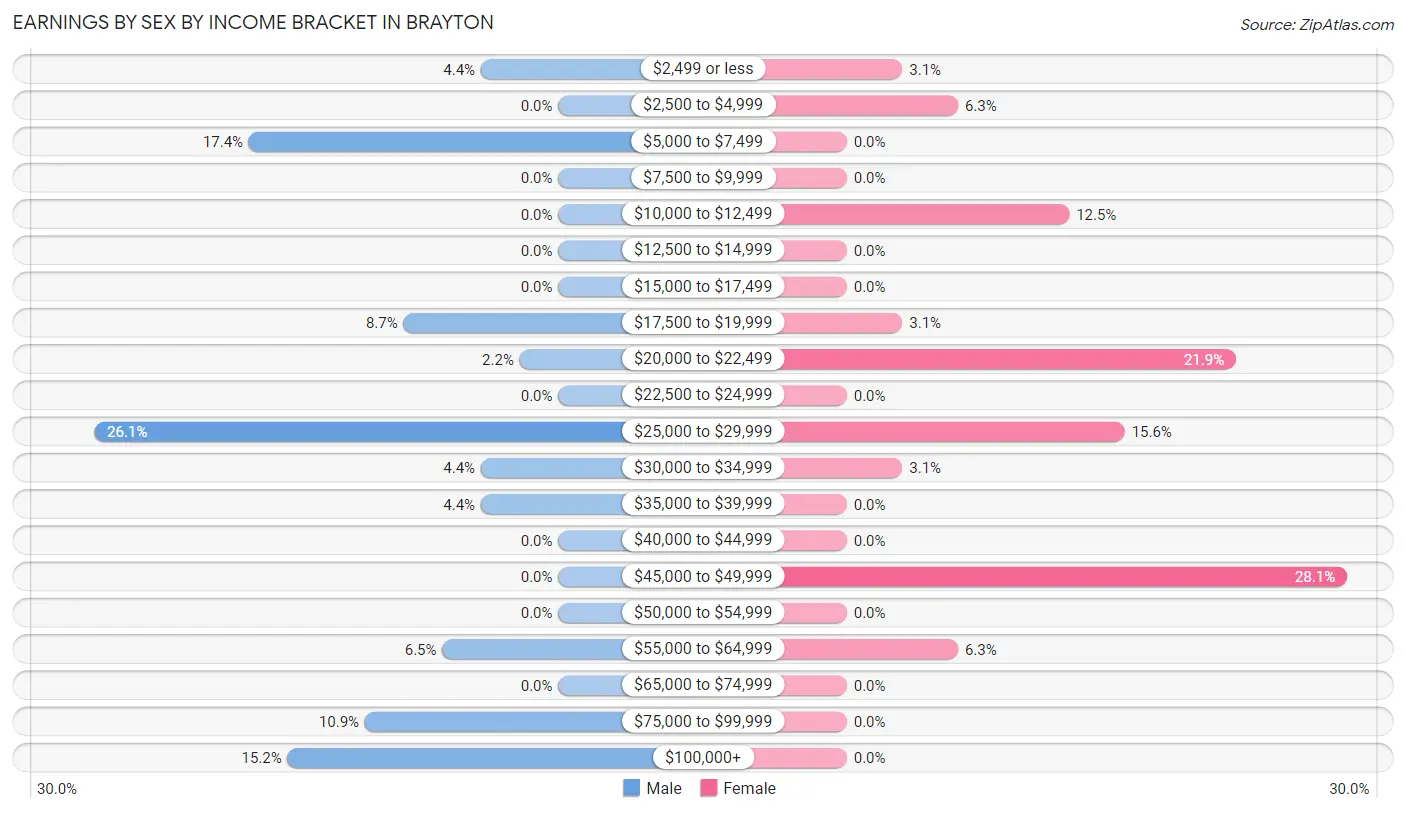
| Income | Male | Female |
| $2,499 or less | 2 (4.3%) | 1 (3.1%) |
| $2,500 to $4,999 | 0 (0.0%) | 2 (6.2%) |
| $5,000 to $7,499 | 8 (17.4%) | 0 (0.0%) |
| $7,500 to $9,999 | 0 (0.0%) | 0 (0.0%) |
| $10,000 to $12,499 | 0 (0.0%) | 4 (12.5%) |
| $12,500 to $14,999 | 0 (0.0%) | 0 (0.0%) |
| $15,000 to $17,499 | 0 (0.0%) | 0 (0.0%) |
| $17,500 to $19,999 | 4 (8.7%) | 1 (3.1%) |
| $20,000 to $22,499 | 1 (2.2%) | 7 (21.9%) |
| $22,500 to $24,999 | 0 (0.0%) | 0 (0.0%) |
| $25,000 to $29,999 | 12 (26.1%) | 5 (15.6%) |
| $30,000 to $34,999 | 2 (4.3%) | 1 (3.1%) |
| $35,000 to $39,999 | 2 (4.3%) | 0 (0.0%) |
| $40,000 to $44,999 | 0 (0.0%) | 0 (0.0%) |
| $45,000 to $49,999 | 0 (0.0%) | 9 (28.1%) |
| $50,000 to $54,999 | 0 (0.0%) | 0 (0.0%) |
| $55,000 to $64,999 | 3 (6.5%) | 2 (6.2%) |
| $65,000 to $74,999 | 0 (0.0%) | 0 (0.0%) |
| $75,000 to $99,999 | 5 (10.9%) | 0 (0.0%) |
| $100,000+ | 7 (15.2%) | 0 (0.0%) |
| Total | 46 (100.0%) | 32 (100.0%) |
Earnings by Sex by Educational Attainment in Brayton
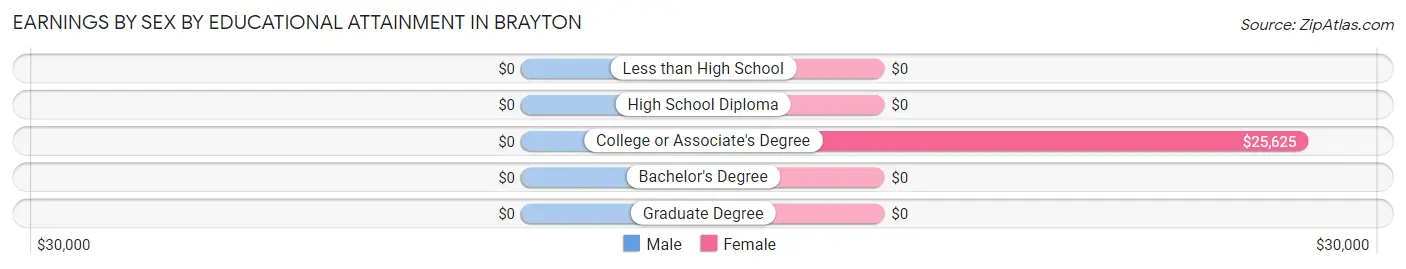
| Educational Attainment | Male Income | Female Income |
| Less than High School | - | - |
| High School Diploma | - | - |
| College or Associate's Degree | - | - |
| Bachelor's Degree | - | - |
| Graduate Degree | - | - |
| Total | - | - |
Family Income in Brayton
Family Income Brackets in Brayton
According to the Brayton family income data, there are 12 families falling into the $75,000 to $99,999 income range, which is the most common income bracket and makes up 40.0% of all families.
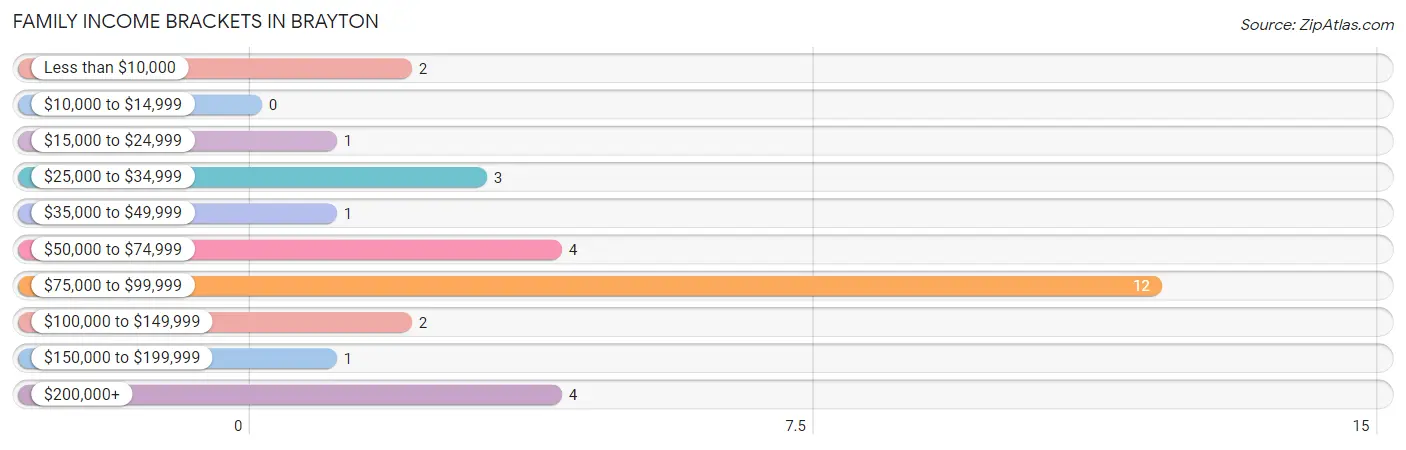
| Income Bracket | # Families | % Families |
| Less than $10,000 | 2 | 6.7% |
| $10,000 to $14,999 | 0 | 0.0% |
| $15,000 to $24,999 | 1 | 3.3% |
| $25,000 to $34,999 | 3 | 10.0% |
| $35,000 to $49,999 | 1 | 3.3% |
| $50,000 to $74,999 | 4 | 13.3% |
| $75,000 to $99,999 | 12 | 40.0% |
| $100,000 to $149,999 | 2 | 6.7% |
| $150,000 to $199,999 | 1 | 3.3% |
| $200,000+ | 4 | 13.3% |
Family Income by Famaliy Size in Brayton
2-person families (19 | 63.3%) account for the highest median family income in Brayton with $98,542 per family, while 2-person families (19 | 63.3%) have the highest median income of $49,271 per family member.
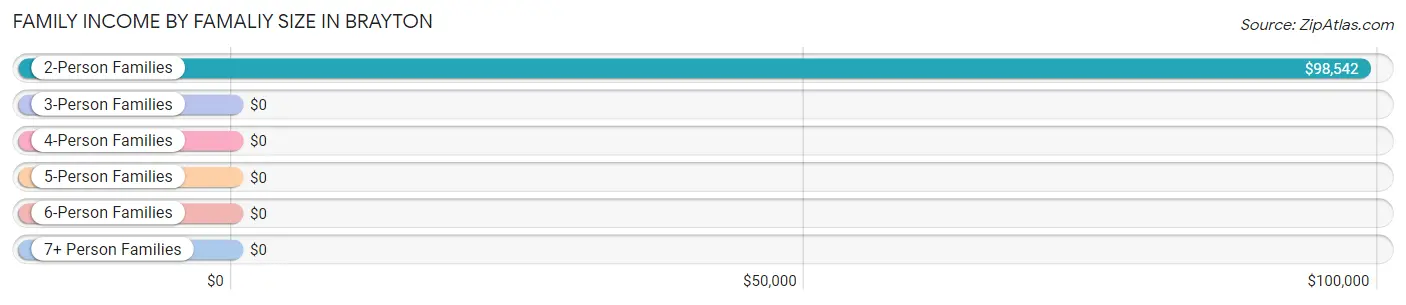
| Income Bracket | # Families | Median Income |
| 2-Person Families | 19 (63.3%) | $98,542 |
| 3-Person Families | 4 (13.3%) | $0 |
| 4-Person Families | 7 (23.3%) | $0 |
| 5-Person Families | 0 (0.0%) | $0 |
| 6-Person Families | 0 (0.0%) | $0 |
| 7+ Person Families | 0 (0.0%) | $0 |
| Total | 30 (100.0%) | $81,667 |
Family Income by Number of Earners in Brayton
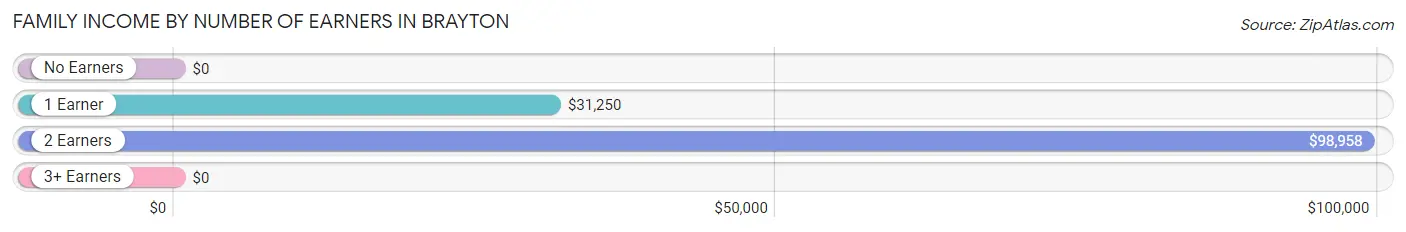
| Number of Earners | # Families | Median Income |
| No Earners | 0 (0.0%) | $0 |
| 1 Earner | 6 (20.0%) | $31,250 |
| 2 Earners | 17 (56.7%) | $98,958 |
| 3+ Earners | 7 (23.3%) | $0 |
| Total | 30 (100.0%) | $81,667 |
Household Income in Brayton
Household Income Brackets in Brayton
With 12 households falling in the category, the $75,000 to $99,999 income range is the most frequent in Brayton, accounting for 26.1% of all households.
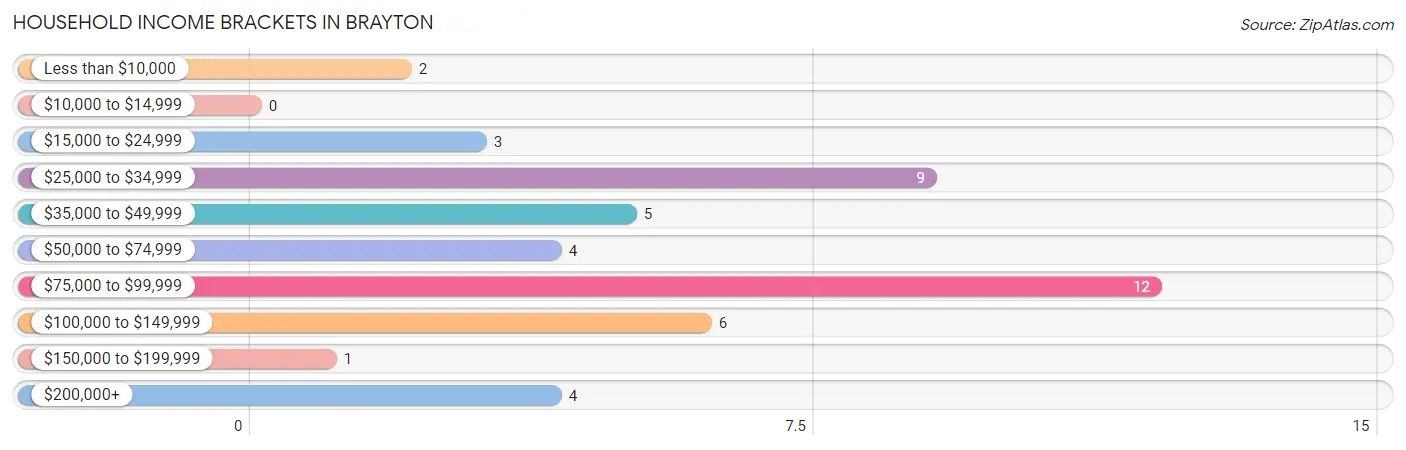
| Income Bracket | # Households | % Households |
| Less than $10,000 | 2 | 4.3% |
| $10,000 to $14,999 | 0 | 0.0% |
| $15,000 to $24,999 | 3 | 6.5% |
| $25,000 to $34,999 | 9 | 19.6% |
| $35,000 to $49,999 | 5 | 10.9% |
| $50,000 to $74,999 | 4 | 8.7% |
| $75,000 to $99,999 | 12 | 26.1% |
| $100,000 to $149,999 | 6 | 13.0% |
| $150,000 to $199,999 | 1 | 2.2% |
| $200,000+ | 4 | 8.7% |
Household Income by Householder Age in Brayton
The median household income in Brayton is $73,750, with the highest median household income of $98,125 found in the 25 to 44 years age bracket for the primary householder. A total of 13 households (28.3%) fall into this category.
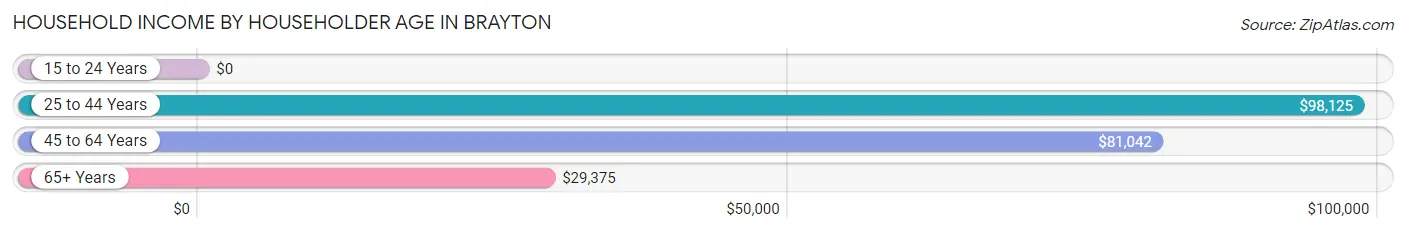
| Income Bracket | # Households | Median Income |
| 15 to 24 Years | 0 (0.0%) | $0 |
| 25 to 44 Years | 13 (28.3%) | $98,125 |
| 45 to 64 Years | 25 (54.3%) | $81,042 |
| 65+ Years | 8 (17.4%) | $29,375 |
| Total | 46 (100.0%) | $73,750 |
Poverty in Brayton
Income Below Poverty by Sex and Age in Brayton
With 6.9% poverty level for males and 19.6% for females among the residents of Brayton, under 5 year old males and 5 year old females are the most vulnerable to poverty, with 3 males (100.0%) and 2 females (100.0%) in their respective age groups living below the poverty level.
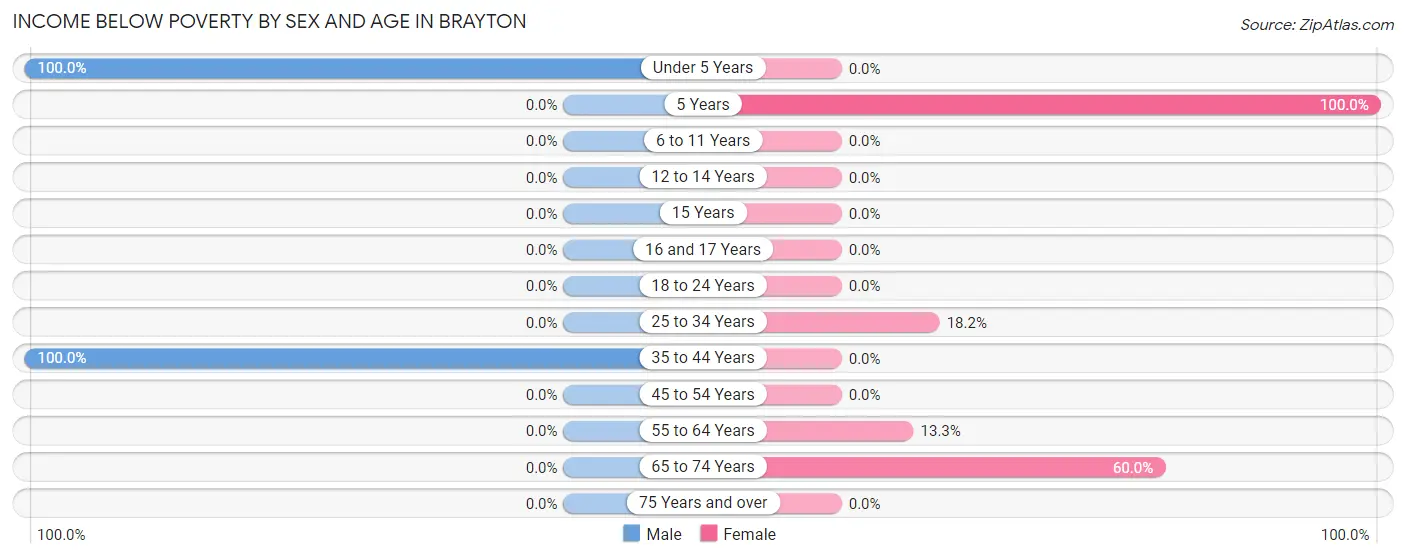
| Age Bracket | Male | Female |
| Under 5 Years | 3 (100.0%) | 0 (0.0%) |
| 5 Years | 0 (0.0%) | 2 (100.0%) |
| 6 to 11 Years | 0 (0.0%) | 0 (0.0%) |
| 12 to 14 Years | 0 (0.0%) | 0 (0.0%) |
| 15 Years | 0 (0.0%) | 0 (0.0%) |
| 16 and 17 Years | 0 (0.0%) | 0 (0.0%) |
| 18 to 24 Years | 0 (0.0%) | 0 (0.0%) |
| 25 to 34 Years | 0 (0.0%) | 2 (18.2%) |
| 35 to 44 Years | 1 (100.0%) | 0 (0.0%) |
| 45 to 54 Years | 0 (0.0%) | 0 (0.0%) |
| 55 to 64 Years | 0 (0.0%) | 2 (13.3%) |
| 65 to 74 Years | 0 (0.0%) | 3 (60.0%) |
| 75 Years and over | 0 (0.0%) | 0 (0.0%) |
| Total | 4 (6.9%) | 9 (19.6%) |
Income Above Poverty by Sex and Age in Brayton
According to the poverty statistics in Brayton, males aged 12 to 14 years and females aged 35 to 44 years are the age groups that are most secure financially, with 100.0% of males and 100.0% of females in these age groups living above the poverty line.
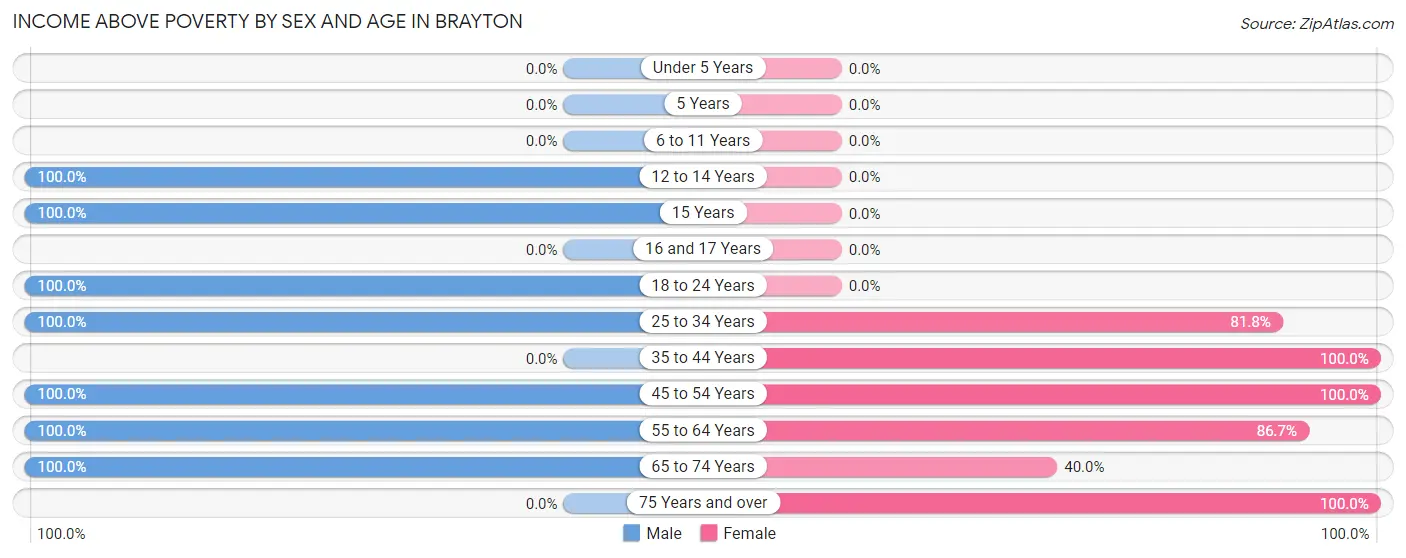
| Age Bracket | Male | Female |
| Under 5 Years | 0 (0.0%) | 0 (0.0%) |
| 5 Years | 0 (0.0%) | 0 (0.0%) |
| 6 to 11 Years | 0 (0.0%) | 0 (0.0%) |
| 12 to 14 Years | 2 (100.0%) | 0 (0.0%) |
| 15 Years | 1 (100.0%) | 0 (0.0%) |
| 16 and 17 Years | 0 (0.0%) | 0 (0.0%) |
| 18 to 24 Years | 8 (100.0%) | 0 (0.0%) |
| 25 to 34 Years | 16 (100.0%) | 9 (81.8%) |
| 35 to 44 Years | 0 (0.0%) | 8 (100.0%) |
| 45 to 54 Years | 3 (100.0%) | 4 (100.0%) |
| 55 to 64 Years | 18 (100.0%) | 13 (86.7%) |
| 65 to 74 Years | 6 (100.0%) | 2 (40.0%) |
| 75 Years and over | 0 (0.0%) | 1 (100.0%) |
| Total | 54 (93.1%) | 37 (80.4%) |
Income Below Poverty Among Married-Couple Families in Brayton
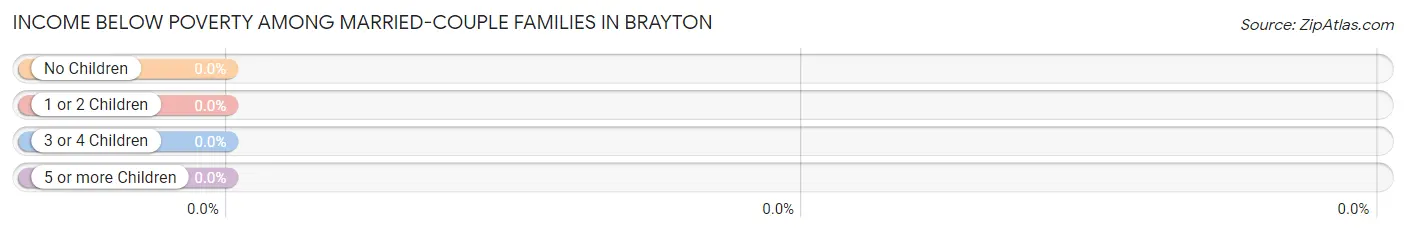
| Children | Above Poverty | Below Poverty |
| No Children | 25 (100.0%) | 0 (0.0%) |
| 1 or 2 Children | 0 (0.0%) | 0 (0.0%) |
| 3 or 4 Children | 0 (0.0%) | 0 (0.0%) |
| 5 or more Children | 0 (0.0%) | 0 (0.0%) |
| Total | 25 (100.0%) | 0 (0.0%) |
Income Below Poverty Among Single-Parent Households in Brayton
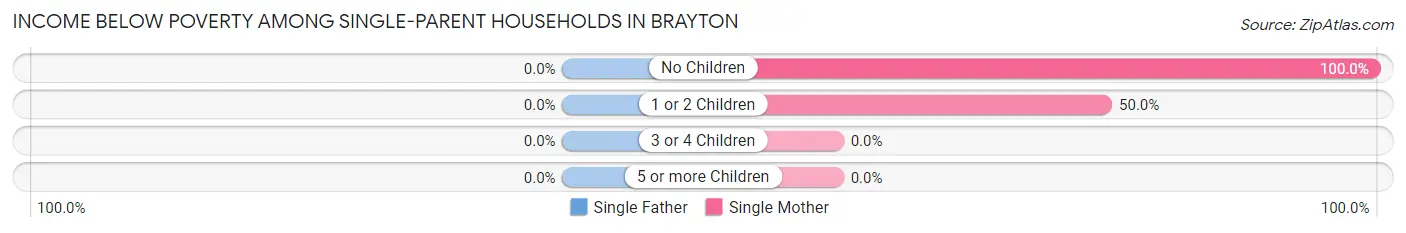
| Children | Single Father | Single Mother |
| No Children | 0 (0.0%) | 1 (100.0%) |
| 1 or 2 Children | 0 (0.0%) | 2 (50.0%) |
| 3 or 4 Children | 0 (0.0%) | 0 (0.0%) |
| 5 or more Children | 0 (0.0%) | 0 (0.0%) |
| Total | 0 (0.0%) | 3 (60.0%) |
Income Below Poverty Among Married-Couple vs Single-Parent Households in Brayton
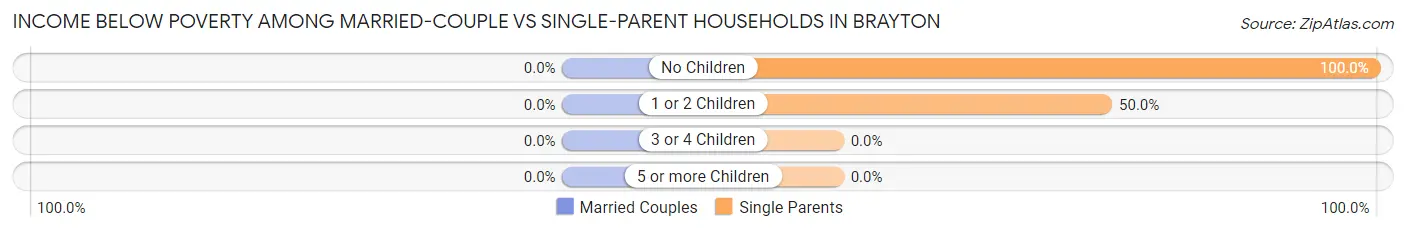
| Children | Married-Couple Families | Single-Parent Households |
| No Children | 0 (0.0%) | 1 (100.0%) |
| 1 or 2 Children | 0 (0.0%) | 2 (50.0%) |
| 3 or 4 Children | 0 (0.0%) | 0 (0.0%) |
| 5 or more Children | 0 (0.0%) | 0 (0.0%) |
| Total | 0 (0.0%) | 3 (60.0%) |
Employment Characteristics in Brayton
Employment by Class of Employer in Brayton
Among the 69 employed individuals in Brayton, private company employees (49 | 71.0%), self-employed (not incorporated) (9 | 13.0%), and not-for-profit organizations (6 | 8.7%) make up the most common classes of employment.
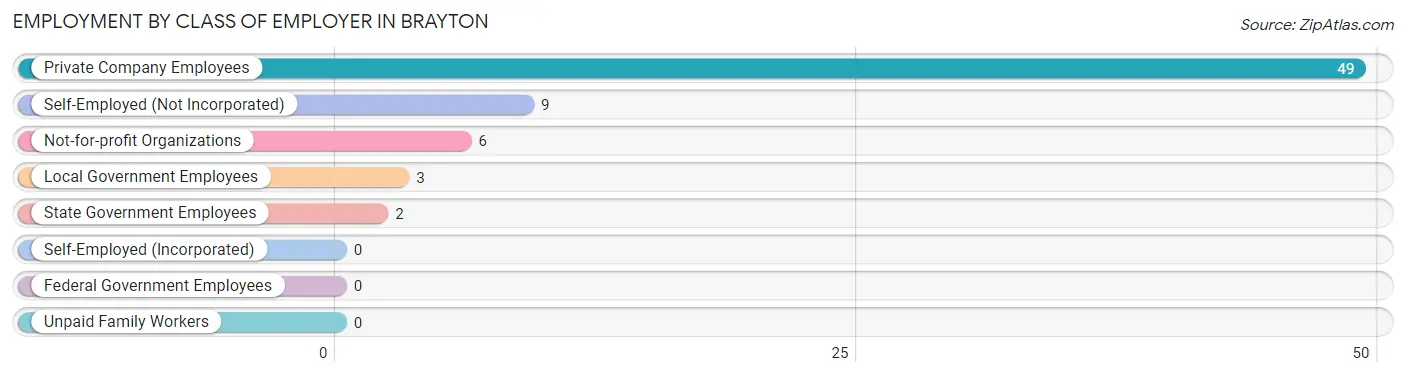
| Employer Class | # Employees | % Employees |
| Private Company Employees | 49 | 71.0% |
| Self-Employed (Incorporated) | 0 | 0.0% |
| Self-Employed (Not Incorporated) | 9 | 13.0% |
| Not-for-profit Organizations | 6 | 8.7% |
| Local Government Employees | 3 | 4.3% |
| State Government Employees | 2 | 2.9% |
| Federal Government Employees | 0 | 0.0% |
| Unpaid Family Workers | 0 | 0.0% |
| Total | 69 | 100.0% |
Employment Status by Age in Brayton
According to the labor force statistics for Brayton, out of the total population over 16 years of age (96), 74.0% or 71 individuals are in the labor force, with 1.4% or 1 of them unemployed. The age group with the highest labor force participation rate is 20 to 24 years, with 100.0% or 8 individuals in the labor force. Within the labor force, the 35 to 44 years age range has the highest percentage of unemployed individuals, with 33.3% or 1 of them being unemployed.
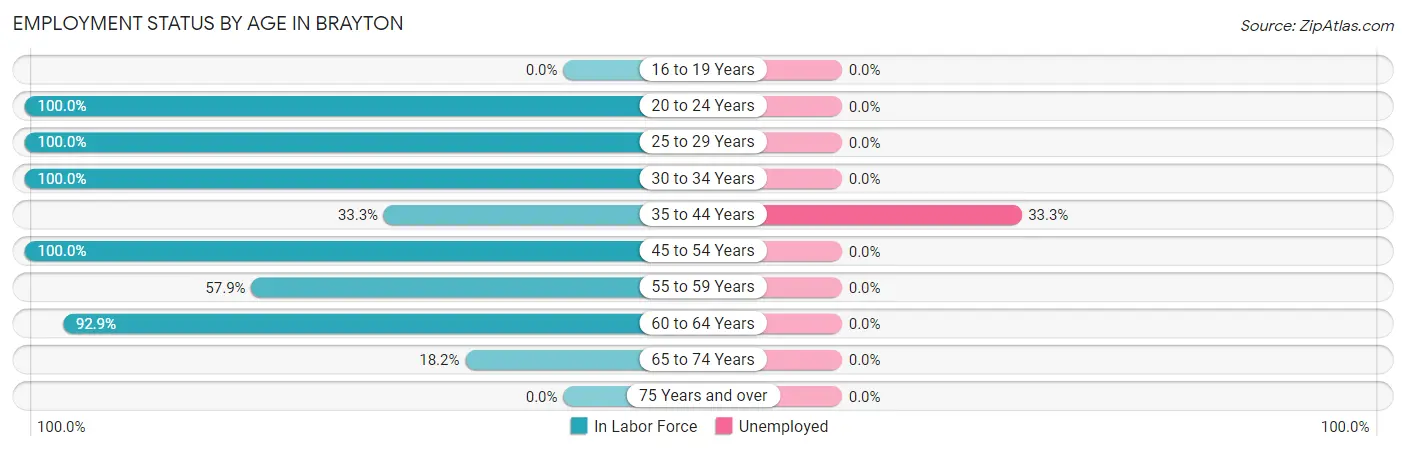
| Age Bracket | In Labor Force | Unemployed |
| 16 to 19 Years | 0 (0.0%) | 0 (0.0%) |
| 20 to 24 Years | 8 (100.0%) | 0 (0.0%) |
| 25 to 29 Years | 18 (100.0%) | 0 (0.0%) |
| 30 to 34 Years | 9 (100.0%) | 0 (0.0%) |
| 35 to 44 Years | 3 (33.3%) | 1 (33.3%) |
| 45 to 54 Years | 7 (100.0%) | 0 (0.0%) |
| 55 to 59 Years | 11 (57.9%) | 0 (0.0%) |
| 60 to 64 Years | 13 (92.9%) | 0 (0.0%) |
| 65 to 74 Years | 2 (18.2%) | 0 (0.0%) |
| 75 Years and over | 0 (0.0%) | 0 (0.0%) |
| Total | 71 (74.0%) | 1 (1.4%) |
Employment Status by Educational Attainment in Brayton
According to labor force statistics for Brayton, 80.3% of individuals (61) out of the total population between 25 and 64 years of age (76) are in the labor force, with 1.6% or 1 of them being unemployed. The group with the highest labor force participation rate are those with the educational attainment of college / associate degree, with 96.9% or 31 individuals in the labor force. Within the labor force, individuals with high school diploma education have the highest percentage of unemployment, with 8.3% or 1 of them being unemployed.
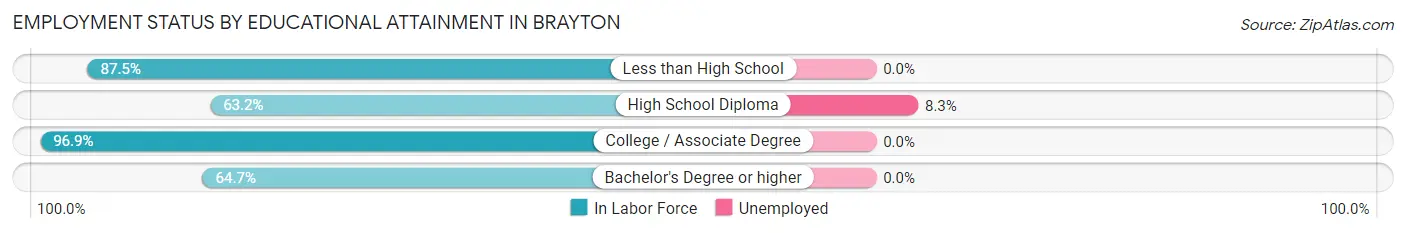
| Educational Attainment | In Labor Force | Unemployed |
| Less than High School | 7 (87.5%) | 0 (0.0%) |
| High School Diploma | 12 (63.2%) | 2 (8.3%) |
| College / Associate Degree | 31 (96.9%) | 0 (0.0%) |
| Bachelor's Degree or higher | 11 (64.7%) | 0 (0.0%) |
| Total | 61 (80.3%) | 1 (1.6%) |
Employment Occupations by Sex in Brayton
Management, Business, Science and Arts Occupations
The most common Management, Business, Science and Arts occupations in Brayton are Management (8 | 11.4%), Community & Social Service (5 | 7.1%), Legal Services & Support (4 | 5.7%), and Education Instruction & Library (1 | 1.4%).
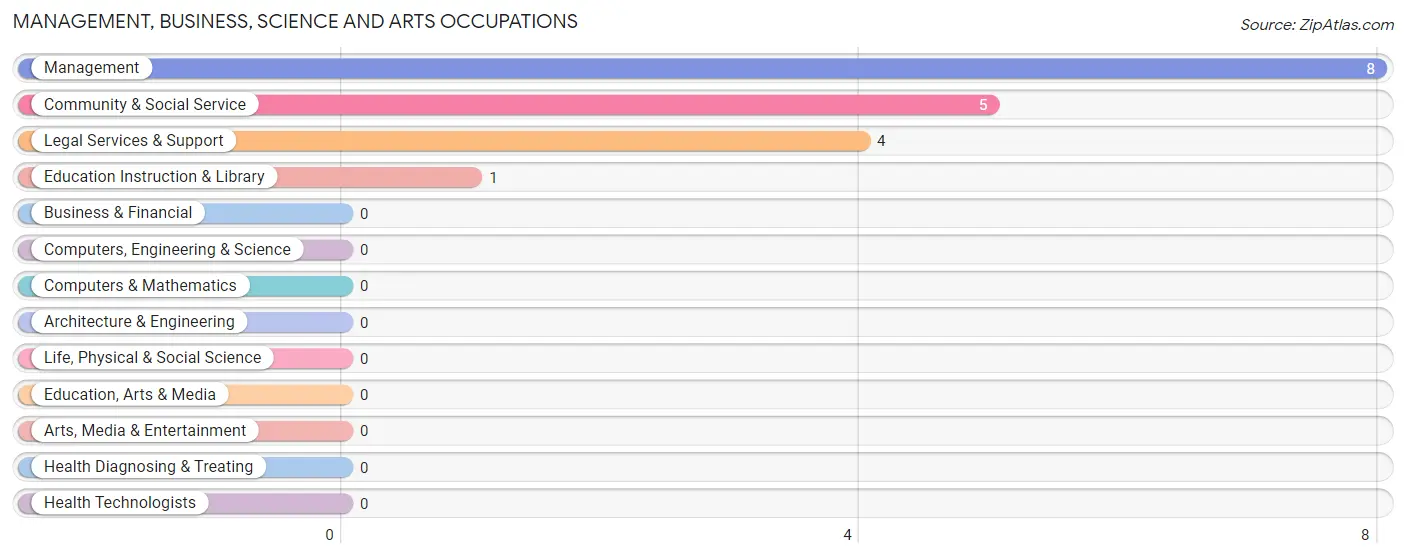
Management, Business, Science and Arts Occupations by Sex
Within the Management, Business, Science and Arts occupations in Brayton, the most male-oriented occupations are Management (100.0%), Education Instruction & Library (100.0%), and Community & Social Service (20.0%), while the most female-oriented occupations are Legal Services & Support (100.0%), and Community & Social Service (80.0%).
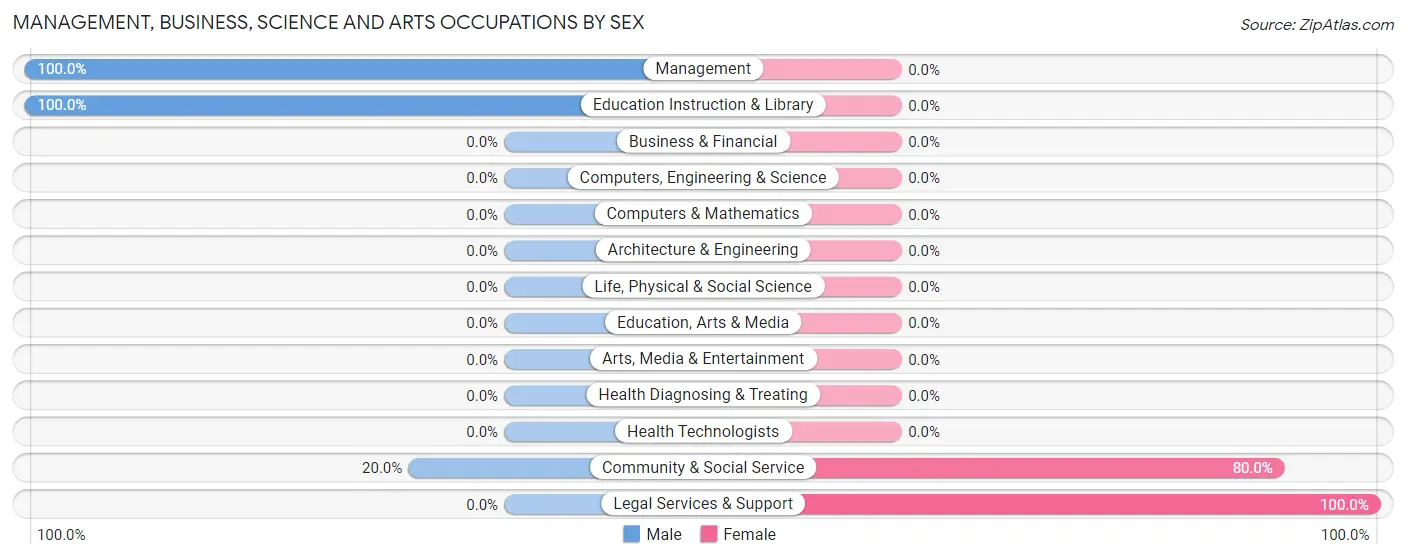
| Occupation | Male | Female |
| Management | 8 (100.0%) | 0 (0.0%) |
| Business & Financial | 0 (0.0%) | 0 (0.0%) |
| Computers, Engineering & Science | 0 (0.0%) | 0 (0.0%) |
| Computers & Mathematics | 0 (0.0%) | 0 (0.0%) |
| Architecture & Engineering | 0 (0.0%) | 0 (0.0%) |
| Life, Physical & Social Science | 0 (0.0%) | 0 (0.0%) |
| Community & Social Service | 1 (20.0%) | 4 (80.0%) |
| Education, Arts & Media | 0 (0.0%) | 0 (0.0%) |
| Legal Services & Support | 0 (0.0%) | 4 (100.0%) |
| Education Instruction & Library | 1 (100.0%) | 0 (0.0%) |
| Arts, Media & Entertainment | 0 (0.0%) | 0 (0.0%) |
| Health Diagnosing & Treating | 0 (0.0%) | 0 (0.0%) |
| Health Technologists | 0 (0.0%) | 0 (0.0%) |
| Total (Category) | 9 (69.2%) | 4 (30.8%) |
| Total (Overall) | 44 (62.9%) | 26 (37.1%) |
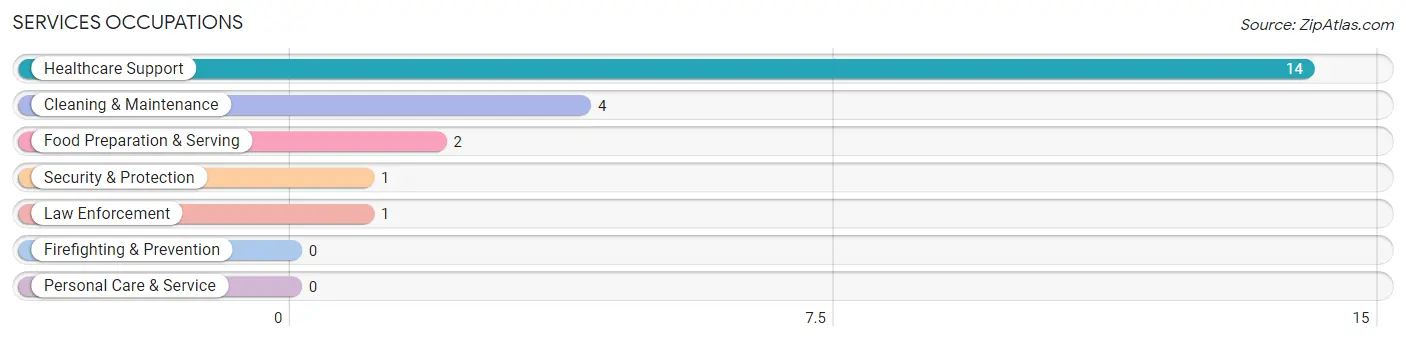
Services Occupations
The most common Services occupations in Brayton are Healthcare Support (14 | 20.0%), Cleaning & Maintenance (4 | 5.7%), Food Preparation & Serving (2 | 2.9%), Security & Protection (1 | 1.4%), and Law Enforcement (1 | 1.4%).
Services Occupations by Sex
Within the Services occupations in Brayton, the most male-oriented occupations are Security & Protection (100.0%), Law Enforcement (100.0%), and Healthcare Support (57.1%), while the most female-oriented occupations are Food Preparation & Serving (100.0%), Cleaning & Maintenance (100.0%), and Healthcare Support (42.9%).
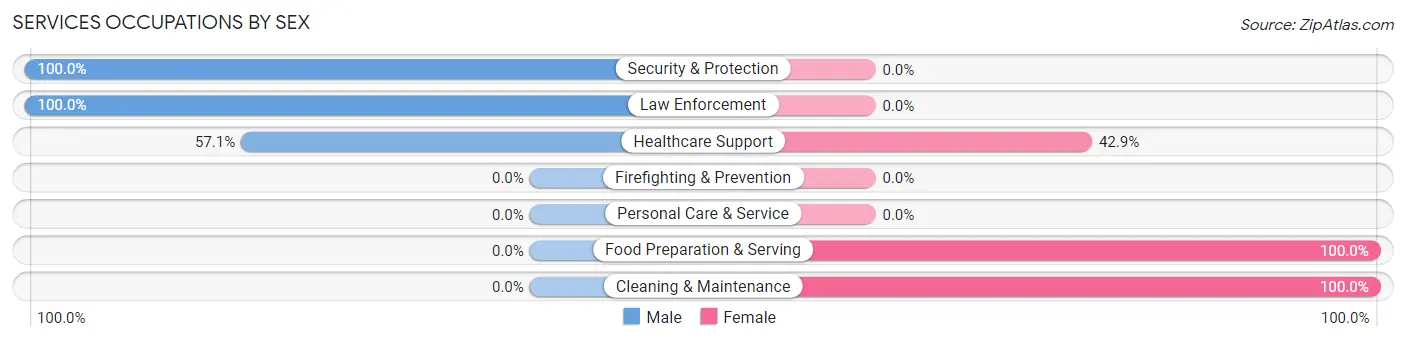
| Occupation | Male | Female |
| Healthcare Support | 8 (57.1%) | 6 (42.9%) |
| Security & Protection | 1 (100.0%) | 0 (0.0%) |
| Firefighting & Prevention | 0 (0.0%) | 0 (0.0%) |
| Law Enforcement | 1 (100.0%) | 0 (0.0%) |
| Food Preparation & Serving | 0 (0.0%) | 2 (100.0%) |
| Cleaning & Maintenance | 0 (0.0%) | 4 (100.0%) |
| Personal Care & Service | 0 (0.0%) | 0 (0.0%) |
| Total (Category) | 9 (42.9%) | 12 (57.1%) |
| Total (Overall) | 44 (62.9%) | 26 (37.1%) |
Sales and Office Occupations
The most common Sales and Office occupations in Brayton are Office & Administration (7 | 10.0%), and Sales & Related (4 | 5.7%).
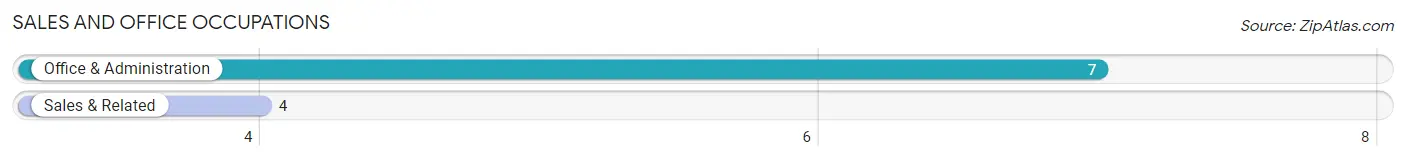
Sales and Office Occupations by Sex
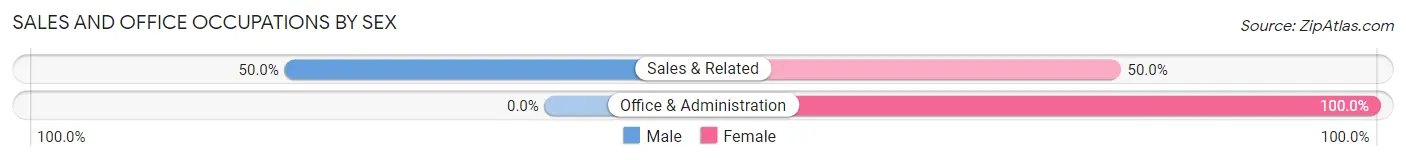
| Occupation | Male | Female |
| Sales & Related | 2 (50.0%) | 2 (50.0%) |
| Office & Administration | 0 (0.0%) | 7 (100.0%) |
| Total (Category) | 2 (18.2%) | 9 (81.8%) |
| Total (Overall) | 44 (62.9%) | 26 (37.1%) |
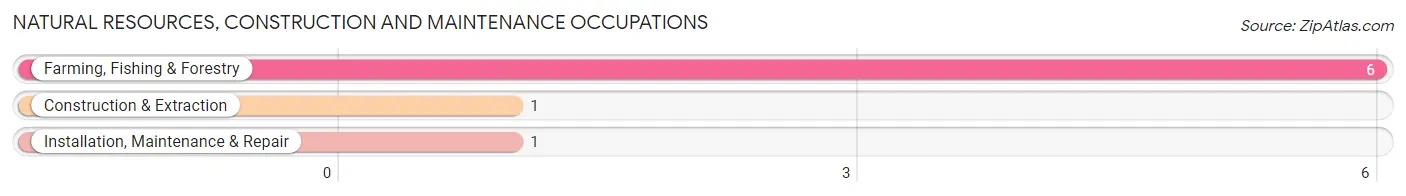
Natural Resources, Construction and Maintenance Occupations
The most common Natural Resources, Construction and Maintenance occupations in Brayton are Farming, Fishing & Forestry (6 | 8.6%), Construction & Extraction (1 | 1.4%), and Installation, Maintenance & Repair (1 | 1.4%).
Natural Resources, Construction and Maintenance Occupations by Sex
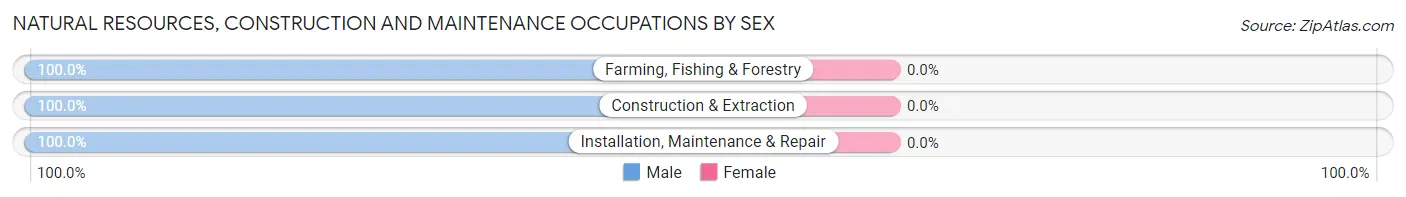
| Occupation | Male | Female |
| Farming, Fishing & Forestry | 6 (100.0%) | 0 (0.0%) |
| Construction & Extraction | 1 (100.0%) | 0 (0.0%) |
| Installation, Maintenance & Repair | 1 (100.0%) | 0 (0.0%) |
| Total (Category) | 8 (100.0%) | 0 (0.0%) |
| Total (Overall) | 44 (62.9%) | 26 (37.1%) |
Production, Transportation and Moving Occupations
The most common Production, Transportation and Moving occupations in Brayton are Material Moving (10 | 14.3%), Production (6 | 8.6%), and Transportation (1 | 1.4%).
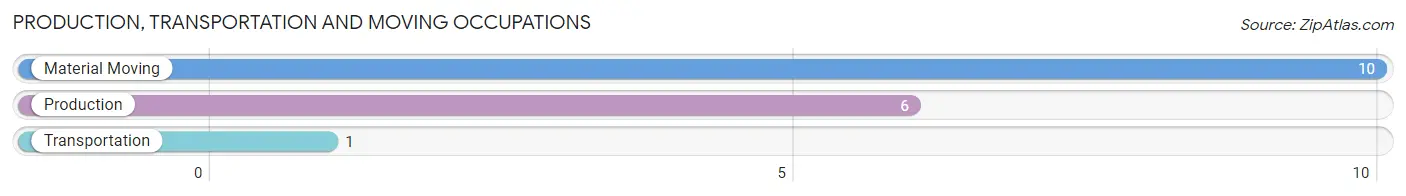
Production, Transportation and Moving Occupations by Sex
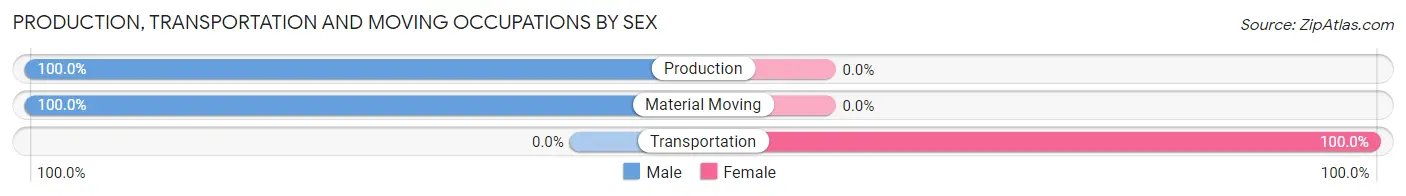
| Occupation | Male | Female |
| Production | 6 (100.0%) | 0 (0.0%) |
| Transportation | 0 (0.0%) | 1 (100.0%) |
| Material Moving | 10 (100.0%) | 0 (0.0%) |
| Total (Category) | 16 (94.1%) | 1 (5.9%) |
| Total (Overall) | 44 (62.9%) | 26 (37.1%) |
Employment Industries by Sex in Brayton
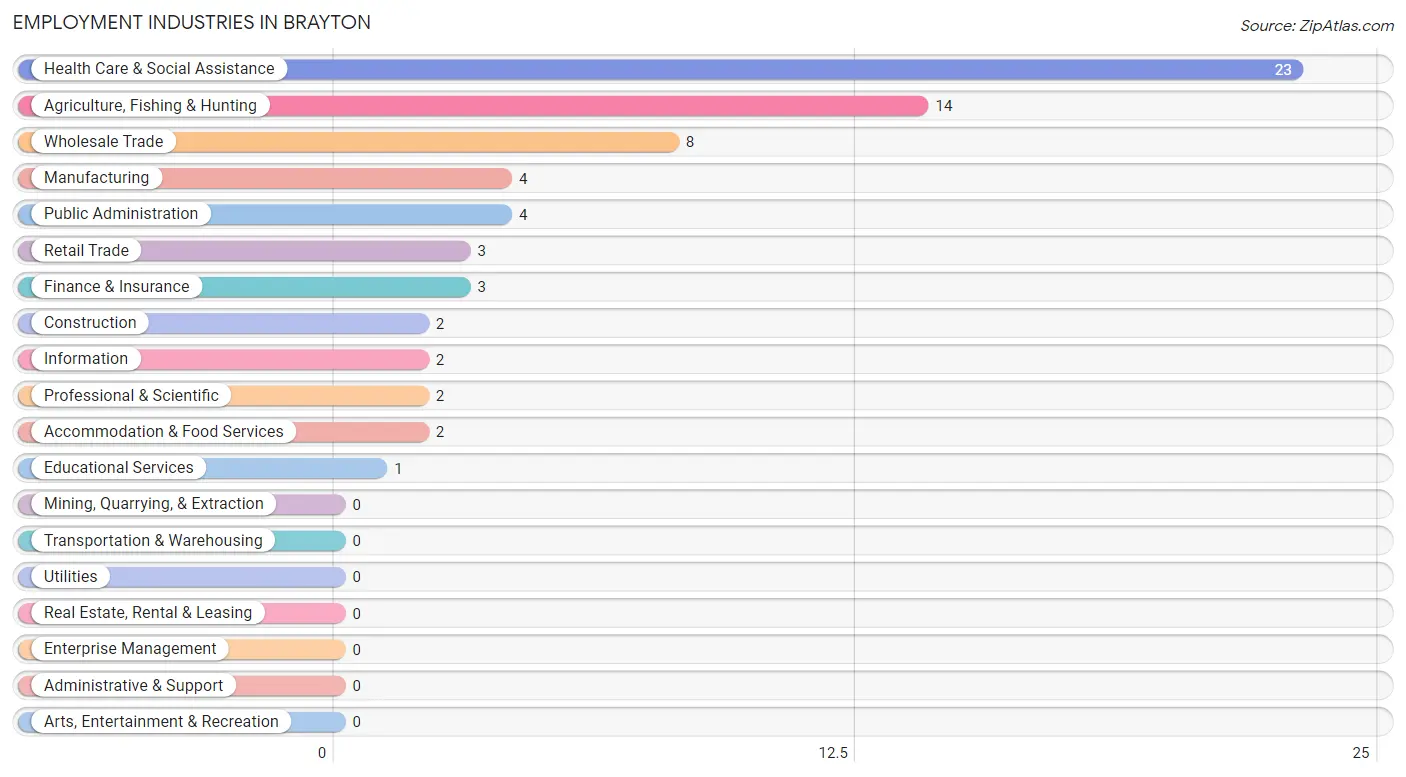
Employment Industries in Brayton
The major employment industries in Brayton include Health Care & Social Assistance (23 | 32.9%), Agriculture, Fishing & Hunting (14 | 20.0%), Wholesale Trade (8 | 11.4%), Manufacturing (4 | 5.7%), and Public Administration (4 | 5.7%).
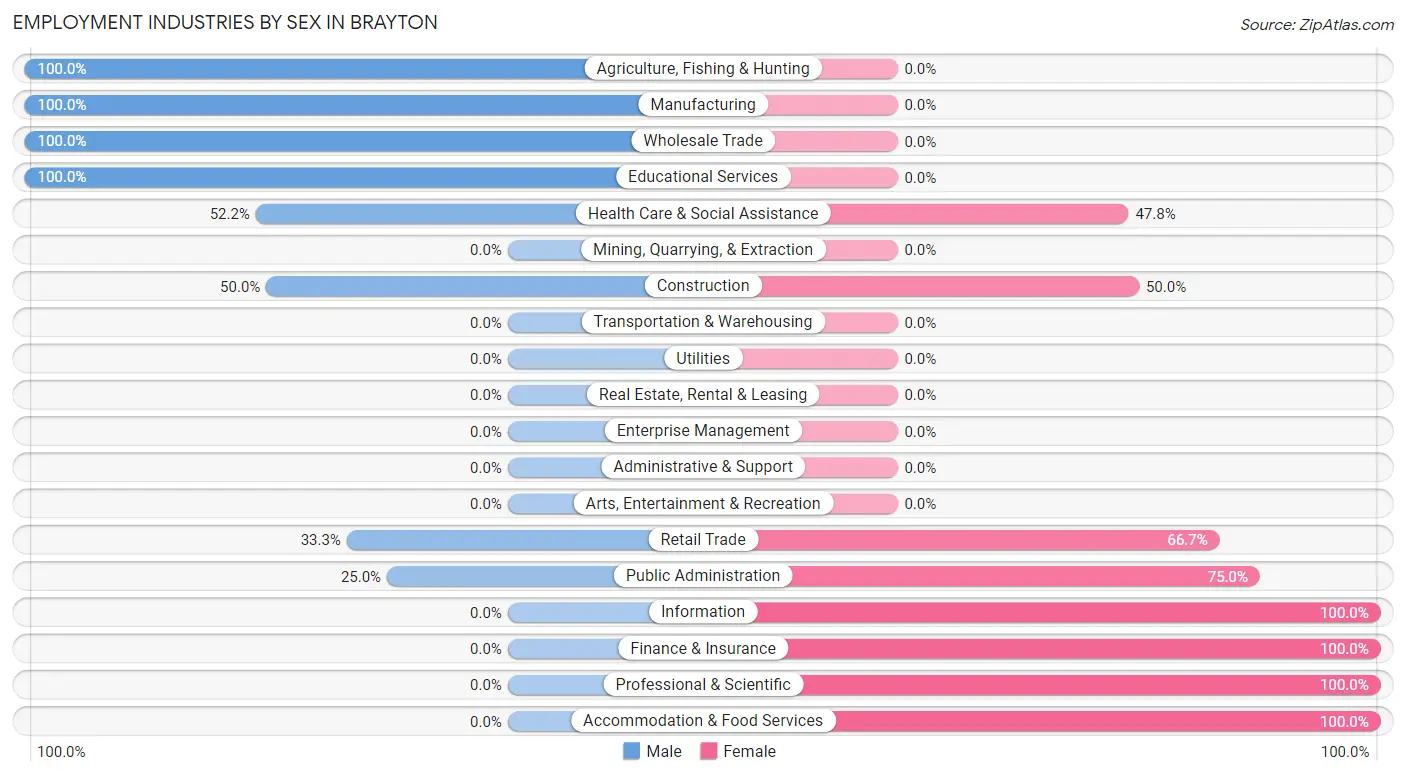
Employment Industries by Sex in Brayton
The Brayton industries that see more men than women are Agriculture, Fishing & Hunting (100.0%), Manufacturing (100.0%), and Wholesale Trade (100.0%), whereas the industries that tend to have a higher number of women are Information (100.0%), Finance & Insurance (100.0%), and Professional & Scientific (100.0%).
| Industry | Male | Female |
| Agriculture, Fishing & Hunting | 14 (100.0%) | 0 (0.0%) |
| Mining, Quarrying, & Extraction | 0 (0.0%) | 0 (0.0%) |
| Construction | 1 (50.0%) | 1 (50.0%) |
| Manufacturing | 4 (100.0%) | 0 (0.0%) |
| Wholesale Trade | 8 (100.0%) | 0 (0.0%) |
| Retail Trade | 1 (33.3%) | 2 (66.7%) |
| Transportation & Warehousing | 0 (0.0%) | 0 (0.0%) |
| Utilities | 0 (0.0%) | 0 (0.0%) |
| Information | 0 (0.0%) | 2 (100.0%) |
| Finance & Insurance | 0 (0.0%) | 3 (100.0%) |
| Real Estate, Rental & Leasing | 0 (0.0%) | 0 (0.0%) |
| Professional & Scientific | 0 (0.0%) | 2 (100.0%) |
| Enterprise Management | 0 (0.0%) | 0 (0.0%) |
| Administrative & Support | 0 (0.0%) | 0 (0.0%) |
| Educational Services | 1 (100.0%) | 0 (0.0%) |
| Health Care & Social Assistance | 12 (52.2%) | 11 (47.8%) |
| Arts, Entertainment & Recreation | 0 (0.0%) | 0 (0.0%) |
| Accommodation & Food Services | 0 (0.0%) | 2 (100.0%) |
| Public Administration | 1 (25.0%) | 3 (75.0%) |
| Total | 44 (62.9%) | 26 (37.1%) |
Education in Brayton
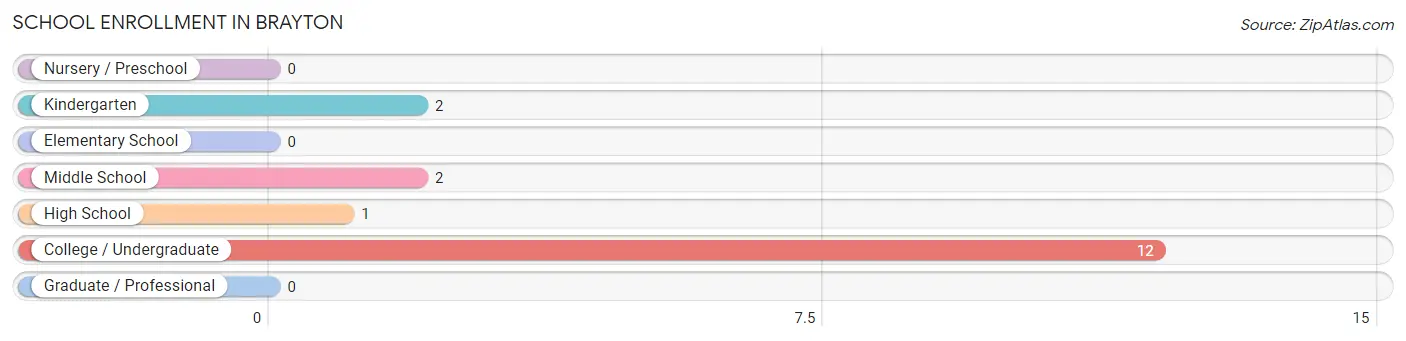
School Enrollment in Brayton
The most common levels of schooling among the 17 students in Brayton are college / undergraduate (12 | 70.6%), kindergarten (2 | 11.8%), and middle school (2 | 11.8%).
| School Level | # Students | % Students |
| Nursery / Preschool | 0 | 0.0% |
| Kindergarten | 2 | 11.8% |
| Elementary School | 0 | 0.0% |
| Middle School | 2 | 11.8% |
| High School | 1 | 5.9% |
| College / Undergraduate | 12 | 70.6% |
| Graduate / Professional | 0 | 0.0% |
| Total | 17 | 100.0% |
School Enrollment by Age by Funding Source in Brayton
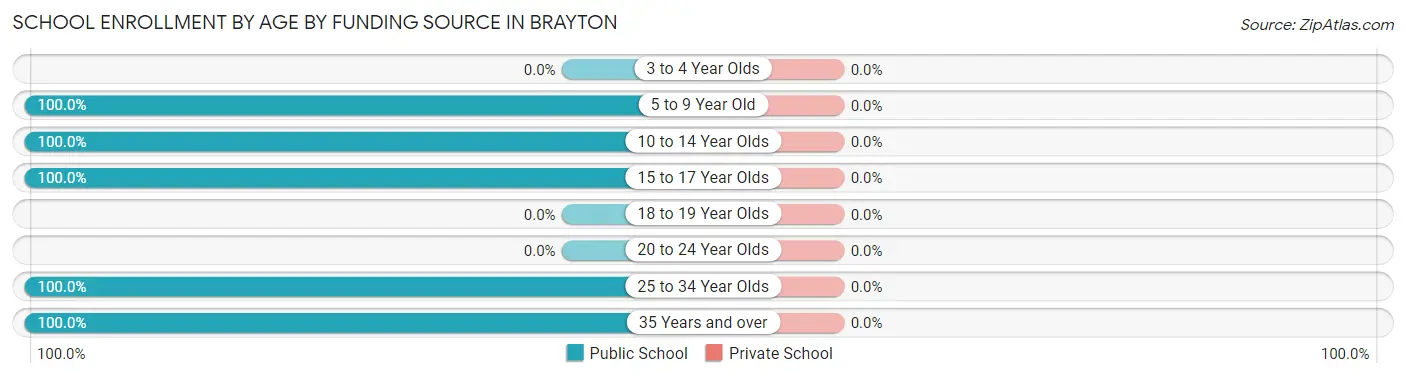
| Age Bracket | Public School | Private School |
| 3 to 4 Year Olds | 0 (0.0%) | 0 (0.0%) |
| 5 to 9 Year Old | 2 (100.0%) | 0 (0.0%) |
| 10 to 14 Year Olds | 2 (100.0%) | 0 (0.0%) |
| 15 to 17 Year Olds | 1 (100.0%) | 0 (0.0%) |
| 18 to 19 Year Olds | 0 (0.0%) | 0 (0.0%) |
| 20 to 24 Year Olds | 0 (0.0%) | 0 (0.0%) |
| 25 to 34 Year Olds | 8 (100.0%) | 0 (0.0%) |
| 35 Years and over | 4 (100.0%) | 0 (0.0%) |
| Total | 17 (100.0%) | 0 (0.0%) |
Educational Attainment by Field of Study in Brayton
Science & technology (8 | 42.1%), business (8 | 42.1%), psychology (1 | 5.3%), education (1 | 5.3%), and liberal arts & history (1 | 5.3%) are the most common fields of study among 19 individuals in Brayton who have obtained a bachelor's degree or higher.
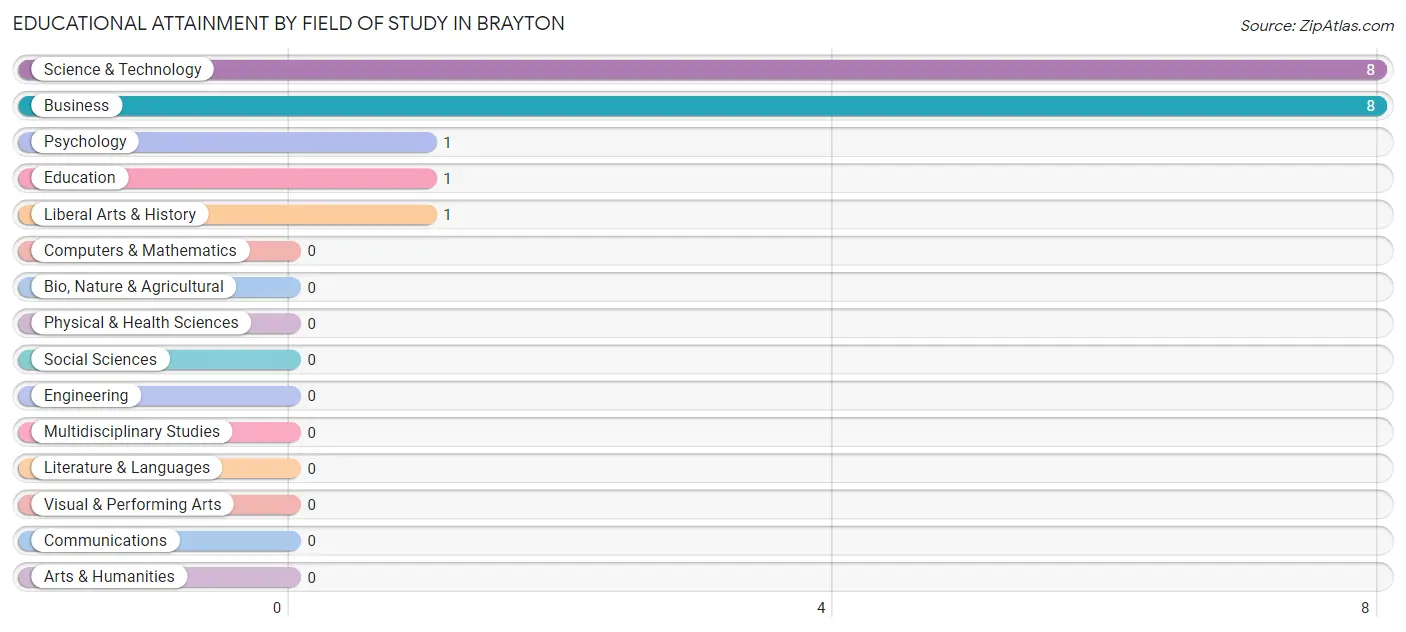
| Field of Study | # Graduates | % Graduates |
| Computers & Mathematics | 0 | 0.0% |
| Bio, Nature & Agricultural | 0 | 0.0% |
| Physical & Health Sciences | 0 | 0.0% |
| Psychology | 1 | 5.3% |
| Social Sciences | 0 | 0.0% |
| Engineering | 0 | 0.0% |
| Multidisciplinary Studies | 0 | 0.0% |
| Science & Technology | 8 | 42.1% |
| Business | 8 | 42.1% |
| Education | 1 | 5.3% |
| Literature & Languages | 0 | 0.0% |
| Liberal Arts & History | 1 | 5.3% |
| Visual & Performing Arts | 0 | 0.0% |
| Communications | 0 | 0.0% |
| Arts & Humanities | 0 | 0.0% |
| Total | 19 | 100.0% |
Transportation & Commute in Brayton
Vehicle Availability by Sex in Brayton
The most prevalent vehicle ownership categories in Brayton are males with 3 vehicles (14, accounting for 32.6%) and females with 3 vehicles (8, making up 53.8%).
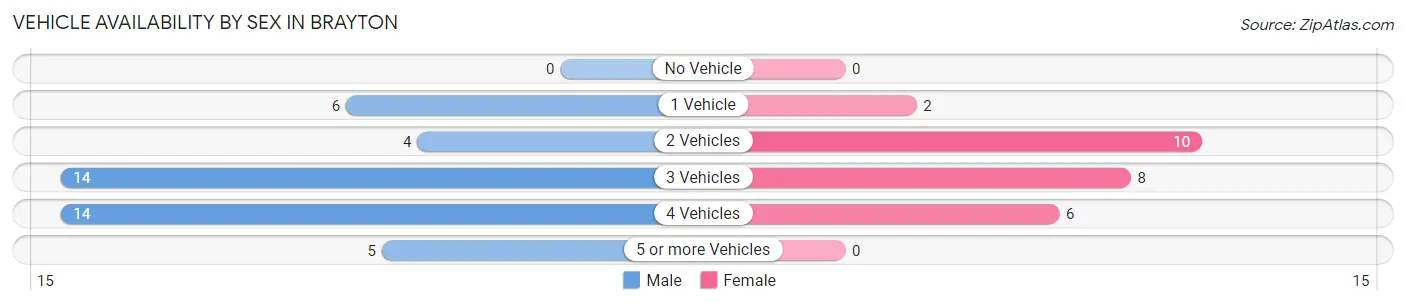
| Vehicles Available | Male | Female |
| No Vehicle | 0 (0.0%) | 0 (0.0%) |
| 1 Vehicle | 6 (14.0%) | 2 (7.7%) |
| 2 Vehicles | 4 (9.3%) | 10 (38.5%) |
| 3 Vehicles | 14 (32.6%) | 8 (30.8%) |
| 4 Vehicles | 14 (32.6%) | 6 (23.1%) |
| 5 or more Vehicles | 5 (11.6%) | 0 (0.0%) |
| Total | 43 (100.0%) | 26 (100.0%) |
Commute Time in Brayton
The most frequently occuring commute durations in Brayton are 20 to 24 minutes (39 commuters, 59.1%), 10 to 14 minutes (11 commuters, 16.7%), and 5 to 9 minutes (8 commuters, 12.1%).
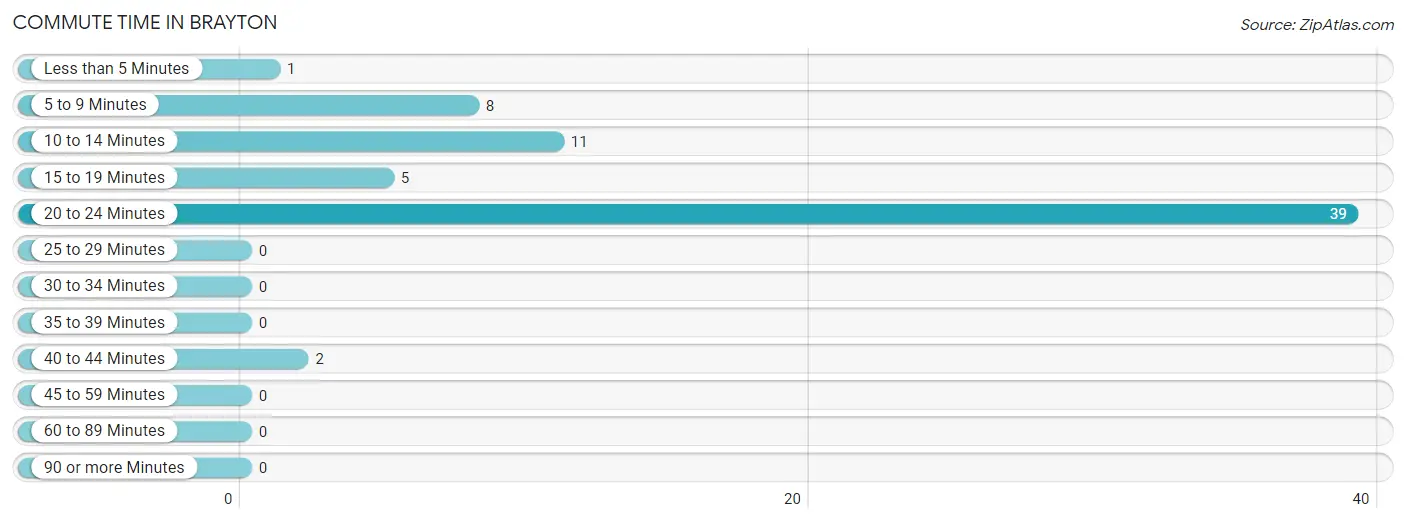
| Commute Time | # Commuters | % Commuters |
| Less than 5 Minutes | 1 | 1.5% |
| 5 to 9 Minutes | 8 | 12.1% |
| 10 to 14 Minutes | 11 | 16.7% |
| 15 to 19 Minutes | 5 | 7.6% |
| 20 to 24 Minutes | 39 | 59.1% |
| 25 to 29 Minutes | 0 | 0.0% |
| 30 to 34 Minutes | 0 | 0.0% |
| 35 to 39 Minutes | 0 | 0.0% |
| 40 to 44 Minutes | 2 | 3.0% |
| 45 to 59 Minutes | 0 | 0.0% |
| 60 to 89 Minutes | 0 | 0.0% |
| 90 or more Minutes | 0 | 0.0% |
Commute Time by Sex in Brayton
The most common commute times in Brayton are 20 to 24 minutes (28 commuters, 68.3%) for males and 20 to 24 minutes (11 commuters, 44.0%) for females.
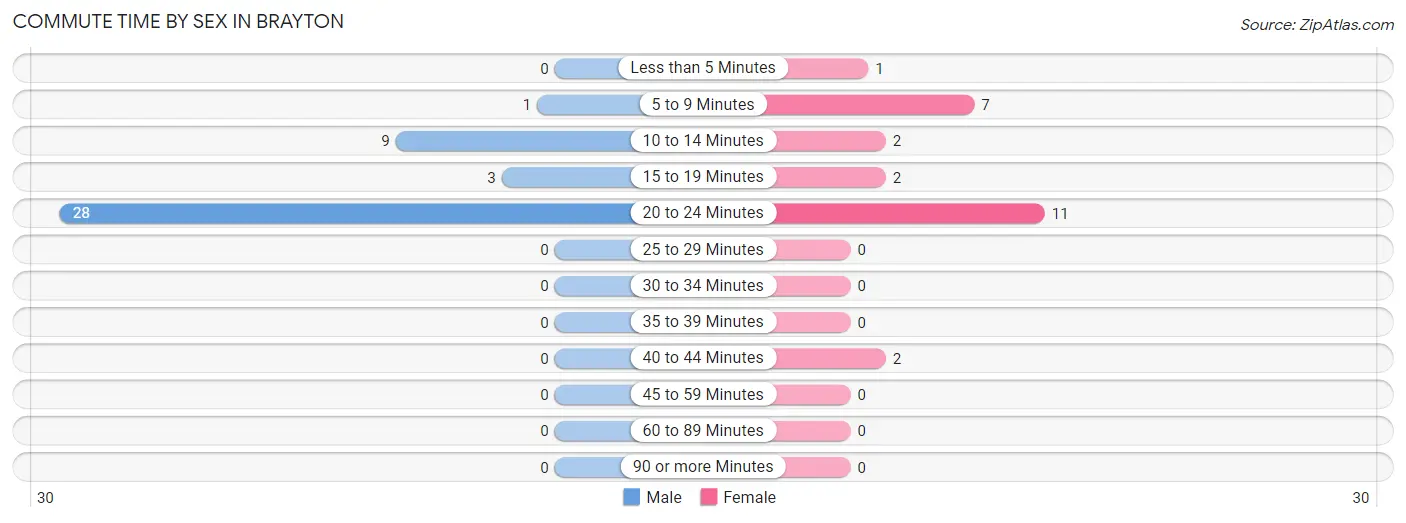
| Commute Time | Male | Female |
| Less than 5 Minutes | 0 (0.0%) | 1 (4.0%) |
| 5 to 9 Minutes | 1 (2.4%) | 7 (28.0%) |
| 10 to 14 Minutes | 9 (22.0%) | 2 (8.0%) |
| 15 to 19 Minutes | 3 (7.3%) | 2 (8.0%) |
| 20 to 24 Minutes | 28 (68.3%) | 11 (44.0%) |
| 25 to 29 Minutes | 0 (0.0%) | 0 (0.0%) |
| 30 to 34 Minutes | 0 (0.0%) | 0 (0.0%) |
| 35 to 39 Minutes | 0 (0.0%) | 0 (0.0%) |
| 40 to 44 Minutes | 0 (0.0%) | 2 (8.0%) |
| 45 to 59 Minutes | 0 (0.0%) | 0 (0.0%) |
| 60 to 89 Minutes | 0 (0.0%) | 0 (0.0%) |
| 90 or more Minutes | 0 (0.0%) | 0 (0.0%) |
Time of Departure to Work by Sex in Brayton
The most frequent times of departure to work in Brayton are 7:30 AM to 7:59 AM (10, 24.4%) for males and 7:00 AM to 7:29 AM (9, 36.0%) for females.
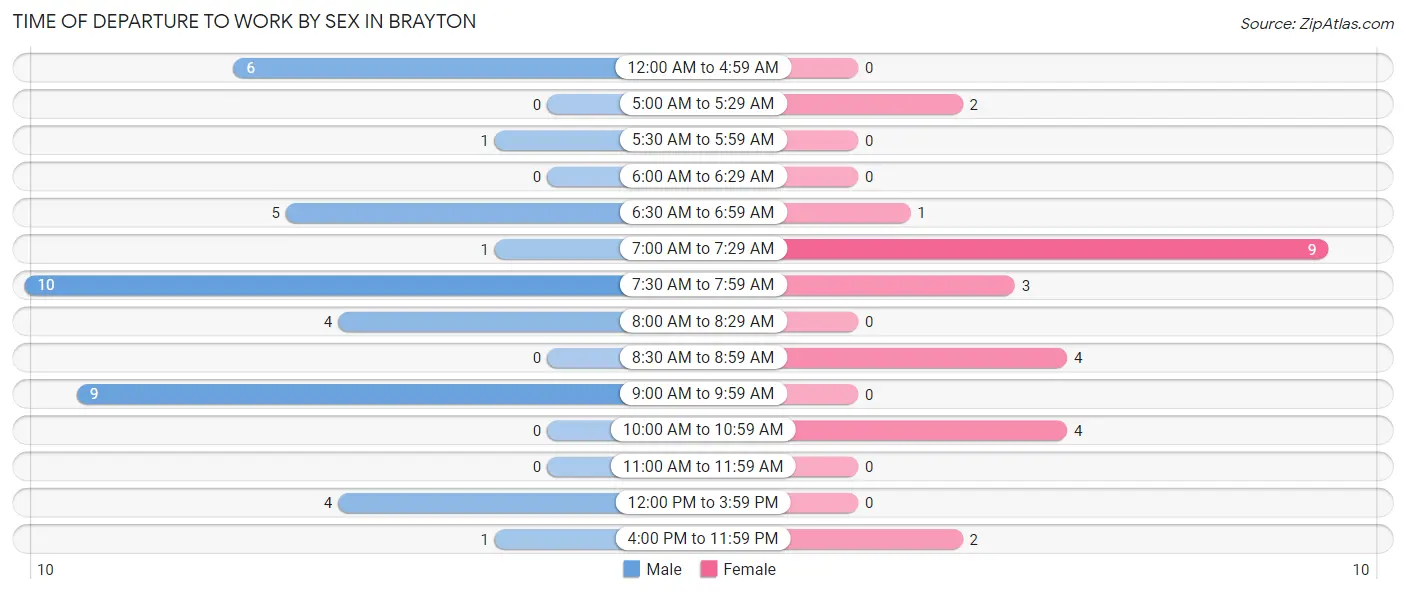
| Time of Departure | Male | Female |
| 12:00 AM to 4:59 AM | 6 (14.6%) | 0 (0.0%) |
| 5:00 AM to 5:29 AM | 0 (0.0%) | 2 (8.0%) |
| 5:30 AM to 5:59 AM | 1 (2.4%) | 0 (0.0%) |
| 6:00 AM to 6:29 AM | 0 (0.0%) | 0 (0.0%) |
| 6:30 AM to 6:59 AM | 5 (12.2%) | 1 (4.0%) |
| 7:00 AM to 7:29 AM | 1 (2.4%) | 9 (36.0%) |
| 7:30 AM to 7:59 AM | 10 (24.4%) | 3 (12.0%) |
| 8:00 AM to 8:29 AM | 4 (9.8%) | 0 (0.0%) |
| 8:30 AM to 8:59 AM | 0 (0.0%) | 4 (16.0%) |
| 9:00 AM to 9:59 AM | 9 (22.0%) | 0 (0.0%) |
| 10:00 AM to 10:59 AM | 0 (0.0%) | 4 (16.0%) |
| 11:00 AM to 11:59 AM | 0 (0.0%) | 0 (0.0%) |
| 12:00 PM to 3:59 PM | 4 (9.8%) | 0 (0.0%) |
| 4:00 PM to 11:59 PM | 1 (2.4%) | 2 (8.0%) |
| Total | 41 (100.0%) | 25 (100.0%) |
Housing Occupancy in Brayton
Occupancy by Ownership in Brayton
Of the total 46 dwellings in Brayton, owner-occupied units account for 42 (91.3%), while renter-occupied units make up 4 (8.7%).
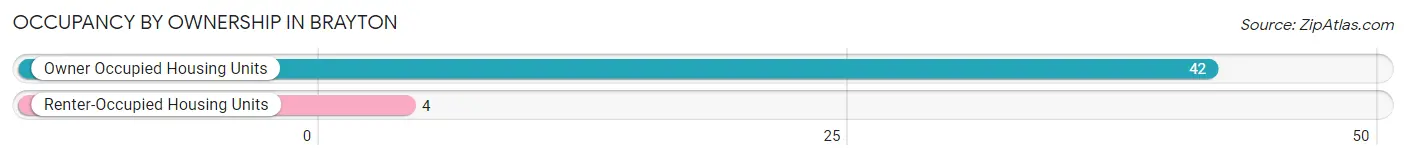
| Occupancy | # Housing Units | % Housing Units |
| Owner Occupied Housing Units | 42 | 91.3% |
| Renter-Occupied Housing Units | 4 | 8.7% |
| Total Occupied Housing Units | 46 | 100.0% |
Occupancy by Household Size in Brayton
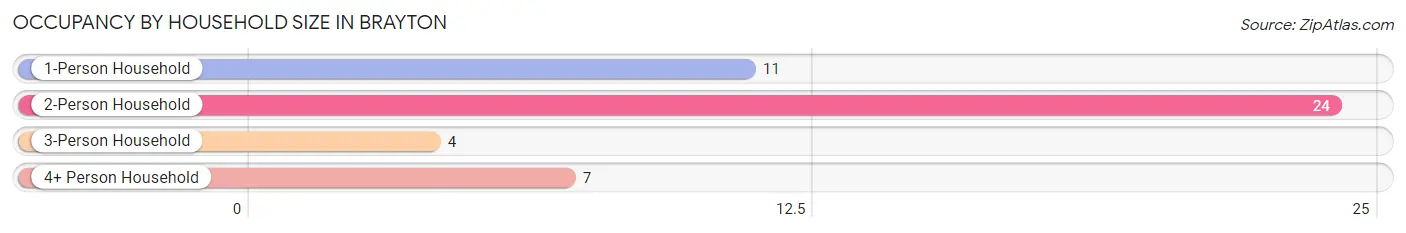
| Household Size | # Housing Units | % Housing Units |
| 1-Person Household | 11 | 23.9% |
| 2-Person Household | 24 | 52.2% |
| 3-Person Household | 4 | 8.7% |
| 4+ Person Household | 7 | 15.2% |
| Total Housing Units | 46 | 100.0% |
Occupancy by Ownership by Household Size in Brayton
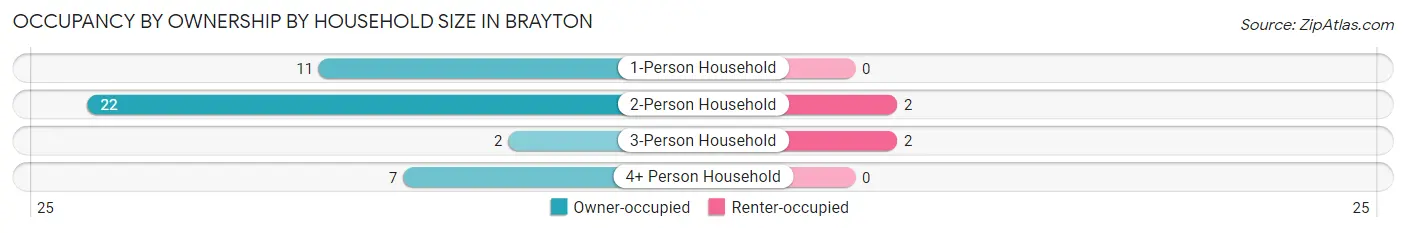
| Household Size | Owner-occupied | Renter-occupied |
| 1-Person Household | 11 (100.0%) | 0 (0.0%) |
| 2-Person Household | 22 (91.7%) | 2 (8.3%) |
| 3-Person Household | 2 (50.0%) | 2 (50.0%) |
| 4+ Person Household | 7 (100.0%) | 0 (0.0%) |
| Total Housing Units | 42 (91.3%) | 4 (8.7%) |
Occupancy by Educational Attainment in Brayton
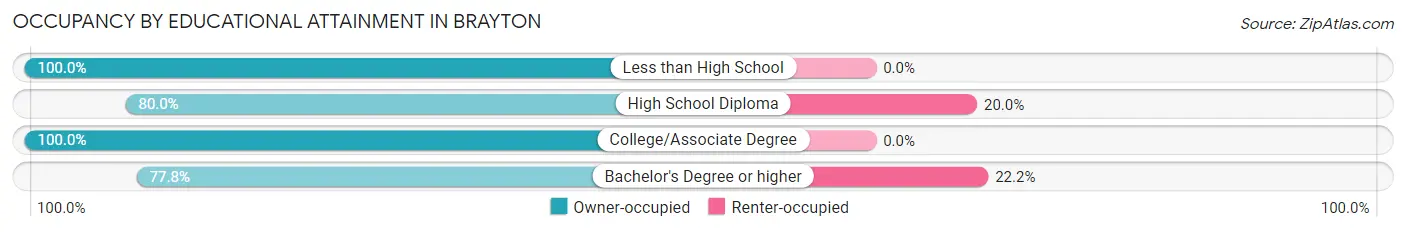
| Household Size | Owner-occupied | Renter-occupied |
| Less than High School | 7 (100.0%) | 0 (0.0%) |
| High School Diploma | 8 (80.0%) | 2 (20.0%) |
| College/Associate Degree | 20 (100.0%) | 0 (0.0%) |
| Bachelor's Degree or higher | 7 (77.8%) | 2 (22.2%) |
Occupancy by Age of Householder in Brayton
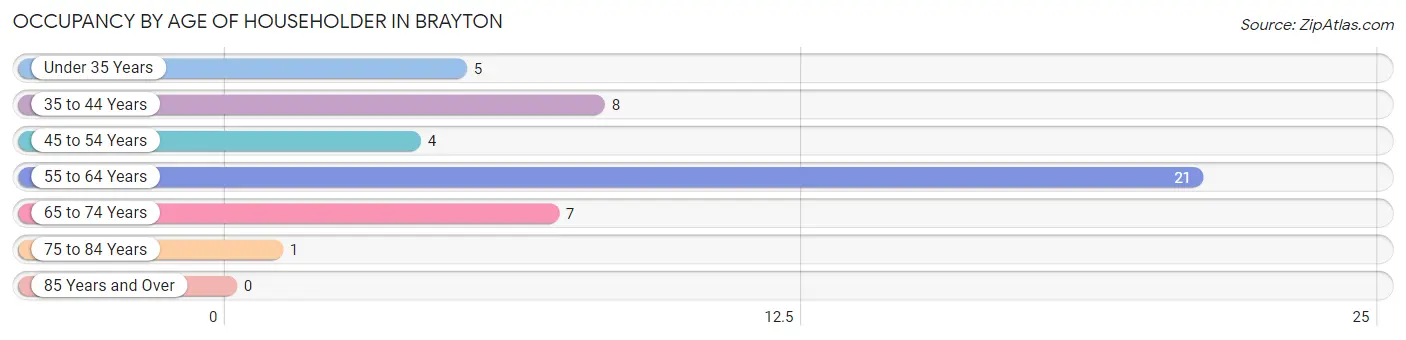
| Age Bracket | # Households | % Households |
| Under 35 Years | 5 | 10.9% |
| 35 to 44 Years | 8 | 17.4% |
| 45 to 54 Years | 4 | 8.7% |
| 55 to 64 Years | 21 | 45.7% |
| 65 to 74 Years | 7 | 15.2% |
| 75 to 84 Years | 1 | 2.2% |
| 85 Years and Over | 0 | 0.0% |
| Total | 46 | 100.0% |
Housing Finances in Brayton
Median Income by Occupancy in Brayton
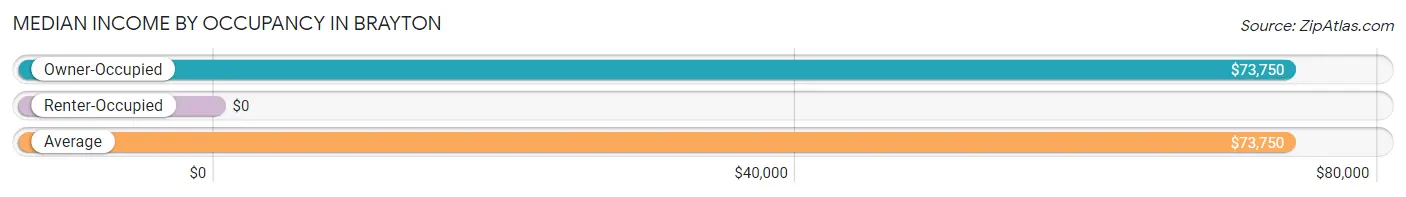
| Occupancy Type | # Households | Median Income |
| Owner-Occupied | 42 (91.3%) | $73,750 |
| Renter-Occupied | 4 (8.7%) | $0 |
| Average | 46 (100.0%) | $73,750 |
Occupancy by Householder Income Bracket in Brayton
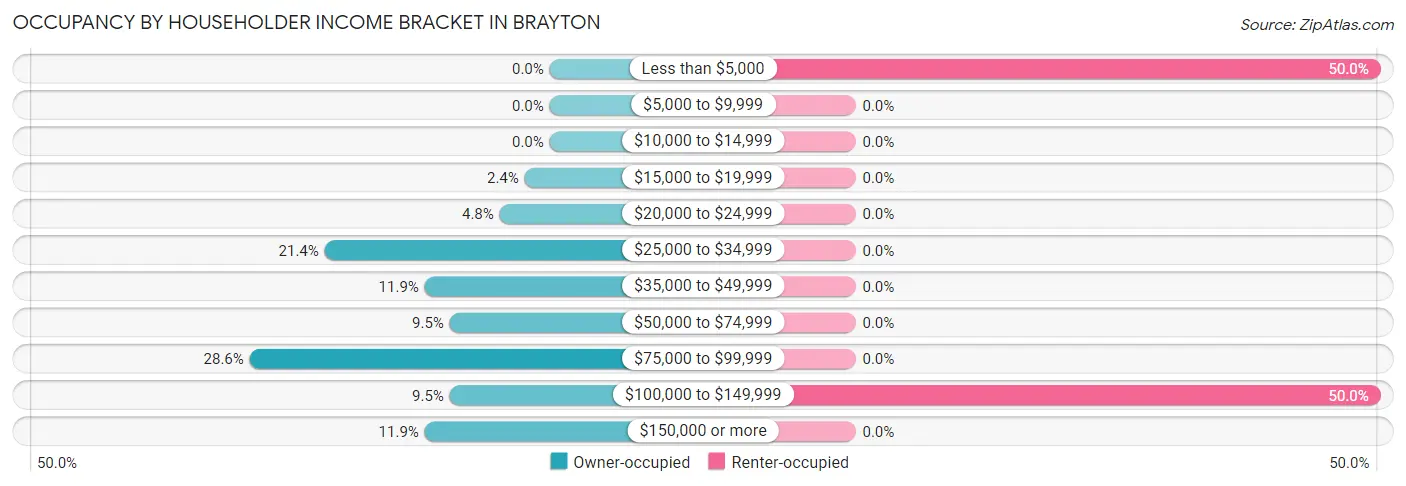
| Income Bracket | Owner-occupied | Renter-occupied |
| Less than $5,000 | 0 (0.0%) | 2 (50.0%) |
| $5,000 to $9,999 | 0 (0.0%) | 0 (0.0%) |
| $10,000 to $14,999 | 0 (0.0%) | 0 (0.0%) |
| $15,000 to $19,999 | 1 (2.4%) | 0 (0.0%) |
| $20,000 to $24,999 | 2 (4.8%) | 0 (0.0%) |
| $25,000 to $34,999 | 9 (21.4%) | 0 (0.0%) |
| $35,000 to $49,999 | 5 (11.9%) | 0 (0.0%) |
| $50,000 to $74,999 | 4 (9.5%) | 0 (0.0%) |
| $75,000 to $99,999 | 12 (28.6%) | 0 (0.0%) |
| $100,000 to $149,999 | 4 (9.5%) | 2 (50.0%) |
| $150,000 or more | 5 (11.9%) | 0 (0.0%) |
| Total | 42 (100.0%) | 4 (100.0%) |
Monthly Housing Cost Tiers in Brayton
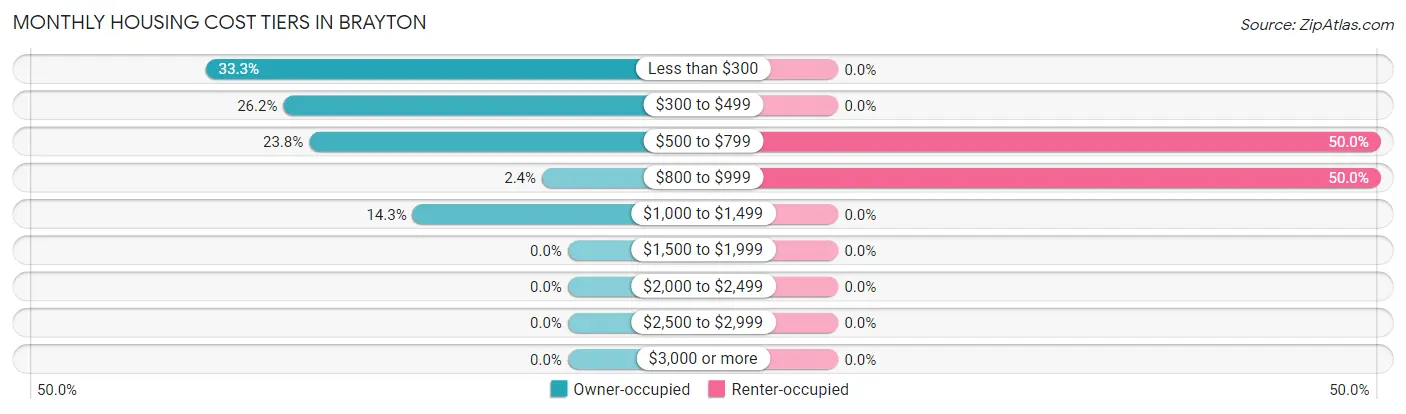
| Monthly Cost | Owner-occupied | Renter-occupied |
| Less than $300 | 14 (33.3%) | 0 (0.0%) |
| $300 to $499 | 11 (26.2%) | 0 (0.0%) |
| $500 to $799 | 10 (23.8%) | 2 (50.0%) |
| $800 to $999 | 1 (2.4%) | 2 (50.0%) |
| $1,000 to $1,499 | 6 (14.3%) | 0 (0.0%) |
| $1,500 to $1,999 | 0 (0.0%) | 0 (0.0%) |
| $2,000 to $2,499 | 0 (0.0%) | 0 (0.0%) |
| $2,500 to $2,999 | 0 (0.0%) | 0 (0.0%) |
| $3,000 or more | 0 (0.0%) | 0 (0.0%) |
| Total | 42 (100.0%) | 4 (100.0%) |
Physical Housing Characteristics in Brayton
Housing Structures in Brayton
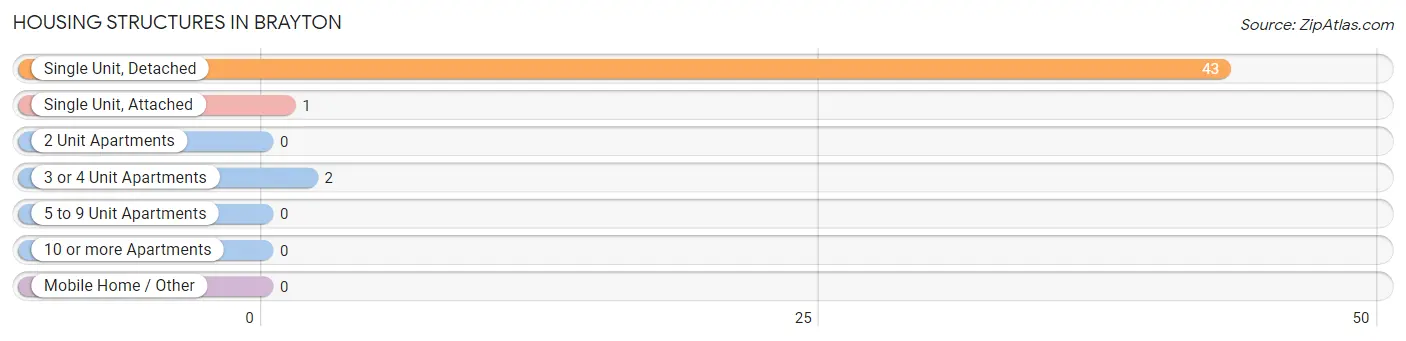
| Structure Type | # Housing Units | % Housing Units |
| Single Unit, Detached | 43 | 93.5% |
| Single Unit, Attached | 1 | 2.2% |
| 2 Unit Apartments | 0 | 0.0% |
| 3 or 4 Unit Apartments | 2 | 4.3% |
| 5 to 9 Unit Apartments | 0 | 0.0% |
| 10 or more Apartments | 0 | 0.0% |
| Mobile Home / Other | 0 | 0.0% |
| Total | 46 | 100.0% |
Housing Structures by Occupancy in Brayton
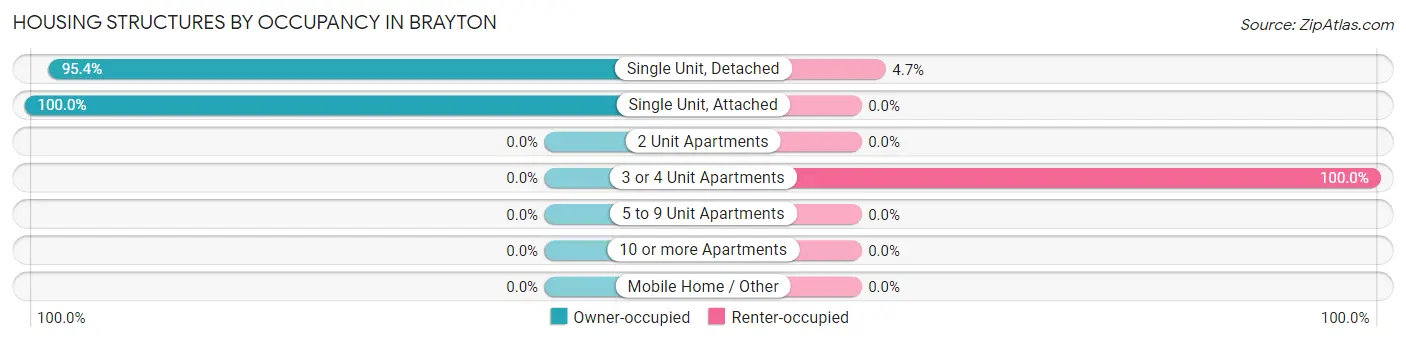
| Structure Type | Owner-occupied | Renter-occupied |
| Single Unit, Detached | 41 (95.4%) | 2 (4.6%) |
| Single Unit, Attached | 1 (100.0%) | 0 (0.0%) |
| 2 Unit Apartments | 0 (0.0%) | 0 (0.0%) |
| 3 or 4 Unit Apartments | 0 (0.0%) | 2 (100.0%) |
| 5 to 9 Unit Apartments | 0 (0.0%) | 0 (0.0%) |
| 10 or more Apartments | 0 (0.0%) | 0 (0.0%) |
| Mobile Home / Other | 0 (0.0%) | 0 (0.0%) |
| Total | 42 (91.3%) | 4 (8.7%) |
Housing Structures by Number of Rooms in Brayton
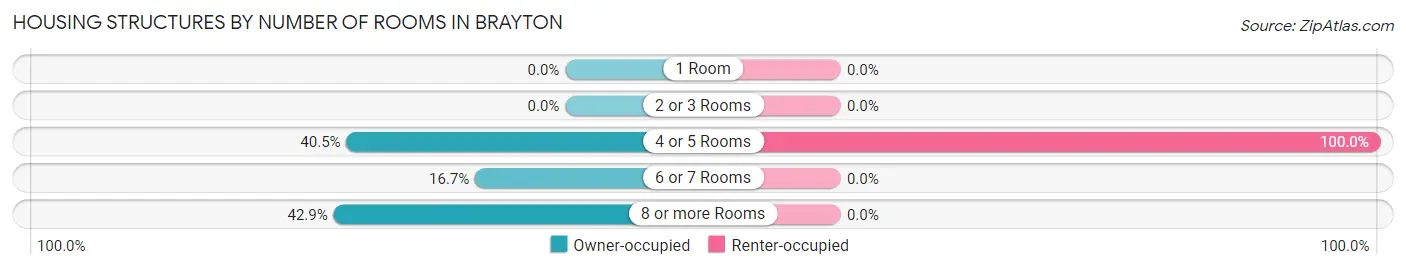
| Number of Rooms | Owner-occupied | Renter-occupied |
| 1 Room | 0 (0.0%) | 0 (0.0%) |
| 2 or 3 Rooms | 0 (0.0%) | 0 (0.0%) |
| 4 or 5 Rooms | 17 (40.5%) | 4 (100.0%) |
| 6 or 7 Rooms | 7 (16.7%) | 0 (0.0%) |
| 8 or more Rooms | 18 (42.9%) | 0 (0.0%) |
| Total | 42 (100.0%) | 4 (100.0%) |
Housing Structure by Heating Type in Brayton
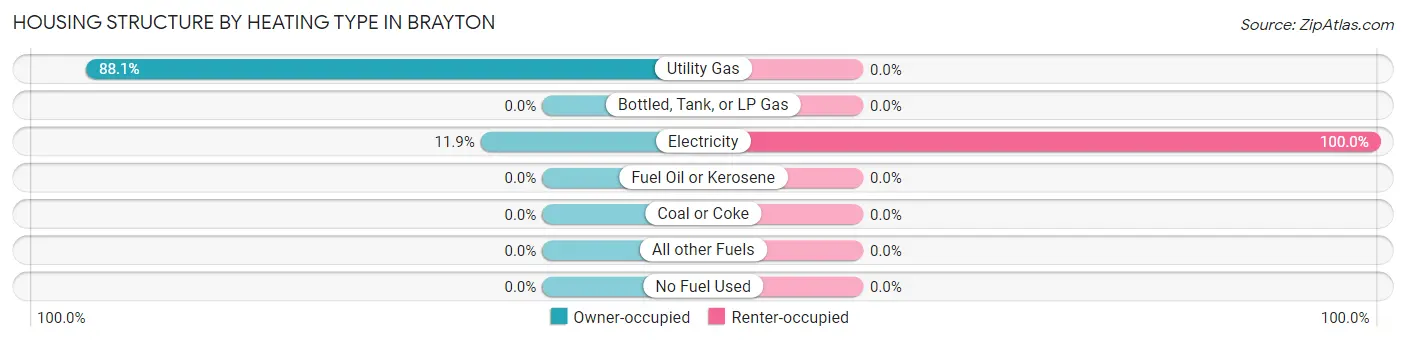
| Heating Type | Owner-occupied | Renter-occupied |
| Utility Gas | 37 (88.1%) | 0 (0.0%) |
| Bottled, Tank, or LP Gas | 0 (0.0%) | 0 (0.0%) |
| Electricity | 5 (11.9%) | 4 (100.0%) |
| Fuel Oil or Kerosene | 0 (0.0%) | 0 (0.0%) |
| Coal or Coke | 0 (0.0%) | 0 (0.0%) |
| All other Fuels | 0 (0.0%) | 0 (0.0%) |
| No Fuel Used | 0 (0.0%) | 0 (0.0%) |
| Total | 42 (100.0%) | 4 (100.0%) |
Household Vehicle Usage in Brayton
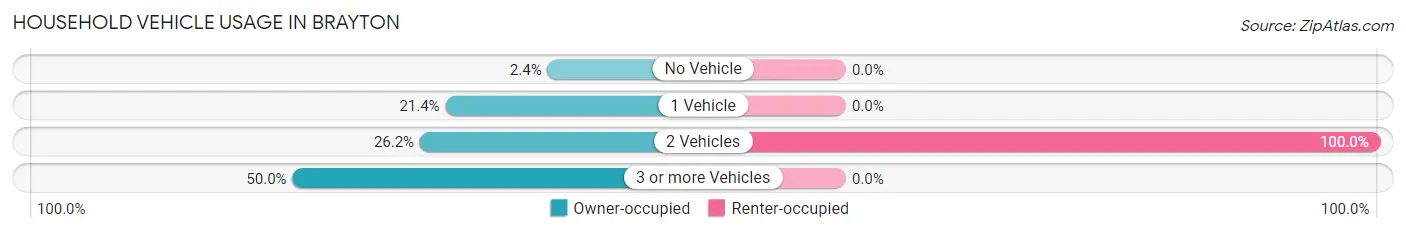
| Vehicles per Household | Owner-occupied | Renter-occupied |
| No Vehicle | 1 (2.4%) | 0 (0.0%) |
| 1 Vehicle | 9 (21.4%) | 0 (0.0%) |
| 2 Vehicles | 11 (26.2%) | 4 (100.0%) |
| 3 or more Vehicles | 21 (50.0%) | 0 (0.0%) |
| Total | 42 (100.0%) | 4 (100.0%) |
Real Estate & Mortgages in Brayton
Real Estate and Mortgage Overview in Brayton
| Characteristic | Without Mortgage | With Mortgage |
| Housing Units | 31 | 11 |
| Median Property Value | - | - |
| Median Household Income | - | - |
| Monthly Housing Costs | $311 | $0 |
| Real Estate Taxes | $500 | $0 |
Property Value by Mortgage Status in Brayton
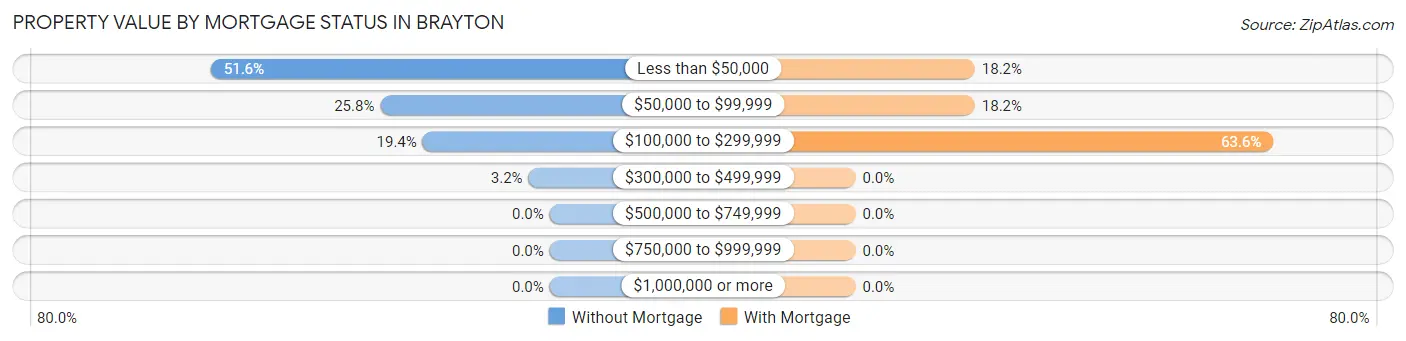
| Property Value | Without Mortgage | With Mortgage |
| Less than $50,000 | 16 (51.6%) | 2 (18.2%) |
| $50,000 to $99,999 | 8 (25.8%) | 2 (18.2%) |
| $100,000 to $299,999 | 6 (19.4%) | 7 (63.6%) |
| $300,000 to $499,999 | 1 (3.2%) | 0 (0.0%) |
| $500,000 to $749,999 | 0 (0.0%) | 0 (0.0%) |
| $750,000 to $999,999 | 0 (0.0%) | 0 (0.0%) |
| $1,000,000 or more | 0 (0.0%) | 0 (0.0%) |
| Total | 31 (100.0%) | 11 (100.0%) |
Household Income by Mortgage Status in Brayton
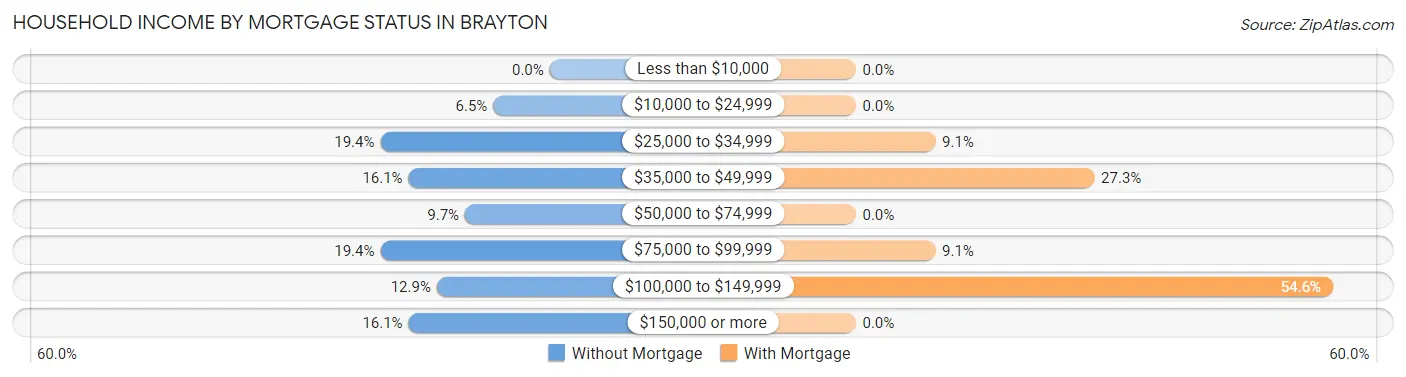
| Household Income | Without Mortgage | With Mortgage |
| Less than $10,000 | 0 (0.0%) | 0 (0.0%) |
| $10,000 to $24,999 | 2 (6.5%) | 0 (0.0%) |
| $25,000 to $34,999 | 6 (19.4%) | 1 (9.1%) |
| $35,000 to $49,999 | 5 (16.1%) | 3 (27.3%) |
| $50,000 to $74,999 | 3 (9.7%) | 0 (0.0%) |
| $75,000 to $99,999 | 6 (19.4%) | 1 (9.1%) |
| $100,000 to $149,999 | 4 (12.9%) | 6 (54.5%) |
| $150,000 or more | 5 (16.1%) | 0 (0.0%) |
| Total | 31 (100.0%) | 11 (100.0%) |
Property Value to Household Income Ratio in Brayton
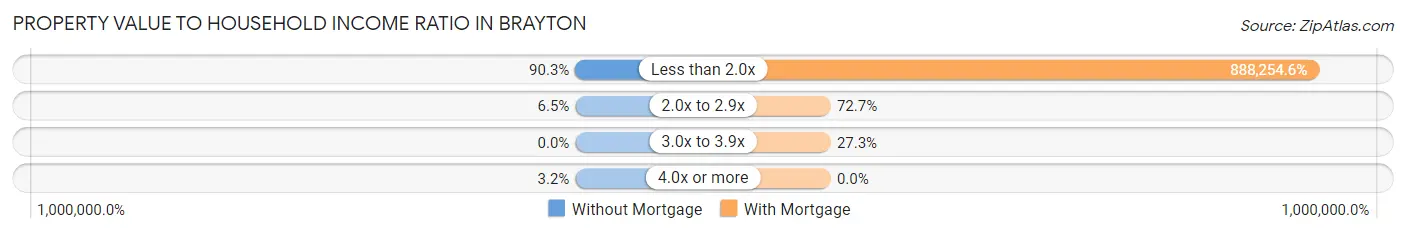
| Value-to-Income Ratio | Without Mortgage | With Mortgage |
| Less than 2.0x | 28 (90.3%) | 97,708 (888,254.6%) |
| 2.0x to 2.9x | 2 (6.5%) | 8 (72.7%) |
| 3.0x to 3.9x | 0 (0.0%) | 3 (27.3%) |
| 4.0x or more | 1 (3.2%) | 0 (0.0%) |
| Total | 31 (100.0%) | 11 (100.0%) |
Real Estate Taxes by Mortgage Status in Brayton
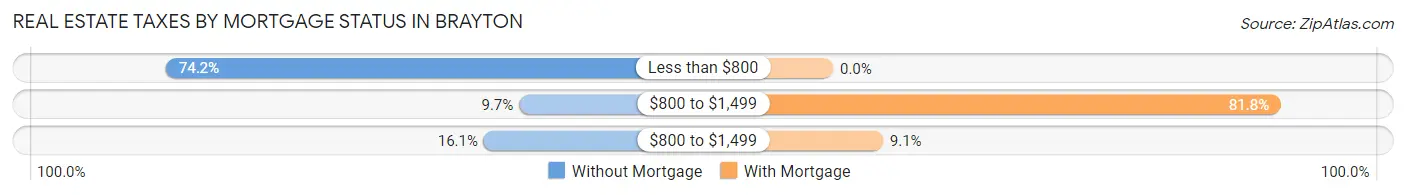
| Property Taxes | Without Mortgage | With Mortgage |
| Less than $800 | 23 (74.2%) | 0 (0.0%) |
| $800 to $1,499 | 3 (9.7%) | 9 (81.8%) |
| $800 to $1,499 | 5 (16.1%) | 1 (9.1%) |
| Total | 31 (100.0%) | 11 (100.0%) |
Health & Disability in Brayton
Health Insurance Coverage by Age in Brayton
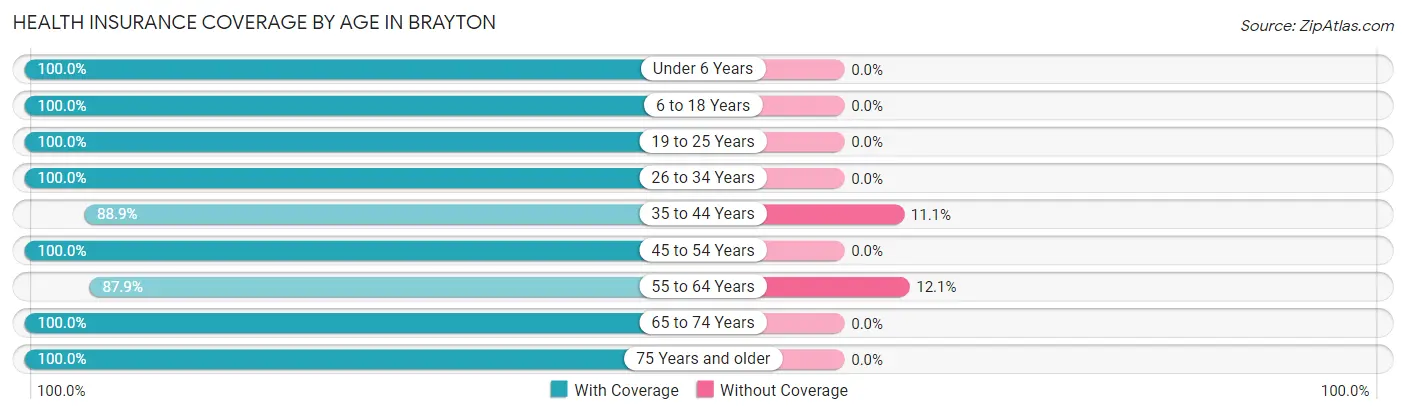
| Age Bracket | With Coverage | Without Coverage |
| Under 6 Years | 5 (100.0%) | 0 (0.0%) |
| 6 to 18 Years | 3 (100.0%) | 0 (0.0%) |
| 19 to 25 Years | 16 (100.0%) | 0 (0.0%) |
| 26 to 34 Years | 19 (100.0%) | 0 (0.0%) |
| 35 to 44 Years | 8 (88.9%) | 1 (11.1%) |
| 45 to 54 Years | 7 (100.0%) | 0 (0.0%) |
| 55 to 64 Years | 29 (87.9%) | 4 (12.1%) |
| 65 to 74 Years | 11 (100.0%) | 0 (0.0%) |
| 75 Years and older | 1 (100.0%) | 0 (0.0%) |
| Total | 99 (95.2%) | 5 (4.8%) |
Health Insurance Coverage by Citizenship Status in Brayton
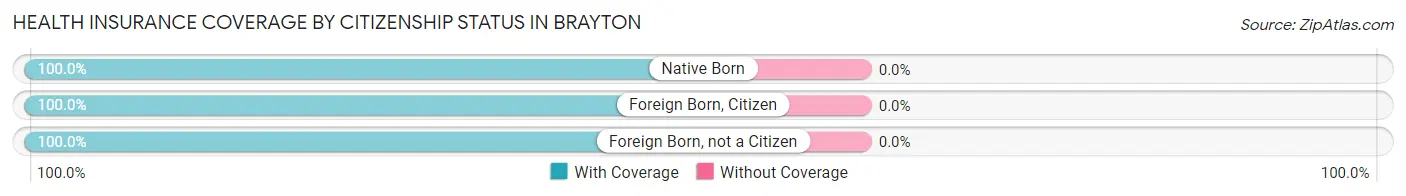
| Citizenship Status | With Coverage | Without Coverage |
| Native Born | 5 (100.0%) | 0 (0.0%) |
| Foreign Born, Citizen | 3 (100.0%) | 0 (0.0%) |
| Foreign Born, not a Citizen | 16 (100.0%) | 0 (0.0%) |
Health Insurance Coverage by Household Income in Brayton
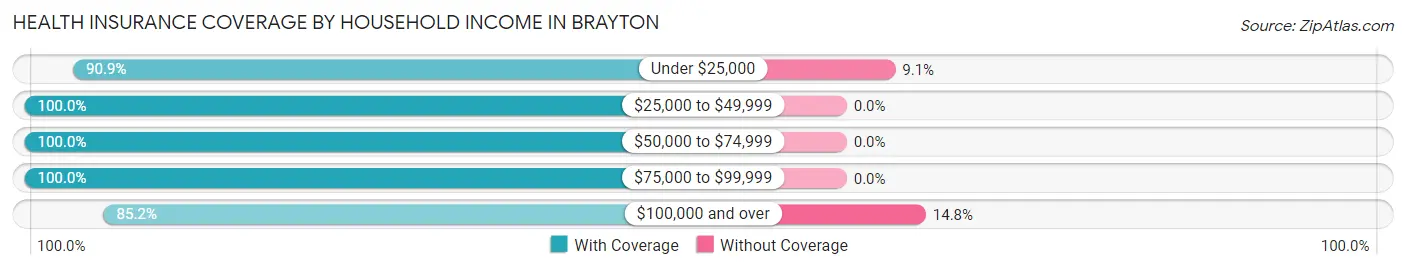
| Household Income | With Coverage | Without Coverage |
| Under $25,000 | 10 (90.9%) | 1 (9.1%) |
| $25,000 to $49,999 | 22 (100.0%) | 0 (0.0%) |
| $50,000 to $74,999 | 7 (100.0%) | 0 (0.0%) |
| $75,000 to $99,999 | 37 (100.0%) | 0 (0.0%) |
| $100,000 and over | 23 (85.2%) | 4 (14.8%) |
Public vs Private Health Insurance Coverage by Age in Brayton
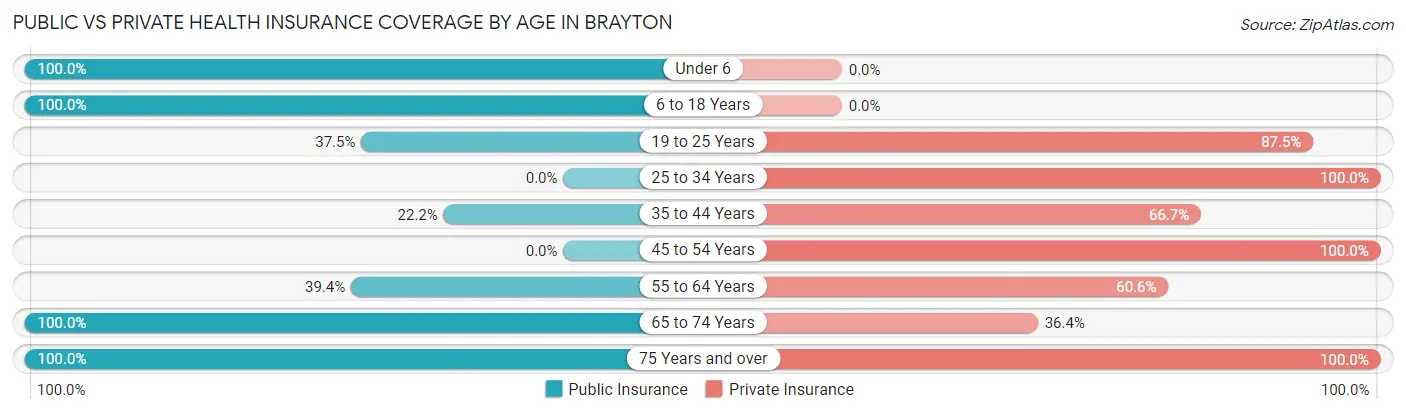
| Age Bracket | Public Insurance | Private Insurance |
| Under 6 | 5 (100.0%) | 0 (0.0%) |
| 6 to 18 Years | 3 (100.0%) | 0 (0.0%) |
| 19 to 25 Years | 6 (37.5%) | 14 (87.5%) |
| 25 to 34 Years | 0 (0.0%) | 19 (100.0%) |
| 35 to 44 Years | 2 (22.2%) | 6 (66.7%) |
| 45 to 54 Years | 0 (0.0%) | 7 (100.0%) |
| 55 to 64 Years | 13 (39.4%) | 20 (60.6%) |
| 65 to 74 Years | 11 (100.0%) | 4 (36.4%) |
| 75 Years and over | 1 (100.0%) | 1 (100.0%) |
| Total | 41 (39.4%) | 71 (68.3%) |
Disability Status by Sex by Age in Brayton
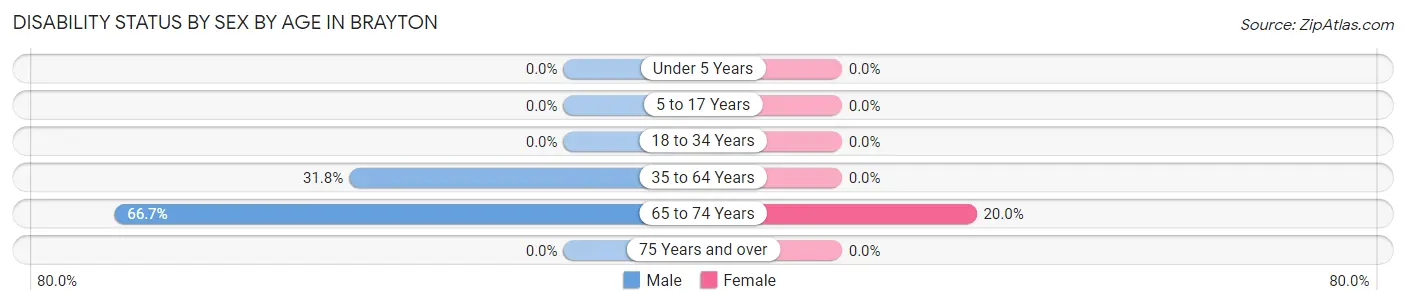
| Age Bracket | Male | Female |
| Under 5 Years | 0 (0.0%) | 0 (0.0%) |
| 5 to 17 Years | 0 (0.0%) | 0 (0.0%) |
| 18 to 34 Years | 0 (0.0%) | 0 (0.0%) |
| 35 to 64 Years | 7 (31.8%) | 0 (0.0%) |
| 65 to 74 Years | 4 (66.7%) | 1 (20.0%) |
| 75 Years and over | 0 (0.0%) | 0 (0.0%) |
Disability Class by Sex by Age in Brayton
Disability Class: Hearing Difficulty
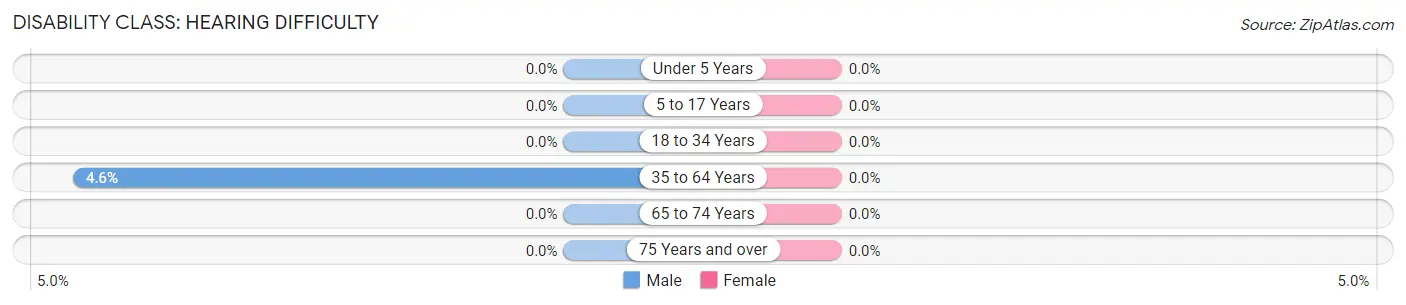
| Age Bracket | Male | Female |
| Under 5 Years | 0 (0.0%) | 0 (0.0%) |
| 5 to 17 Years | 0 (0.0%) | 0 (0.0%) |
| 18 to 34 Years | 0 (0.0%) | 0 (0.0%) |
| 35 to 64 Years | 1 (4.5%) | 0 (0.0%) |
| 65 to 74 Years | 0 (0.0%) | 0 (0.0%) |
| 75 Years and over | 0 (0.0%) | 0 (0.0%) |
Disability Class: Vision Difficulty
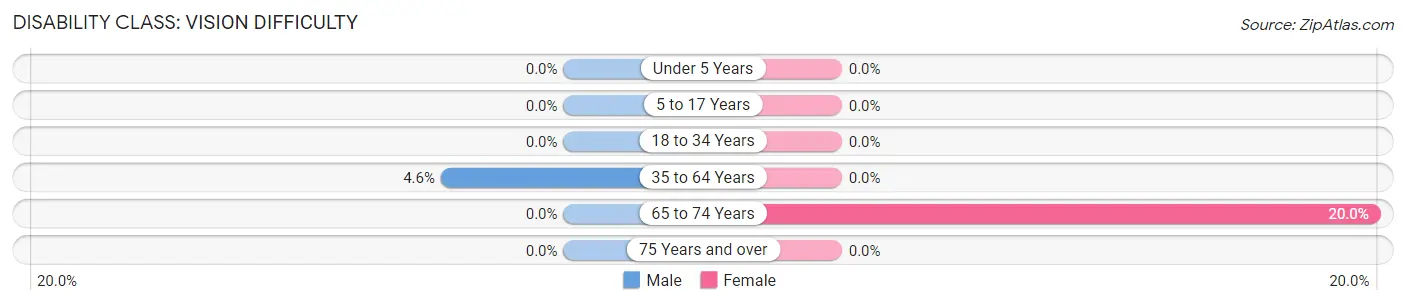
| Age Bracket | Male | Female |
| Under 5 Years | 0 (0.0%) | 0 (0.0%) |
| 5 to 17 Years | 0 (0.0%) | 0 (0.0%) |
| 18 to 34 Years | 0 (0.0%) | 0 (0.0%) |
| 35 to 64 Years | 1 (4.5%) | 0 (0.0%) |
| 65 to 74 Years | 0 (0.0%) | 1 (20.0%) |
| 75 Years and over | 0 (0.0%) | 0 (0.0%) |
Disability Class: Cognitive Difficulty
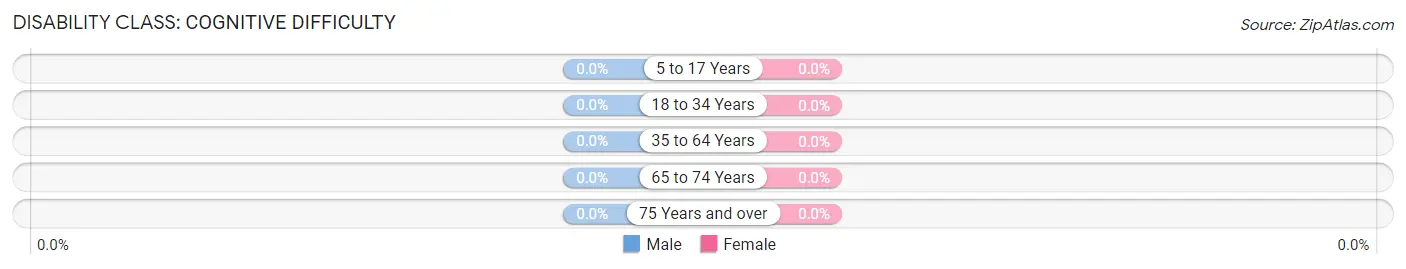
| Age Bracket | Male | Female |
| 5 to 17 Years | 0 (0.0%) | 0 (0.0%) |
| 18 to 34 Years | 0 (0.0%) | 0 (0.0%) |
| 35 to 64 Years | 0 (0.0%) | 0 (0.0%) |
| 65 to 74 Years | 0 (0.0%) | 0 (0.0%) |
| 75 Years and over | 0 (0.0%) | 0 (0.0%) |
Disability Class: Ambulatory Difficulty
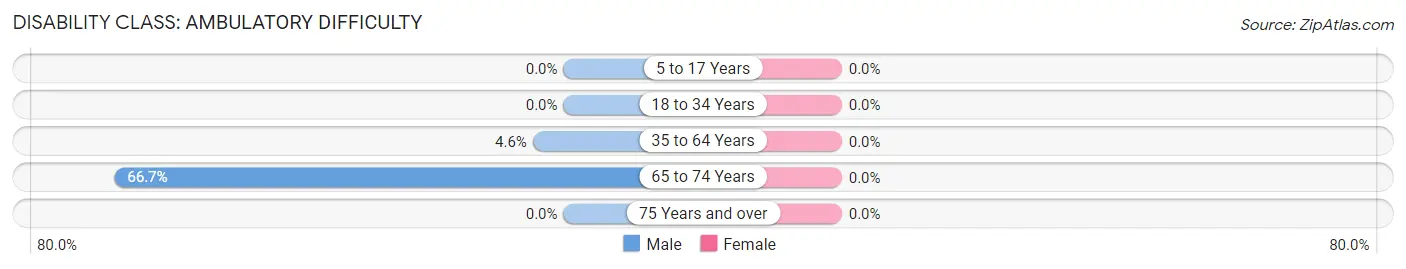
| Age Bracket | Male | Female |
| 5 to 17 Years | 0 (0.0%) | 0 (0.0%) |
| 18 to 34 Years | 0 (0.0%) | 0 (0.0%) |
| 35 to 64 Years | 1 (4.5%) | 0 (0.0%) |
| 65 to 74 Years | 4 (66.7%) | 0 (0.0%) |
| 75 Years and over | 0 (0.0%) | 0 (0.0%) |
Disability Class: Self-Care Difficulty
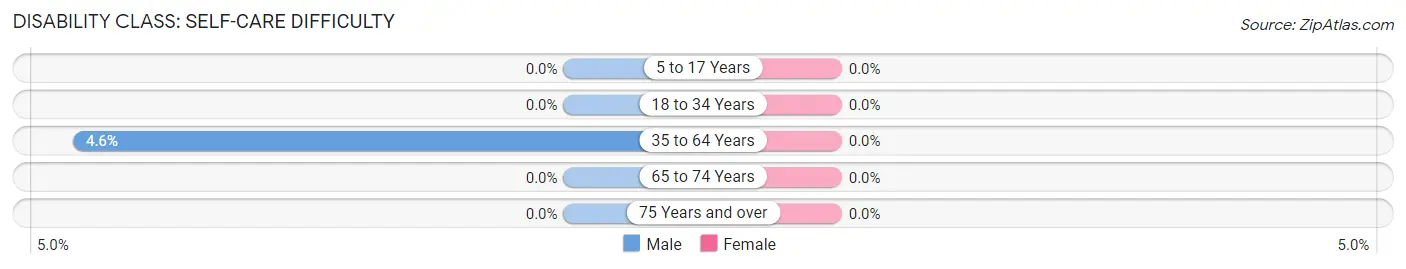
| Age Bracket | Male | Female |
| 5 to 17 Years | 0 (0.0%) | 0 (0.0%) |
| 18 to 34 Years | 0 (0.0%) | 0 (0.0%) |
| 35 to 64 Years | 1 (4.5%) | 0 (0.0%) |
| 65 to 74 Years | 0 (0.0%) | 0 (0.0%) |
| 75 Years and over | 0 (0.0%) | 0 (0.0%) |
Technology Access in Brayton
Computing Device Access in Brayton
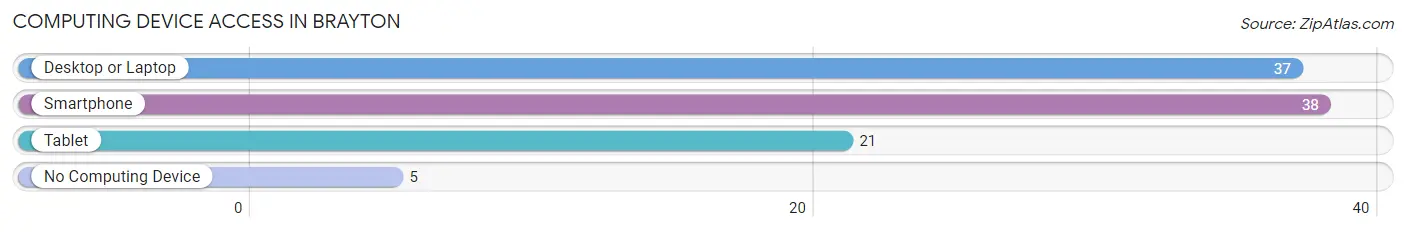
| Device Type | # Households | % Households |
| Desktop or Laptop | 37 | 80.4% |
| Smartphone | 38 | 82.6% |
| Tablet | 21 | 45.7% |
| No Computing Device | 5 | 10.9% |
| Total | 46 | 100.0% |
Internet Access in Brayton
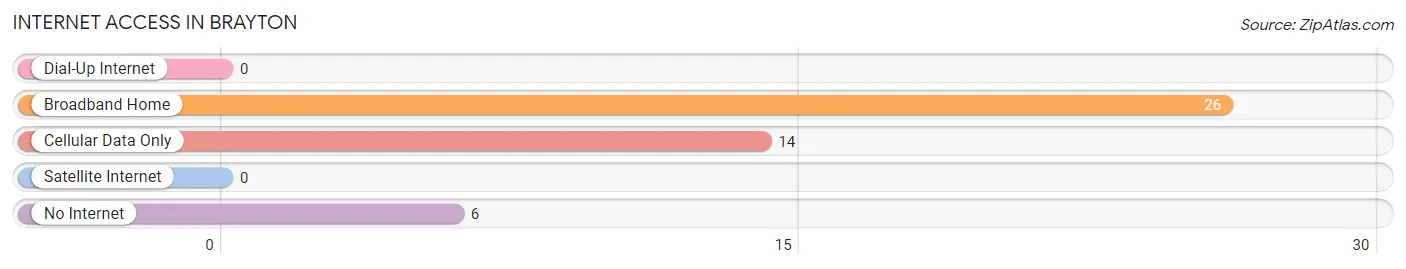
| Internet Type | # Households | % Households |
| Dial-Up Internet | 0 | 0.0% |
| Broadband Home | 26 | 56.5% |
| Cellular Data Only | 14 | 30.4% |
| Satellite Internet | 0 | 0.0% |
| No Internet | 6 | 13.0% |
| Total | 46 | 100.0% |
Brayton Summary
Brayton is a small city located in Audubon County, Iowa. It is situated in the western part of the state, approximately 30 miles northwest of Des Moines. The city has a population of approximately 500 people, and is part of the larger Des Moines-West Des Moines metropolitan area.
History
Brayton was founded in 1881 by a group of settlers from the nearby town of Audubon. The town was named after the first settler, William Brayton, who had purchased the land from the government. The town was originally a farming community, and the main crops grown were corn, oats, and hay. In the early 1900s, the town began to grow and develop, and by the 1920s, it had become a thriving community.
In the 1950s, Brayton began to experience a period of growth and development. The town was connected to the nearby city of Des Moines by a railroad line, and the population began to increase. By the 1970s, Brayton had become a popular destination for tourists, and the town began to attract more businesses and industry.
Geography
Brayton is located in western Iowa, approximately 30 miles northwest of Des Moines. The city is situated in the Des Moines-West Des Moines metropolitan area, and is surrounded by rolling hills and farmland. The city is located on the banks of the Des Moines River, and is home to several parks and recreational areas.
Economy
Brayton’s economy is largely based on agriculture and tourism. The town is home to several farms, and the main crops grown are corn, oats, and hay. The town is also home to several small businesses, including restaurants, shops, and other services. Tourism is also an important part of the local economy, and the town is home to several attractions, including a historic downtown area, a museum, and a golf course.
Demographics
As of the 2010 census, Brayton had a population of 500 people. The racial makeup of the town was 97.2% White, 0.6% African American, 0.2% Native American, 0.2% Asian, 0.2% from other races, and 1.8% from two or more races. The median household income was $41,250, and the median family income was $50,000. The per capita income was $20,000.
Brayton is a small town with a rich history and a vibrant economy. The town is home to several farms, businesses, and attractions, and is a popular destination for tourists. The town is also home to a diverse population, and is a great place to live and work.
Common Questions
What is the Total Population of Brayton?
Total Population of Brayton is 104.
What is the Total Male Population of Brayton?
Total Male Population of Brayton is 58.
What is the Total Female Population of Brayton?
Total Female Population of Brayton is 46.
What is the Ratio of Males per 100 Females in Brayton?
There are 126.09 Males per 100 Females in Brayton.
What is the Ratio of Females per 100 Males in Brayton?
There are 79.31 Females per 100 Males in Brayton.
What is the Median Population Age in Brayton?
Median Population Age in Brayton is 45.0 Years.
What is the Average Family Size in Brayton
Average Family Size in Brayton is 2.8 People.
What is the Average Household Size in Brayton
Average Household Size in Brayton is 2.3 People.
What is Per Capita Income in Brayton?
Per Capita income in Brayton is $35,960.
What is the Median Family Income in Brayton?
Median Family Income in Brayton is $81,667.
What is the Median Household income in Brayton?
Median Household Income in Brayton is $73,750.
What is Income or Wage Gap in Brayton?
Income or Wage Gap in Brayton is 10.3%.
Women in Brayton earn 89.7 cents for every dollar earned by a man.
What is Inequality or Gini Index in Brayton?
Inequality or Gini Index in Brayton is 0.42.
How Large is the Labor Force in Brayton?
There are 71 People in the Labor Forcein in Brayton.
What is the Percentage of People in the Labor Force in Brayton?
74.0% of People are in the Labor Force in Brayton.
What is the Unemployment Rate in Brayton?
Unemployment Rate in Brayton is 1.4%.