College Springs, IA Map & Demographics
College Springs Map
College Springs Overview
$26,411
PER CAPITA INCOME
$48,750
AVG FAMILY INCOME
$67,695
AVG HOUSEHOLD INCOME
0.31
INEQUALITY / GINI INDEX
217
TOTAL POPULATION
111
MALE POPULATION
106
FEMALE POPULATION
104.72
MALES / 100 FEMALES
95.50
FEMALES / 100 MALES
47.3
MEDIAN AGE
3.0
AVG FAMILY SIZE
2.1
AVG HOUSEHOLD SIZE
119
LABOR FORCE [ PEOPLE ]
70.4%
PERCENT IN LABOR FORCE
1.7%
UNEMPLOYMENT RATE
College Springs Zip Codes
College Springs Area Codes
Income in College Springs
Income Overview in College Springs
Per Capita Income in College Springs is $26,411, while median incomes of families and households are $48,750 and $67,695 respectively.
| Characteristic | Number | Measure |
| Per Capita Income | 217 | $26,411 |
| Median Family Income | 47 | $48,750 |
| Mean Family Income | 47 | $60,847 |
| Median Household Income | 103 | $67,695 |
| Mean Household Income | 103 | $56,954 |
| Income Deficit | 47 | $0 |
| Wage / Income Gap (%) | 217 | 0.00% |
| Wage / Income Gap ($) | 217 | 100.00¢ per $1 |
| Gini / Inequality Index | 217 | 0.31 |
Earnings by Sex in College Springs
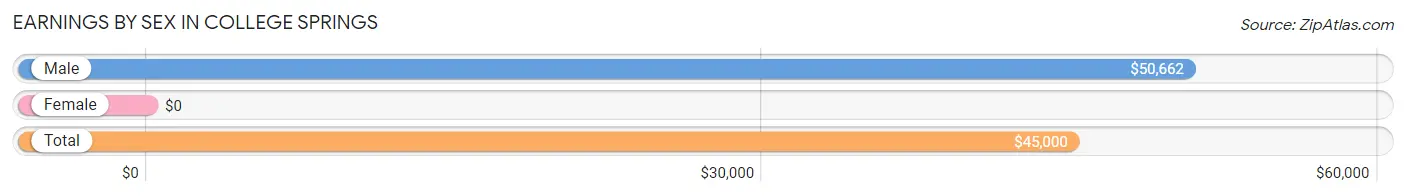
| Sex | Number | Average Earnings |
| Male | 70 (57.4%) | $50,662 |
| Female | 52 (42.6%) | $0 |
| Total | 122 (100.0%) | $45,000 |
Earnings by Sex by Income Bracket in College Springs
The most common earnings brackets in College Springs are $50,000 to $54,999 for men (37 | 52.9%) and $12,500 to $14,999 for women (15 | 28.8%).
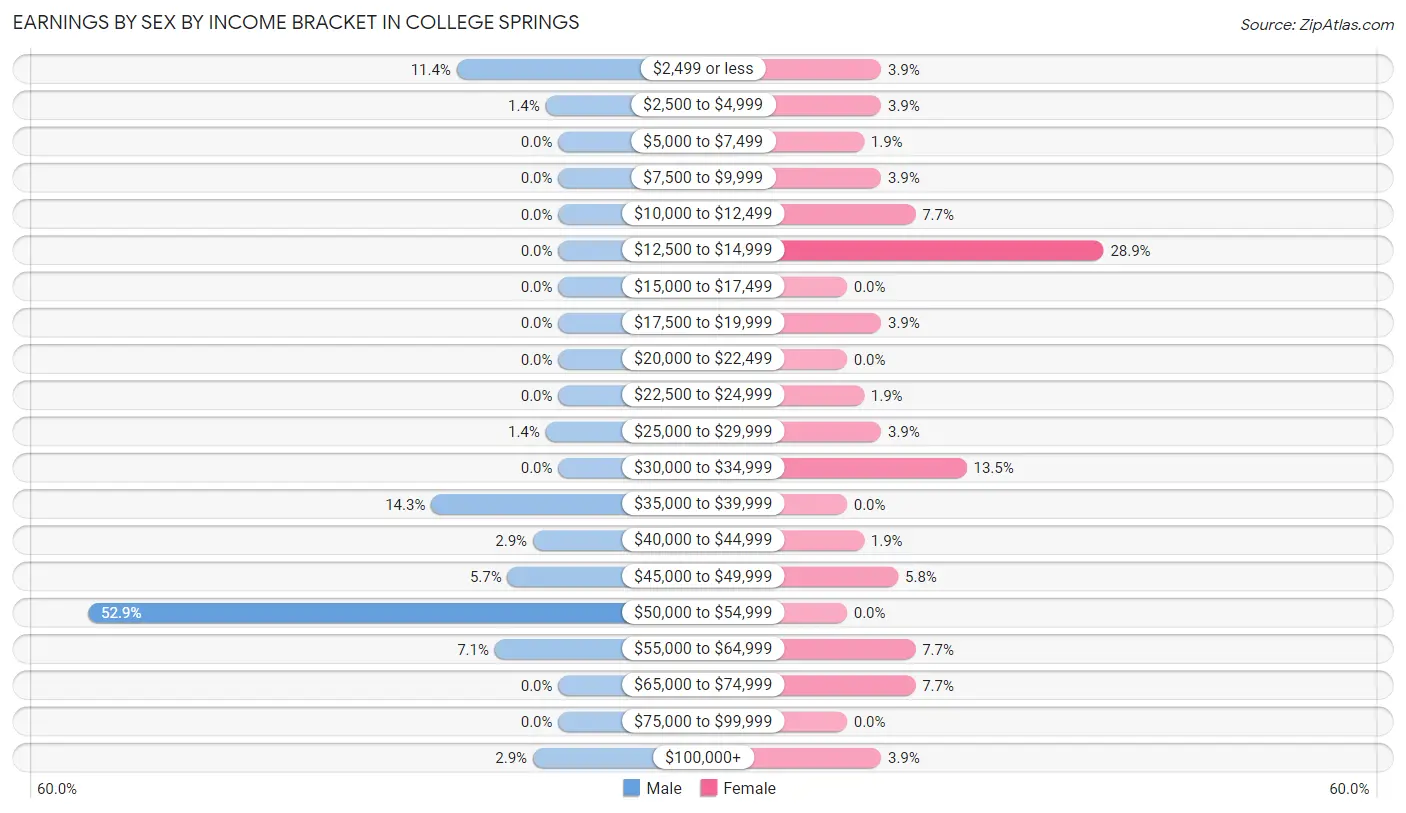
| Income | Male | Female |
| $2,499 or less | 8 (11.4%) | 2 (3.8%) |
| $2,500 to $4,999 | 1 (1.4%) | 2 (3.8%) |
| $5,000 to $7,499 | 0 (0.0%) | 1 (1.9%) |
| $7,500 to $9,999 | 0 (0.0%) | 2 (3.8%) |
| $10,000 to $12,499 | 0 (0.0%) | 4 (7.7%) |
| $12,500 to $14,999 | 0 (0.0%) | 15 (28.8%) |
| $15,000 to $17,499 | 0 (0.0%) | 0 (0.0%) |
| $17,500 to $19,999 | 0 (0.0%) | 2 (3.8%) |
| $20,000 to $22,499 | 0 (0.0%) | 0 (0.0%) |
| $22,500 to $24,999 | 0 (0.0%) | 1 (1.9%) |
| $25,000 to $29,999 | 1 (1.4%) | 2 (3.8%) |
| $30,000 to $34,999 | 0 (0.0%) | 7 (13.5%) |
| $35,000 to $39,999 | 10 (14.3%) | 0 (0.0%) |
| $40,000 to $44,999 | 2 (2.9%) | 1 (1.9%) |
| $45,000 to $49,999 | 4 (5.7%) | 3 (5.8%) |
| $50,000 to $54,999 | 37 (52.9%) | 0 (0.0%) |
| $55,000 to $64,999 | 5 (7.1%) | 4 (7.7%) |
| $65,000 to $74,999 | 0 (0.0%) | 4 (7.7%) |
| $75,000 to $99,999 | 0 (0.0%) | 0 (0.0%) |
| $100,000+ | 2 (2.9%) | 2 (3.8%) |
| Total | 70 (100.0%) | 52 (100.0%) |
Earnings by Sex by Educational Attainment in College Springs
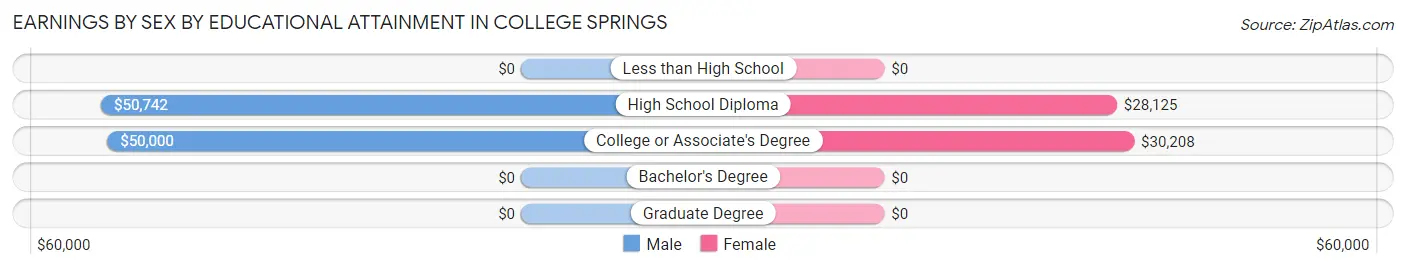
| Educational Attainment | Male Income | Female Income |
| Less than High School | - | - |
| High School Diploma | $50,742 | $28,125 |
| College or Associate's Degree | $50,000 | $30,208 |
| Bachelor's Degree | - | - |
| Graduate Degree | - | - |
| Total | $50,588 | $0 |
Family Income in College Springs
Family Income Brackets in College Springs
According to the College Springs family income data, there are 13 families falling into the $75,000 to $99,999 income range, which is the most common income bracket and makes up 27.7% of all families.
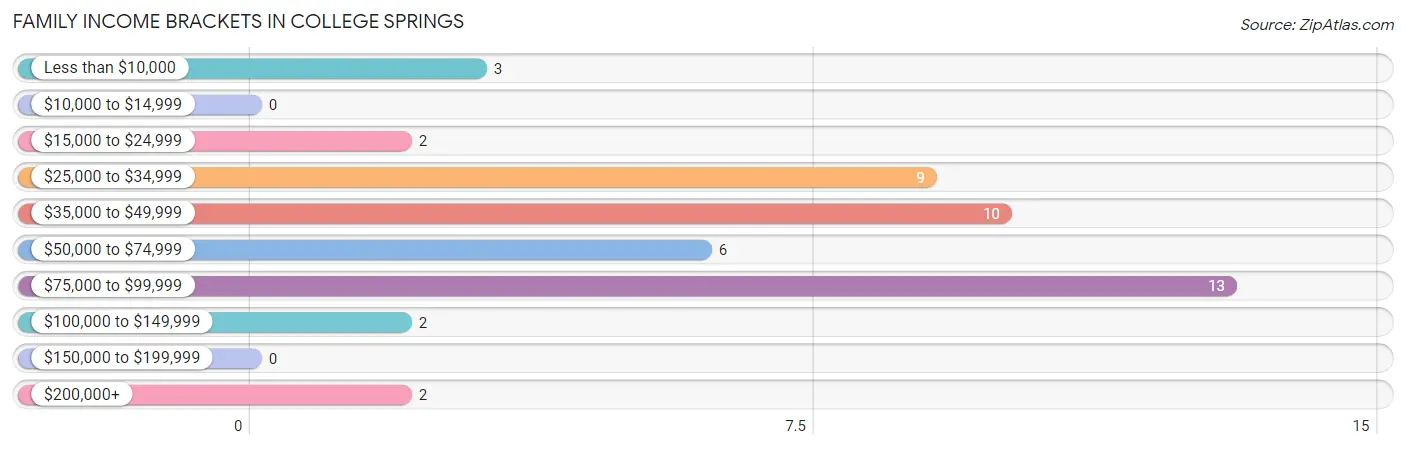
| Income Bracket | # Families | % Families |
| Less than $10,000 | 3 | 6.4% |
| $10,000 to $14,999 | 0 | 0.0% |
| $15,000 to $24,999 | 2 | 4.3% |
| $25,000 to $34,999 | 9 | 19.1% |
| $35,000 to $49,999 | 10 | 21.3% |
| $50,000 to $74,999 | 6 | 12.8% |
| $75,000 to $99,999 | 13 | 27.7% |
| $100,000 to $149,999 | 2 | 4.3% |
| $150,000 to $199,999 | 0 | 0.0% |
| $200,000+ | 2 | 4.3% |
Family Income by Famaliy Size in College Springs
2-person families (27 | 57.5%) account for the highest median family income in College Springs with $48,750 per family, while 2-person families (27 | 57.5%) have the highest median income of $24,375 per family member.
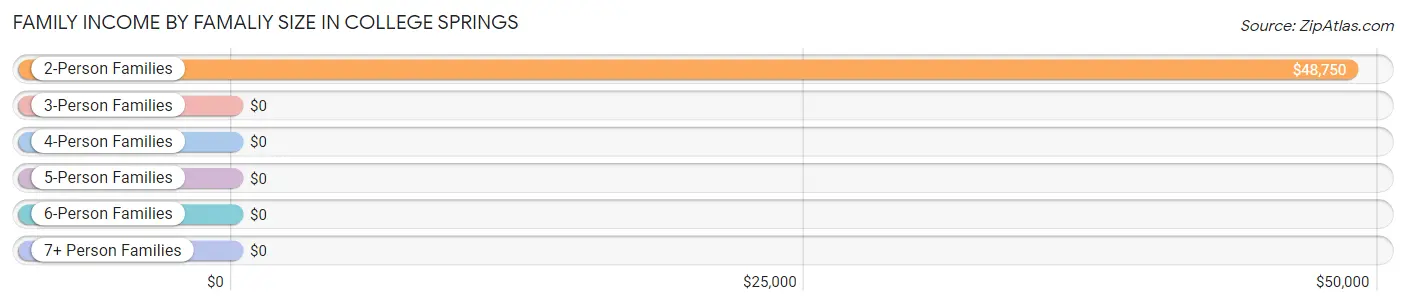
| Income Bracket | # Families | Median Income |
| 2-Person Families | 27 (57.5%) | $48,750 |
| 3-Person Families | 12 (25.5%) | $0 |
| 4-Person Families | 4 (8.5%) | $0 |
| 5-Person Families | 2 (4.3%) | $0 |
| 6-Person Families | 0 (0.0%) | $0 |
| 7+ Person Families | 2 (4.3%) | $0 |
| Total | 47 (100.0%) | $48,750 |
Family Income by Number of Earners in College Springs
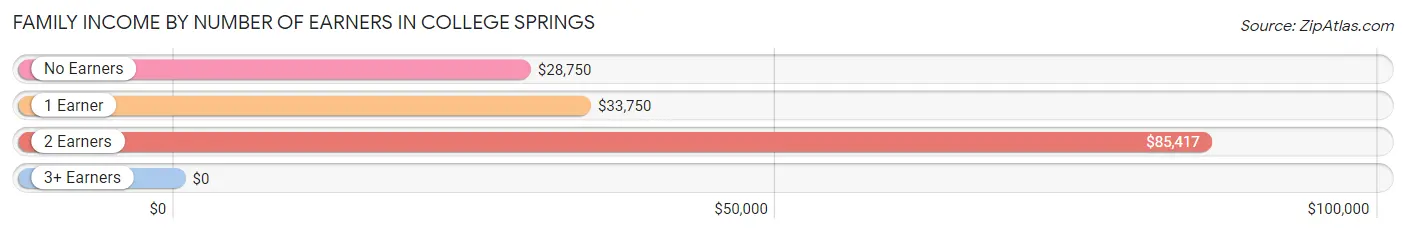
| Number of Earners | # Families | Median Income |
| No Earners | 8 (17.0%) | $28,750 |
| 1 Earner | 18 (38.3%) | $33,750 |
| 2 Earners | 21 (44.7%) | $85,417 |
| 3+ Earners | 0 (0.0%) | $0 |
| Total | 47 (100.0%) | $48,750 |
Household Income in College Springs
Household Income Brackets in College Springs
With 37 households falling in the category, the $50,000 to $74,999 income range is the most frequent in College Springs, accounting for 35.9% of all households.
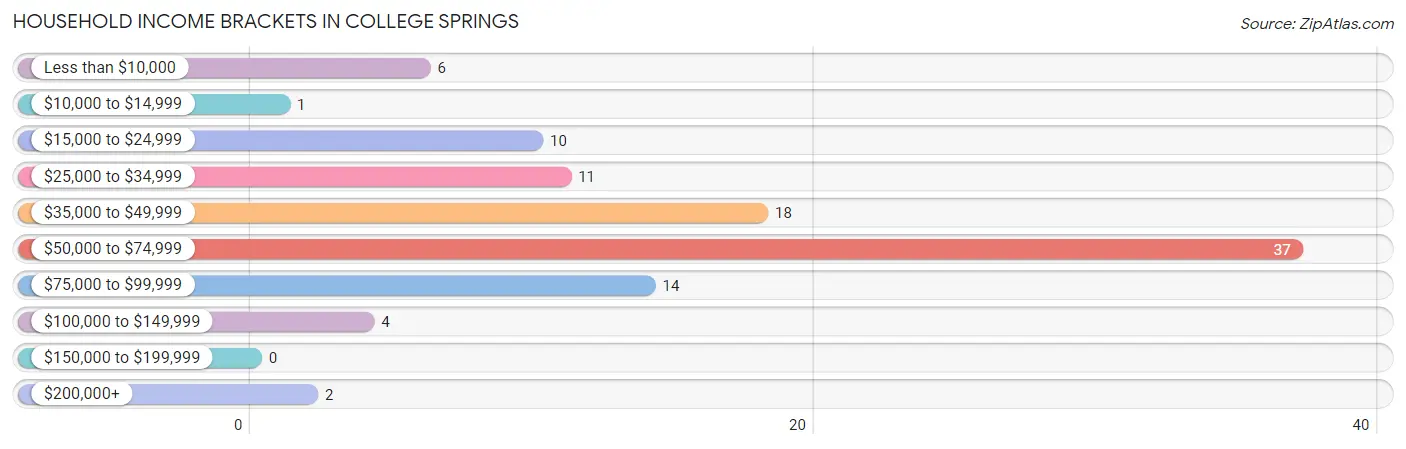
| Income Bracket | # Households | % Households |
| Less than $10,000 | 6 | 5.8% |
| $10,000 to $14,999 | 1 | 1.0% |
| $15,000 to $24,999 | 10 | 9.7% |
| $25,000 to $34,999 | 11 | 10.7% |
| $35,000 to $49,999 | 18 | 17.5% |
| $50,000 to $74,999 | 37 | 35.9% |
| $75,000 to $99,999 | 14 | 13.6% |
| $100,000 to $149,999 | 4 | 3.9% |
| $150,000 to $199,999 | 0 | 0.0% |
| $200,000+ | 2 | 1.9% |
Household Income by Householder Age in College Springs
The median household income in College Springs is $67,695, with the highest median household income of $68,867 found in the 25 to 44 years age bracket for the primary householder. A total of 45 households (43.7%) fall into this category.
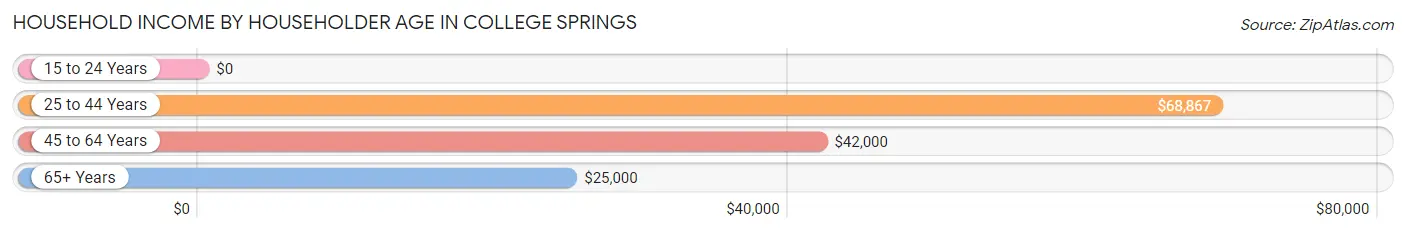
| Income Bracket | # Households | Median Income |
| 15 to 24 Years | 0 (0.0%) | $0 |
| 25 to 44 Years | 45 (43.7%) | $68,867 |
| 45 to 64 Years | 36 (34.9%) | $42,000 |
| 65+ Years | 22 (21.4%) | $25,000 |
| Total | 103 (100.0%) | $67,695 |
Poverty in College Springs
Income Below Poverty by Sex and Age in College Springs
With 5.4% poverty level for males and 21.7% for females among the residents of College Springs, 6 to 11 year old males and 45 to 54 year old females are the most vulnerable to poverty, with 2 males (22.2%) and 17 females (51.5%) in their respective age groups living below the poverty level.
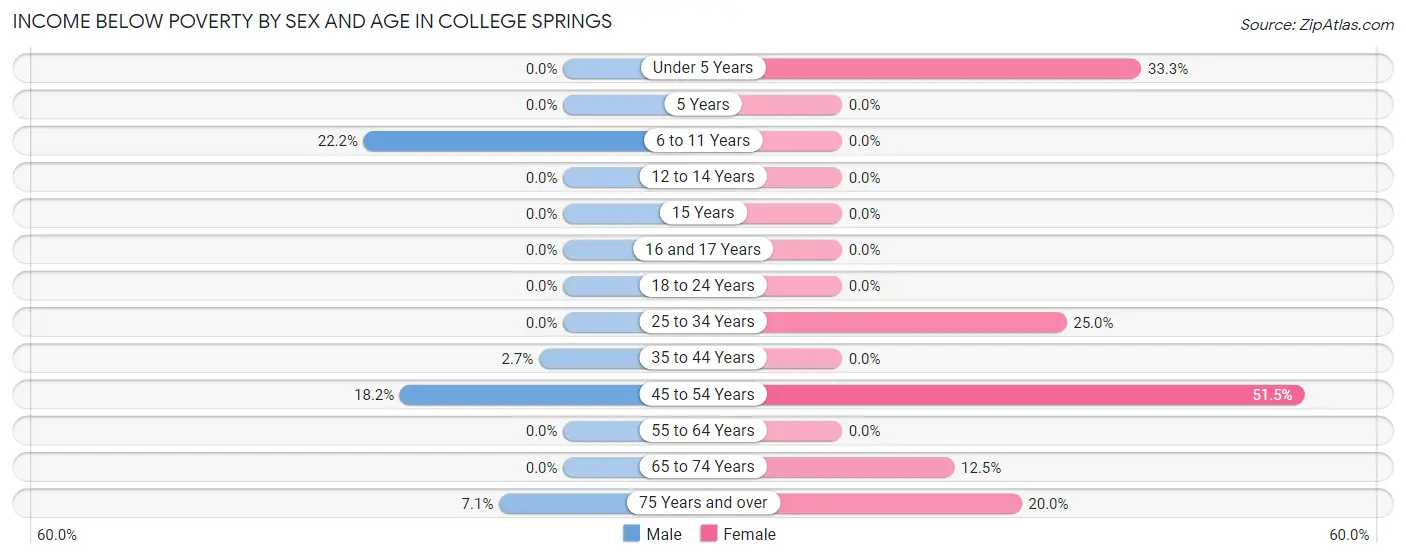
| Age Bracket | Male | Female |
| Under 5 Years | 0 (0.0%) | 2 (33.3%) |
| 5 Years | 0 (0.0%) | 0 (0.0%) |
| 6 to 11 Years | 2 (22.2%) | 0 (0.0%) |
| 12 to 14 Years | 0 (0.0%) | 0 (0.0%) |
| 15 Years | 0 (0.0%) | 0 (0.0%) |
| 16 and 17 Years | 0 (0.0%) | 0 (0.0%) |
| 18 to 24 Years | 0 (0.0%) | 0 (0.0%) |
| 25 to 34 Years | 0 (0.0%) | 2 (25.0%) |
| 35 to 44 Years | 1 (2.7%) | 0 (0.0%) |
| 45 to 54 Years | 2 (18.2%) | 17 (51.5%) |
| 55 to 64 Years | 0 (0.0%) | 0 (0.0%) |
| 65 to 74 Years | 0 (0.0%) | 1 (12.5%) |
| 75 Years and over | 1 (7.1%) | 1 (20.0%) |
| Total | 6 (5.4%) | 23 (21.7%) |
Income Above Poverty by Sex and Age in College Springs
According to the poverty statistics in College Springs, males aged under 5 years and females aged 6 to 11 years are the age groups that are most secure financially, with 100.0% of males and 100.0% of females in these age groups living above the poverty line.
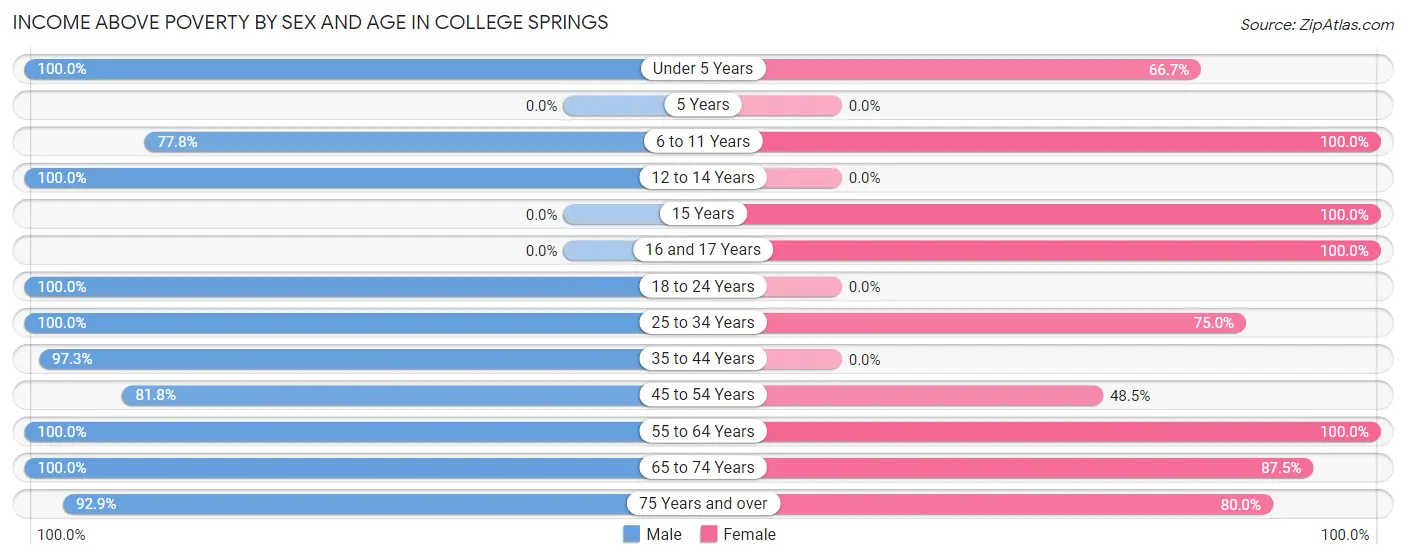
| Age Bracket | Male | Female |
| Under 5 Years | 4 (100.0%) | 4 (66.7%) |
| 5 Years | 0 (0.0%) | 0 (0.0%) |
| 6 to 11 Years | 7 (77.8%) | 3 (100.0%) |
| 12 to 14 Years | 4 (100.0%) | 0 (0.0%) |
| 15 Years | 0 (0.0%) | 22 (100.0%) |
| 16 and 17 Years | 0 (0.0%) | 4 (100.0%) |
| 18 to 24 Years | 2 (100.0%) | 0 (0.0%) |
| 25 to 34 Years | 7 (100.0%) | 6 (75.0%) |
| 35 to 44 Years | 36 (97.3%) | 0 (0.0%) |
| 45 to 54 Years | 9 (81.8%) | 16 (48.5%) |
| 55 to 64 Years | 12 (100.0%) | 17 (100.0%) |
| 65 to 74 Years | 11 (100.0%) | 7 (87.5%) |
| 75 Years and over | 13 (92.9%) | 4 (80.0%) |
| Total | 105 (94.6%) | 83 (78.3%) |
Income Below Poverty Among Married-Couple Families in College Springs
The poverty statistics for married-couple families in College Springs show that 2.9% or 1 of the total 35 families live below the poverty line. Families with no children have the highest poverty rate of 4.0%, comprising of 1 families. On the other hand, families with 1 or 2 children have the lowest poverty rate of 0.0%, which includes 0 families.
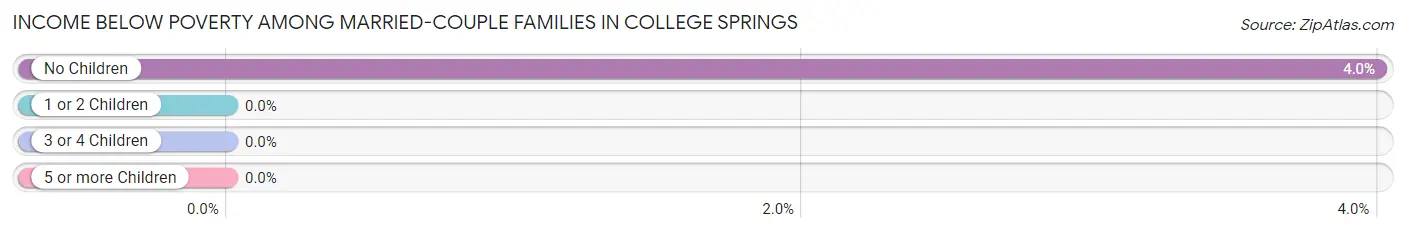
| Children | Above Poverty | Below Poverty |
| No Children | 24 (96.0%) | 1 (4.0%) |
| 1 or 2 Children | 6 (100.0%) | 0 (0.0%) |
| 3 or 4 Children | 2 (100.0%) | 0 (0.0%) |
| 5 or more Children | 2 (100.0%) | 0 (0.0%) |
| Total | 34 (97.1%) | 1 (2.9%) |
Income Below Poverty Among Single-Parent Households in College Springs
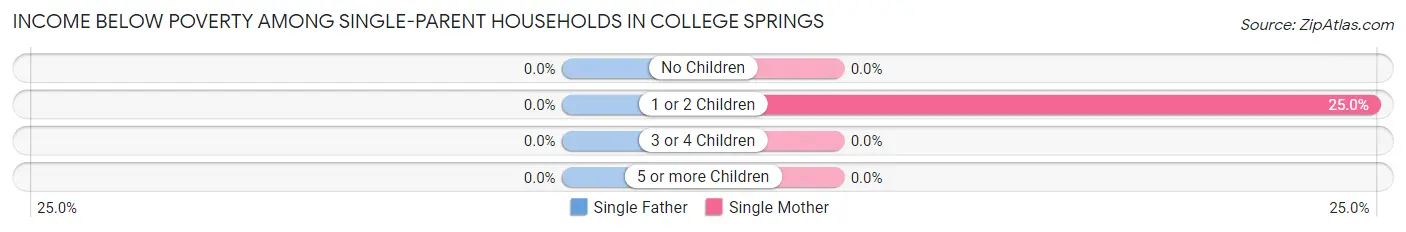
| Children | Single Father | Single Mother |
| No Children | 0 (0.0%) | 0 (0.0%) |
| 1 or 2 Children | 0 (0.0%) | 2 (25.0%) |
| 3 or 4 Children | 0 (0.0%) | 0 (0.0%) |
| 5 or more Children | 0 (0.0%) | 0 (0.0%) |
| Total | 0 (0.0%) | 2 (25.0%) |
Income Below Poverty Among Married-Couple vs Single-Parent Households in College Springs
The poverty data for College Springs shows that 1 of the married-couple family households (2.9%) and 2 of the single-parent households (16.7%) are living below the poverty level. Within the married-couple family households, those with no children have the highest poverty rate, with 1 households (4.0%) falling below the poverty line. Among the single-parent households, those with 1 or 2 children have the highest poverty rate, with 2 household (20.0%) living below poverty.
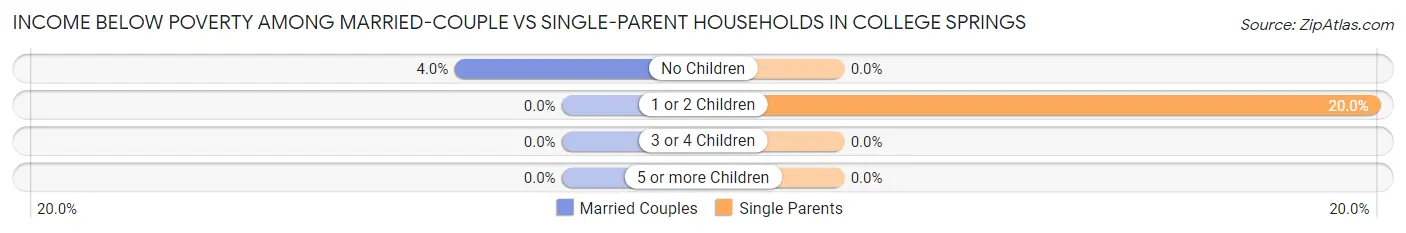
| Children | Married-Couple Families | Single-Parent Households |
| No Children | 1 (4.0%) | 0 (0.0%) |
| 1 or 2 Children | 0 (0.0%) | 2 (20.0%) |
| 3 or 4 Children | 0 (0.0%) | 0 (0.0%) |
| 5 or more Children | 0 (0.0%) | 0 (0.0%) |
| Total | 1 (2.9%) | 2 (16.7%) |
Race in College Springs
The most populous races in College Springs are White / Caucasian (215 | 99.1%), and Two or more Races (2 | 0.9%).
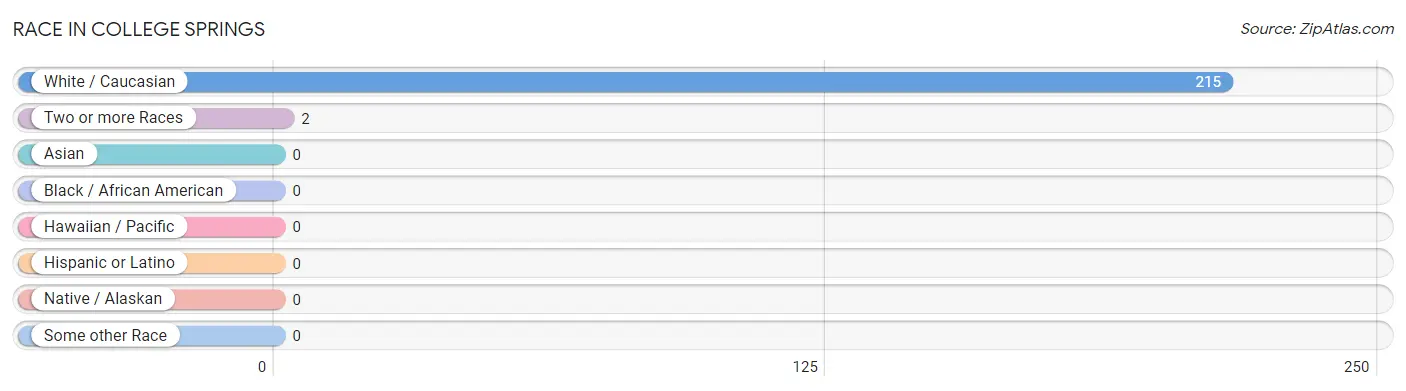
| Race | # Population | % Population |
| Asian | 0 | 0.0% |
| Black / African American | 0 | 0.0% |
| Hawaiian / Pacific | 0 | 0.0% |
| Hispanic or Latino | 0 | 0.0% |
| Native / Alaskan | 0 | 0.0% |
| White / Caucasian | 215 | 99.1% |
| Two or more Races | 2 | 0.9% |
| Some other Race | 0 | 0.0% |
| Total | 217 | 100.0% |
Ancestry in College Springs
The most populous ancestries reported in College Springs are German (82 | 37.8%), Irish (25 | 11.5%), Scottish (25 | 11.5%), English (17 | 7.8%), and American (10 | 4.6%), together accounting for 73.3% of all College Springs residents.
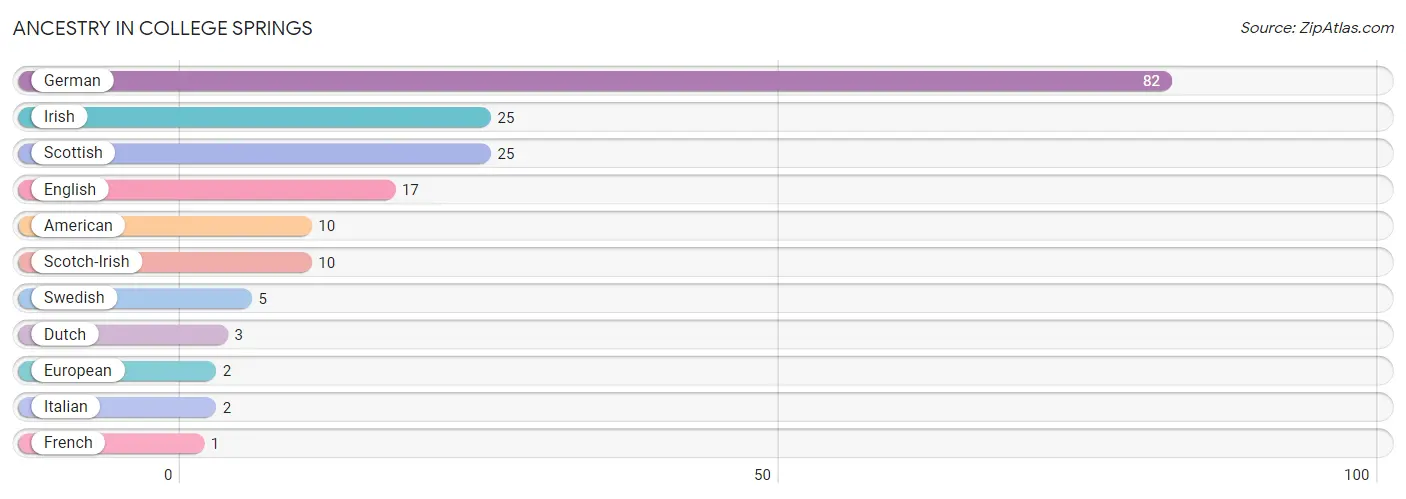
| Ancestry | # Population | % Population |
| American | 10 | 4.6% |
| Dutch | 3 | 1.4% |
| English | 17 | 7.8% |
| European | 2 | 0.9% |
| French | 1 | 0.5% |
| German | 82 | 37.8% |
| Irish | 25 | 11.5% |
| Italian | 2 | 0.9% |
| Scotch-Irish | 10 | 4.6% |
| Scottish | 25 | 11.5% |
| Swedish | 5 | 2.3% | View All 11 Rows |
Immigrants in College Springs

| Immigration Origin | # Population | % Population | View All 0 Rows |
Sex and Age in College Springs
Sex and Age in College Springs
The most populous age groups in College Springs are 40 to 44 Years (34 | 30.6%) for men and 15 to 19 Years (26 | 24.5%) for women.
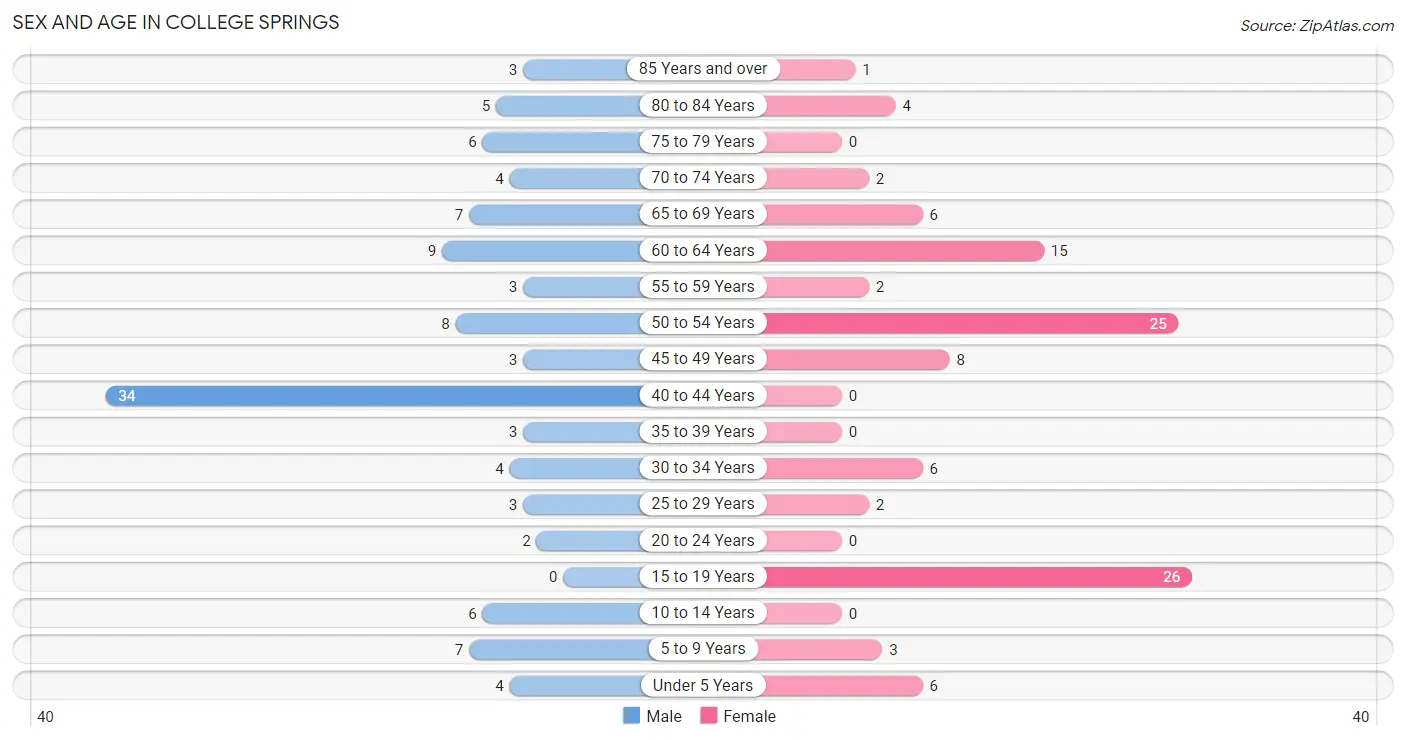
| Age Bracket | Male | Female |
| Under 5 Years | 4 (3.6%) | 6 (5.7%) |
| 5 to 9 Years | 7 (6.3%) | 3 (2.8%) |
| 10 to 14 Years | 6 (5.4%) | 0 (0.0%) |
| 15 to 19 Years | 0 (0.0%) | 26 (24.5%) |
| 20 to 24 Years | 2 (1.8%) | 0 (0.0%) |
| 25 to 29 Years | 3 (2.7%) | 2 (1.9%) |
| 30 to 34 Years | 4 (3.6%) | 6 (5.7%) |
| 35 to 39 Years | 3 (2.7%) | 0 (0.0%) |
| 40 to 44 Years | 34 (30.6%) | 0 (0.0%) |
| 45 to 49 Years | 3 (2.7%) | 8 (7.5%) |
| 50 to 54 Years | 8 (7.2%) | 25 (23.6%) |
| 55 to 59 Years | 3 (2.7%) | 2 (1.9%) |
| 60 to 64 Years | 9 (8.1%) | 15 (14.1%) |
| 65 to 69 Years | 7 (6.3%) | 6 (5.7%) |
| 70 to 74 Years | 4 (3.6%) | 2 (1.9%) |
| 75 to 79 Years | 6 (5.4%) | 0 (0.0%) |
| 80 to 84 Years | 5 (4.5%) | 4 (3.8%) |
| 85 Years and over | 3 (2.7%) | 1 (0.9%) |
| Total | 111 (100.0%) | 106 (100.0%) |
Families and Households in College Springs
Median Family Size in College Springs
The median family size in College Springs is 3.02 persons per family, with single female/mother families (8 | 17.0%) accounting for the largest median family size of 3.88 persons per family. On the other hand, single male/father families (4 | 8.5%) represent the smallest median family size with 2.75 persons per family.
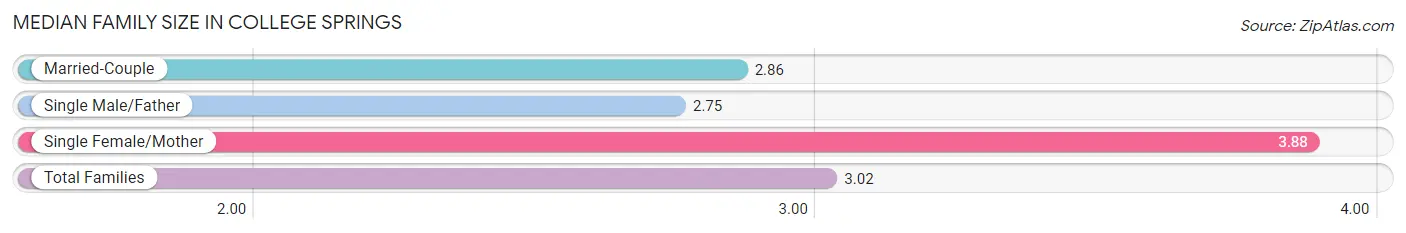
| Family Type | # Families | Family Size |
| Married-Couple | 35 (74.5%) | 2.86 |
| Single Male/Father | 4 (8.5%) | 2.75 |
| Single Female/Mother | 8 (17.0%) | 3.88 |
| Total Families | 47 (100.0%) | 3.02 |
Median Household Size in College Springs
The median household size in College Springs is 2.11 persons per household, with single female/mother households (8 | 7.8%) accounting for the largest median household size of 3.88 persons per household. non-family households (56 | 54.4%) represent the smallest median household size with 1.30 persons per household.
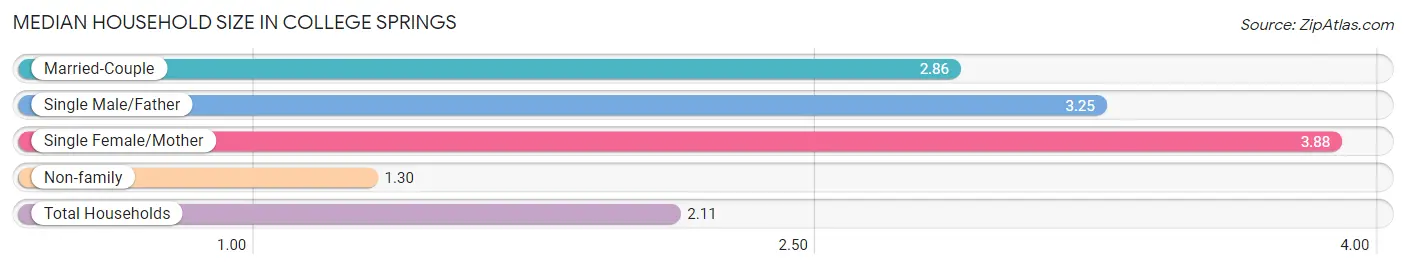
| Household Type | # Households | Household Size |
| Married-Couple | 35 (34.0%) | 2.86 |
| Single Male/Father | 4 (3.9%) | 3.25 |
| Single Female/Mother | 8 (7.8%) | 3.88 |
| Non-family | 56 (54.4%) | 1.30 |
| Total Households | 103 (100.0%) | 2.11 |
Household Size by Marriage Status in College Springs
Out of a total of 103 households in College Springs, 47 (45.6%) are family households, while 56 (54.4%) are nonfamily households. The most numerous type of family households are 2-person households, comprising 26, and the most common type of nonfamily households are 2-person households, comprising 34.
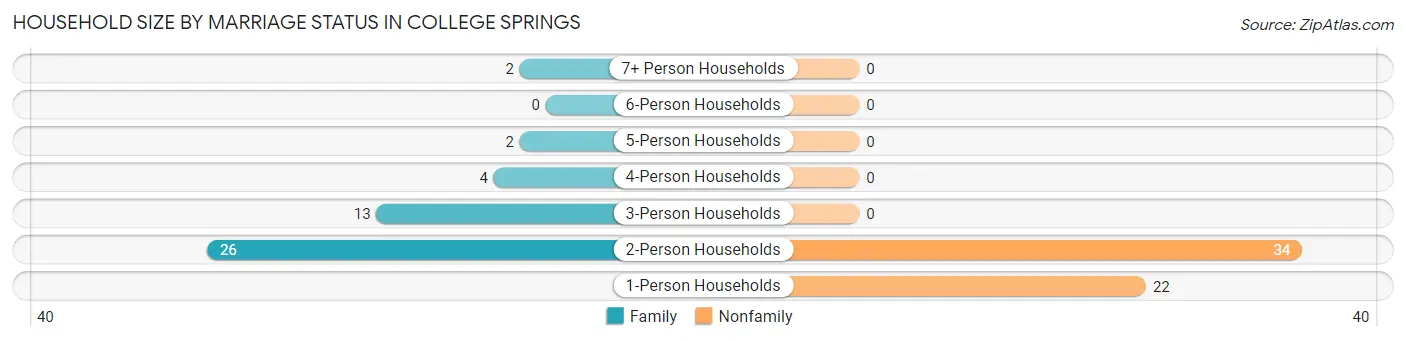
| Household Size | Family Households | Nonfamily Households |
| 1-Person Households | - | 22 (21.4%) |
| 2-Person Households | 26 (25.2%) | 34 (33.0%) |
| 3-Person Households | 13 (12.6%) | 0 (0.0%) |
| 4-Person Households | 4 (3.9%) | 0 (0.0%) |
| 5-Person Households | 2 (1.9%) | 0 (0.0%) |
| 6-Person Households | 0 (0.0%) | 0 (0.0%) |
| 7+ Person Households | 2 (1.9%) | 0 (0.0%) |
| Total | 47 (45.6%) | 56 (54.4%) |
Female Fertility in College Springs
Fertility by Age in College Springs
Average fertility rate in College Springs is 16.0 births per 1,000 women. Women in the age bracket of 20 to 34 years have the highest fertility rate with 125.0 births per 1,000 women. Women in the age bracket of 20 to 34 years acount for 100.0% of all women with births.
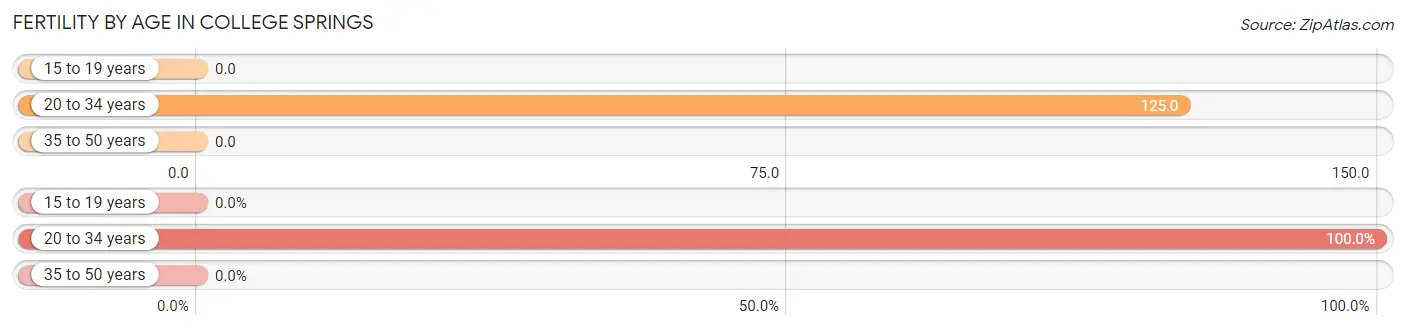
| Age Bracket | Women with Births | Births / 1,000 Women |
| 15 to 19 years | 0 (0.0%) | 0.0 |
| 20 to 34 years | 1 (100.0%) | 125.0 |
| 35 to 50 years | 0 (0.0%) | 0.0 |
| Total | 1 (100.0%) | 16.0 |
Fertility by Age by Marriage Status in College Springs
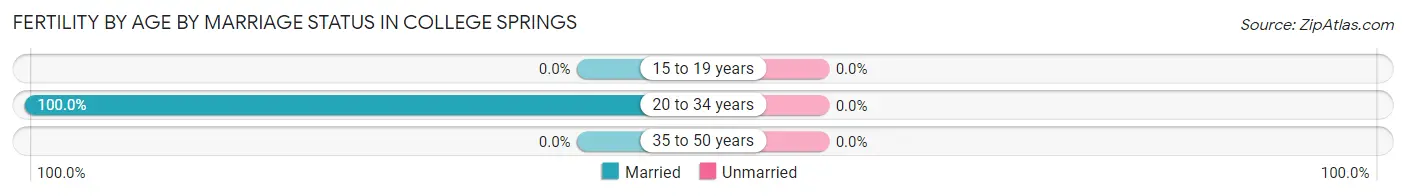
| Age Bracket | Married | Unmarried |
| 15 to 19 years | 0 (0.0%) | 0 (0.0%) |
| 20 to 34 years | 1 (100.0%) | 0 (0.0%) |
| 35 to 50 years | 0 (0.0%) | 0 (0.0%) |
| Total | 1 (100.0%) | 0 (0.0%) |
Fertility by Education in College Springs
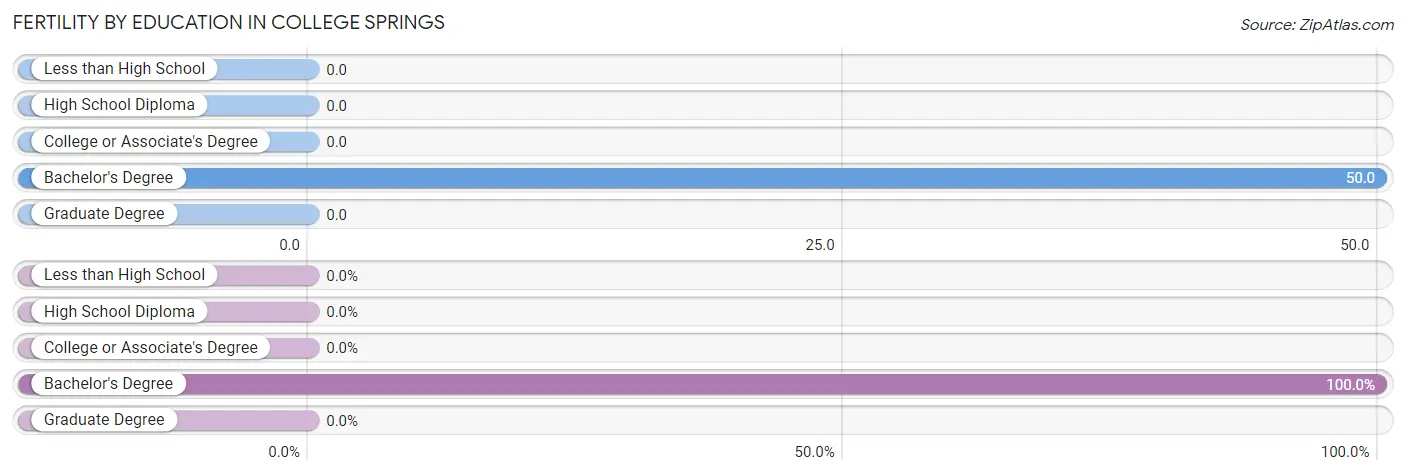
| Educational Attainment | Women with Births | Births / 1,000 Women |
| Less than High School | 0 (0.0%) | 0.0 |
| High School Diploma | 0 (0.0%) | 0.0 |
| College or Associate's Degree | 0 (0.0%) | 0.0 |
| Bachelor's Degree | 1 (100.0%) | 50.0 |
| Graduate Degree | 0 (0.0%) | 0.0 |
| Total | 1 (100.0%) | 16.0 |
Fertility by Education by Marriage Status in College Springs
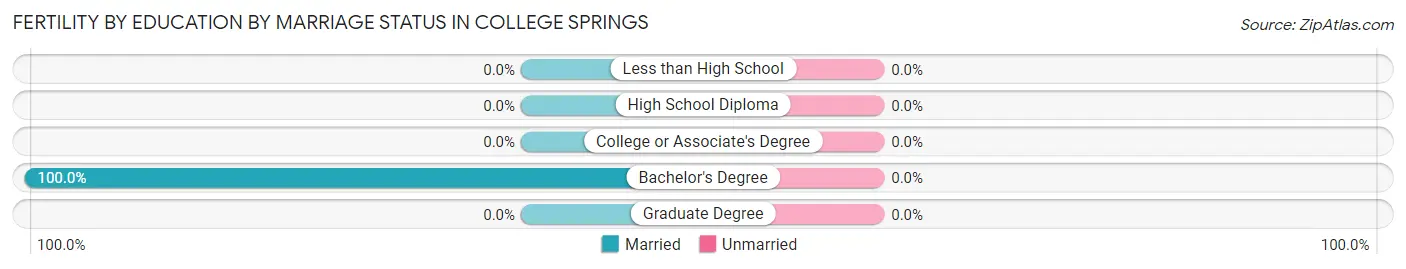
| Educational Attainment | Married | Unmarried |
| Less than High School | 0 (0.0%) | 0 (0.0%) |
| High School Diploma | 0 (0.0%) | 0 (0.0%) |
| College or Associate's Degree | 0 (0.0%) | 0 (0.0%) |
| Bachelor's Degree | 1 (100.0%) | 0 (0.0%) |
| Graduate Degree | 0 (0.0%) | 0 (0.0%) |
| Total | 1 (100.0%) | 0 (0.0%) |
Employment Characteristics in College Springs
Employment by Class of Employer in College Springs
Among the 110 employed individuals in College Springs, private company employees (80 | 72.7%), local government employees (14 | 12.7%), and self-employed (not incorporated) (6 | 5.4%) make up the most common classes of employment.
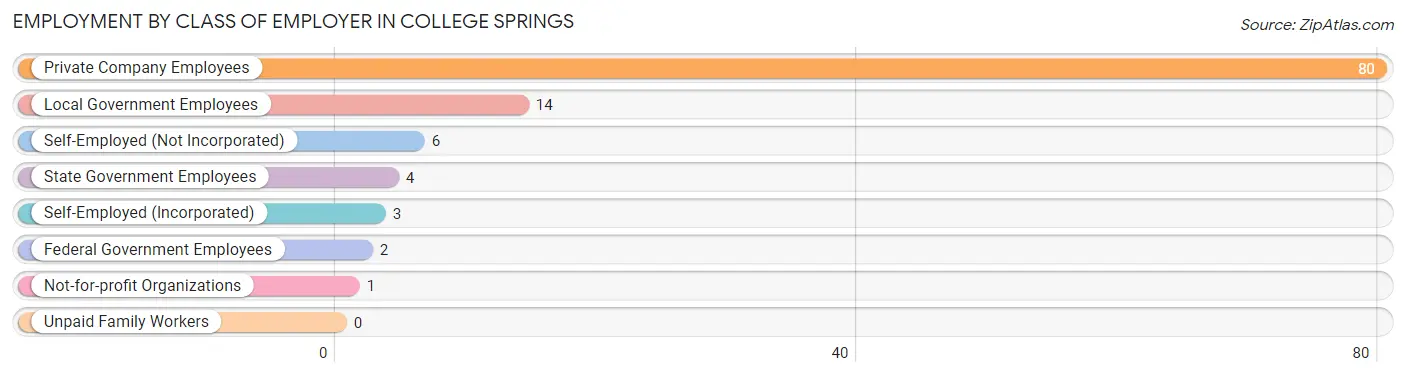
| Employer Class | # Employees | % Employees |
| Private Company Employees | 80 | 72.7% |
| Self-Employed (Incorporated) | 3 | 2.7% |
| Self-Employed (Not Incorporated) | 6 | 5.4% |
| Not-for-profit Organizations | 1 | 0.9% |
| Local Government Employees | 14 | 12.7% |
| State Government Employees | 4 | 3.6% |
| Federal Government Employees | 2 | 1.8% |
| Unpaid Family Workers | 0 | 0.0% |
| Total | 110 | 100.0% |
Employment Status by Age in College Springs
According to the labor force statistics for College Springs, out of the total population over 16 years of age (169), 70.4% or 119 individuals are in the labor force, with 1.7% or 2 of them unemployed. The age group with the highest labor force participation rate is 20 to 24 years, with 100.0% or 2 individuals in the labor force. Within the labor force, the 35 to 44 years age range has the highest percentage of unemployed individuals, with 2.7% or 1 of them being unemployed.
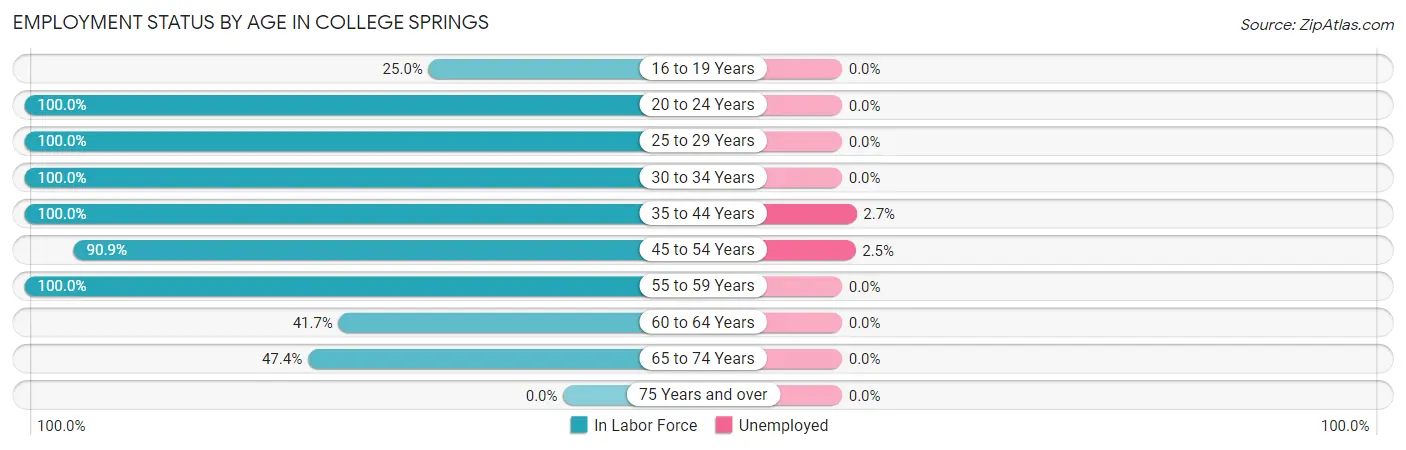
| Age Bracket | In Labor Force | Unemployed |
| 16 to 19 Years | 1 (25.0%) | 0 (0.0%) |
| 20 to 24 Years | 2 (100.0%) | 0 (0.0%) |
| 25 to 29 Years | 5 (100.0%) | 0 (0.0%) |
| 30 to 34 Years | 10 (100.0%) | 0 (0.0%) |
| 35 to 44 Years | 37 (100.0%) | 1 (2.7%) |
| 45 to 54 Years | 40 (90.9%) | 1 (2.5%) |
| 55 to 59 Years | 5 (100.0%) | 0 (0.0%) |
| 60 to 64 Years | 10 (41.7%) | 0 (0.0%) |
| 65 to 74 Years | 9 (47.4%) | 0 (0.0%) |
| 75 Years and over | 0 (0.0%) | 0 (0.0%) |
| Total | 119 (70.4%) | 2 (1.7%) |
Employment Status by Educational Attainment in College Springs
According to labor force statistics for College Springs, 85.6% of individuals (107) out of the total population between 25 and 64 years of age (125) are in the labor force, with 1.9% or 2 of them being unemployed. The group with the highest labor force participation rate are those with the educational attainment of bachelor's degree or higher, with 100.0% or 29 individuals in the labor force. Within the labor force, individuals with college / associate degree education have the highest percentage of unemployment, with 4.0% or 1 of them being unemployed.
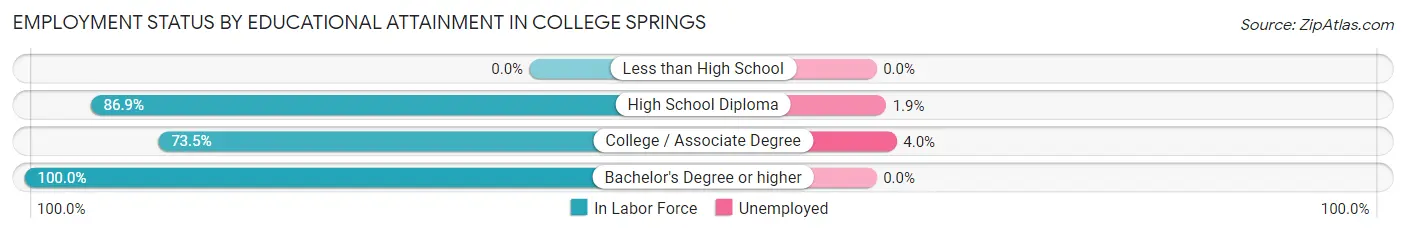
| Educational Attainment | In Labor Force | Unemployed |
| Less than High School | 0 (0.0%) | 0 (0.0%) |
| High School Diploma | 53 (86.9%) | 1 (1.9%) |
| College / Associate Degree | 25 (73.5%) | 1 (4.0%) |
| Bachelor's Degree or higher | 29 (100.0%) | 0 (0.0%) |
| Total | 107 (85.6%) | 2 (1.9%) |
Employment Occupations by Sex in College Springs
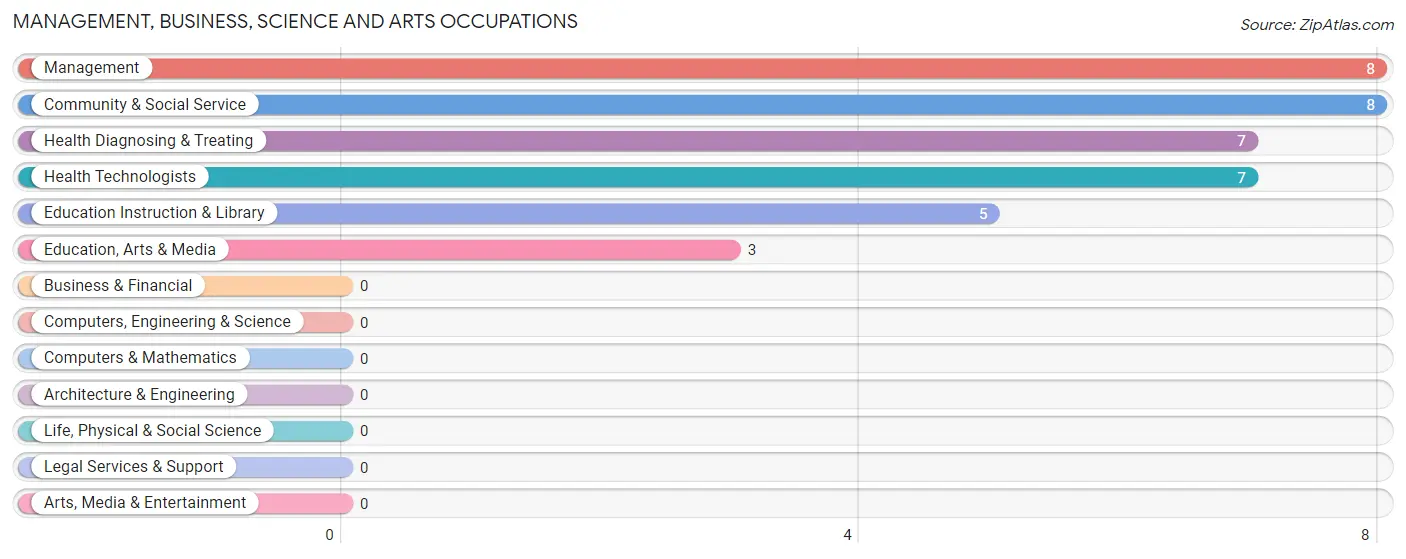
Management, Business, Science and Arts Occupations
The most common Management, Business, Science and Arts occupations in College Springs are Management (8 | 6.8%), Community & Social Service (8 | 6.8%), Health Diagnosing & Treating (7 | 6.0%), Health Technologists (7 | 6.0%), and Education Instruction & Library (5 | 4.3%).
Management, Business, Science and Arts Occupations by Sex
Within the Management, Business, Science and Arts occupations in College Springs, the most male-oriented occupations are Management (75.0%), Education, Arts & Media (33.3%), and Health Diagnosing & Treating (14.3%), while the most female-oriented occupations are Education Instruction & Library (100.0%), Community & Social Service (87.5%), and Health Diagnosing & Treating (85.7%).
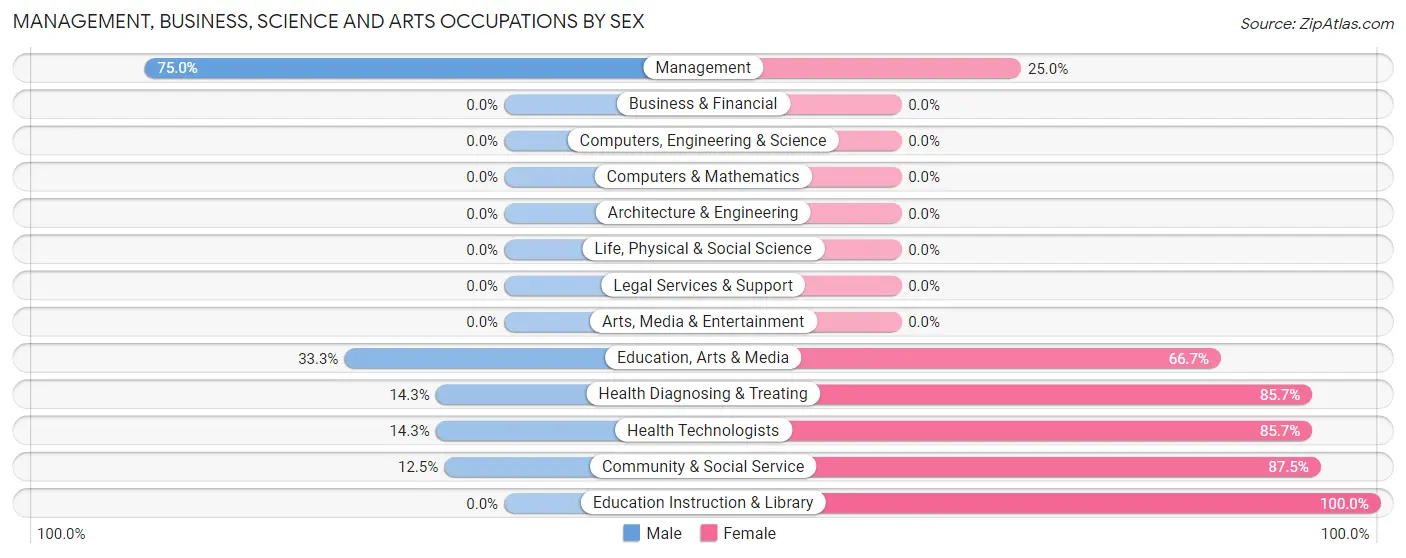
| Occupation | Male | Female |
| Management | 6 (75.0%) | 2 (25.0%) |
| Business & Financial | 0 (0.0%) | 0 (0.0%) |
| Computers, Engineering & Science | 0 (0.0%) | 0 (0.0%) |
| Computers & Mathematics | 0 (0.0%) | 0 (0.0%) |
| Architecture & Engineering | 0 (0.0%) | 0 (0.0%) |
| Life, Physical & Social Science | 0 (0.0%) | 0 (0.0%) |
| Community & Social Service | 1 (12.5%) | 7 (87.5%) |
| Education, Arts & Media | 1 (33.3%) | 2 (66.7%) |
| Legal Services & Support | 0 (0.0%) | 0 (0.0%) |
| Education Instruction & Library | 0 (0.0%) | 5 (100.0%) |
| Arts, Media & Entertainment | 0 (0.0%) | 0 (0.0%) |
| Health Diagnosing & Treating | 1 (14.3%) | 6 (85.7%) |
| Health Technologists | 1 (14.3%) | 6 (85.7%) |
| Total (Category) | 8 (34.8%) | 15 (65.2%) |
| Total (Overall) | 67 (57.3%) | 50 (42.7%) |
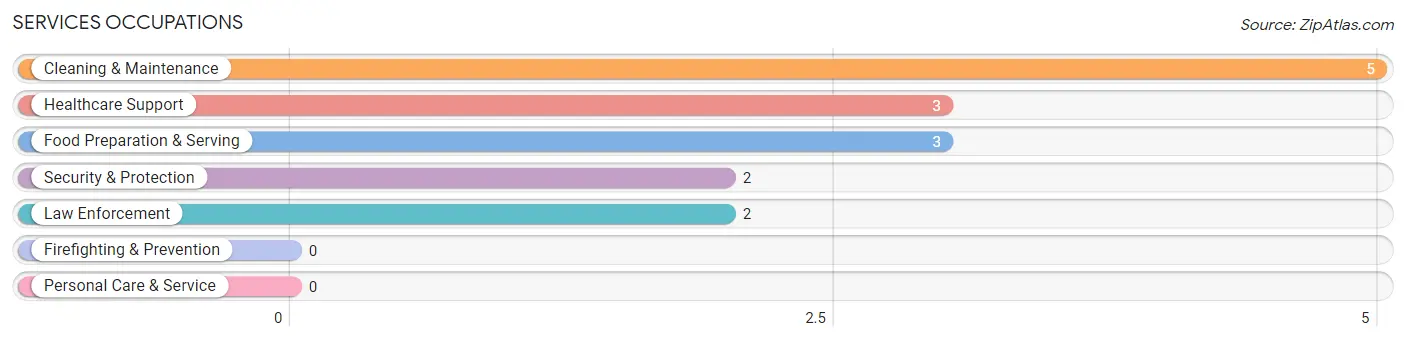
Services Occupations
The most common Services occupations in College Springs are Cleaning & Maintenance (5 | 4.3%), Healthcare Support (3 | 2.6%), Food Preparation & Serving (3 | 2.6%), Security & Protection (2 | 1.7%), and Law Enforcement (2 | 1.7%).
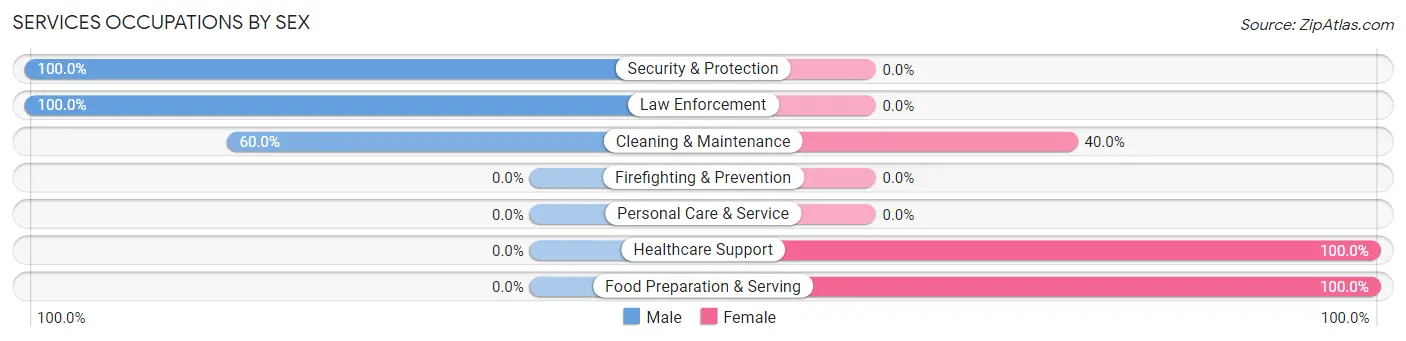
Services Occupations by Sex
Within the Services occupations in College Springs, the most male-oriented occupations are Security & Protection (100.0%), Law Enforcement (100.0%), and Cleaning & Maintenance (60.0%), while the most female-oriented occupations are Healthcare Support (100.0%), Food Preparation & Serving (100.0%), and Cleaning & Maintenance (40.0%).
| Occupation | Male | Female |
| Healthcare Support | 0 (0.0%) | 3 (100.0%) |
| Security & Protection | 2 (100.0%) | 0 (0.0%) |
| Firefighting & Prevention | 0 (0.0%) | 0 (0.0%) |
| Law Enforcement | 2 (100.0%) | 0 (0.0%) |
| Food Preparation & Serving | 0 (0.0%) | 3 (100.0%) |
| Cleaning & Maintenance | 3 (60.0%) | 2 (40.0%) |
| Personal Care & Service | 0 (0.0%) | 0 (0.0%) |
| Total (Category) | 5 (38.5%) | 8 (61.5%) |
| Total (Overall) | 67 (57.3%) | 50 (42.7%) |
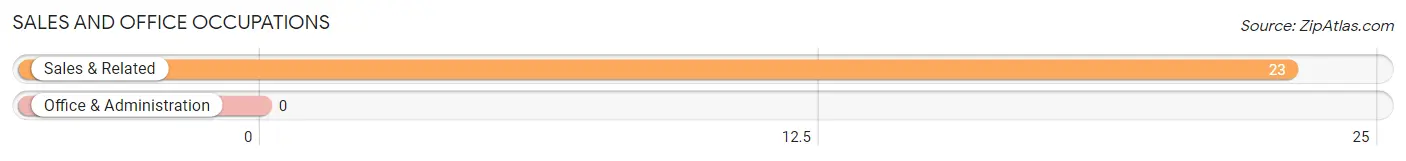
Sales and Office Occupations
The most common Sales and Office occupations in College Springs are , and Sales & Related (23 | 19.7%).
Sales and Office Occupations by Sex
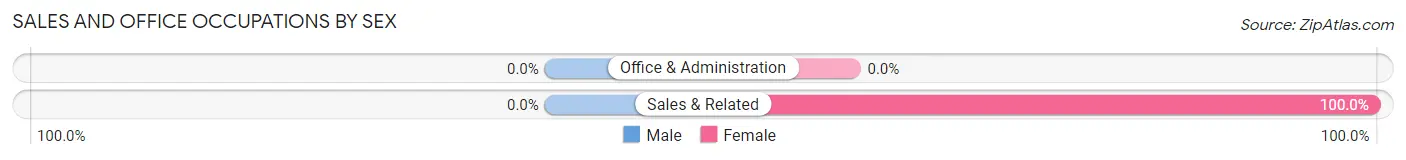
| Occupation | Male | Female |
| Sales & Related | 0 (0.0%) | 23 (100.0%) |
| Office & Administration | 0 (0.0%) | 0 (0.0%) |
| Total (Category) | 0 (0.0%) | 23 (100.0%) |
| Total (Overall) | 67 (57.3%) | 50 (42.7%) |
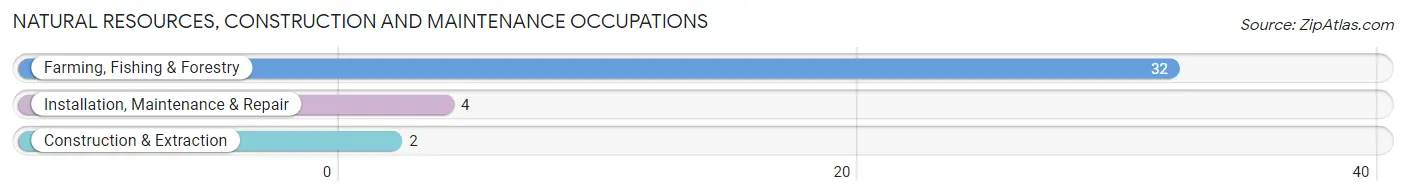
Natural Resources, Construction and Maintenance Occupations
The most common Natural Resources, Construction and Maintenance occupations in College Springs are Farming, Fishing & Forestry (32 | 27.4%), Installation, Maintenance & Repair (4 | 3.4%), and Construction & Extraction (2 | 1.7%).
Natural Resources, Construction and Maintenance Occupations by Sex
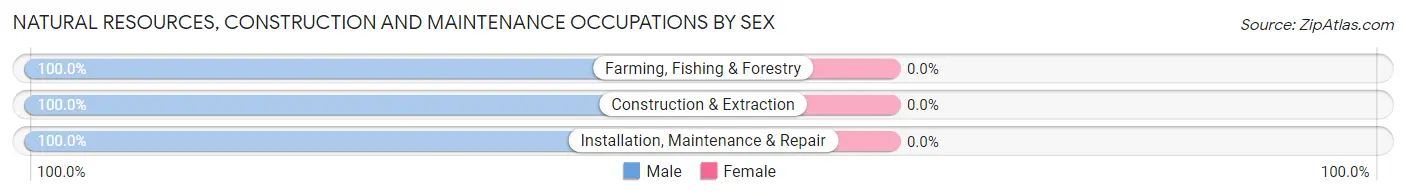
| Occupation | Male | Female |
| Farming, Fishing & Forestry | 32 (100.0%) | 0 (0.0%) |
| Construction & Extraction | 2 (100.0%) | 0 (0.0%) |
| Installation, Maintenance & Repair | 4 (100.0%) | 0 (0.0%) |
| Total (Category) | 38 (100.0%) | 0 (0.0%) |
| Total (Overall) | 67 (57.3%) | 50 (42.7%) |
Production, Transportation and Moving Occupations
The most common Production, Transportation and Moving occupations in College Springs are Production (8 | 6.8%), Transportation (8 | 6.8%), and Material Moving (4 | 3.4%).
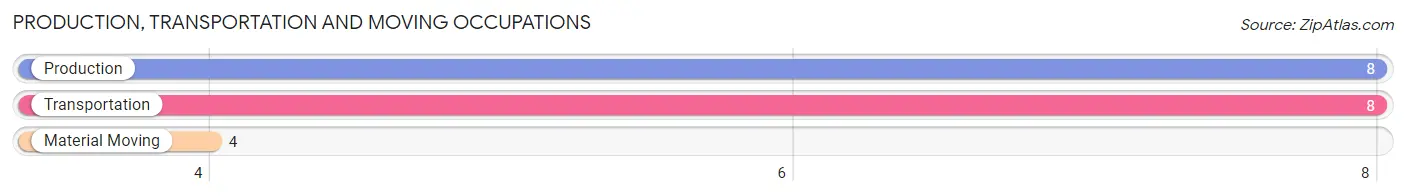
Production, Transportation and Moving Occupations by Sex
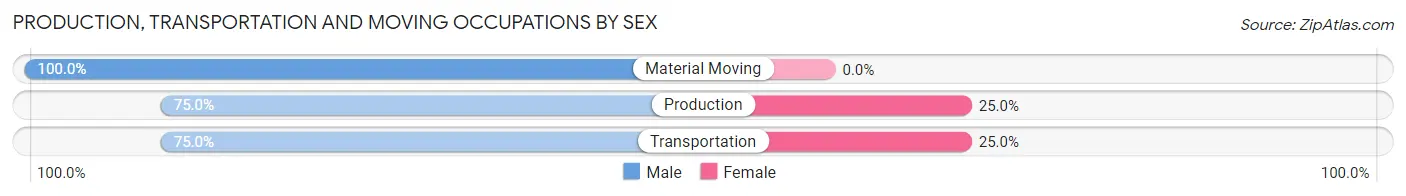
| Occupation | Male | Female |
| Production | 6 (75.0%) | 2 (25.0%) |
| Transportation | 6 (75.0%) | 2 (25.0%) |
| Material Moving | 4 (100.0%) | 0 (0.0%) |
| Total (Category) | 16 (80.0%) | 4 (20.0%) |
| Total (Overall) | 67 (57.3%) | 50 (42.7%) |
Employment Industries by Sex in College Springs
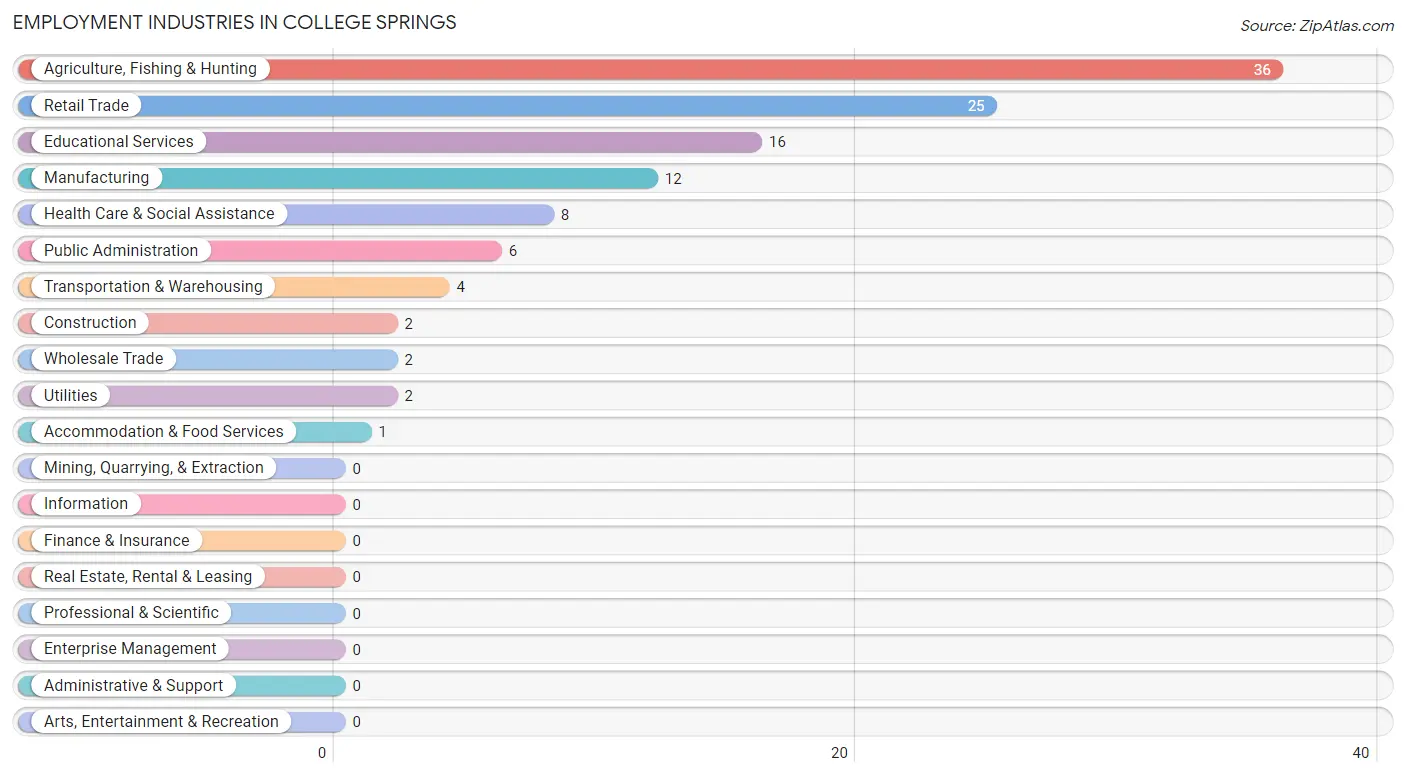
Employment Industries in College Springs
The major employment industries in College Springs include Agriculture, Fishing & Hunting (36 | 30.8%), Retail Trade (25 | 21.4%), Educational Services (16 | 13.7%), Manufacturing (12 | 10.3%), and Health Care & Social Assistance (8 | 6.8%).
Employment Industries by Sex in College Springs
The College Springs industries that see more men than women are Agriculture, Fishing & Hunting (100.0%), Construction (100.0%), and Wholesale Trade (100.0%), whereas the industries that tend to have a higher number of women are Retail Trade (100.0%), Transportation & Warehousing (100.0%), and Accommodation & Food Services (100.0%).
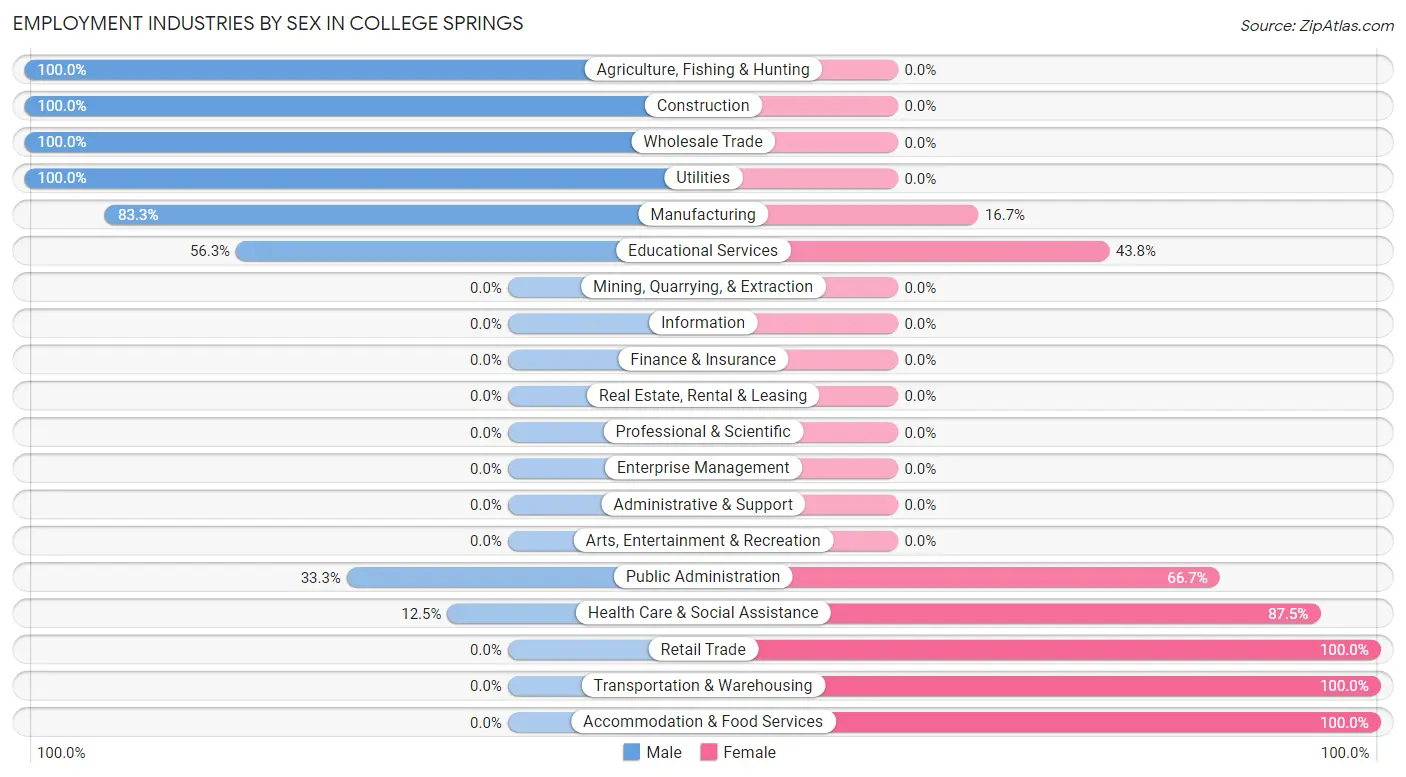
| Industry | Male | Female |
| Agriculture, Fishing & Hunting | 36 (100.0%) | 0 (0.0%) |
| Mining, Quarrying, & Extraction | 0 (0.0%) | 0 (0.0%) |
| Construction | 2 (100.0%) | 0 (0.0%) |
| Manufacturing | 10 (83.3%) | 2 (16.7%) |
| Wholesale Trade | 2 (100.0%) | 0 (0.0%) |
| Retail Trade | 0 (0.0%) | 25 (100.0%) |
| Transportation & Warehousing | 0 (0.0%) | 4 (100.0%) |
| Utilities | 2 (100.0%) | 0 (0.0%) |
| Information | 0 (0.0%) | 0 (0.0%) |
| Finance & Insurance | 0 (0.0%) | 0 (0.0%) |
| Real Estate, Rental & Leasing | 0 (0.0%) | 0 (0.0%) |
| Professional & Scientific | 0 (0.0%) | 0 (0.0%) |
| Enterprise Management | 0 (0.0%) | 0 (0.0%) |
| Administrative & Support | 0 (0.0%) | 0 (0.0%) |
| Educational Services | 9 (56.2%) | 7 (43.8%) |
| Health Care & Social Assistance | 1 (12.5%) | 7 (87.5%) |
| Arts, Entertainment & Recreation | 0 (0.0%) | 0 (0.0%) |
| Accommodation & Food Services | 0 (0.0%) | 1 (100.0%) |
| Public Administration | 2 (33.3%) | 4 (66.7%) |
| Total | 67 (57.3%) | 50 (42.7%) |
Education in College Springs
School Enrollment in College Springs
The most common levels of schooling among the 47 students in College Springs are middle school (25 | 53.2%), high school (7 | 14.9%), and kindergarten (5 | 10.6%).
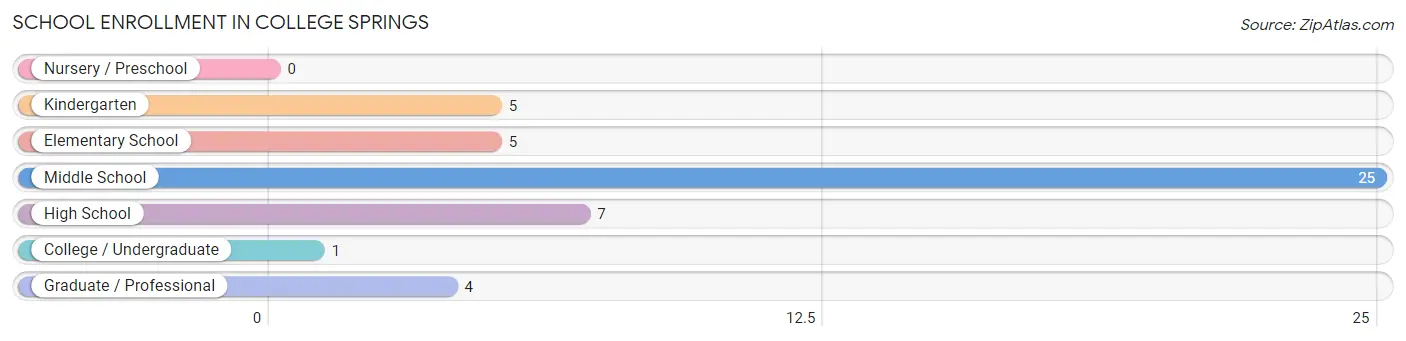
| School Level | # Students | % Students |
| Nursery / Preschool | 0 | 0.0% |
| Kindergarten | 5 | 10.6% |
| Elementary School | 5 | 10.6% |
| Middle School | 25 | 53.2% |
| High School | 7 | 14.9% |
| College / Undergraduate | 1 | 2.1% |
| Graduate / Professional | 4 | 8.5% |
| Total | 47 | 100.0% |
School Enrollment by Age by Funding Source in College Springs
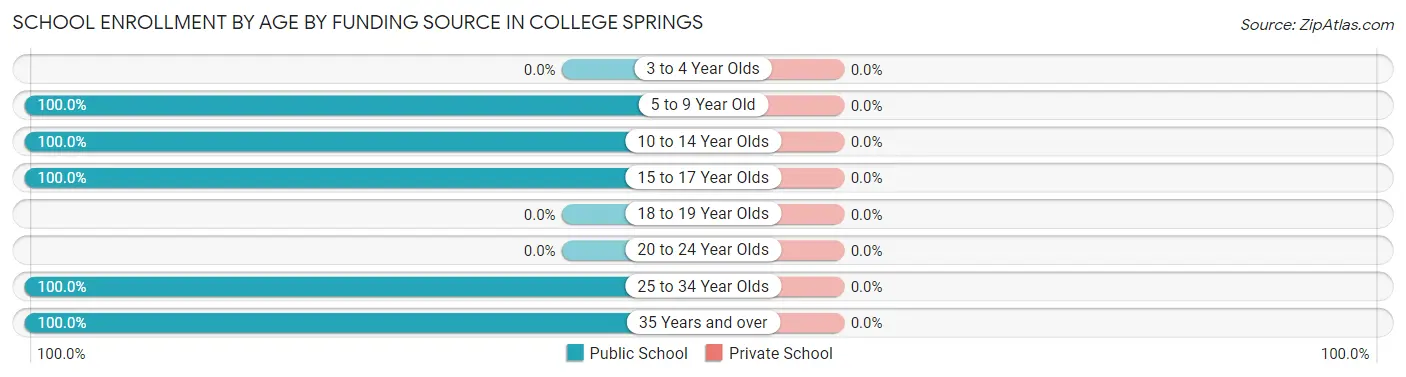
| Age Bracket | Public School | Private School |
| 3 to 4 Year Olds | 0 (0.0%) | 0 (0.0%) |
| 5 to 9 Year Old | 10 (100.0%) | 0 (0.0%) |
| 10 to 14 Year Olds | 6 (100.0%) | 0 (0.0%) |
| 15 to 17 Year Olds | 26 (100.0%) | 0 (0.0%) |
| 18 to 19 Year Olds | 0 (0.0%) | 0 (0.0%) |
| 20 to 24 Year Olds | 0 (0.0%) | 0 (0.0%) |
| 25 to 34 Year Olds | 1 (100.0%) | 0 (0.0%) |
| 35 Years and over | 4 (100.0%) | 0 (0.0%) |
| Total | 47 (100.0%) | 0 (0.0%) |
Educational Attainment by Field of Study in College Springs
Liberal arts & history (15 | 35.7%), business (6 | 14.3%), bio, nature & agricultural (5 | 11.9%), education (5 | 11.9%), and science & technology (4 | 9.5%) are the most common fields of study among 42 individuals in College Springs who have obtained a bachelor's degree or higher.
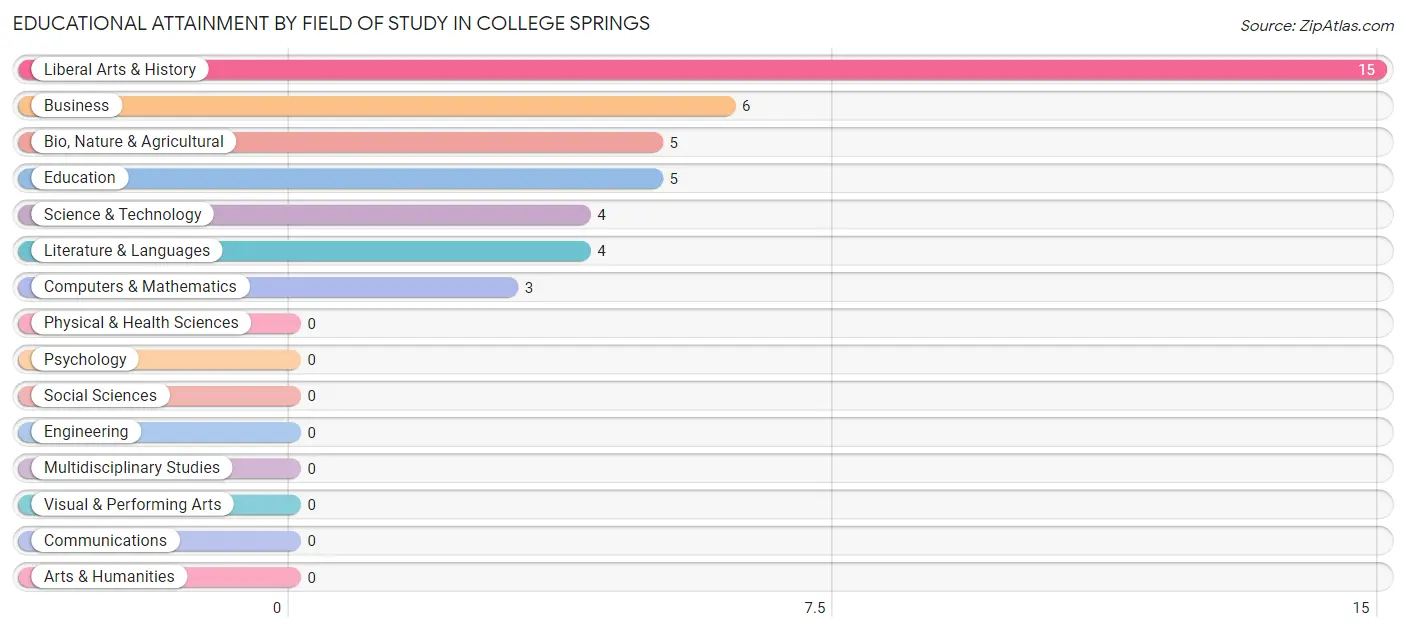
| Field of Study | # Graduates | % Graduates |
| Computers & Mathematics | 3 | 7.1% |
| Bio, Nature & Agricultural | 5 | 11.9% |
| Physical & Health Sciences | 0 | 0.0% |
| Psychology | 0 | 0.0% |
| Social Sciences | 0 | 0.0% |
| Engineering | 0 | 0.0% |
| Multidisciplinary Studies | 0 | 0.0% |
| Science & Technology | 4 | 9.5% |
| Business | 6 | 14.3% |
| Education | 5 | 11.9% |
| Literature & Languages | 4 | 9.5% |
| Liberal Arts & History | 15 | 35.7% |
| Visual & Performing Arts | 0 | 0.0% |
| Communications | 0 | 0.0% |
| Arts & Humanities | 0 | 0.0% |
| Total | 42 | 100.0% |
Transportation & Commute in College Springs
Vehicle Availability by Sex in College Springs
The most prevalent vehicle ownership categories in College Springs are males with 3 vehicles (44, accounting for 72.1%) and females with 3 vehicles (27, making up 89.8%).
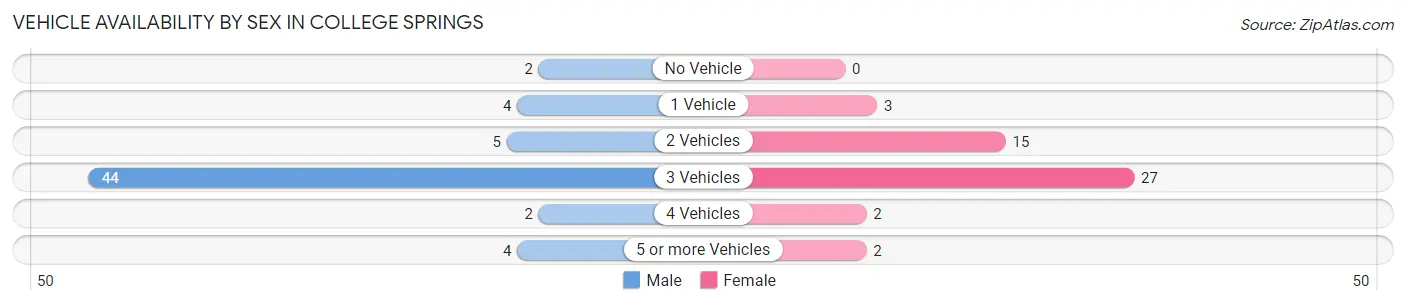
| Vehicles Available | Male | Female |
| No Vehicle | 2 (3.3%) | 0 (0.0%) |
| 1 Vehicle | 4 (6.6%) | 3 (6.1%) |
| 2 Vehicles | 5 (8.2%) | 15 (30.6%) |
| 3 Vehicles | 44 (72.1%) | 27 (55.1%) |
| 4 Vehicles | 2 (3.3%) | 2 (4.1%) |
| 5 or more Vehicles | 4 (6.6%) | 2 (4.1%) |
| Total | 61 (100.0%) | 49 (100.0%) |
Commute Time in College Springs
The most frequently occuring commute durations in College Springs are 20 to 24 minutes (38 commuters, 36.5%), 45 to 59 minutes (26 commuters, 25.0%), and less than 5 minutes (15 commuters, 14.4%).
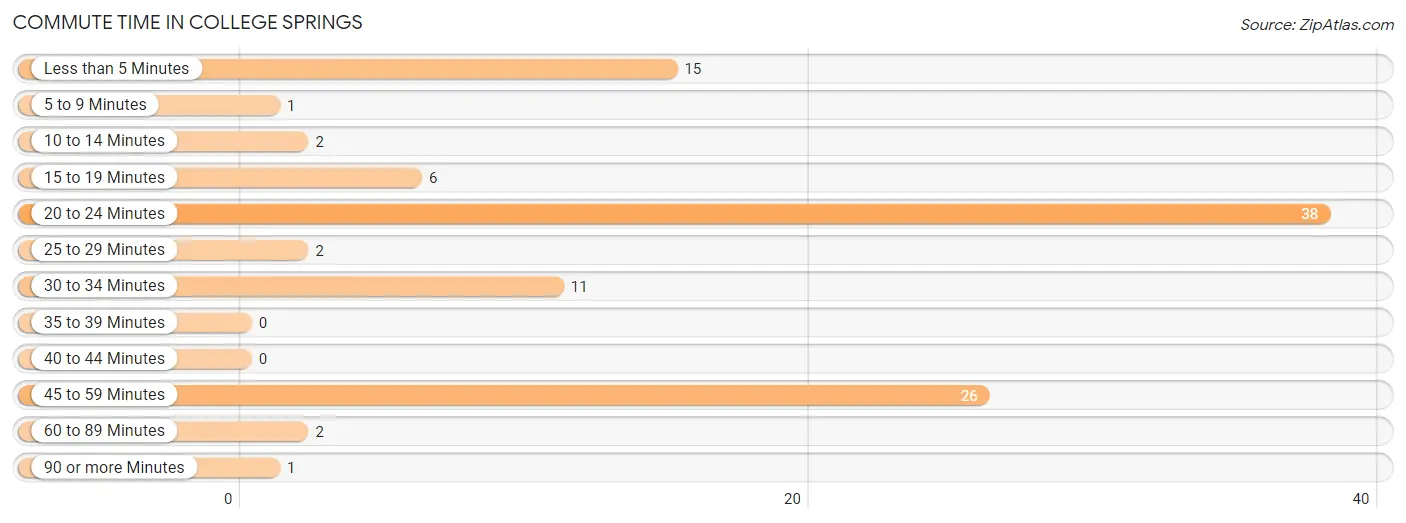
| Commute Time | # Commuters | % Commuters |
| Less than 5 Minutes | 15 | 14.4% |
| 5 to 9 Minutes | 1 | 1.0% |
| 10 to 14 Minutes | 2 | 1.9% |
| 15 to 19 Minutes | 6 | 5.8% |
| 20 to 24 Minutes | 38 | 36.5% |
| 25 to 29 Minutes | 2 | 1.9% |
| 30 to 34 Minutes | 11 | 10.6% |
| 35 to 39 Minutes | 0 | 0.0% |
| 40 to 44 Minutes | 0 | 0.0% |
| 45 to 59 Minutes | 26 | 25.0% |
| 60 to 89 Minutes | 2 | 1.9% |
| 90 or more Minutes | 1 | 1.0% |
Commute Time by Sex in College Springs
The most common commute times in College Springs are 20 to 24 minutes (36 commuters, 61.0%) for males and 45 to 59 minutes (21 commuters, 46.7%) for females.
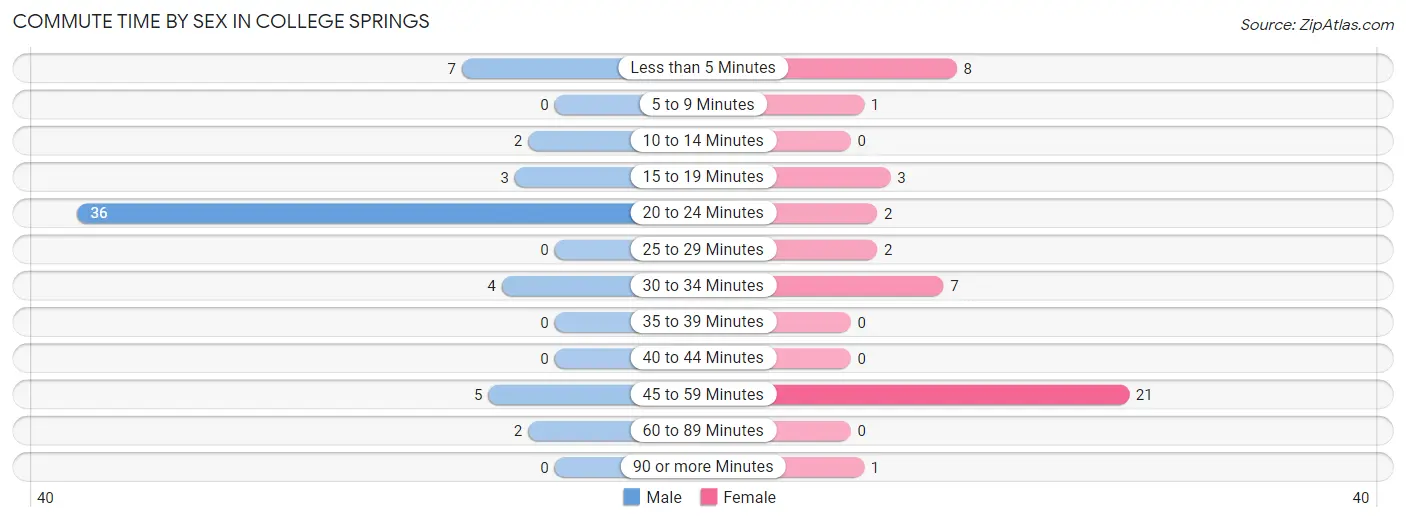
| Commute Time | Male | Female |
| Less than 5 Minutes | 7 (11.9%) | 8 (17.8%) |
| 5 to 9 Minutes | 0 (0.0%) | 1 (2.2%) |
| 10 to 14 Minutes | 2 (3.4%) | 0 (0.0%) |
| 15 to 19 Minutes | 3 (5.1%) | 3 (6.7%) |
| 20 to 24 Minutes | 36 (61.0%) | 2 (4.4%) |
| 25 to 29 Minutes | 0 (0.0%) | 2 (4.4%) |
| 30 to 34 Minutes | 4 (6.8%) | 7 (15.6%) |
| 35 to 39 Minutes | 0 (0.0%) | 0 (0.0%) |
| 40 to 44 Minutes | 0 (0.0%) | 0 (0.0%) |
| 45 to 59 Minutes | 5 (8.5%) | 21 (46.7%) |
| 60 to 89 Minutes | 2 (3.4%) | 0 (0.0%) |
| 90 or more Minutes | 0 (0.0%) | 1 (2.2%) |
Time of Departure to Work by Sex in College Springs
The most frequent times of departure to work in College Springs are 7:30 AM to 7:59 AM (32, 54.2%) for males and 9:00 AM to 9:59 AM (15, 33.3%) for females.
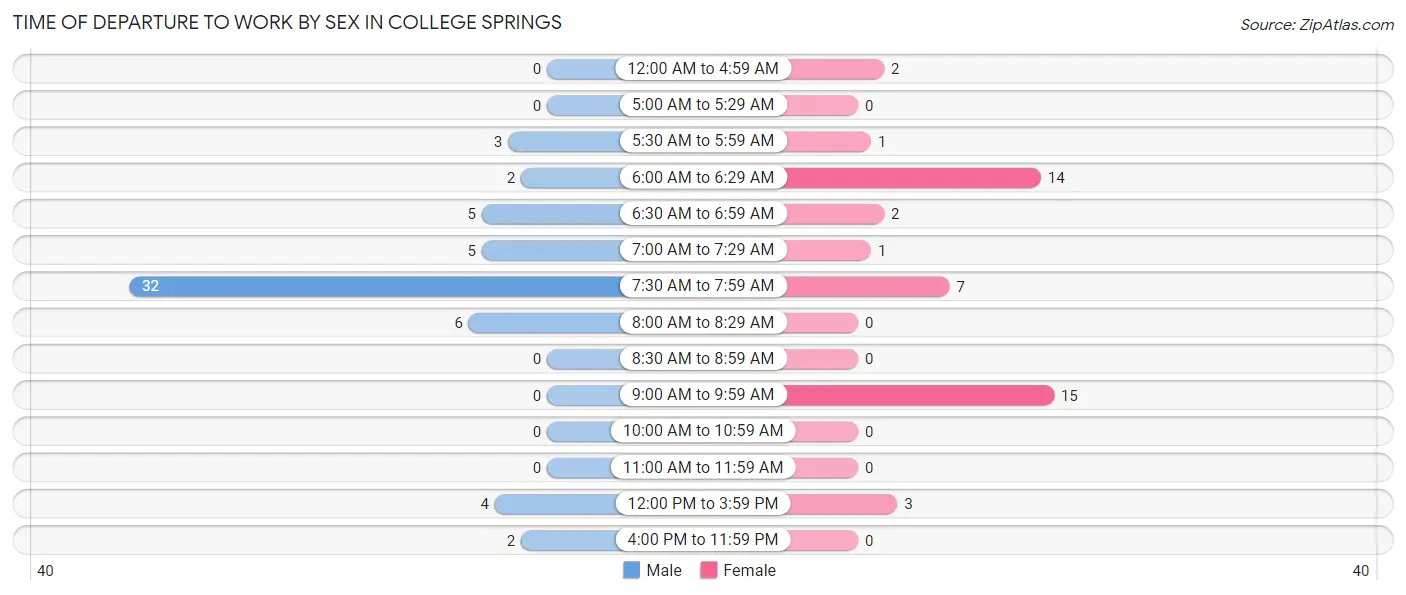
| Time of Departure | Male | Female |
| 12:00 AM to 4:59 AM | 0 (0.0%) | 2 (4.4%) |
| 5:00 AM to 5:29 AM | 0 (0.0%) | 0 (0.0%) |
| 5:30 AM to 5:59 AM | 3 (5.1%) | 1 (2.2%) |
| 6:00 AM to 6:29 AM | 2 (3.4%) | 14 (31.1%) |
| 6:30 AM to 6:59 AM | 5 (8.5%) | 2 (4.4%) |
| 7:00 AM to 7:29 AM | 5 (8.5%) | 1 (2.2%) |
| 7:30 AM to 7:59 AM | 32 (54.2%) | 7 (15.6%) |
| 8:00 AM to 8:29 AM | 6 (10.2%) | 0 (0.0%) |
| 8:30 AM to 8:59 AM | 0 (0.0%) | 0 (0.0%) |
| 9:00 AM to 9:59 AM | 0 (0.0%) | 15 (33.3%) |
| 10:00 AM to 10:59 AM | 0 (0.0%) | 0 (0.0%) |
| 11:00 AM to 11:59 AM | 0 (0.0%) | 0 (0.0%) |
| 12:00 PM to 3:59 PM | 4 (6.8%) | 3 (6.7%) |
| 4:00 PM to 11:59 PM | 2 (3.4%) | 0 (0.0%) |
| Total | 59 (100.0%) | 45 (100.0%) |
Housing Occupancy in College Springs
Occupancy by Ownership in College Springs
Of the total 103 dwellings in College Springs, owner-occupied units account for 98 (95.2%), while renter-occupied units make up 5 (4.9%).
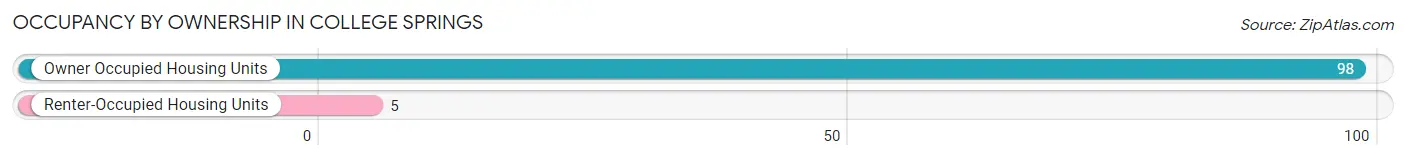
| Occupancy | # Housing Units | % Housing Units |
| Owner Occupied Housing Units | 98 | 95.2% |
| Renter-Occupied Housing Units | 5 | 4.9% |
| Total Occupied Housing Units | 103 | 100.0% |
Occupancy by Household Size in College Springs
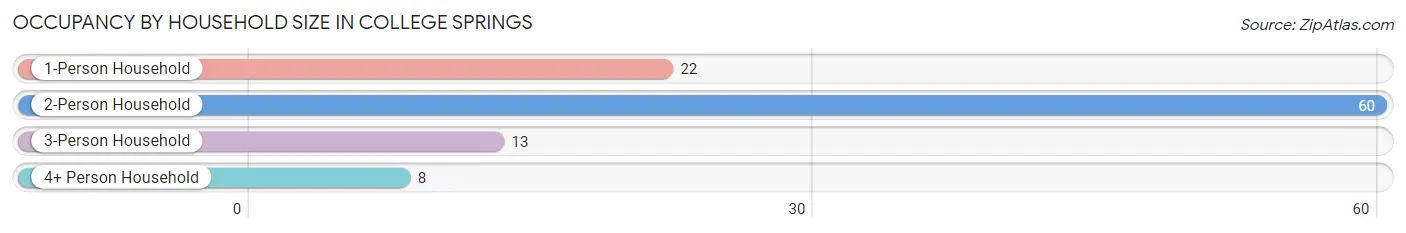
| Household Size | # Housing Units | % Housing Units |
| 1-Person Household | 22 | 21.4% |
| 2-Person Household | 60 | 58.3% |
| 3-Person Household | 13 | 12.6% |
| 4+ Person Household | 8 | 7.8% |
| Total Housing Units | 103 | 100.0% |
Occupancy by Ownership by Household Size in College Springs
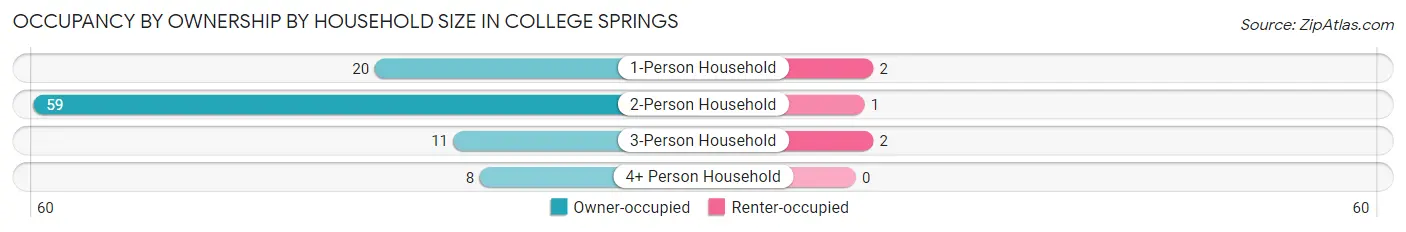
| Household Size | Owner-occupied | Renter-occupied |
| 1-Person Household | 20 (90.9%) | 2 (9.1%) |
| 2-Person Household | 59 (98.3%) | 1 (1.7%) |
| 3-Person Household | 11 (84.6%) | 2 (15.4%) |
| 4+ Person Household | 8 (100.0%) | 0 (0.0%) |
| Total Housing Units | 98 (95.2%) | 5 (4.9%) |
Occupancy by Educational Attainment in College Springs
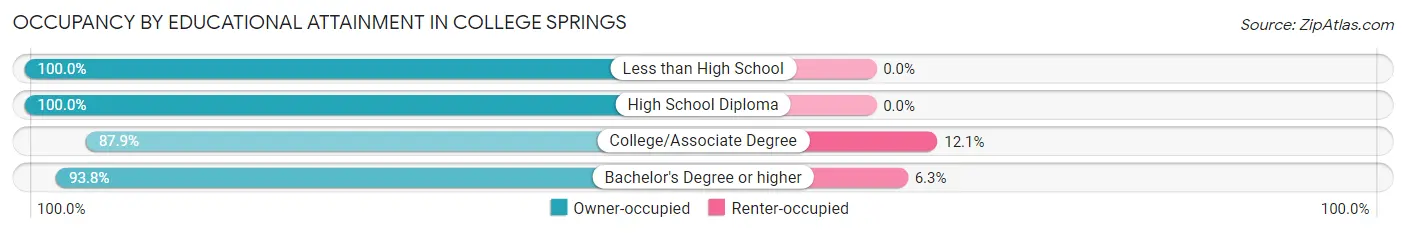
| Household Size | Owner-occupied | Renter-occupied |
| Less than High School | 4 (100.0%) | 0 (0.0%) |
| High School Diploma | 50 (100.0%) | 0 (0.0%) |
| College/Associate Degree | 29 (87.9%) | 4 (12.1%) |
| Bachelor's Degree or higher | 15 (93.8%) | 1 (6.2%) |
Occupancy by Age of Householder in College Springs
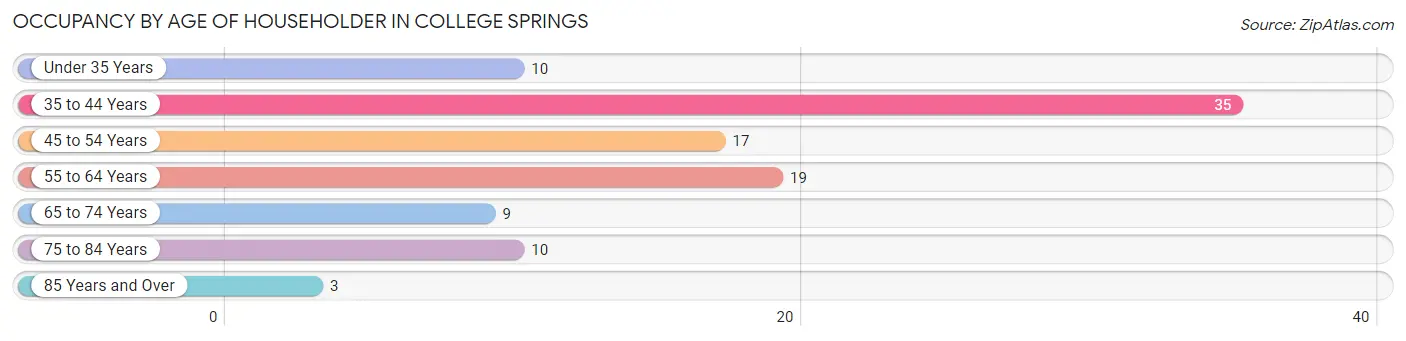
| Age Bracket | # Households | % Households |
| Under 35 Years | 10 | 9.7% |
| 35 to 44 Years | 35 | 34.0% |
| 45 to 54 Years | 17 | 16.5% |
| 55 to 64 Years | 19 | 18.4% |
| 65 to 74 Years | 9 | 8.7% |
| 75 to 84 Years | 10 | 9.7% |
| 85 Years and Over | 3 | 2.9% |
| Total | 103 | 100.0% |
Housing Finances in College Springs
Median Income by Occupancy in College Springs
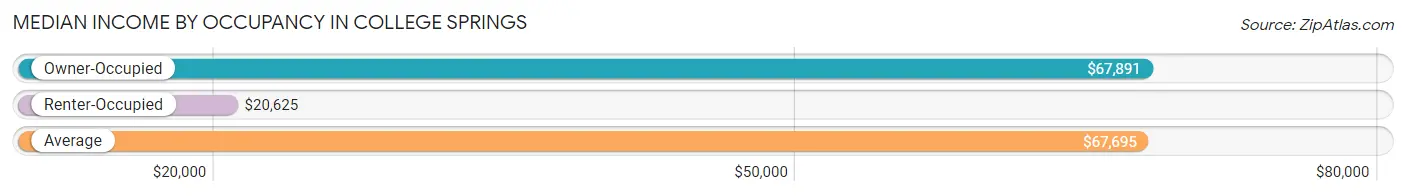
| Occupancy Type | # Households | Median Income |
| Owner-Occupied | 98 (95.2%) | $67,891 |
| Renter-Occupied | 5 (4.9%) | $20,625 |
| Average | 103 (100.0%) | $67,695 |
Occupancy by Householder Income Bracket in College Springs
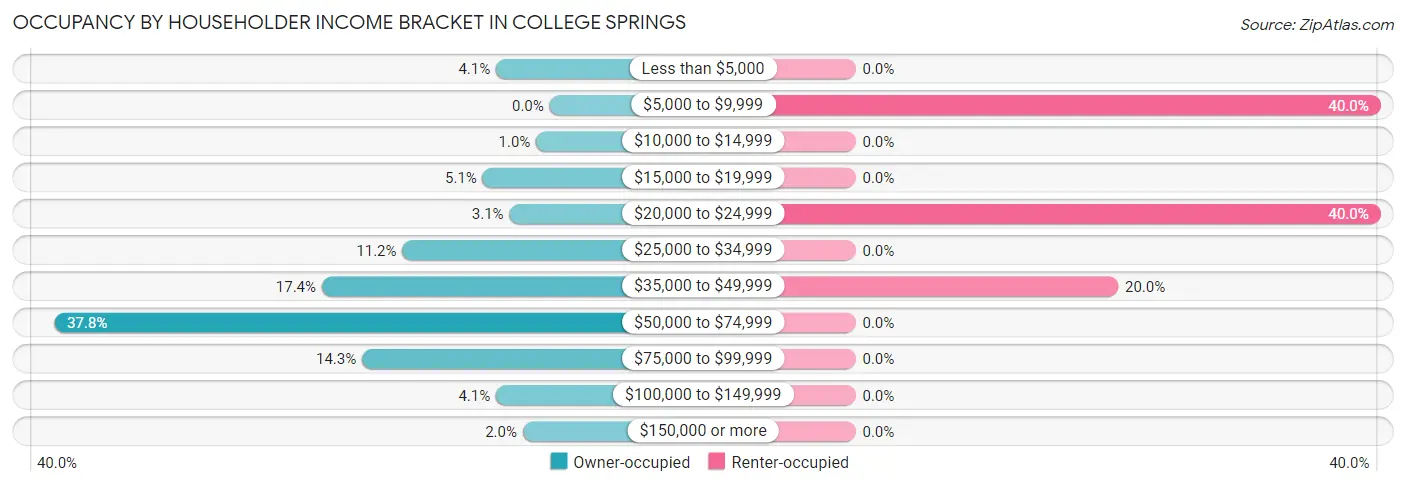
| Income Bracket | Owner-occupied | Renter-occupied |
| Less than $5,000 | 4 (4.1%) | 0 (0.0%) |
| $5,000 to $9,999 | 0 (0.0%) | 2 (40.0%) |
| $10,000 to $14,999 | 1 (1.0%) | 0 (0.0%) |
| $15,000 to $19,999 | 5 (5.1%) | 0 (0.0%) |
| $20,000 to $24,999 | 3 (3.1%) | 2 (40.0%) |
| $25,000 to $34,999 | 11 (11.2%) | 0 (0.0%) |
| $35,000 to $49,999 | 17 (17.3%) | 1 (20.0%) |
| $50,000 to $74,999 | 37 (37.8%) | 0 (0.0%) |
| $75,000 to $99,999 | 14 (14.3%) | 0 (0.0%) |
| $100,000 to $149,999 | 4 (4.1%) | 0 (0.0%) |
| $150,000 or more | 2 (2.0%) | 0 (0.0%) |
| Total | 98 (100.0%) | 5 (100.0%) |
Monthly Housing Cost Tiers in College Springs
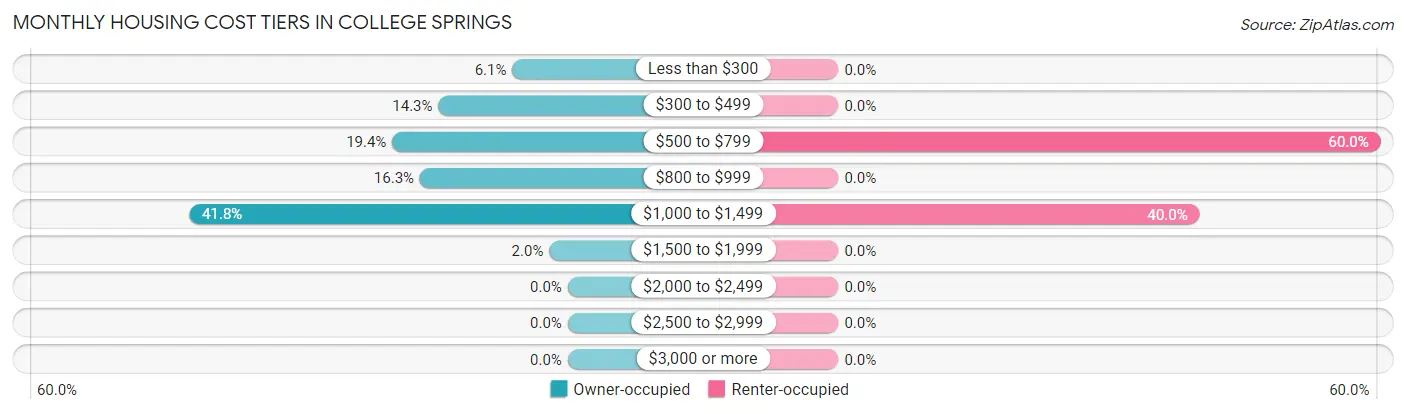
| Monthly Cost | Owner-occupied | Renter-occupied |
| Less than $300 | 6 (6.1%) | 0 (0.0%) |
| $300 to $499 | 14 (14.3%) | 0 (0.0%) |
| $500 to $799 | 19 (19.4%) | 3 (60.0%) |
| $800 to $999 | 16 (16.3%) | 0 (0.0%) |
| $1,000 to $1,499 | 41 (41.8%) | 2 (40.0%) |
| $1,500 to $1,999 | 2 (2.0%) | 0 (0.0%) |
| $2,000 to $2,499 | 0 (0.0%) | 0 (0.0%) |
| $2,500 to $2,999 | 0 (0.0%) | 0 (0.0%) |
| $3,000 or more | 0 (0.0%) | 0 (0.0%) |
| Total | 98 (100.0%) | 5 (100.0%) |
Physical Housing Characteristics in College Springs
Housing Structures in College Springs
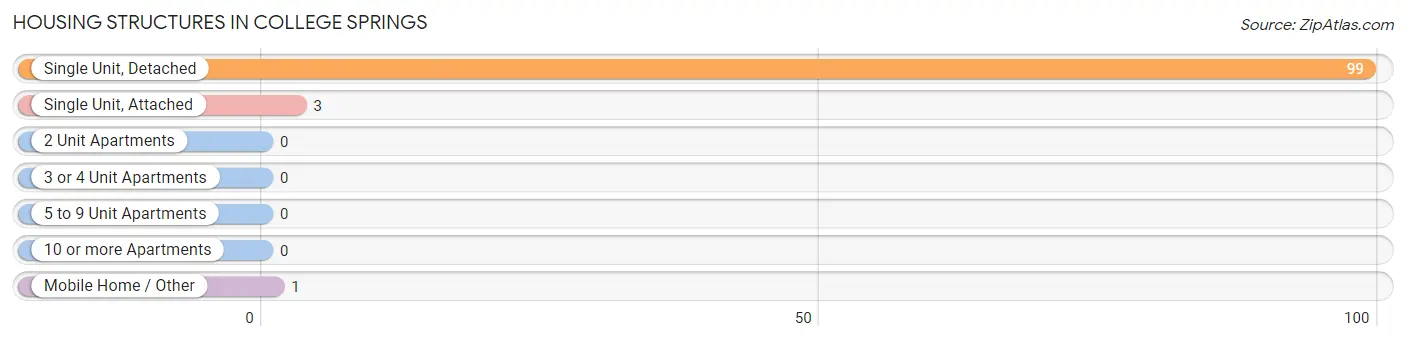
| Structure Type | # Housing Units | % Housing Units |
| Single Unit, Detached | 99 | 96.1% |
| Single Unit, Attached | 3 | 2.9% |
| 2 Unit Apartments | 0 | 0.0% |
| 3 or 4 Unit Apartments | 0 | 0.0% |
| 5 to 9 Unit Apartments | 0 | 0.0% |
| 10 or more Apartments | 0 | 0.0% |
| Mobile Home / Other | 1 | 1.0% |
| Total | 103 | 100.0% |
Housing Structures by Occupancy in College Springs
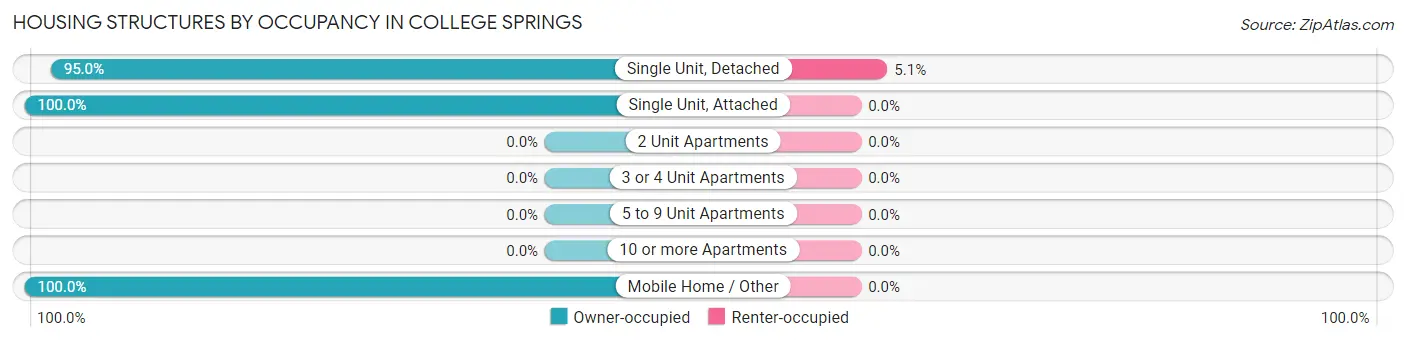
| Structure Type | Owner-occupied | Renter-occupied |
| Single Unit, Detached | 94 (95.0%) | 5 (5.1%) |
| Single Unit, Attached | 3 (100.0%) | 0 (0.0%) |
| 2 Unit Apartments | 0 (0.0%) | 0 (0.0%) |
| 3 or 4 Unit Apartments | 0 (0.0%) | 0 (0.0%) |
| 5 to 9 Unit Apartments | 0 (0.0%) | 0 (0.0%) |
| 10 or more Apartments | 0 (0.0%) | 0 (0.0%) |
| Mobile Home / Other | 1 (100.0%) | 0 (0.0%) |
| Total | 98 (95.2%) | 5 (4.9%) |
Housing Structures by Number of Rooms in College Springs
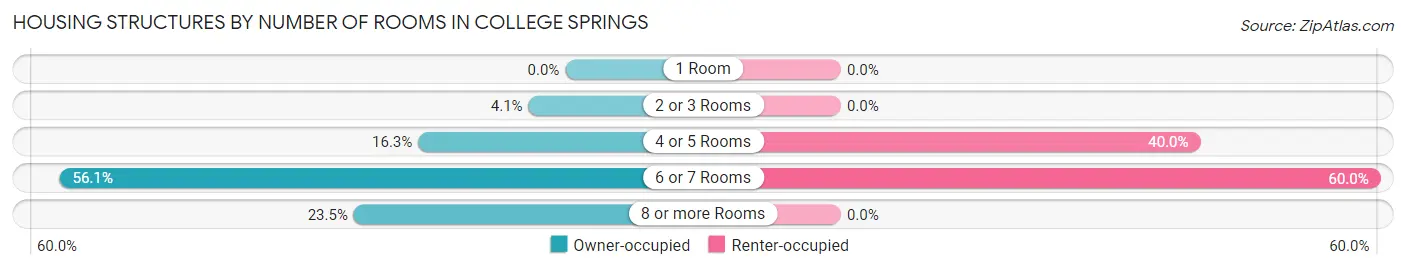
| Number of Rooms | Owner-occupied | Renter-occupied |
| 1 Room | 0 (0.0%) | 0 (0.0%) |
| 2 or 3 Rooms | 4 (4.1%) | 0 (0.0%) |
| 4 or 5 Rooms | 16 (16.3%) | 2 (40.0%) |
| 6 or 7 Rooms | 55 (56.1%) | 3 (60.0%) |
| 8 or more Rooms | 23 (23.5%) | 0 (0.0%) |
| Total | 98 (100.0%) | 5 (100.0%) |
Housing Structure by Heating Type in College Springs
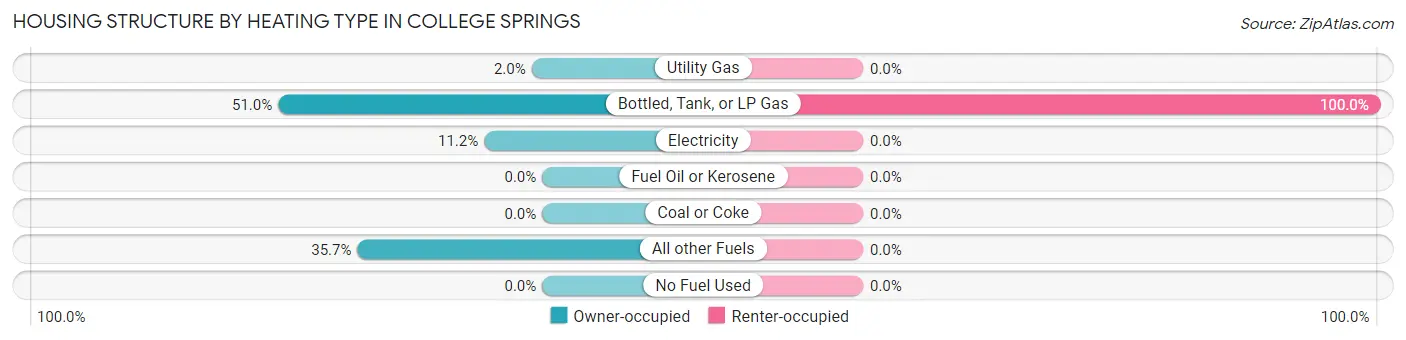
| Heating Type | Owner-occupied | Renter-occupied |
| Utility Gas | 2 (2.0%) | 0 (0.0%) |
| Bottled, Tank, or LP Gas | 50 (51.0%) | 5 (100.0%) |
| Electricity | 11 (11.2%) | 0 (0.0%) |
| Fuel Oil or Kerosene | 0 (0.0%) | 0 (0.0%) |
| Coal or Coke | 0 (0.0%) | 0 (0.0%) |
| All other Fuels | 35 (35.7%) | 0 (0.0%) |
| No Fuel Used | 0 (0.0%) | 0 (0.0%) |
| Total | 98 (100.0%) | 5 (100.0%) |
Household Vehicle Usage in College Springs
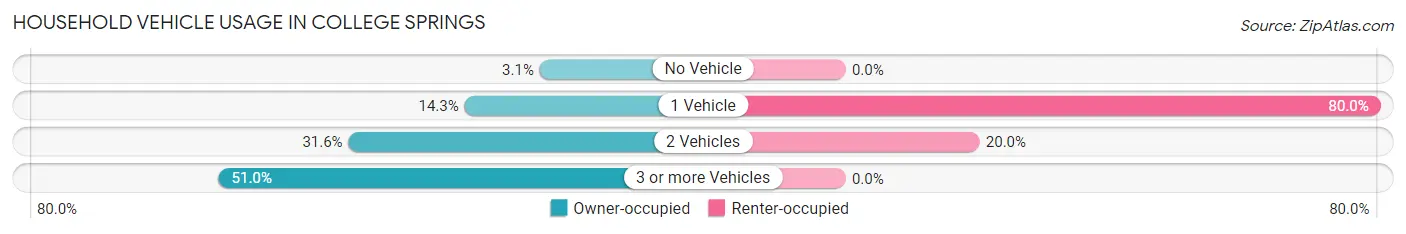
| Vehicles per Household | Owner-occupied | Renter-occupied |
| No Vehicle | 3 (3.1%) | 0 (0.0%) |
| 1 Vehicle | 14 (14.3%) | 4 (80.0%) |
| 2 Vehicles | 31 (31.6%) | 1 (20.0%) |
| 3 or more Vehicles | 50 (51.0%) | 0 (0.0%) |
| Total | 98 (100.0%) | 5 (100.0%) |
Real Estate & Mortgages in College Springs
Real Estate and Mortgage Overview in College Springs
| Characteristic | Without Mortgage | With Mortgage |
| Housing Units | 38 | 60 |
| Median Property Value | $53,800 | $74,400 |
| Median Household Income | $41,250 | $2 |
| Monthly Housing Costs | $490 | $0 |
| Real Estate Taxes | $1,136 | $2 |
Property Value by Mortgage Status in College Springs
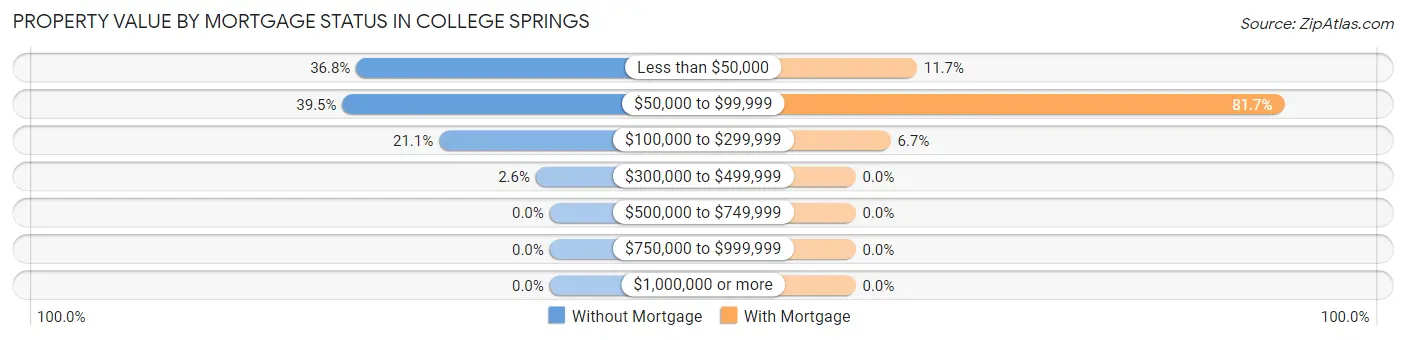
| Property Value | Without Mortgage | With Mortgage |
| Less than $50,000 | 14 (36.8%) | 7 (11.7%) |
| $50,000 to $99,999 | 15 (39.5%) | 49 (81.7%) |
| $100,000 to $299,999 | 8 (21.0%) | 4 (6.7%) |
| $300,000 to $499,999 | 1 (2.6%) | 0 (0.0%) |
| $500,000 to $749,999 | 0 (0.0%) | 0 (0.0%) |
| $750,000 to $999,999 | 0 (0.0%) | 0 (0.0%) |
| $1,000,000 or more | 0 (0.0%) | 0 (0.0%) |
| Total | 38 (100.0%) | 60 (100.0%) |
Household Income by Mortgage Status in College Springs
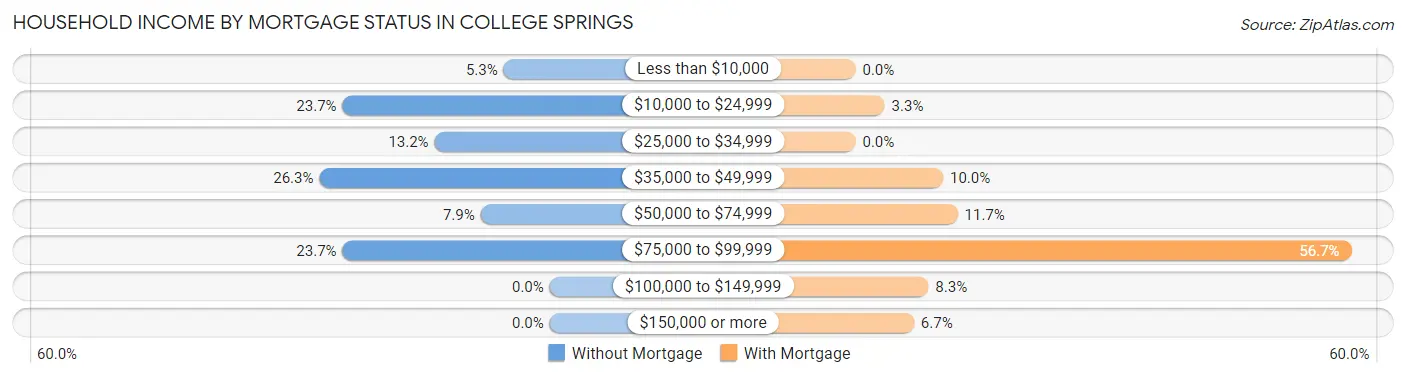
| Household Income | Without Mortgage | With Mortgage |
| Less than $10,000 | 2 (5.3%) | 0 (0.0%) |
| $10,000 to $24,999 | 9 (23.7%) | 2 (3.3%) |
| $25,000 to $34,999 | 5 (13.2%) | 0 (0.0%) |
| $35,000 to $49,999 | 10 (26.3%) | 6 (10.0%) |
| $50,000 to $74,999 | 3 (7.9%) | 7 (11.7%) |
| $75,000 to $99,999 | 9 (23.7%) | 34 (56.7%) |
| $100,000 to $149,999 | 0 (0.0%) | 5 (8.3%) |
| $150,000 or more | 0 (0.0%) | 4 (6.7%) |
| Total | 38 (100.0%) | 60 (100.0%) |
Property Value to Household Income Ratio in College Springs
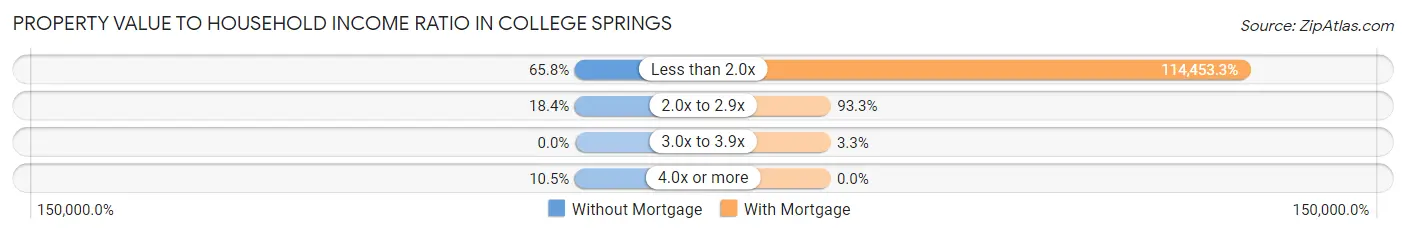
| Value-to-Income Ratio | Without Mortgage | With Mortgage |
| Less than 2.0x | 25 (65.8%) | 68,672 (114,453.3%) |
| 2.0x to 2.9x | 7 (18.4%) | 56 (93.3%) |
| 3.0x to 3.9x | 0 (0.0%) | 2 (3.3%) |
| 4.0x or more | 4 (10.5%) | 0 (0.0%) |
| Total | 38 (100.0%) | 60 (100.0%) |
Real Estate Taxes by Mortgage Status in College Springs
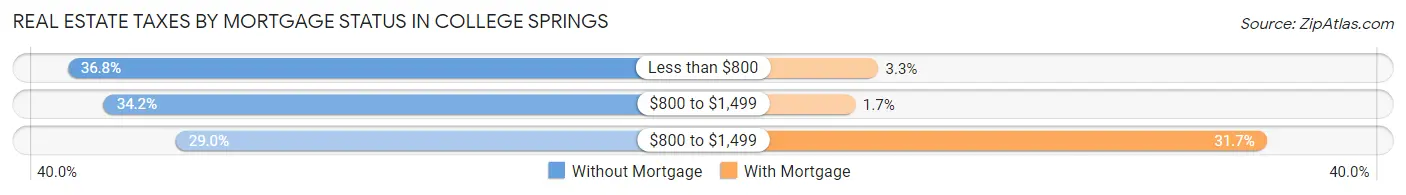
| Property Taxes | Without Mortgage | With Mortgage |
| Less than $800 | 14 (36.8%) | 2 (3.3%) |
| $800 to $1,499 | 13 (34.2%) | 1 (1.7%) |
| $800 to $1,499 | 11 (28.9%) | 19 (31.7%) |
| Total | 38 (100.0%) | 60 (100.0%) |
Health & Disability in College Springs
Health Insurance Coverage by Age in College Springs
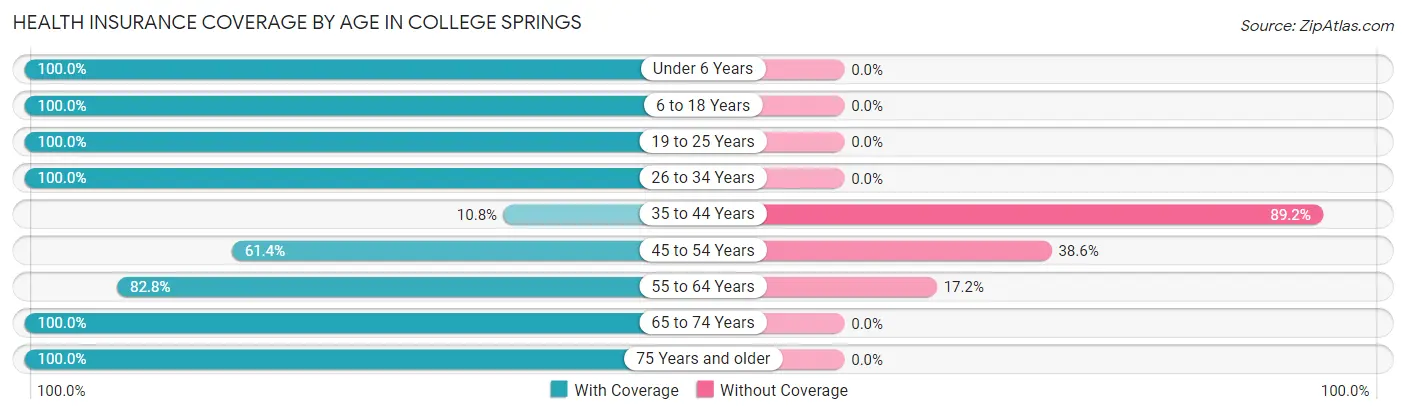
| Age Bracket | With Coverage | Without Coverage |
| Under 6 Years | 10 (100.0%) | 0 (0.0%) |
| 6 to 18 Years | 42 (100.0%) | 0 (0.0%) |
| 19 to 25 Years | 2 (100.0%) | 0 (0.0%) |
| 26 to 34 Years | 15 (100.0%) | 0 (0.0%) |
| 35 to 44 Years | 4 (10.8%) | 33 (89.2%) |
| 45 to 54 Years | 27 (61.4%) | 17 (38.6%) |
| 55 to 64 Years | 24 (82.8%) | 5 (17.2%) |
| 65 to 74 Years | 19 (100.0%) | 0 (0.0%) |
| 75 Years and older | 19 (100.0%) | 0 (0.0%) |
| Total | 162 (74.7%) | 55 (25.4%) |
Health Insurance Coverage by Citizenship Status in College Springs
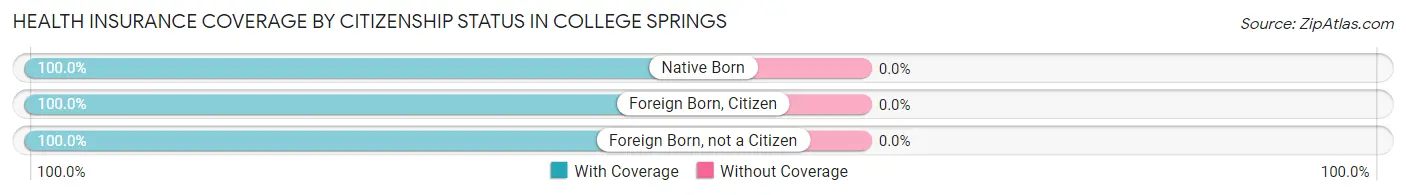
| Citizenship Status | With Coverage | Without Coverage |
| Native Born | 10 (100.0%) | 0 (0.0%) |
| Foreign Born, Citizen | 42 (100.0%) | 0 (0.0%) |
| Foreign Born, not a Citizen | 2 (100.0%) | 0 (0.0%) |
Health Insurance Coverage by Household Income in College Springs
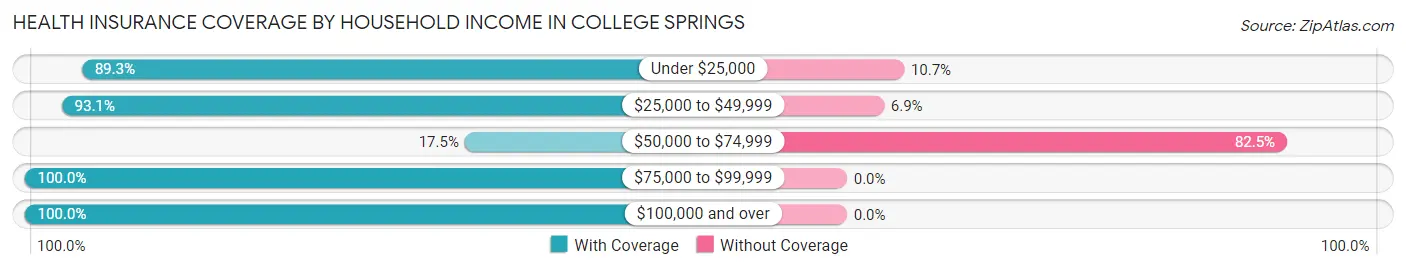
| Household Income | With Coverage | Without Coverage |
| Under $25,000 | 25 (89.3%) | 3 (10.7%) |
| $25,000 to $49,999 | 67 (93.1%) | 5 (6.9%) |
| $50,000 to $74,999 | 10 (17.5%) | 47 (82.5%) |
| $75,000 to $99,999 | 32 (100.0%) | 0 (0.0%) |
| $100,000 and over | 28 (100.0%) | 0 (0.0%) |
Public vs Private Health Insurance Coverage by Age in College Springs
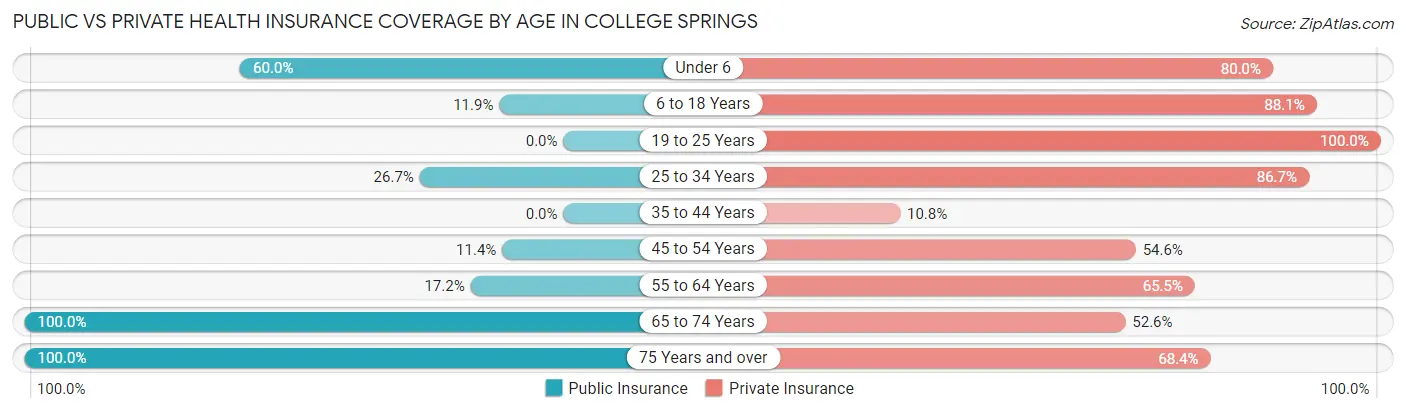
| Age Bracket | Public Insurance | Private Insurance |
| Under 6 | 6 (60.0%) | 8 (80.0%) |
| 6 to 18 Years | 5 (11.9%) | 37 (88.1%) |
| 19 to 25 Years | 0 (0.0%) | 2 (100.0%) |
| 25 to 34 Years | 4 (26.7%) | 13 (86.7%) |
| 35 to 44 Years | 0 (0.0%) | 4 (10.8%) |
| 45 to 54 Years | 5 (11.4%) | 24 (54.5%) |
| 55 to 64 Years | 5 (17.2%) | 19 (65.5%) |
| 65 to 74 Years | 19 (100.0%) | 10 (52.6%) |
| 75 Years and over | 19 (100.0%) | 13 (68.4%) |
| Total | 63 (29.0%) | 130 (59.9%) |
Disability Status by Sex by Age in College Springs
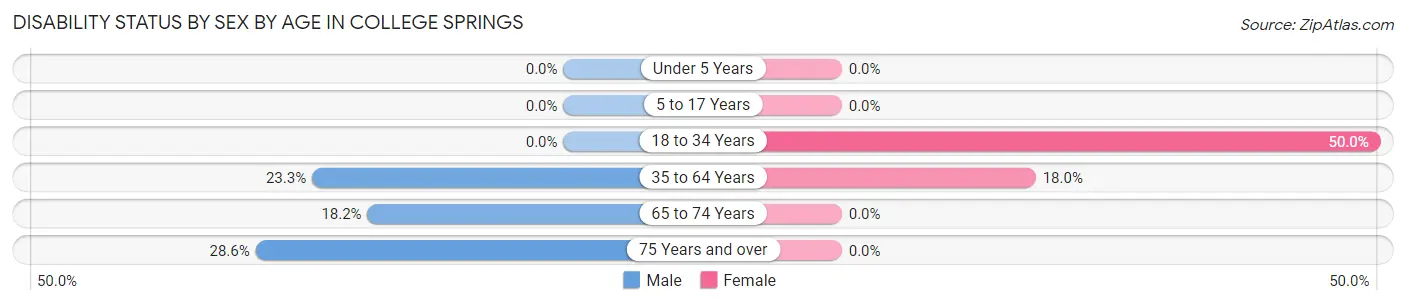
| Age Bracket | Male | Female |
| Under 5 Years | 0 (0.0%) | 0 (0.0%) |
| 5 to 17 Years | 0 (0.0%) | 0 (0.0%) |
| 18 to 34 Years | 0 (0.0%) | 4 (50.0%) |
| 35 to 64 Years | 14 (23.3%) | 9 (18.0%) |
| 65 to 74 Years | 2 (18.2%) | 0 (0.0%) |
| 75 Years and over | 4 (28.6%) | 0 (0.0%) |
Disability Class by Sex by Age in College Springs
Disability Class: Hearing Difficulty
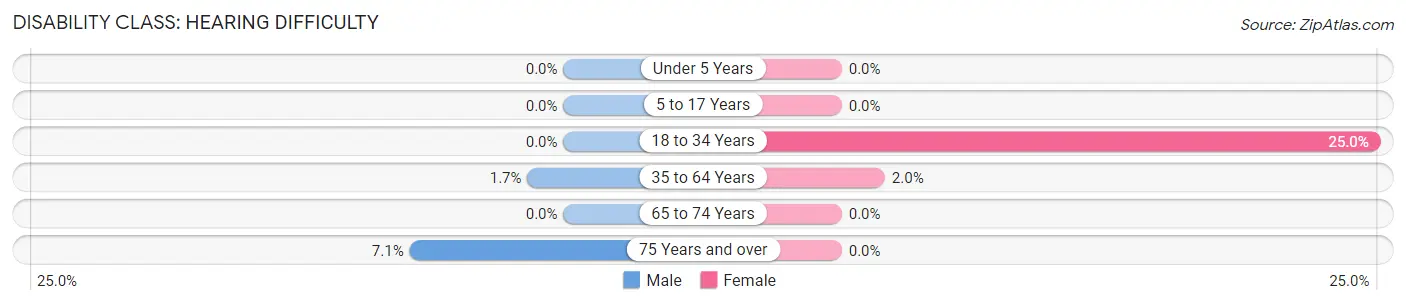
| Age Bracket | Male | Female |
| Under 5 Years | 0 (0.0%) | 0 (0.0%) |
| 5 to 17 Years | 0 (0.0%) | 0 (0.0%) |
| 18 to 34 Years | 0 (0.0%) | 2 (25.0%) |
| 35 to 64 Years | 1 (1.7%) | 1 (2.0%) |
| 65 to 74 Years | 0 (0.0%) | 0 (0.0%) |
| 75 Years and over | 1 (7.1%) | 0 (0.0%) |
Disability Class: Vision Difficulty
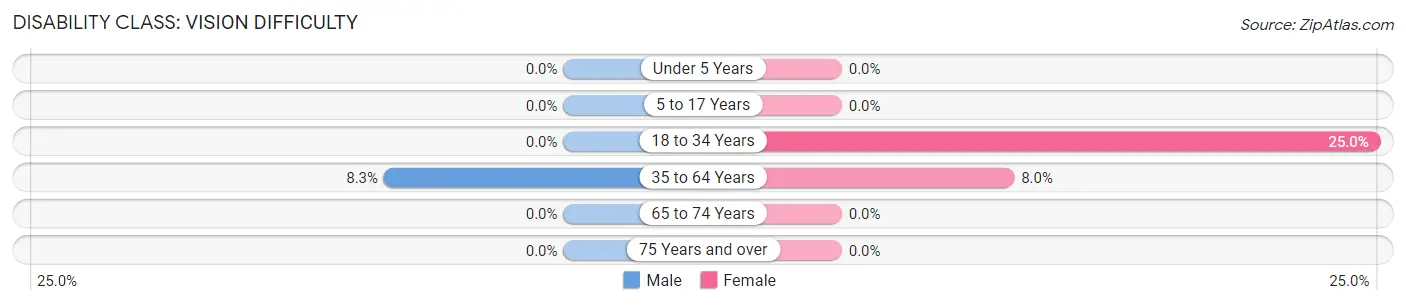
| Age Bracket | Male | Female |
| Under 5 Years | 0 (0.0%) | 0 (0.0%) |
| 5 to 17 Years | 0 (0.0%) | 0 (0.0%) |
| 18 to 34 Years | 0 (0.0%) | 2 (25.0%) |
| 35 to 64 Years | 5 (8.3%) | 4 (8.0%) |
| 65 to 74 Years | 0 (0.0%) | 0 (0.0%) |
| 75 Years and over | 0 (0.0%) | 0 (0.0%) |
Disability Class: Cognitive Difficulty
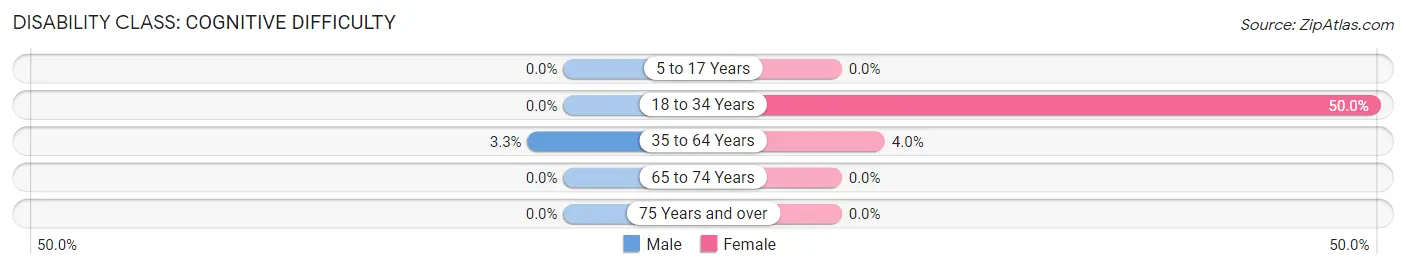
| Age Bracket | Male | Female |
| 5 to 17 Years | 0 (0.0%) | 0 (0.0%) |
| 18 to 34 Years | 0 (0.0%) | 4 (50.0%) |
| 35 to 64 Years | 2 (3.3%) | 2 (4.0%) |
| 65 to 74 Years | 0 (0.0%) | 0 (0.0%) |
| 75 Years and over | 0 (0.0%) | 0 (0.0%) |
Disability Class: Ambulatory Difficulty
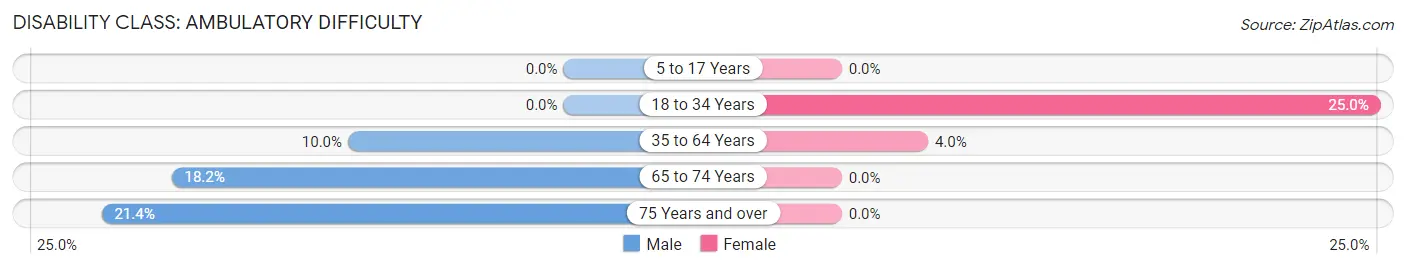
| Age Bracket | Male | Female |
| 5 to 17 Years | 0 (0.0%) | 0 (0.0%) |
| 18 to 34 Years | 0 (0.0%) | 2 (25.0%) |
| 35 to 64 Years | 6 (10.0%) | 2 (4.0%) |
| 65 to 74 Years | 2 (18.2%) | 0 (0.0%) |
| 75 Years and over | 3 (21.4%) | 0 (0.0%) |
Disability Class: Self-Care Difficulty
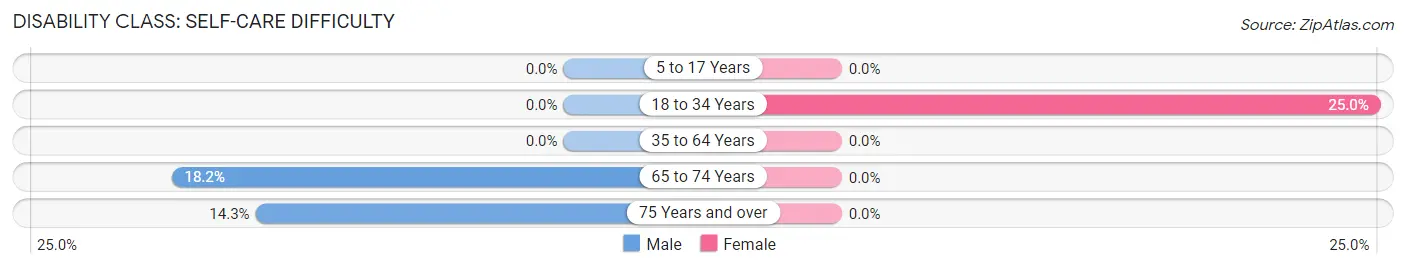
| Age Bracket | Male | Female |
| 5 to 17 Years | 0 (0.0%) | 0 (0.0%) |
| 18 to 34 Years | 0 (0.0%) | 2 (25.0%) |
| 35 to 64 Years | 0 (0.0%) | 0 (0.0%) |
| 65 to 74 Years | 2 (18.2%) | 0 (0.0%) |
| 75 Years and over | 2 (14.3%) | 0 (0.0%) |
Technology Access in College Springs
Computing Device Access in College Springs
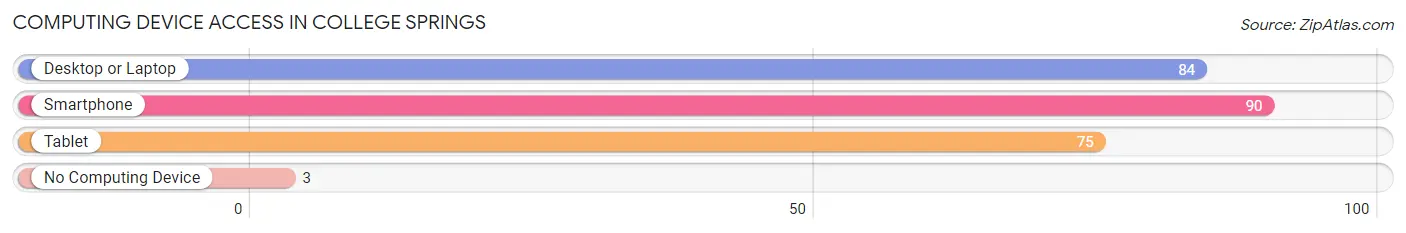
| Device Type | # Households | % Households |
| Desktop or Laptop | 84 | 81.6% |
| Smartphone | 90 | 87.4% |
| Tablet | 75 | 72.8% |
| No Computing Device | 3 | 2.9% |
| Total | 103 | 100.0% |
Internet Access in College Springs
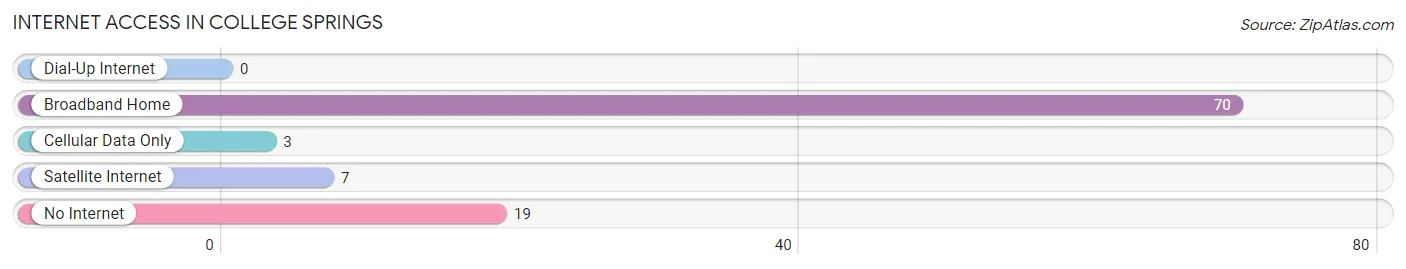
| Internet Type | # Households | % Households |
| Dial-Up Internet | 0 | 0.0% |
| Broadband Home | 70 | 68.0% |
| Cellular Data Only | 3 | 2.9% |
| Satellite Internet | 7 | 6.8% |
| No Internet | 19 | 18.4% |
| Total | 103 | 100.0% |
College Springs Summary
History
College Springs is a small town located in Page County, Iowa. It is situated in the southwestern corner of the state, near the Missouri border. The town was founded in 1854 by a group of settlers from Ohio, who named it after the nearby college of the same name. The college was founded in 1851 and was the first college in the state of Iowa.
The town of College Springs grew slowly over the years, but it was not until the late 19th century that it began to experience significant growth. In 1887, the Chicago, Burlington & Quincy Railroad built a line through the town, connecting it to the larger cities of Des Moines and Omaha. This allowed for increased trade and commerce, and the town began to thrive.
In the early 20th century, College Springs was a bustling agricultural center, with a variety of crops being grown in the area. The town also had a number of businesses, including a bank, a hotel, a general store, and a post office.
Geography
College Springs is located in the southwestern corner of Page County, Iowa. It is situated in the Loess Hills region of the state, which is characterized by rolling hills and fertile soil. The town is located near the Missouri border, and is approximately 30 miles from the larger cities of Des Moines and Omaha.
The town is situated on the banks of the East Nishnabotna River, which flows through the area. The river is a popular spot for fishing and other recreational activities. The town is also located near several state parks, including the Loess Hills State Forest and the Backbone State Park.
Economy
The economy of College Springs is largely based on agriculture. The town is situated in a fertile agricultural region, and a variety of crops are grown in the area. These include corn, soybeans, wheat, and hay. The town also has a number of businesses, including a bank, a hotel, a general store, and a post office.
The town is also home to a number of manufacturing companies, including a furniture factory and a metal fabrication plant. The town is also home to a number of small businesses, including restaurants, shops, and other services.
Demographics
As of the 2010 census, the population of College Springs was 1,093. The town has a median age of 38.7 years, and the median household income is $45,938. The town is predominantly white, with 92.3% of the population identifying as such. The town also has a small Hispanic population, with 4.3% of the population identifying as such.
Conclusion
College Springs is a small town located in Page County, Iowa. It was founded in 1854 and has since grown into a bustling agricultural center. The town is situated in the Loess Hills region of the state, and is home to a variety of businesses and manufacturing companies. The town has a predominantly white population, with a small Hispanic population. The town has a median household income of $45,938, and is a popular spot for fishing and other recreational activities.
Common Questions
What is Per Capita Income in College Springs?
Per Capita income in College Springs is $26,411.
What is the Median Family Income in College Springs?
Median Family Income in College Springs is $48,750.
What is the Median Household income in College Springs?
Median Household Income in College Springs is $67,695.
What is Inequality or Gini Index in College Springs?
Inequality or Gini Index in College Springs is 0.31.
What is the Total Population of College Springs?
Total Population of College Springs is 217.
What is the Total Male Population of College Springs?
Total Male Population of College Springs is 111.
What is the Total Female Population of College Springs?
Total Female Population of College Springs is 106.
What is the Ratio of Males per 100 Females in College Springs?
There are 104.72 Males per 100 Females in College Springs.
What is the Ratio of Females per 100 Males in College Springs?
There are 95.50 Females per 100 Males in College Springs.
What is the Median Population Age in College Springs?
Median Population Age in College Springs is 47.3 Years.
What is the Average Family Size in College Springs
Average Family Size in College Springs is 3.0 People.
What is the Average Household Size in College Springs
Average Household Size in College Springs is 2.1 People.
How Large is the Labor Force in College Springs?
There are 119 People in the Labor Forcein in College Springs.
What is the Percentage of People in the Labor Force in College Springs?
70.4% of People are in the Labor Force in College Springs.
What is the Unemployment Rate in College Springs?
Unemployment Rate in College Springs is 1.7%.