Greenville, IA Map & Demographics
Greenville Map
Greenville Overview
$21,963
PER CAPITA INCOME
$50,000
AVG FAMILY INCOME
$43,438
AVG HOUSEHOLD INCOME
0.41
INEQUALITY / GINI INDEX
71
TOTAL POPULATION
46
MALE POPULATION
25
FEMALE POPULATION
184.00
MALES / 100 FEMALES
54.35
FEMALES / 100 MALES
29.1
MEDIAN AGE
3.8
AVG FAMILY SIZE
2.8
AVG HOUSEHOLD SIZE
36
LABOR FORCE [ PEOPLE ]
80.0%
PERCENT IN LABOR FORCE
Greenville Zip Codes
Greenville Area Codes
Income in Greenville
Income Overview in Greenville
Per Capita Income in Greenville is $21,963, while median incomes of families and households are $50,000 and $43,438 respectively.
| Characteristic | Number | Measure |
| Per Capita Income | 71 | $21,963 |
| Median Family Income | 16 | $50,000 |
| Mean Family Income | 16 | $68,869 |
| Median Household Income | 25 | $43,438 |
| Mean Household Income | 25 | $56,656 |
| Income Deficit | 16 | $0 |
| Wage / Income Gap (%) | 71 | 0.00% |
| Wage / Income Gap ($) | 71 | 100.00¢ per $1 |
| Gini / Inequality Index | 71 | 0.41 |
Earnings by Sex in Greenville
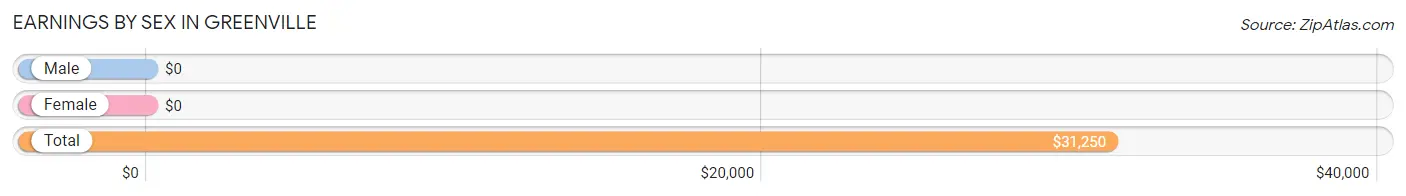
| Sex | Number | Average Earnings |
| Male | 21 (58.3%) | $0 |
| Female | 15 (41.7%) | $0 |
| Total | 36 (100.0%) | $31,250 |
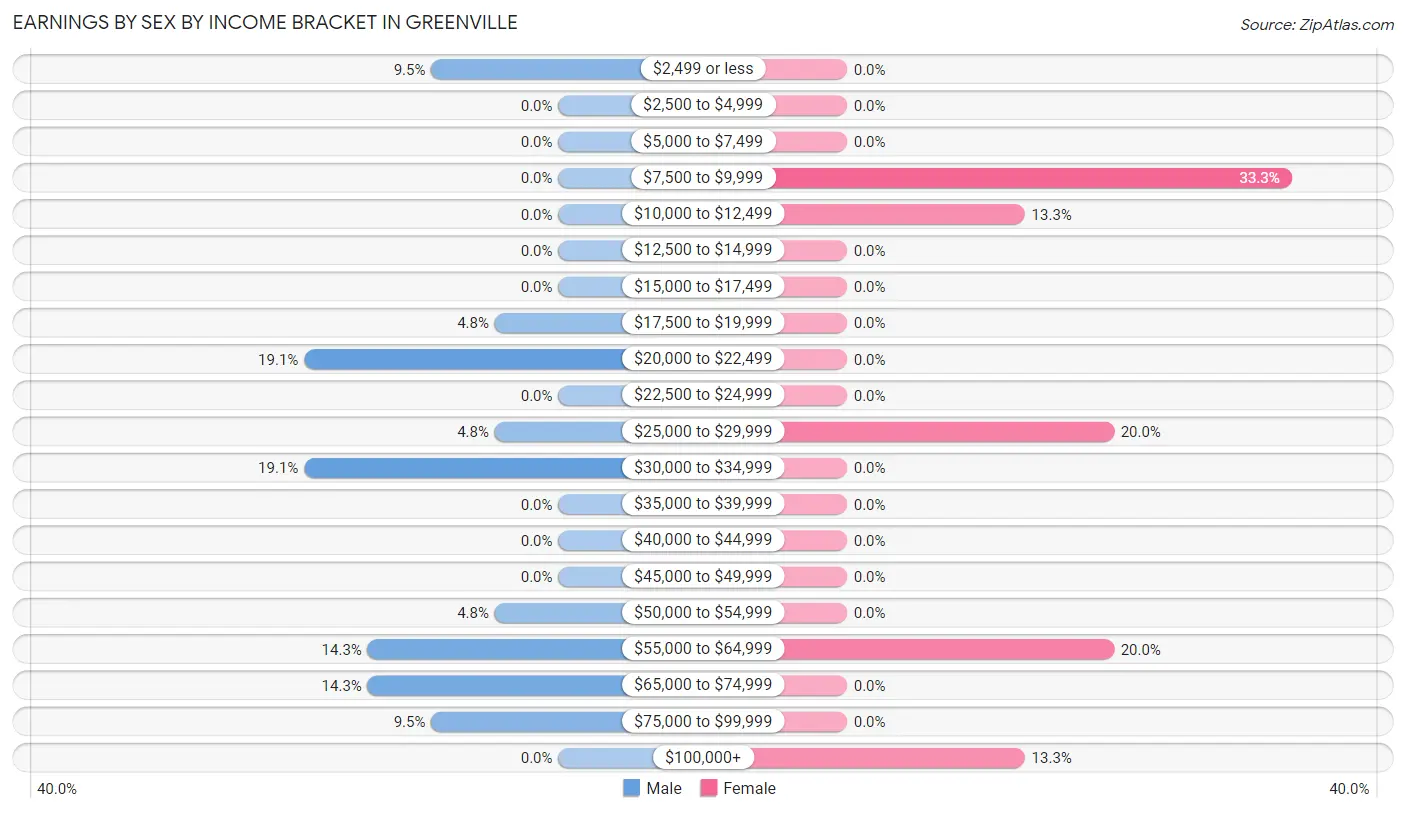
Earnings by Sex by Income Bracket in Greenville
The most common earnings brackets in Greenville are $20,000 to $22,499 for men (4 | 19.1%) and $7,500 to $9,999 for women (5 | 33.3%).
| Income | Male | Female |
| $2,499 or less | 2 (9.5%) | 0 (0.0%) |
| $2,500 to $4,999 | 0 (0.0%) | 0 (0.0%) |
| $5,000 to $7,499 | 0 (0.0%) | 0 (0.0%) |
| $7,500 to $9,999 | 0 (0.0%) | 5 (33.3%) |
| $10,000 to $12,499 | 0 (0.0%) | 2 (13.3%) |
| $12,500 to $14,999 | 0 (0.0%) | 0 (0.0%) |
| $15,000 to $17,499 | 0 (0.0%) | 0 (0.0%) |
| $17,500 to $19,999 | 1 (4.8%) | 0 (0.0%) |
| $20,000 to $22,499 | 4 (19.1%) | 0 (0.0%) |
| $22,500 to $24,999 | 0 (0.0%) | 0 (0.0%) |
| $25,000 to $29,999 | 1 (4.8%) | 3 (20.0%) |
| $30,000 to $34,999 | 4 (19.1%) | 0 (0.0%) |
| $35,000 to $39,999 | 0 (0.0%) | 0 (0.0%) |
| $40,000 to $44,999 | 0 (0.0%) | 0 (0.0%) |
| $45,000 to $49,999 | 0 (0.0%) | 0 (0.0%) |
| $50,000 to $54,999 | 1 (4.8%) | 0 (0.0%) |
| $55,000 to $64,999 | 3 (14.3%) | 3 (20.0%) |
| $65,000 to $74,999 | 3 (14.3%) | 0 (0.0%) |
| $75,000 to $99,999 | 2 (9.5%) | 0 (0.0%) |
| $100,000+ | 0 (0.0%) | 2 (13.3%) |
| Total | 21 (100.0%) | 15 (100.0%) |
Earnings by Sex by Educational Attainment in Greenville
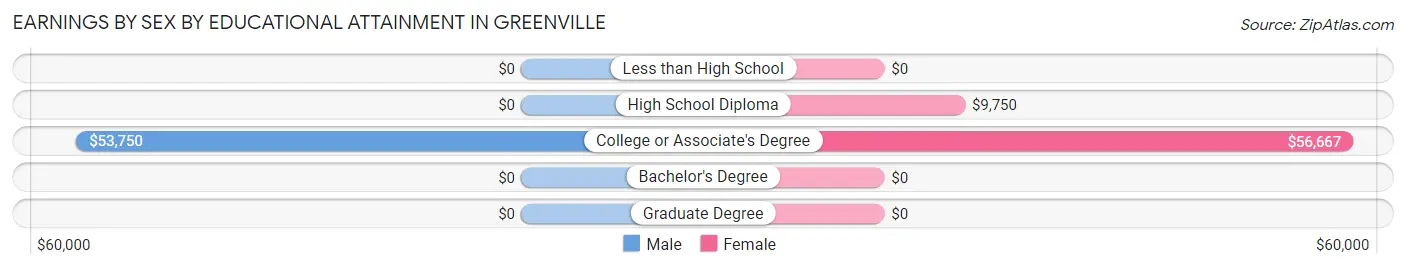
| Educational Attainment | Male Income | Female Income |
| Less than High School | - | - |
| High School Diploma | - | - |
| College or Associate's Degree | $53,750 | $56,667 |
| Bachelor's Degree | - | - |
| Graduate Degree | - | - |
| Total | - | - |
Family Income in Greenville
Family Income Brackets in Greenville
According to the Greenville family income data, there are 4 families falling into the $25,000 to $34,999 income range, which is the most common income bracket and makes up 25.0% of all families.
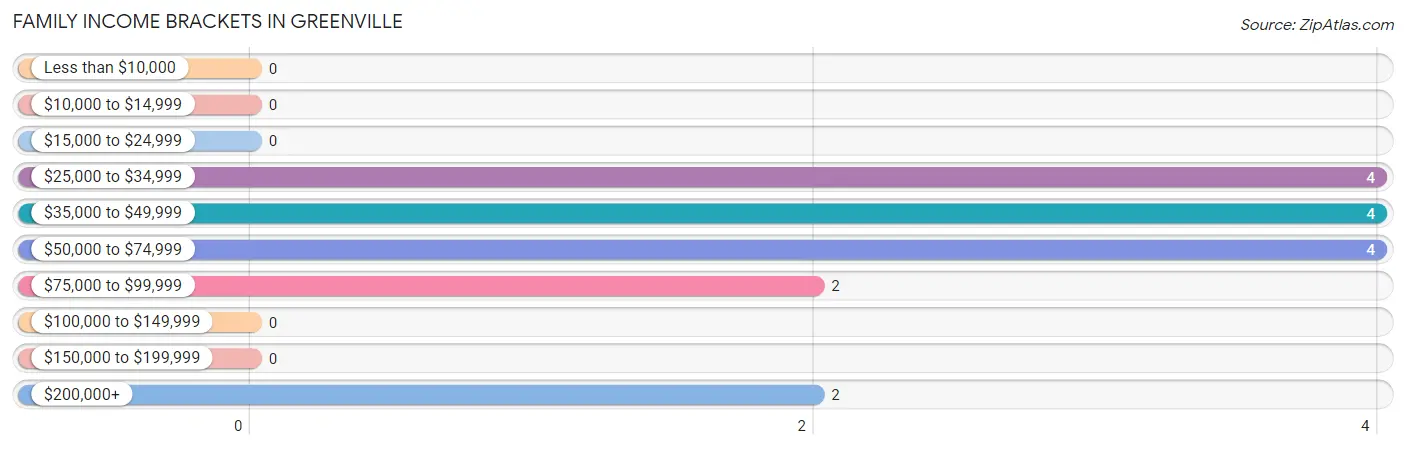
| Income Bracket | # Families | % Families |
| Less than $10,000 | 0 | 0.0% |
| $10,000 to $14,999 | 0 | 0.0% |
| $15,000 to $24,999 | 0 | 0.0% |
| $25,000 to $34,999 | 4 | 25.0% |
| $35,000 to $49,999 | 4 | 25.0% |
| $50,000 to $74,999 | 4 | 25.0% |
| $75,000 to $99,999 | 2 | 12.5% |
| $100,000 to $149,999 | 0 | 0.0% |
| $150,000 to $199,999 | 0 | 0.0% |
| $200,000+ | 2 | 12.5% |
Family Income by Famaliy Size in Greenville
2-person families (7 | 43.8%) account for the highest median family income in Greenville with $58,750 per family, while 2-person families (7 | 43.8%) have the highest median income of $29,375 per family member.
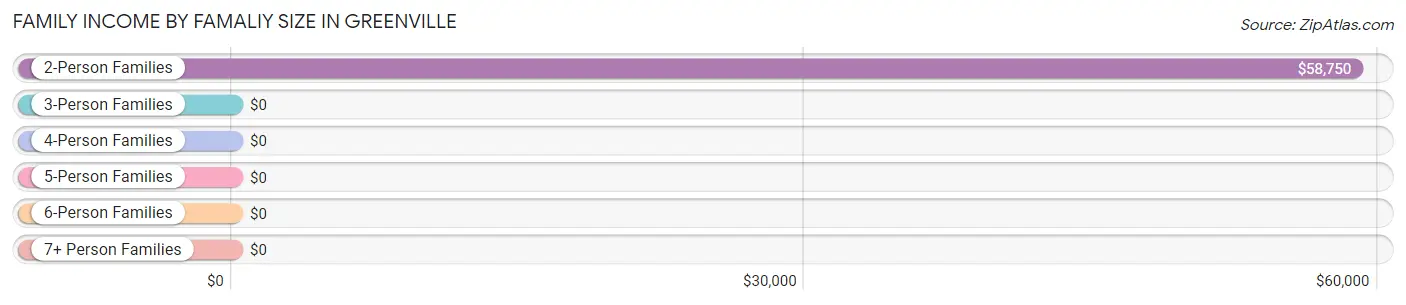
| Income Bracket | # Families | Median Income |
| 2-Person Families | 7 (43.8%) | $58,750 |
| 3-Person Families | 0 (0.0%) | $0 |
| 4-Person Families | 8 (50.0%) | $0 |
| 5-Person Families | 1 (6.2%) | $0 |
| 6-Person Families | 0 (0.0%) | $0 |
| 7+ Person Families | 0 (0.0%) | $0 |
| Total | 16 (100.0%) | $50,000 |
Family Income by Number of Earners in Greenville
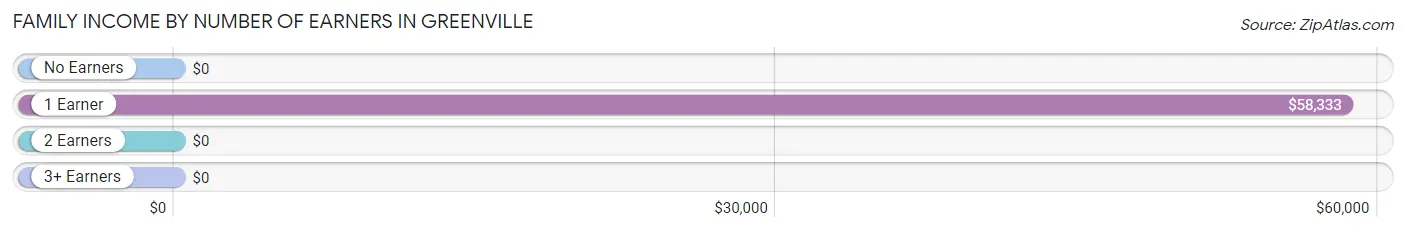
| Number of Earners | # Families | Median Income |
| No Earners | 1 (6.2%) | $0 |
| 1 Earner | 6 (37.5%) | $58,333 |
| 2 Earners | 9 (56.2%) | $0 |
| 3+ Earners | 0 (0.0%) | $0 |
| Total | 16 (100.0%) | $50,000 |
Household Income in Greenville
Household Income Brackets in Greenville
With 6 households falling in the category, the $15,000 to $24,999 income range is the most frequent in Greenville, accounting for 24.0% of all households.
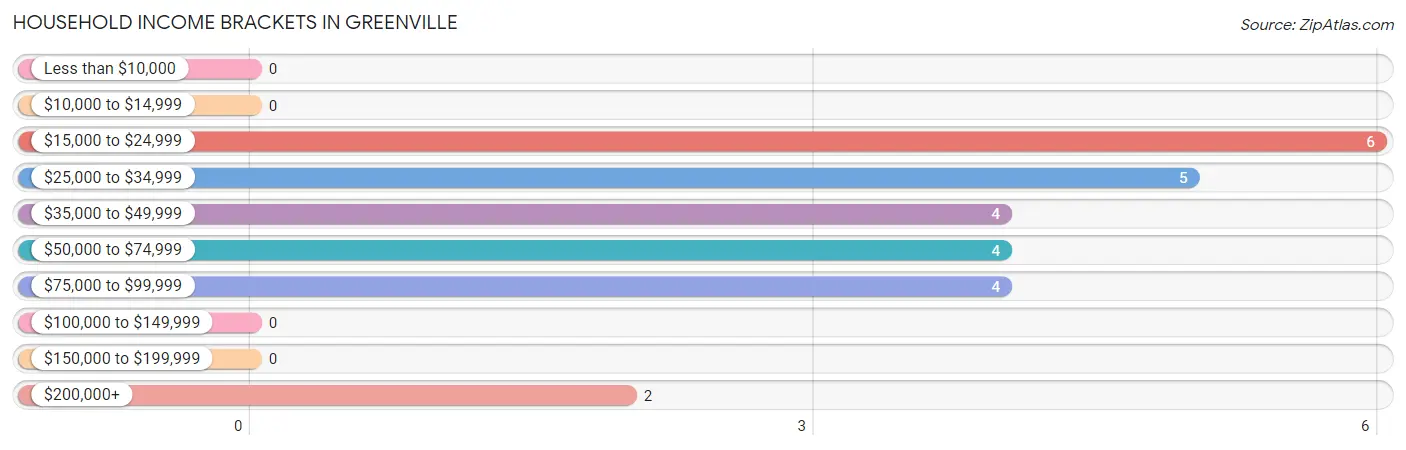
| Income Bracket | # Households | % Households |
| Less than $10,000 | 0 | 0.0% |
| $10,000 to $14,999 | 0 | 0.0% |
| $15,000 to $24,999 | 6 | 24.0% |
| $25,000 to $34,999 | 5 | 20.0% |
| $35,000 to $49,999 | 4 | 16.0% |
| $50,000 to $74,999 | 4 | 16.0% |
| $75,000 to $99,999 | 4 | 16.0% |
| $100,000 to $149,999 | 0 | 0.0% |
| $150,000 to $199,999 | 0 | 0.0% |
| $200,000+ | 2 | 8.0% |
Household Income by Householder Age in Greenville
The median household income in Greenville is $43,438, with the highest median household income of $50,000 found in the 25 to 44 years age bracket for the primary householder. A total of 10 households (40.0%) fall into this category.
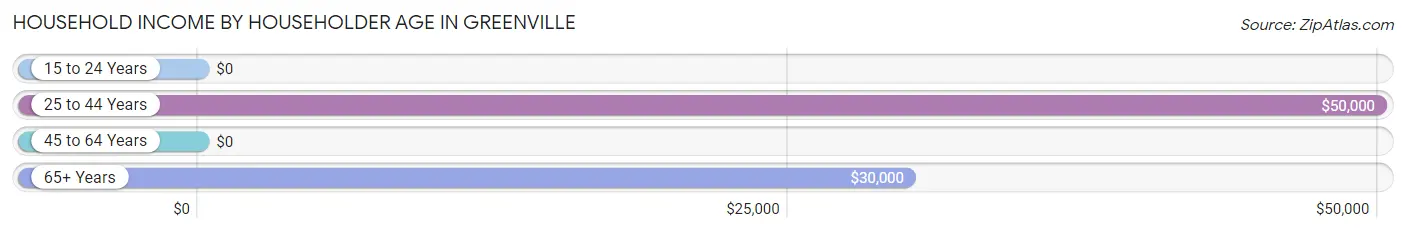
| Income Bracket | # Households | Median Income |
| 15 to 24 Years | 0 (0.0%) | $0 |
| 25 to 44 Years | 10 (40.0%) | $50,000 |
| 45 to 64 Years | 9 (36.0%) | $0 |
| 65+ Years | 6 (24.0%) | $30,000 |
| Total | 25 (100.0%) | $43,438 |
Poverty in Greenville
Income Below Poverty by Sex and Age in Greenville
With 15.2% poverty level for males and 8.0% for females among the residents of Greenville, 16 and 17 year old males and 35 to 44 year old females are the most vulnerable to poverty, with 2 males (100.0%) and 2 females (50.0%) in their respective age groups living below the poverty level.
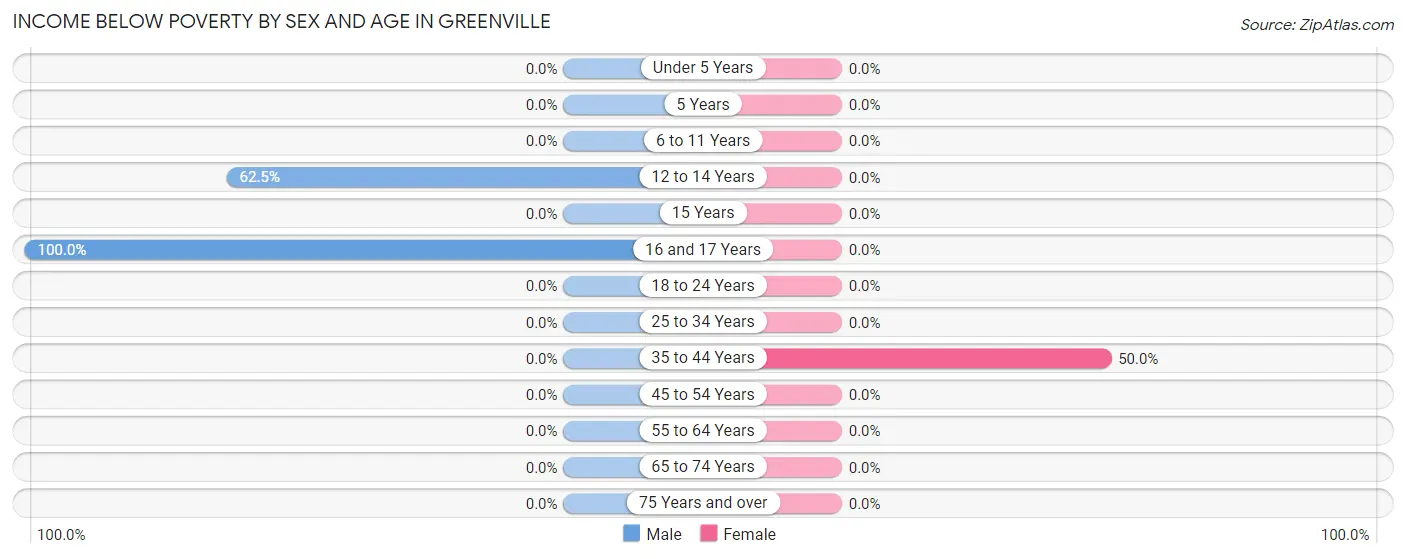
| Age Bracket | Male | Female |
| Under 5 Years | 0 (0.0%) | 0 (0.0%) |
| 5 Years | 0 (0.0%) | 0 (0.0%) |
| 6 to 11 Years | 0 (0.0%) | 0 (0.0%) |
| 12 to 14 Years | 5 (62.5%) | 0 (0.0%) |
| 15 Years | 0 (0.0%) | 0 (0.0%) |
| 16 and 17 Years | 2 (100.0%) | 0 (0.0%) |
| 18 to 24 Years | 0 (0.0%) | 0 (0.0%) |
| 25 to 34 Years | 0 (0.0%) | 0 (0.0%) |
| 35 to 44 Years | 0 (0.0%) | 2 (50.0%) |
| 45 to 54 Years | 0 (0.0%) | 0 (0.0%) |
| 55 to 64 Years | 0 (0.0%) | 0 (0.0%) |
| 65 to 74 Years | 0 (0.0%) | 0 (0.0%) |
| 75 Years and over | 0 (0.0%) | 0 (0.0%) |
| Total | 7 (15.2%) | 2 (8.0%) |
Income Above Poverty by Sex and Age in Greenville
According to the poverty statistics in Greenville, males aged under 5 years and females aged 6 to 11 years are the age groups that are most secure financially, with 100.0% of males and 100.0% of females in these age groups living above the poverty line.
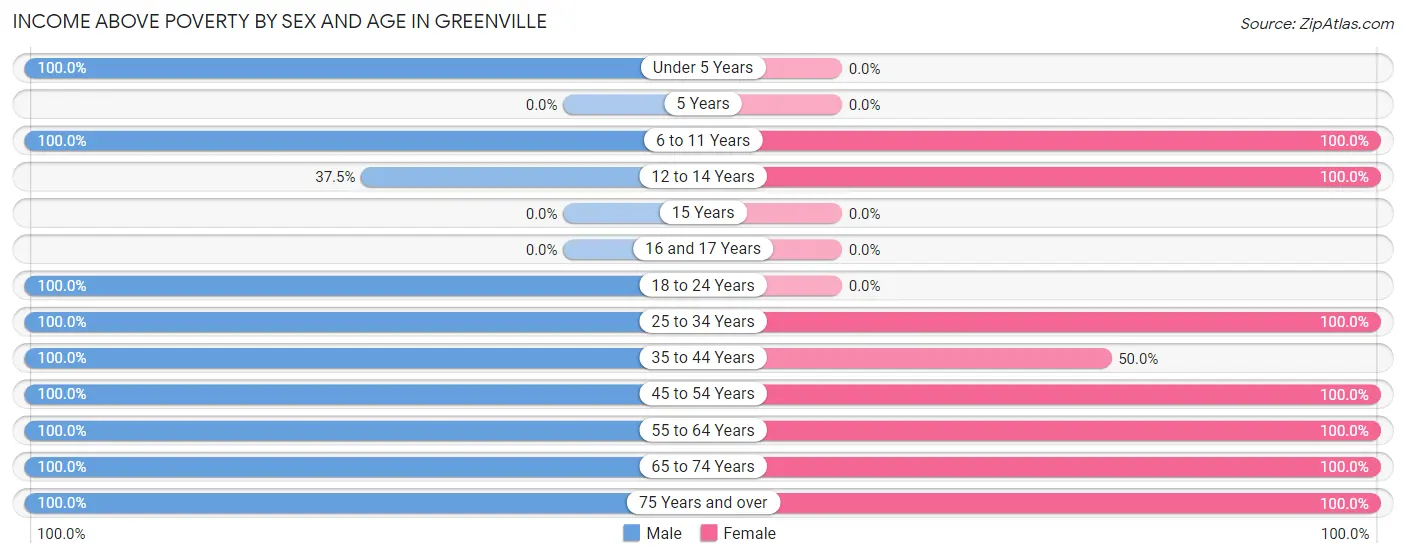
| Age Bracket | Male | Female |
| Under 5 Years | 11 (100.0%) | 0 (0.0%) |
| 5 Years | 0 (0.0%) | 0 (0.0%) |
| 6 to 11 Years | 2 (100.0%) | 4 (100.0%) |
| 12 to 14 Years | 3 (37.5%) | 1 (100.0%) |
| 15 Years | 0 (0.0%) | 0 (0.0%) |
| 16 and 17 Years | 0 (0.0%) | 0 (0.0%) |
| 18 to 24 Years | 3 (100.0%) | 0 (0.0%) |
| 25 to 34 Years | 7 (100.0%) | 5 (100.0%) |
| 35 to 44 Years | 2 (100.0%) | 2 (50.0%) |
| 45 to 54 Years | 2 (100.0%) | 1 (100.0%) |
| 55 to 64 Years | 7 (100.0%) | 4 (100.0%) |
| 65 to 74 Years | 1 (100.0%) | 2 (100.0%) |
| 75 Years and over | 1 (100.0%) | 4 (100.0%) |
| Total | 39 (84.8%) | 23 (92.0%) |
Income Below Poverty Among Married-Couple Families in Greenville
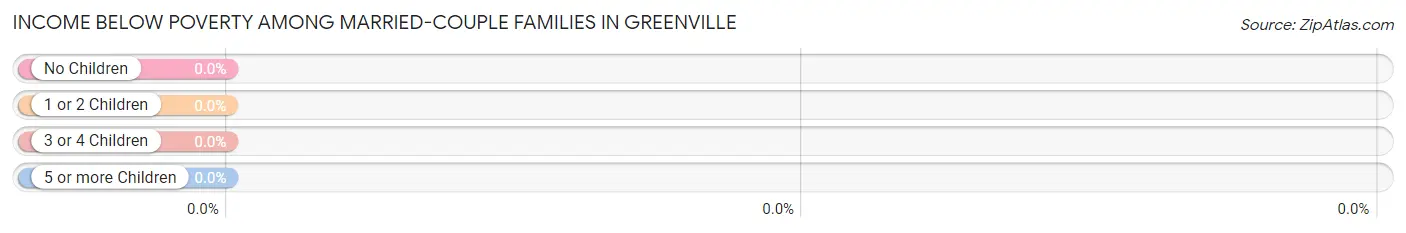
| Children | Above Poverty | Below Poverty |
| No Children | 6 (100.0%) | 0 (0.0%) |
| 1 or 2 Children | 6 (100.0%) | 0 (0.0%) |
| 3 or 4 Children | 1 (100.0%) | 0 (0.0%) |
| 5 or more Children | 0 (0.0%) | 0 (0.0%) |
| Total | 13 (100.0%) | 0 (0.0%) |
Income Below Poverty Among Single-Parent Households in Greenville
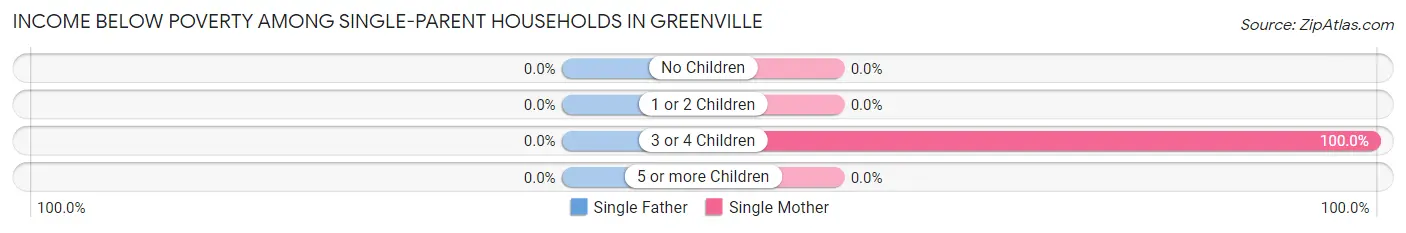
| Children | Single Father | Single Mother |
| No Children | 0 (0.0%) | 0 (0.0%) |
| 1 or 2 Children | 0 (0.0%) | 0 (0.0%) |
| 3 or 4 Children | 0 (0.0%) | 2 (100.0%) |
| 5 or more Children | 0 (0.0%) | 0 (0.0%) |
| Total | 0 (0.0%) | 2 (66.7%) |
Income Below Poverty Among Married-Couple vs Single-Parent Households in Greenville
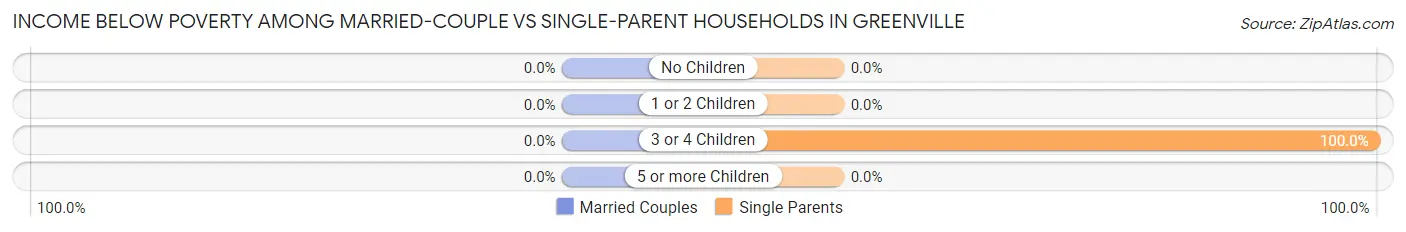
| Children | Married-Couple Families | Single-Parent Households |
| No Children | 0 (0.0%) | 0 (0.0%) |
| 1 or 2 Children | 0 (0.0%) | 0 (0.0%) |
| 3 or 4 Children | 0 (0.0%) | 2 (100.0%) |
| 5 or more Children | 0 (0.0%) | 0 (0.0%) |
| Total | 0 (0.0%) | 2 (66.7%) |
Race in Greenville
The most populous races in Greenville are White / Caucasian (63 | 88.7%), and Two or more Races (8 | 11.3%).
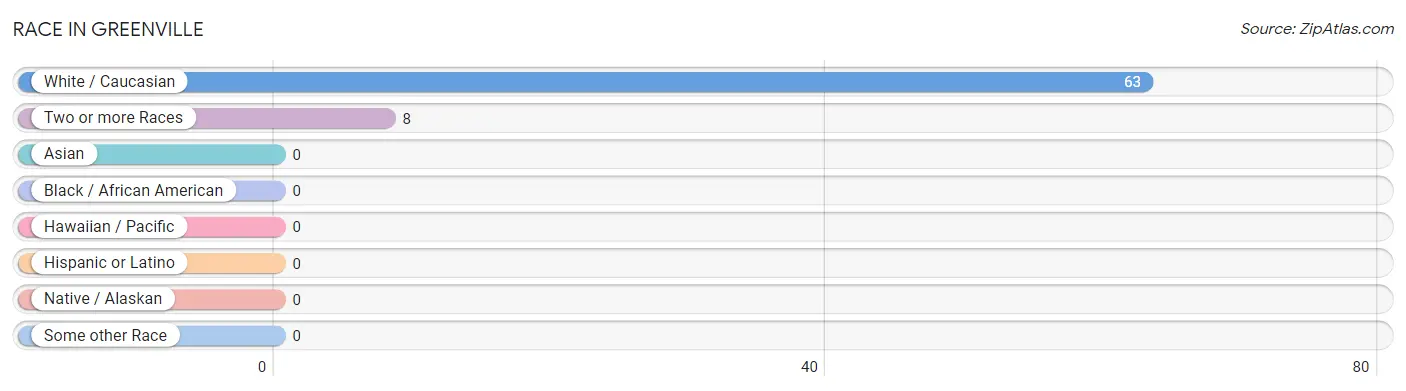
| Race | # Population | % Population |
| Asian | 0 | 0.0% |
| Black / African American | 0 | 0.0% |
| Hawaiian / Pacific | 0 | 0.0% |
| Hispanic or Latino | 0 | 0.0% |
| Native / Alaskan | 0 | 0.0% |
| White / Caucasian | 63 | 88.7% |
| Two or more Races | 8 | 11.3% |
| Some other Race | 0 | 0.0% |
| Total | 71 | 100.0% |
Ancestry in Greenville
The most populous ancestries reported in Greenville are German (3 | 4.2%), American (1 | 1.4%), Dutch (1 | 1.4%), English (1 | 1.4%), and Scotch-Irish (1 | 1.4%), together accounting for 9.9% of all Greenville residents.
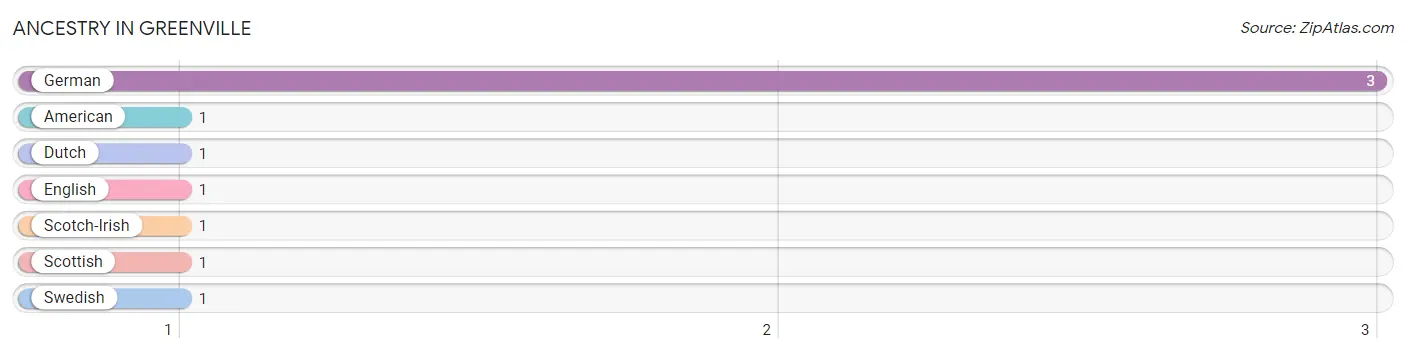
| Ancestry | # Population | % Population |
| American | 1 | 1.4% |
| Dutch | 1 | 1.4% |
| English | 1 | 1.4% |
| German | 3 | 4.2% |
| Scotch-Irish | 1 | 1.4% |
| Scottish | 1 | 1.4% |
| Swedish | 1 | 1.4% | View All 7 Rows |
Immigrants in Greenville

| Immigration Origin | # Population | % Population | View All 0 Rows |
Sex and Age in Greenville
Sex and Age in Greenville
The most populous age groups in Greenville are Under 5 Years (11 | 23.9%) for men and 25 to 29 Years (5 | 20.0%) for women.

| Age Bracket | Male | Female |
| Under 5 Years | 11 (23.9%) | 0 (0.0%) |
| 5 to 9 Years | 2 (4.3%) | 4 (16.0%) |
| 10 to 14 Years | 8 (17.4%) | 1 (4.0%) |
| 15 to 19 Years | 2 (4.3%) | 0 (0.0%) |
| 20 to 24 Years | 3 (6.5%) | 0 (0.0%) |
| 25 to 29 Years | 4 (8.7%) | 5 (20.0%) |
| 30 to 34 Years | 3 (6.5%) | 0 (0.0%) |
| 35 to 39 Years | 0 (0.0%) | 4 (16.0%) |
| 40 to 44 Years | 2 (4.3%) | 0 (0.0%) |
| 45 to 49 Years | 1 (2.2%) | 1 (4.0%) |
| 50 to 54 Years | 1 (2.2%) | 0 (0.0%) |
| 55 to 59 Years | 0 (0.0%) | 4 (16.0%) |
| 60 to 64 Years | 7 (15.2%) | 0 (0.0%) |
| 65 to 69 Years | 1 (2.2%) | 1 (4.0%) |
| 70 to 74 Years | 0 (0.0%) | 1 (4.0%) |
| 75 to 79 Years | 0 (0.0%) | 2 (8.0%) |
| 80 to 84 Years | 0 (0.0%) | 0 (0.0%) |
| 85 Years and over | 1 (2.2%) | 2 (8.0%) |
| Total | 46 (100.0%) | 25 (100.0%) |
Families and Households in Greenville
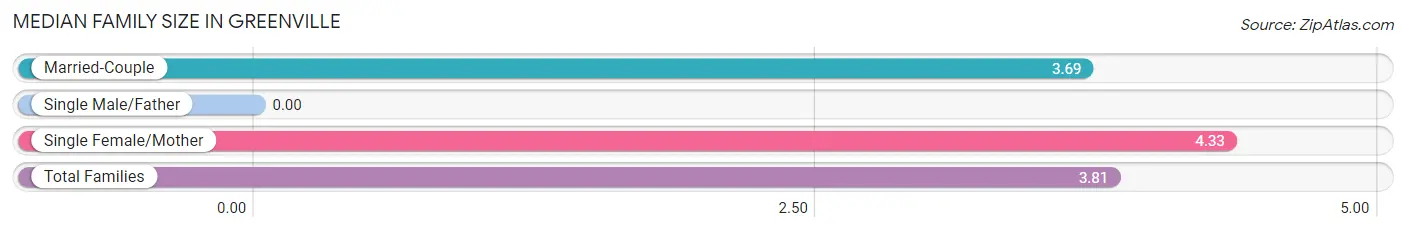
Median Family Size in Greenville
| Family Type | # Families | Family Size |
| Married-Couple | 13 (81.2%) | 3.69 |
| Single Male/Father | 0 (0.0%) | - |
| Single Female/Mother | 3 (18.8%) | 4.33 |
| Total Families | 16 (100.0%) | 3.81 |
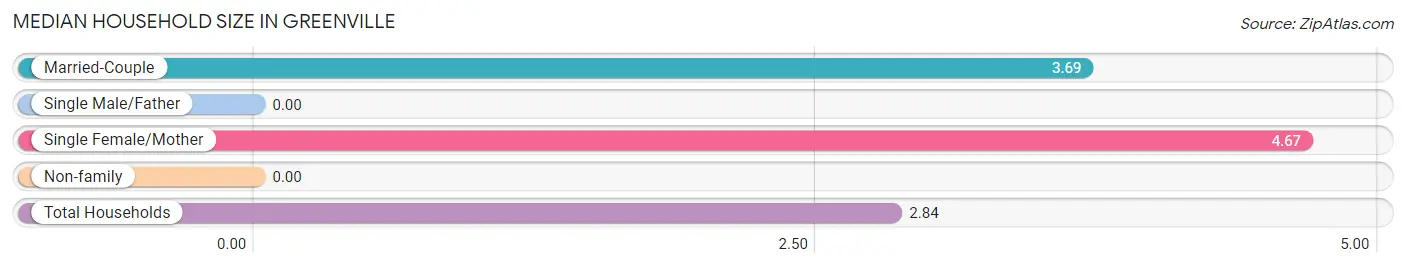
Median Household Size in Greenville
| Household Type | # Households | Household Size |
| Married-Couple | 13 (52.0%) | 3.69 |
| Single Male/Father | 0 (0.0%) | - |
| Single Female/Mother | 3 (12.0%) | 4.67 |
| Non-family | 9 (36.0%) | - |
| Total Households | 25 (100.0%) | 2.84 |
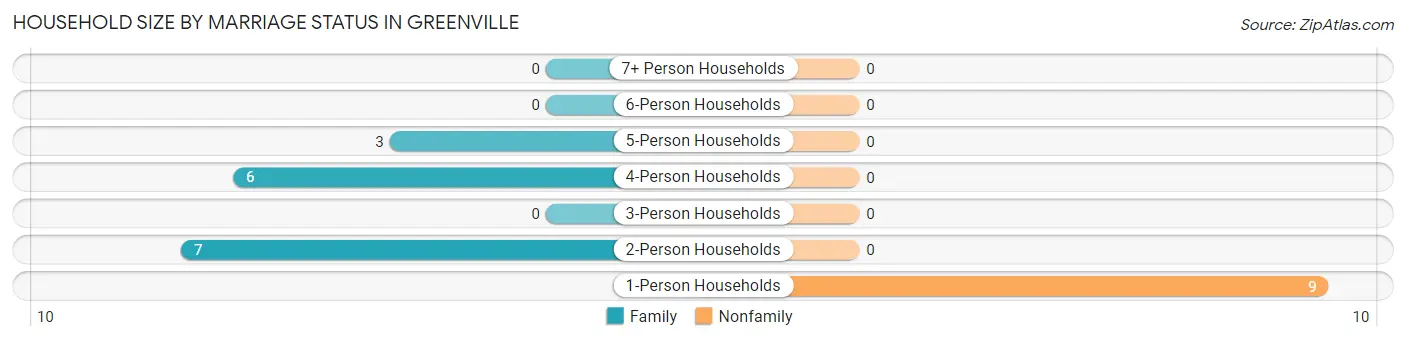
Household Size by Marriage Status in Greenville
Out of a total of 25 households in Greenville, 16 (64.0%) are family households, while 9 (36.0%) are nonfamily households. The most numerous type of family households are 2-person households, comprising 7, and the most common type of nonfamily households are 1-person households, comprising 9.
| Household Size | Family Households | Nonfamily Households |
| 1-Person Households | - | 9 (36.0%) |
| 2-Person Households | 7 (28.0%) | 0 (0.0%) |
| 3-Person Households | 0 (0.0%) | 0 (0.0%) |
| 4-Person Households | 6 (24.0%) | 0 (0.0%) |
| 5-Person Households | 3 (12.0%) | 0 (0.0%) |
| 6-Person Households | 0 (0.0%) | 0 (0.0%) |
| 7+ Person Households | 0 (0.0%) | 0 (0.0%) |
| Total | 16 (64.0%) | 9 (36.0%) |
Female Fertility in Greenville
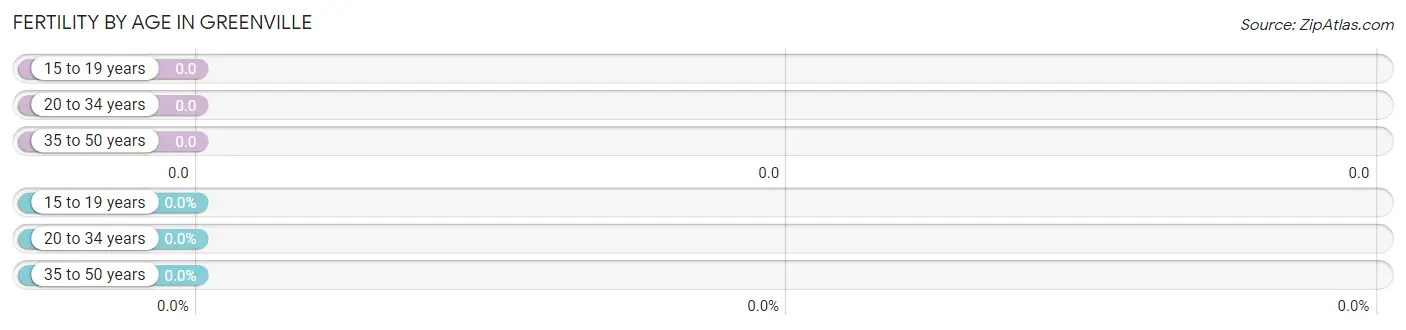
Fertility by Age in Greenville
| Age Bracket | Women with Births | Births / 1,000 Women |
| 15 to 19 years | 0 (0.0%) | 0.0 |
| 20 to 34 years | 0 (0.0%) | 0.0 |
| 35 to 50 years | 0 (0.0%) | 0.0 |
| Total | 0 (0.0%) | 0.0 |
Fertility by Age by Marriage Status in Greenville
| Age Bracket | Married | Unmarried |
| 15 to 19 years | 0 (0.0%) | 0 (0.0%) |
| 20 to 34 years | 0 (0.0%) | 0 (0.0%) |
| 35 to 50 years | 0 (0.0%) | 0 (0.0%) |
| Total | 0 (0.0%) | 0 (0.0%) |
Fertility by Education in Greenville
| Educational Attainment | Women with Births | Births / 1,000 Women |
| Less than High School | 0 (0.0%) | 0.0 |
| High School Diploma | 0 (0.0%) | 0.0 |
| College or Associate's Degree | 0 (0.0%) | 0.0 |
| Bachelor's Degree | 0 (0.0%) | 0.0 |
| Graduate Degree | 0 (0.0%) | 0.0 |
| Total | 0 (0.0%) | 0.0 |
Fertility by Education by Marriage Status in Greenville
| Educational Attainment | Married | Unmarried |
| Less than High School | 0 (0.0%) | 0 (0.0%) |
| High School Diploma | 0 (0.0%) | 0 (0.0%) |
| College or Associate's Degree | 0 (0.0%) | 0 (0.0%) |
| Bachelor's Degree | 0 (0.0%) | 0 (0.0%) |
| Graduate Degree | 0 (0.0%) | 0 (0.0%) |
| Total | 0 (0.0%) | 0 (0.0%) |
Employment Characteristics in Greenville
Employment by Class of Employer in Greenville
Among the 35 employed individuals in Greenville, private company employees (22 | 62.9%), self-employed (not incorporated) (6 | 17.1%), and local government employees (4 | 11.4%) make up the most common classes of employment.

| Employer Class | # Employees | % Employees |
| Private Company Employees | 22 | 62.9% |
| Self-Employed (Incorporated) | 1 | 2.9% |
| Self-Employed (Not Incorporated) | 6 | 17.1% |
| Not-for-profit Organizations | 1 | 2.9% |
| Local Government Employees | 4 | 11.4% |
| State Government Employees | 1 | 2.9% |
| Federal Government Employees | 0 | 0.0% |
| Unpaid Family Workers | 0 | 0.0% |
| Total | 35 | 100.0% |
Employment Status by Age in Greenville
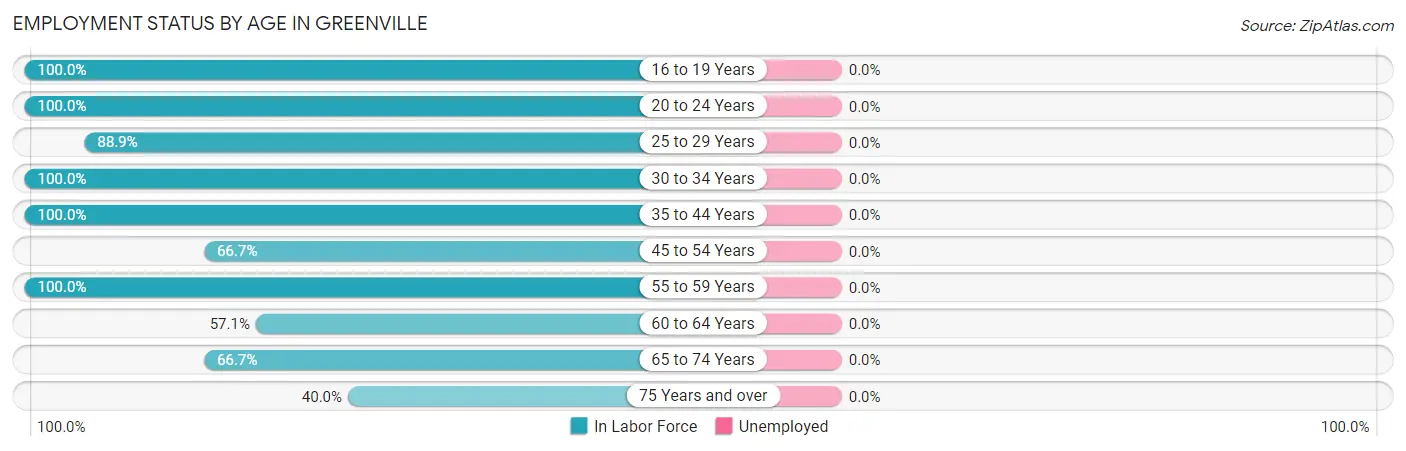
| Age Bracket | In Labor Force | Unemployed |
| 16 to 19 Years | 2 (100.0%) | 0 (0.0%) |
| 20 to 24 Years | 3 (100.0%) | 0 (0.0%) |
| 25 to 29 Years | 8 (88.9%) | 0 (0.0%) |
| 30 to 34 Years | 3 (100.0%) | 0 (0.0%) |
| 35 to 44 Years | 6 (100.0%) | 0 (0.0%) |
| 45 to 54 Years | 2 (66.7%) | 0 (0.0%) |
| 55 to 59 Years | 4 (100.0%) | 0 (0.0%) |
| 60 to 64 Years | 4 (57.1%) | 0 (0.0%) |
| 65 to 74 Years | 2 (66.7%) | 0 (0.0%) |
| 75 Years and over | 2 (40.0%) | 0 (0.0%) |
| Total | 36 (80.0%) | 0 (0.0%) |
Employment Status by Educational Attainment in Greenville
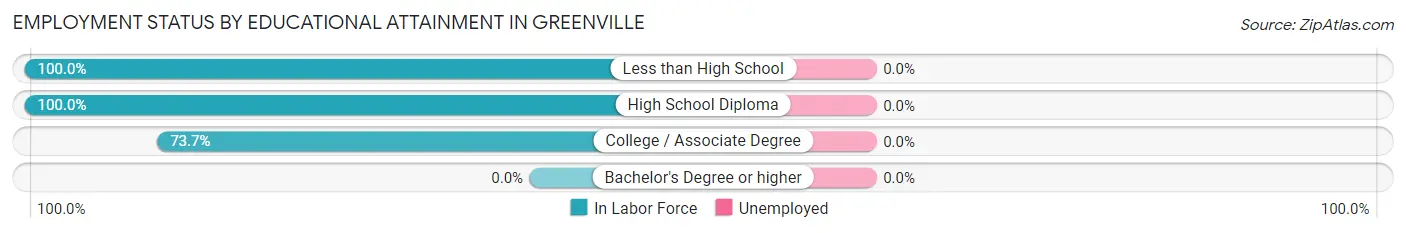
| Educational Attainment | In Labor Force | Unemployed |
| Less than High School | 5 (100.0%) | 0 (0.0%) |
| High School Diploma | 8 (100.0%) | 0 (0.0%) |
| College / Associate Degree | 14 (73.7%) | 0 (0.0%) |
| Bachelor's Degree or higher | 0 (0.0%) | 0 (0.0%) |
| Total | 27 (84.4%) | 0 (0.0%) |
Employment Occupations by Sex in Greenville
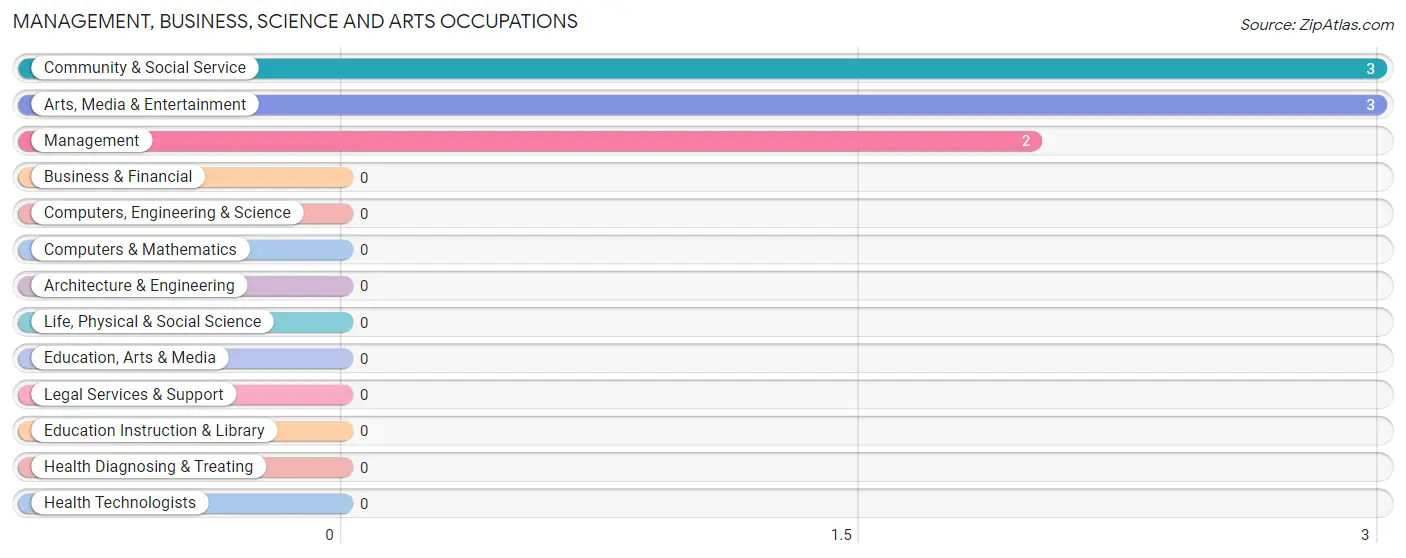
Management, Business, Science and Arts Occupations
The most common Management, Business, Science and Arts occupations in Greenville are Community & Social Service (3 | 8.3%), Arts, Media & Entertainment (3 | 8.3%), and Management (2 | 5.6%).
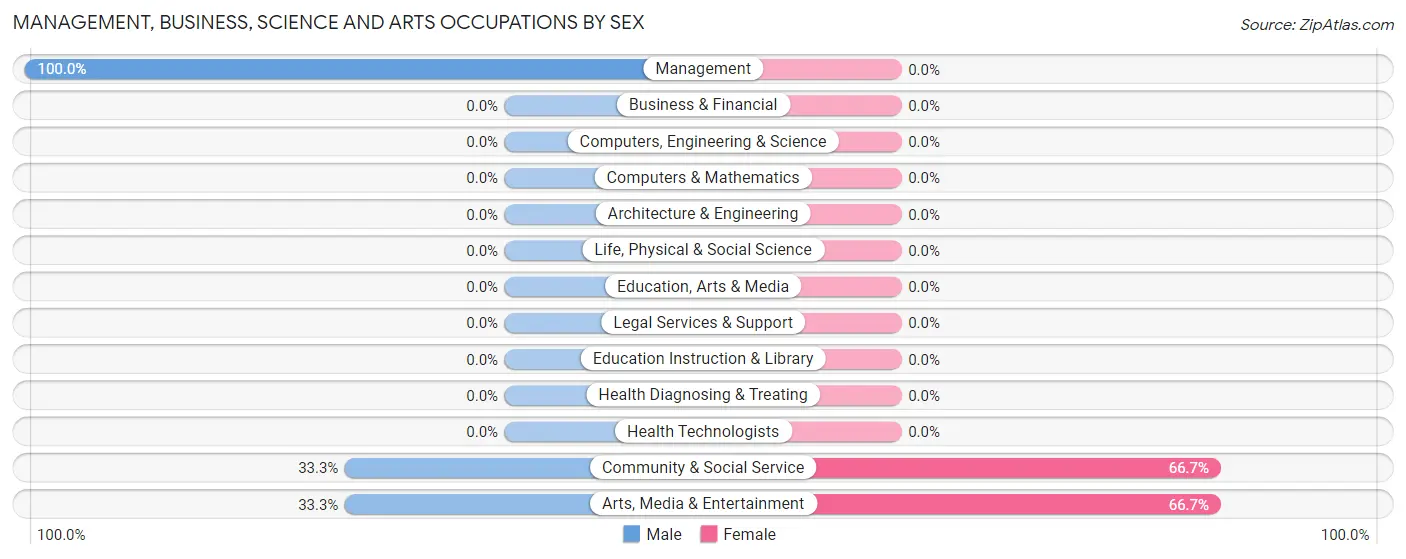
Management, Business, Science and Arts Occupations by Sex
Within the Management, Business, Science and Arts occupations in Greenville, the most male-oriented occupations are Management (100.0%), Community & Social Service (33.3%), and Arts, Media & Entertainment (33.3%), while the most female-oriented occupations are Community & Social Service (66.7%), and Arts, Media & Entertainment (66.7%).
| Occupation | Male | Female |
| Management | 2 (100.0%) | 0 (0.0%) |
| Business & Financial | 0 (0.0%) | 0 (0.0%) |
| Computers, Engineering & Science | 0 (0.0%) | 0 (0.0%) |
| Computers & Mathematics | 0 (0.0%) | 0 (0.0%) |
| Architecture & Engineering | 0 (0.0%) | 0 (0.0%) |
| Life, Physical & Social Science | 0 (0.0%) | 0 (0.0%) |
| Community & Social Service | 1 (33.3%) | 2 (66.7%) |
| Education, Arts & Media | 0 (0.0%) | 0 (0.0%) |
| Legal Services & Support | 0 (0.0%) | 0 (0.0%) |
| Education Instruction & Library | 0 (0.0%) | 0 (0.0%) |
| Arts, Media & Entertainment | 1 (33.3%) | 2 (66.7%) |
| Health Diagnosing & Treating | 0 (0.0%) | 0 (0.0%) |
| Health Technologists | 0 (0.0%) | 0 (0.0%) |
| Total (Category) | 3 (60.0%) | 2 (40.0%) |
| Total (Overall) | 21 (58.3%) | 15 (41.7%) |
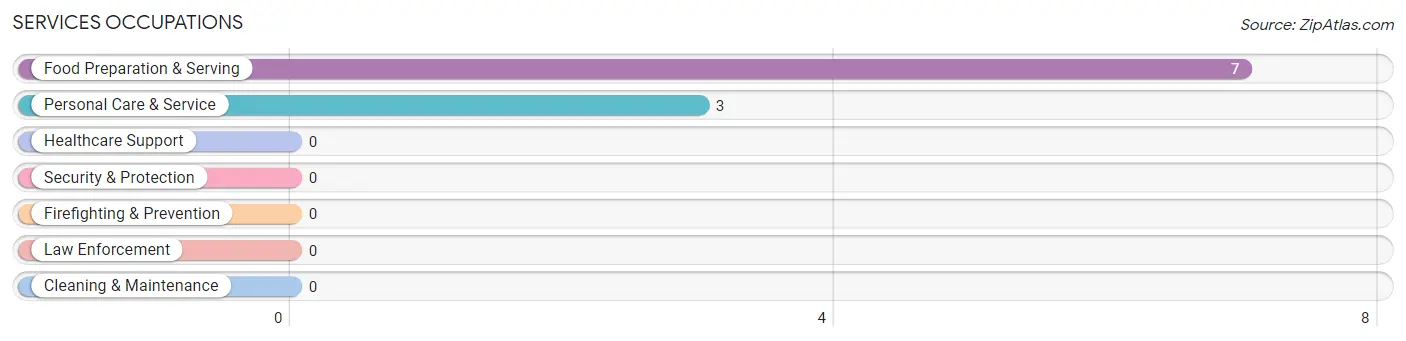
Services Occupations
The most common Services occupations in Greenville are Food Preparation & Serving (7 | 19.4%), and Personal Care & Service (3 | 8.3%).
Services Occupations by Sex
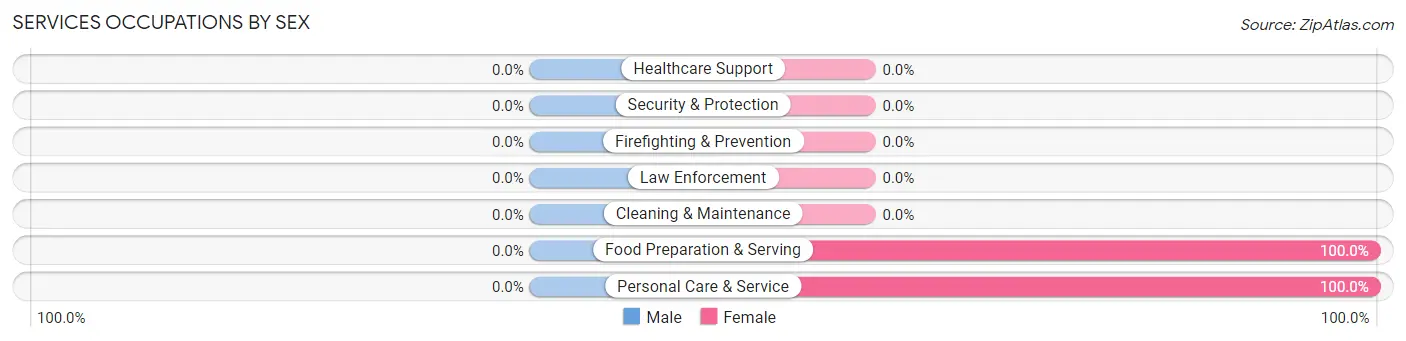
| Occupation | Male | Female |
| Healthcare Support | 0 (0.0%) | 0 (0.0%) |
| Security & Protection | 0 (0.0%) | 0 (0.0%) |
| Firefighting & Prevention | 0 (0.0%) | 0 (0.0%) |
| Law Enforcement | 0 (0.0%) | 0 (0.0%) |
| Food Preparation & Serving | 0 (0.0%) | 7 (100.0%) |
| Cleaning & Maintenance | 0 (0.0%) | 0 (0.0%) |
| Personal Care & Service | 0 (0.0%) | 3 (100.0%) |
| Total (Category) | 0 (0.0%) | 10 (100.0%) |
| Total (Overall) | 21 (58.3%) | 15 (41.7%) |
Sales and Office Occupations
The most common Sales and Office occupations in Greenville are Sales & Related (7 | 19.4%), and Office & Administration (3 | 8.3%).

Sales and Office Occupations by Sex
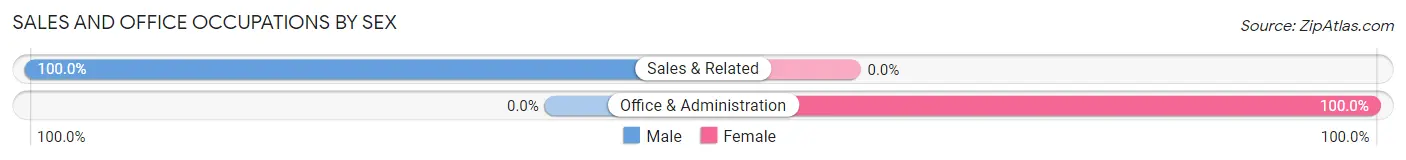
| Occupation | Male | Female |
| Sales & Related | 7 (100.0%) | 0 (0.0%) |
| Office & Administration | 0 (0.0%) | 3 (100.0%) |
| Total (Category) | 7 (70.0%) | 3 (30.0%) |
| Total (Overall) | 21 (58.3%) | 15 (41.7%) |
Natural Resources, Construction and Maintenance Occupations

Natural Resources, Construction and Maintenance Occupations by Sex
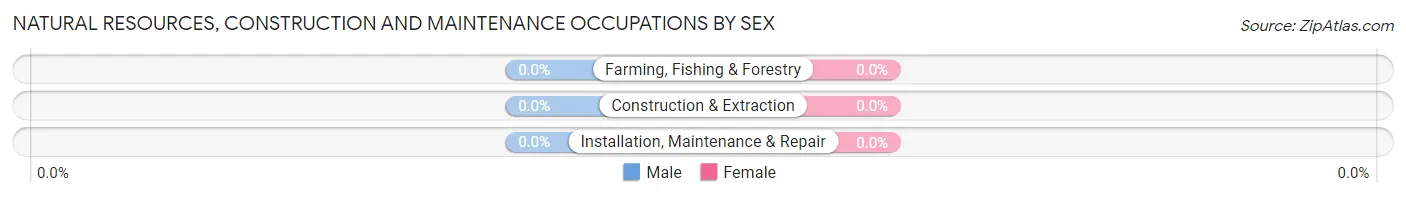
| Occupation | Male | Female |
| Farming, Fishing & Forestry | 0 (0.0%) | 0 (0.0%) |
| Construction & Extraction | 0 (0.0%) | 0 (0.0%) |
| Installation, Maintenance & Repair | 0 (0.0%) | 0 (0.0%) |
| Total (Category) | 0 (0.0%) | 0 (0.0%) |
| Total (Overall) | 21 (58.3%) | 15 (41.7%) |
Production, Transportation and Moving Occupations
The most common Production, Transportation and Moving occupations in Greenville are Transportation (6 | 16.7%), and Material Moving (5 | 13.9%).
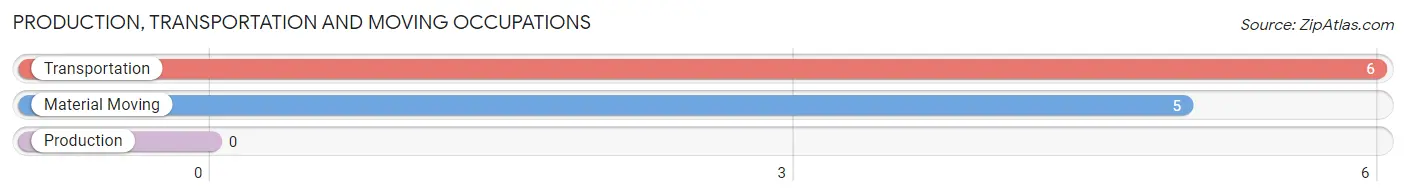
Production, Transportation and Moving Occupations by Sex
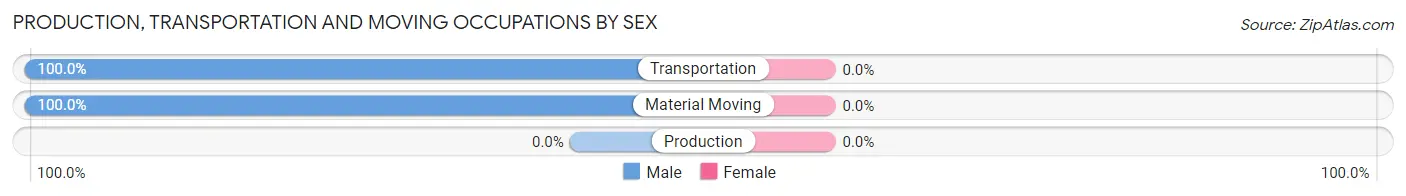
| Occupation | Male | Female |
| Production | 0 (0.0%) | 0 (0.0%) |
| Transportation | 6 (100.0%) | 0 (0.0%) |
| Material Moving | 5 (100.0%) | 0 (0.0%) |
| Total (Category) | 11 (100.0%) | 0 (0.0%) |
| Total (Overall) | 21 (58.3%) | 15 (41.7%) |
Employment Industries by Sex in Greenville
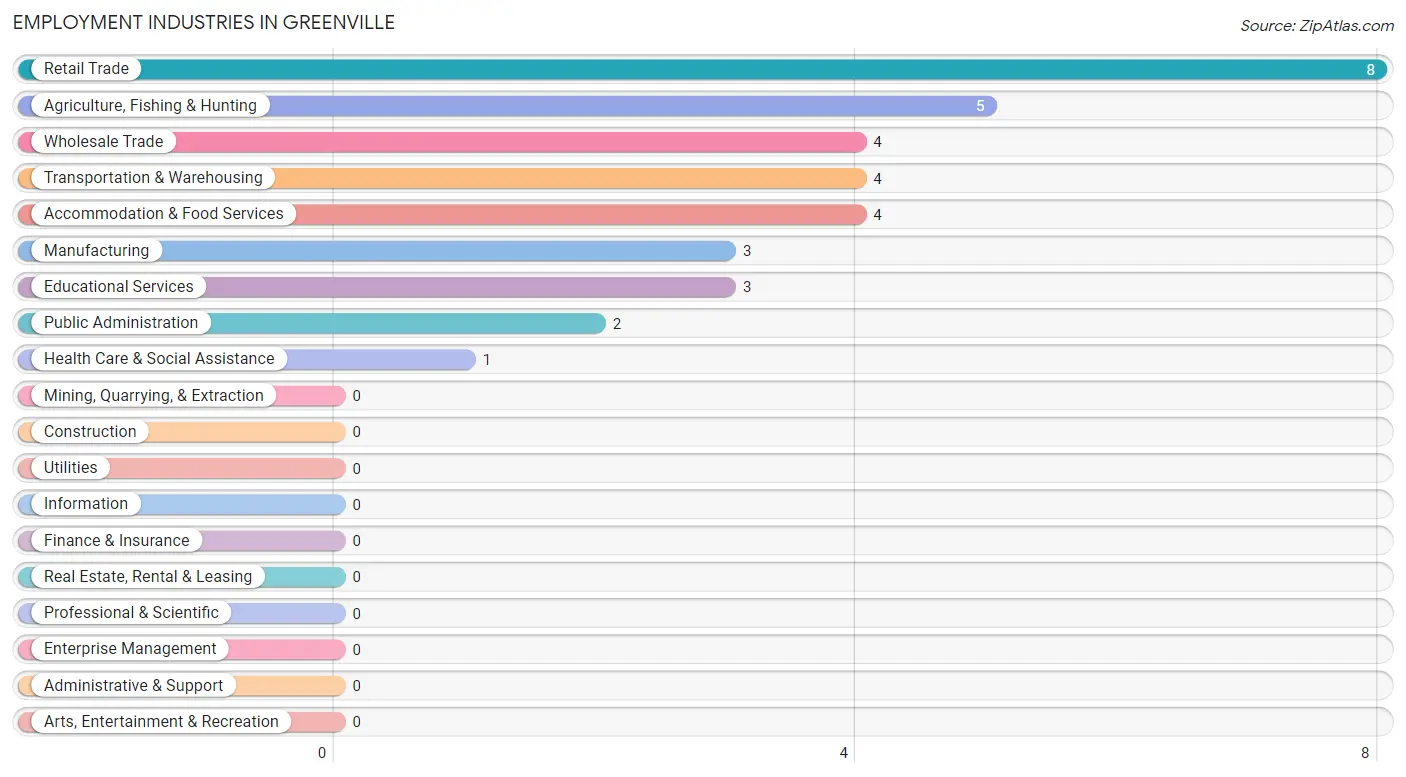
Employment Industries in Greenville
The major employment industries in Greenville include Retail Trade (8 | 22.2%), Agriculture, Fishing & Hunting (5 | 13.9%), Wholesale Trade (4 | 11.1%), Transportation & Warehousing (4 | 11.1%), and Accommodation & Food Services (4 | 11.1%).
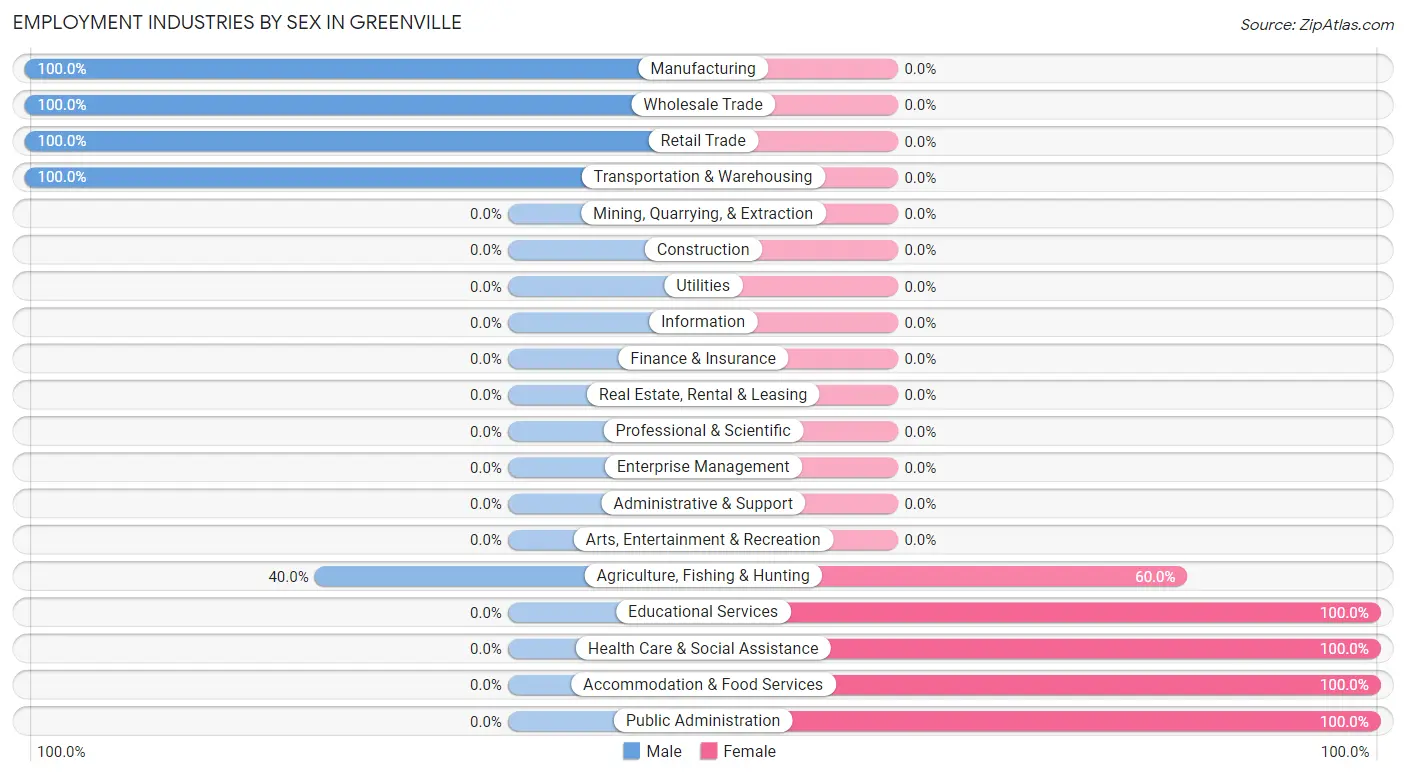
Employment Industries by Sex in Greenville
The Greenville industries that see more men than women are Manufacturing (100.0%), Wholesale Trade (100.0%), and Retail Trade (100.0%), whereas the industries that tend to have a higher number of women are Educational Services (100.0%), Health Care & Social Assistance (100.0%), and Accommodation & Food Services (100.0%).
| Industry | Male | Female |
| Agriculture, Fishing & Hunting | 2 (40.0%) | 3 (60.0%) |
| Mining, Quarrying, & Extraction | 0 (0.0%) | 0 (0.0%) |
| Construction | 0 (0.0%) | 0 (0.0%) |
| Manufacturing | 3 (100.0%) | 0 (0.0%) |
| Wholesale Trade | 4 (100.0%) | 0 (0.0%) |
| Retail Trade | 8 (100.0%) | 0 (0.0%) |
| Transportation & Warehousing | 4 (100.0%) | 0 (0.0%) |
| Utilities | 0 (0.0%) | 0 (0.0%) |
| Information | 0 (0.0%) | 0 (0.0%) |
| Finance & Insurance | 0 (0.0%) | 0 (0.0%) |
| Real Estate, Rental & Leasing | 0 (0.0%) | 0 (0.0%) |
| Professional & Scientific | 0 (0.0%) | 0 (0.0%) |
| Enterprise Management | 0 (0.0%) | 0 (0.0%) |
| Administrative & Support | 0 (0.0%) | 0 (0.0%) |
| Educational Services | 0 (0.0%) | 3 (100.0%) |
| Health Care & Social Assistance | 0 (0.0%) | 1 (100.0%) |
| Arts, Entertainment & Recreation | 0 (0.0%) | 0 (0.0%) |
| Accommodation & Food Services | 0 (0.0%) | 4 (100.0%) |
| Public Administration | 0 (0.0%) | 2 (100.0%) |
| Total | 21 (58.3%) | 15 (41.7%) |
Education in Greenville
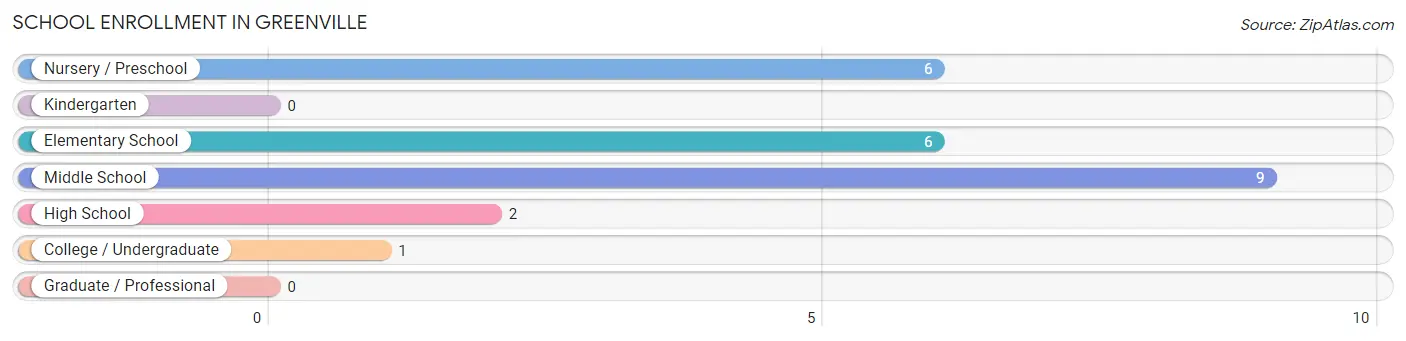
School Enrollment in Greenville
The most common levels of schooling among the 24 students in Greenville are middle school (9 | 37.5%), nursery / preschool (6 | 25.0%), and elementary school (6 | 25.0%).
| School Level | # Students | % Students |
| Nursery / Preschool | 6 | 25.0% |
| Kindergarten | 0 | 0.0% |
| Elementary School | 6 | 25.0% |
| Middle School | 9 | 37.5% |
| High School | 2 | 8.3% |
| College / Undergraduate | 1 | 4.2% |
| Graduate / Professional | 0 | 0.0% |
| Total | 24 | 100.0% |
School Enrollment by Age by Funding Source in Greenville
Out of a total of 24 students who are enrolled in schools in Greenville, 7 (29.2%) attend a private institution, while the remaining 17 (70.8%) are enrolled in public schools. The age group of 5 to 9 year old has the highest likelihood of being enrolled in private schools, with 6 (100.0% in the age bracket) enrolled. Conversely, the age group of 3 to 4 year olds has the lowest likelihood of being enrolled in a private school, with 6 (100.0% in the age bracket) attending a public institution.
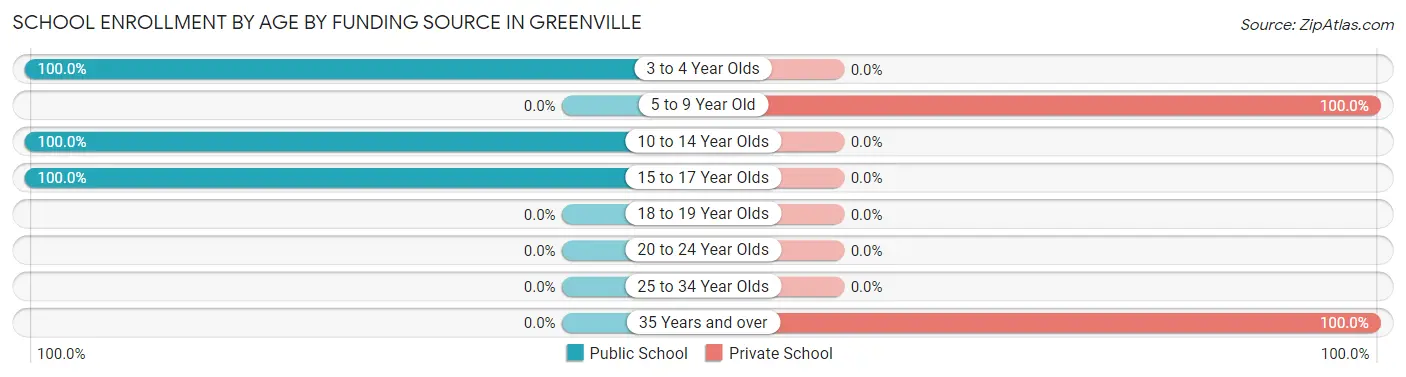
| Age Bracket | Public School | Private School |
| 3 to 4 Year Olds | 6 (100.0%) | 0 (0.0%) |
| 5 to 9 Year Old | 0 (0.0%) | 6 (100.0%) |
| 10 to 14 Year Olds | 9 (100.0%) | 0 (0.0%) |
| 15 to 17 Year Olds | 2 (100.0%) | 0 (0.0%) |
| 18 to 19 Year Olds | 0 (0.0%) | 0 (0.0%) |
| 20 to 24 Year Olds | 0 (0.0%) | 0 (0.0%) |
| 25 to 34 Year Olds | 0 (0.0%) | 0 (0.0%) |
| 35 Years and over | 0 (0.0%) | 1 (100.0%) |
| Total | 17 (70.8%) | 7 (29.2%) |
Educational Attainment by Field of Study in Greenville
, and education (1 | 100.0%) are the most common fields of study among 1 individuals in Greenville who have obtained a bachelor's degree or higher.
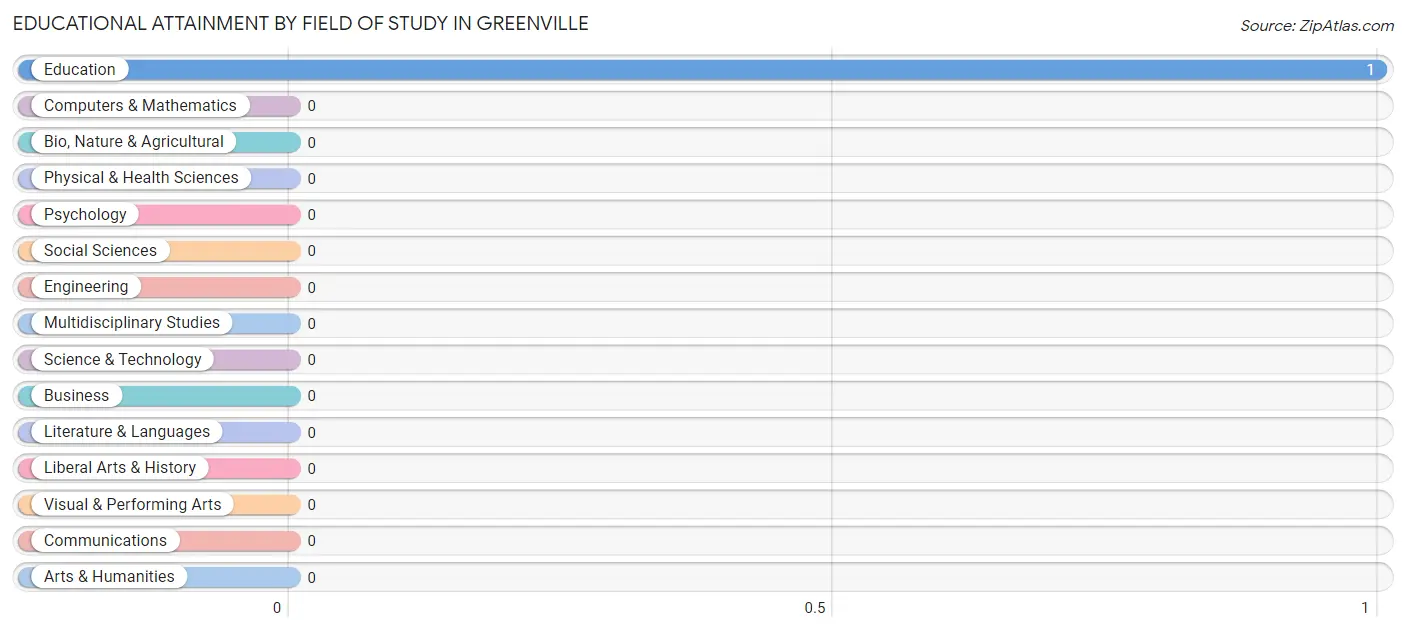
| Field of Study | # Graduates | % Graduates |
| Computers & Mathematics | 0 | 0.0% |
| Bio, Nature & Agricultural | 0 | 0.0% |
| Physical & Health Sciences | 0 | 0.0% |
| Psychology | 0 | 0.0% |
| Social Sciences | 0 | 0.0% |
| Engineering | 0 | 0.0% |
| Multidisciplinary Studies | 0 | 0.0% |
| Science & Technology | 0 | 0.0% |
| Business | 0 | 0.0% |
| Education | 1 | 100.0% |
| Literature & Languages | 0 | 0.0% |
| Liberal Arts & History | 0 | 0.0% |
| Visual & Performing Arts | 0 | 0.0% |
| Communications | 0 | 0.0% |
| Arts & Humanities | 0 | 0.0% |
| Total | 1 | 100.0% |
Transportation & Commute in Greenville
Vehicle Availability by Sex in Greenville
The most prevalent vehicle ownership categories in Greenville are males with 1 vehicle (6, accounting for 30.0%) and females with 1 vehicle (0, making up 40.0%).
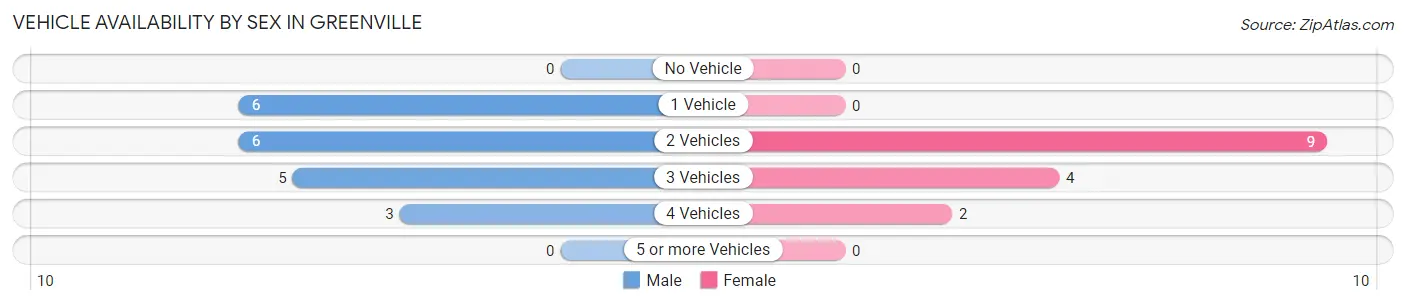
| Vehicles Available | Male | Female |
| No Vehicle | 0 (0.0%) | 0 (0.0%) |
| 1 Vehicle | 6 (30.0%) | 0 (0.0%) |
| 2 Vehicles | 6 (30.0%) | 9 (60.0%) |
| 3 Vehicles | 5 (25.0%) | 4 (26.7%) |
| 4 Vehicles | 3 (15.0%) | 2 (13.3%) |
| 5 or more Vehicles | 0 (0.0%) | 0 (0.0%) |
| Total | 20 (100.0%) | 15 (100.0%) |
Commute Time in Greenville
The most frequently occuring commute durations in Greenville are 15 to 19 minutes (14 commuters, 40.0%), 20 to 24 minutes (9 commuters, 25.7%), and 25 to 29 minutes (4 commuters, 11.4%).
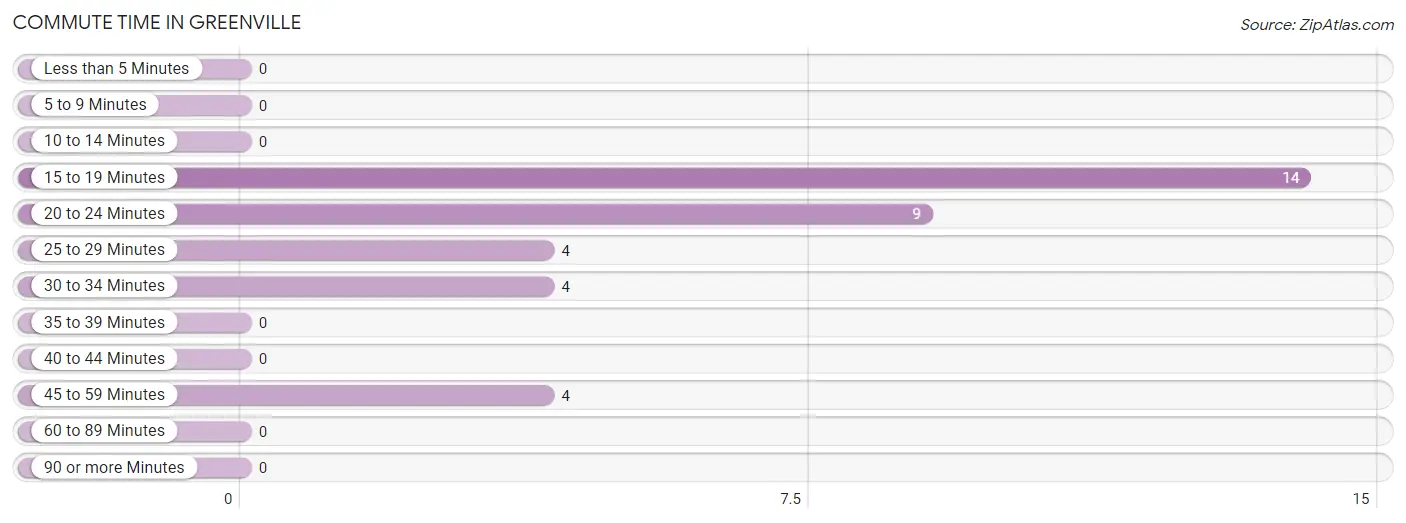
| Commute Time | # Commuters | % Commuters |
| Less than 5 Minutes | 0 | 0.0% |
| 5 to 9 Minutes | 0 | 0.0% |
| 10 to 14 Minutes | 0 | 0.0% |
| 15 to 19 Minutes | 14 | 40.0% |
| 20 to 24 Minutes | 9 | 25.7% |
| 25 to 29 Minutes | 4 | 11.4% |
| 30 to 34 Minutes | 4 | 11.4% |
| 35 to 39 Minutes | 0 | 0.0% |
| 40 to 44 Minutes | 0 | 0.0% |
| 45 to 59 Minutes | 4 | 11.4% |
| 60 to 89 Minutes | 0 | 0.0% |
| 90 or more Minutes | 0 | 0.0% |
Commute Time by Sex in Greenville
The most common commute times in Greenville are 15 to 19 minutes (7 commuters, 35.0%) for males and 15 to 19 minutes (7 commuters, 46.7%) for females.
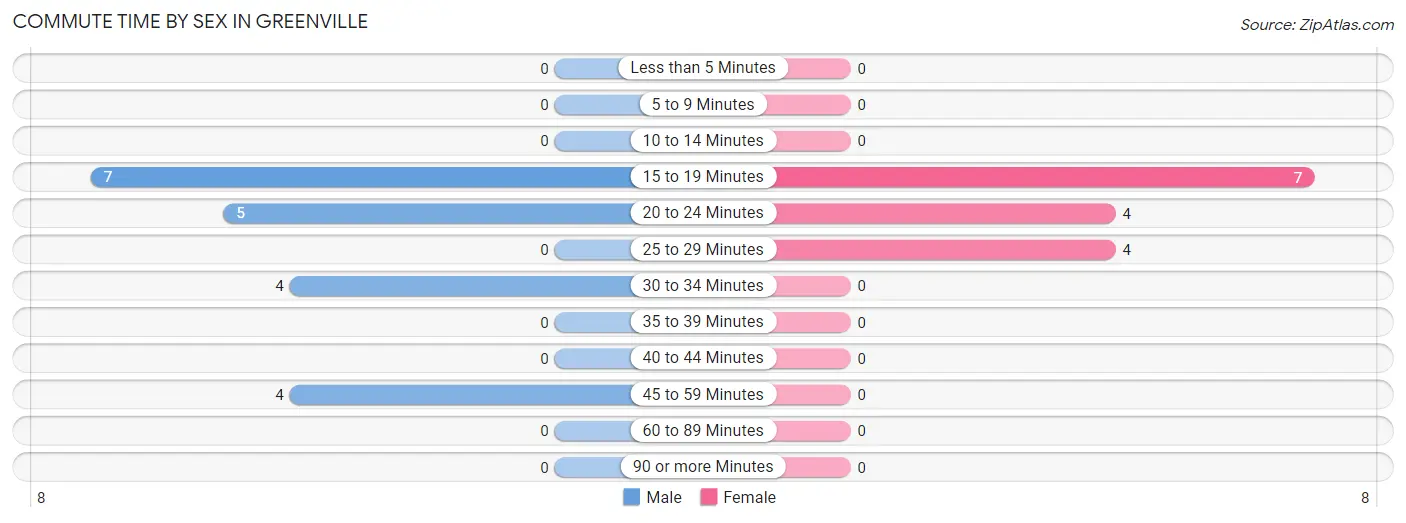
| Commute Time | Male | Female |
| Less than 5 Minutes | 0 (0.0%) | 0 (0.0%) |
| 5 to 9 Minutes | 0 (0.0%) | 0 (0.0%) |
| 10 to 14 Minutes | 0 (0.0%) | 0 (0.0%) |
| 15 to 19 Minutes | 7 (35.0%) | 7 (46.7%) |
| 20 to 24 Minutes | 5 (25.0%) | 4 (26.7%) |
| 25 to 29 Minutes | 0 (0.0%) | 4 (26.7%) |
| 30 to 34 Minutes | 4 (20.0%) | 0 (0.0%) |
| 35 to 39 Minutes | 0 (0.0%) | 0 (0.0%) |
| 40 to 44 Minutes | 0 (0.0%) | 0 (0.0%) |
| 45 to 59 Minutes | 4 (20.0%) | 0 (0.0%) |
| 60 to 89 Minutes | 0 (0.0%) | 0 (0.0%) |
| 90 or more Minutes | 0 (0.0%) | 0 (0.0%) |
Time of Departure to Work by Sex in Greenville
The most frequent times of departure to work in Greenville are 12:00 AM to 4:59 AM (4, 20.0%) for males and 7:30 AM to 7:59 AM (4, 26.7%) for females.
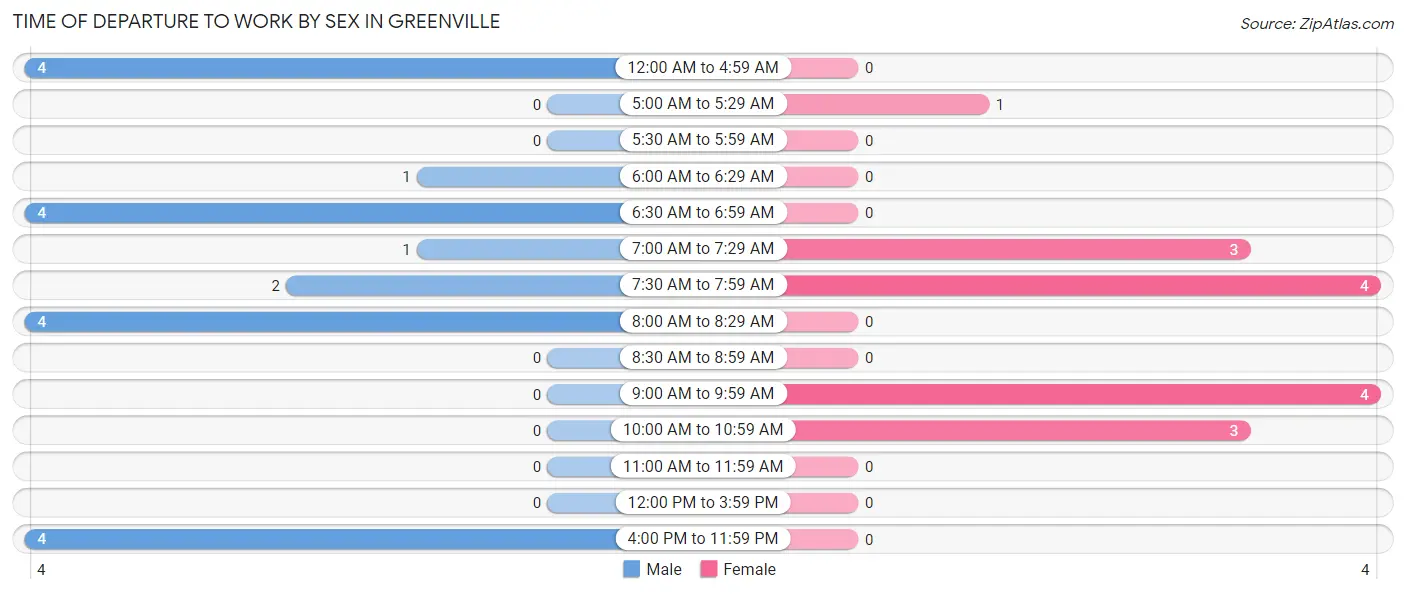
| Time of Departure | Male | Female |
| 12:00 AM to 4:59 AM | 4 (20.0%) | 0 (0.0%) |
| 5:00 AM to 5:29 AM | 0 (0.0%) | 1 (6.7%) |
| 5:30 AM to 5:59 AM | 0 (0.0%) | 0 (0.0%) |
| 6:00 AM to 6:29 AM | 1 (5.0%) | 0 (0.0%) |
| 6:30 AM to 6:59 AM | 4 (20.0%) | 0 (0.0%) |
| 7:00 AM to 7:29 AM | 1 (5.0%) | 3 (20.0%) |
| 7:30 AM to 7:59 AM | 2 (10.0%) | 4 (26.7%) |
| 8:00 AM to 8:29 AM | 4 (20.0%) | 0 (0.0%) |
| 8:30 AM to 8:59 AM | 0 (0.0%) | 0 (0.0%) |
| 9:00 AM to 9:59 AM | 0 (0.0%) | 4 (26.7%) |
| 10:00 AM to 10:59 AM | 0 (0.0%) | 3 (20.0%) |
| 11:00 AM to 11:59 AM | 0 (0.0%) | 0 (0.0%) |
| 12:00 PM to 3:59 PM | 0 (0.0%) | 0 (0.0%) |
| 4:00 PM to 11:59 PM | 4 (20.0%) | 0 (0.0%) |
| Total | 20 (100.0%) | 15 (100.0%) |
Housing Occupancy in Greenville
Occupancy by Ownership in Greenville
Of the total 25 dwellings in Greenville, owner-occupied units account for 23 (92.0%), while renter-occupied units make up 2 (8.0%).
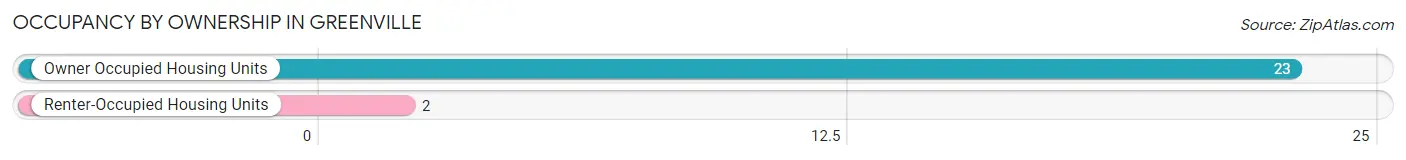
| Occupancy | # Housing Units | % Housing Units |
| Owner Occupied Housing Units | 23 | 92.0% |
| Renter-Occupied Housing Units | 2 | 8.0% |
| Total Occupied Housing Units | 25 | 100.0% |
Occupancy by Household Size in Greenville
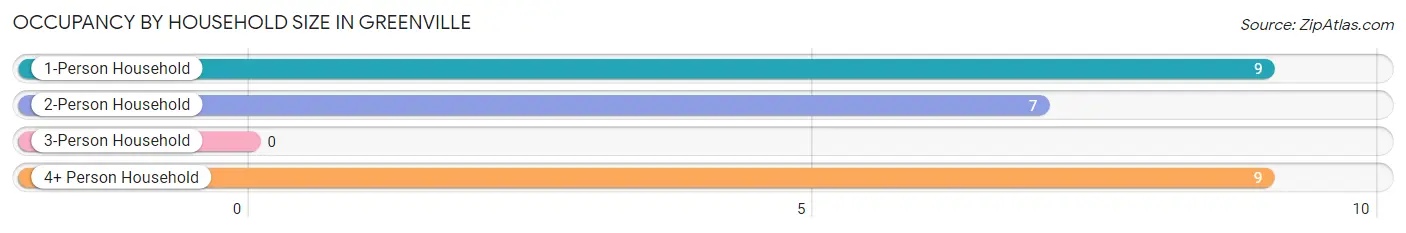
| Household Size | # Housing Units | % Housing Units |
| 1-Person Household | 9 | 36.0% |
| 2-Person Household | 7 | 28.0% |
| 3-Person Household | 0 | 0.0% |
| 4+ Person Household | 9 | 36.0% |
| Total Housing Units | 25 | 100.0% |
Occupancy by Ownership by Household Size in Greenville
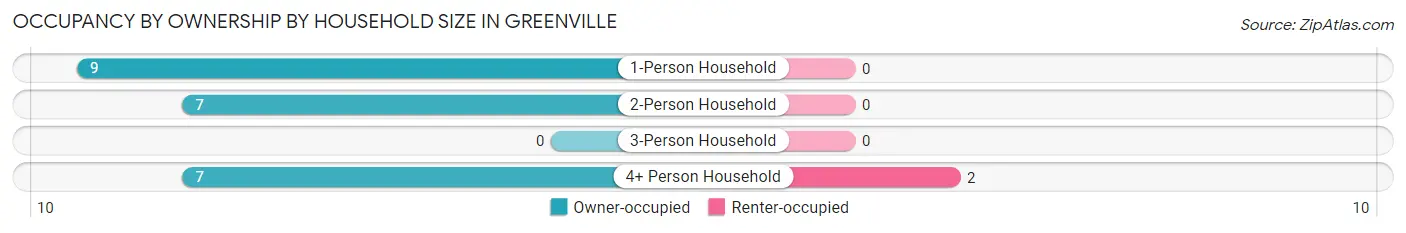
| Household Size | Owner-occupied | Renter-occupied |
| 1-Person Household | 9 (100.0%) | 0 (0.0%) |
| 2-Person Household | 7 (100.0%) | 0 (0.0%) |
| 3-Person Household | 0 (0.0%) | 0 (0.0%) |
| 4+ Person Household | 7 (77.8%) | 2 (22.2%) |
| Total Housing Units | 23 (92.0%) | 2 (8.0%) |
Occupancy by Educational Attainment in Greenville
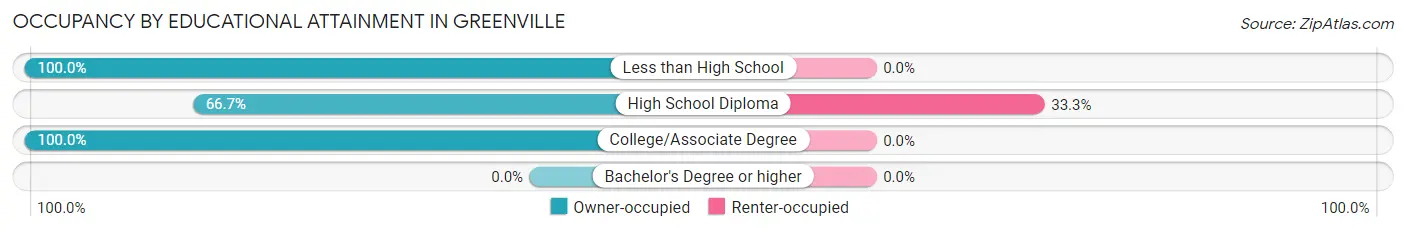
| Household Size | Owner-occupied | Renter-occupied |
| Less than High School | 6 (100.0%) | 0 (0.0%) |
| High School Diploma | 4 (66.7%) | 2 (33.3%) |
| College/Associate Degree | 13 (100.0%) | 0 (0.0%) |
| Bachelor's Degree or higher | 0 (0.0%) | 0 (0.0%) |
Occupancy by Age of Householder in Greenville
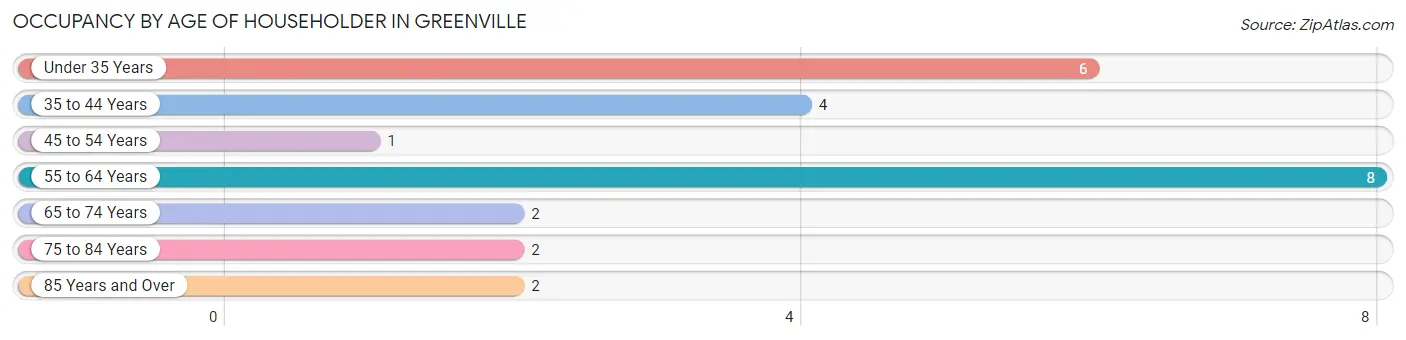
| Age Bracket | # Households | % Households |
| Under 35 Years | 6 | 24.0% |
| 35 to 44 Years | 4 | 16.0% |
| 45 to 54 Years | 1 | 4.0% |
| 55 to 64 Years | 8 | 32.0% |
| 65 to 74 Years | 2 | 8.0% |
| 75 to 84 Years | 2 | 8.0% |
| 85 Years and Over | 2 | 8.0% |
| Total | 25 | 100.0% |
Housing Finances in Greenville
Median Income by Occupancy in Greenville
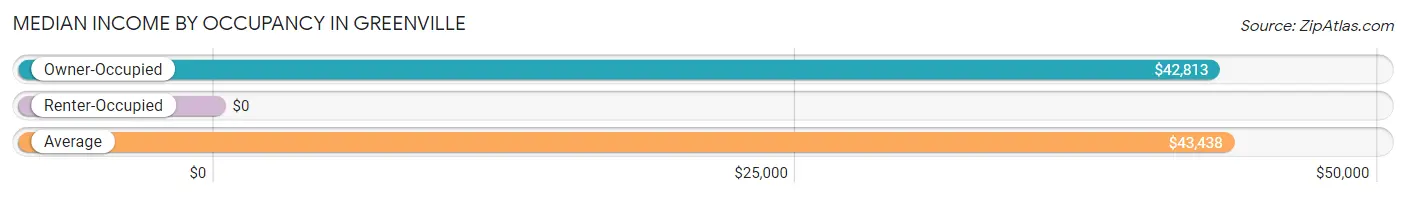
| Occupancy Type | # Households | Median Income |
| Owner-Occupied | 23 (92.0%) | $42,813 |
| Renter-Occupied | 2 (8.0%) | $0 |
| Average | 25 (100.0%) | $43,438 |
Occupancy by Householder Income Bracket in Greenville
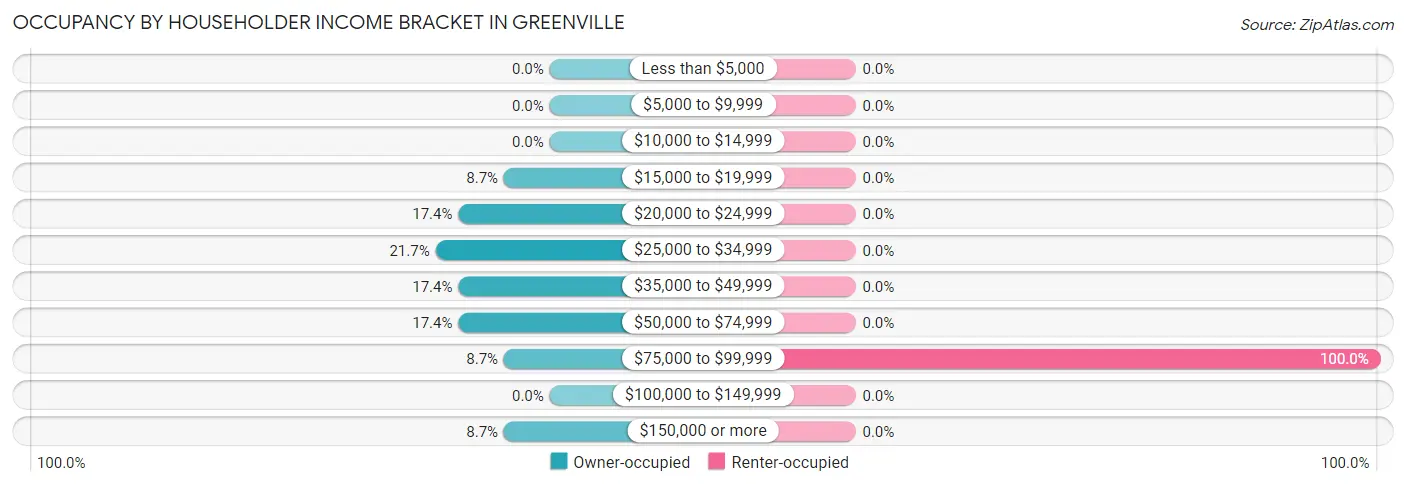
| Income Bracket | Owner-occupied | Renter-occupied |
| Less than $5,000 | 0 (0.0%) | 0 (0.0%) |
| $5,000 to $9,999 | 0 (0.0%) | 0 (0.0%) |
| $10,000 to $14,999 | 0 (0.0%) | 0 (0.0%) |
| $15,000 to $19,999 | 2 (8.7%) | 0 (0.0%) |
| $20,000 to $24,999 | 4 (17.4%) | 0 (0.0%) |
| $25,000 to $34,999 | 5 (21.7%) | 0 (0.0%) |
| $35,000 to $49,999 | 4 (17.4%) | 0 (0.0%) |
| $50,000 to $74,999 | 4 (17.4%) | 0 (0.0%) |
| $75,000 to $99,999 | 2 (8.7%) | 2 (100.0%) |
| $100,000 to $149,999 | 0 (0.0%) | 0 (0.0%) |
| $150,000 or more | 2 (8.7%) | 0 (0.0%) |
| Total | 23 (100.0%) | 2 (100.0%) |
Monthly Housing Cost Tiers in Greenville
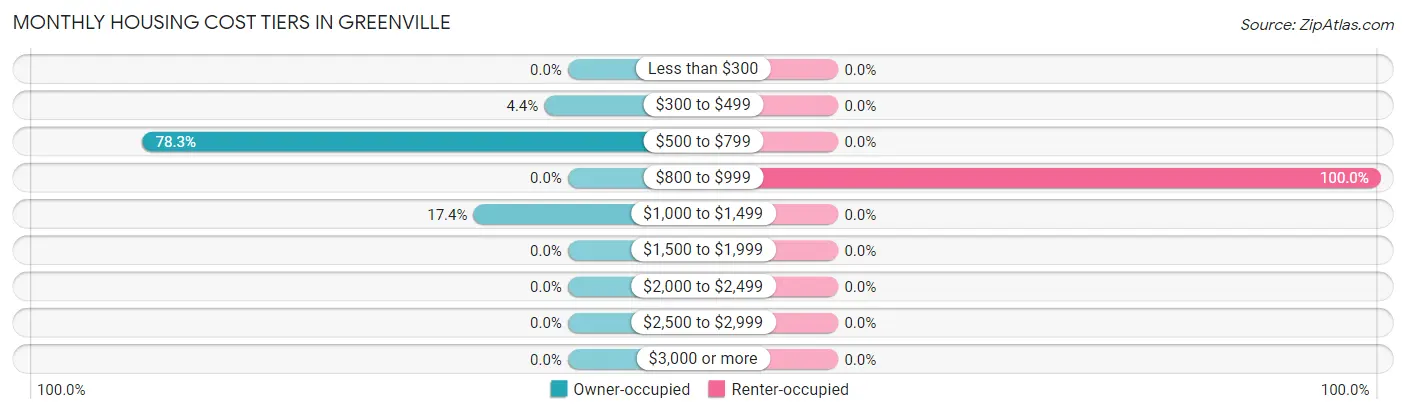
| Monthly Cost | Owner-occupied | Renter-occupied |
| Less than $300 | 0 (0.0%) | 0 (0.0%) |
| $300 to $499 | 1 (4.3%) | 0 (0.0%) |
| $500 to $799 | 18 (78.3%) | 0 (0.0%) |
| $800 to $999 | 0 (0.0%) | 2 (100.0%) |
| $1,000 to $1,499 | 4 (17.4%) | 0 (0.0%) |
| $1,500 to $1,999 | 0 (0.0%) | 0 (0.0%) |
| $2,000 to $2,499 | 0 (0.0%) | 0 (0.0%) |
| $2,500 to $2,999 | 0 (0.0%) | 0 (0.0%) |
| $3,000 or more | 0 (0.0%) | 0 (0.0%) |
| Total | 23 (100.0%) | 2 (100.0%) |
Physical Housing Characteristics in Greenville
Housing Structures in Greenville
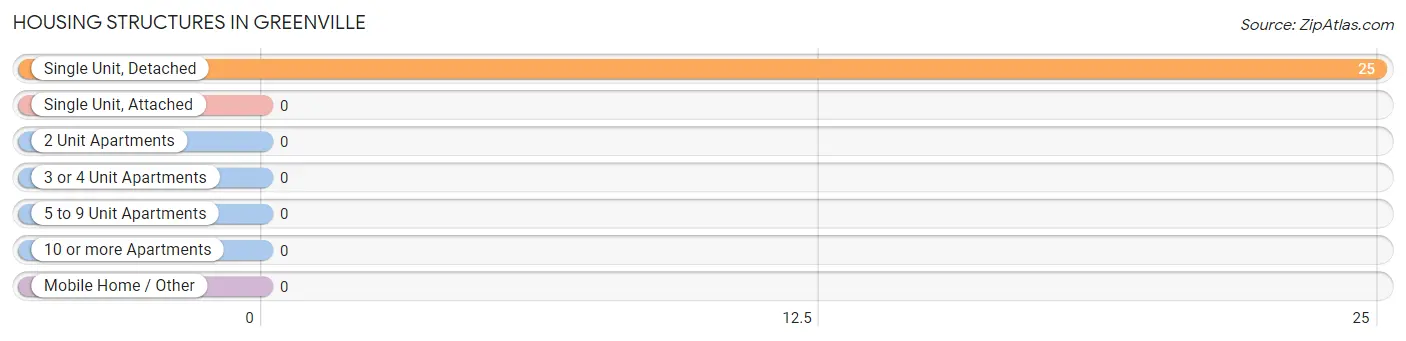
| Structure Type | # Housing Units | % Housing Units |
| Single Unit, Detached | 25 | 100.0% |
| Single Unit, Attached | 0 | 0.0% |
| 2 Unit Apartments | 0 | 0.0% |
| 3 or 4 Unit Apartments | 0 | 0.0% |
| 5 to 9 Unit Apartments | 0 | 0.0% |
| 10 or more Apartments | 0 | 0.0% |
| Mobile Home / Other | 0 | 0.0% |
| Total | 25 | 100.0% |
Housing Structures by Occupancy in Greenville
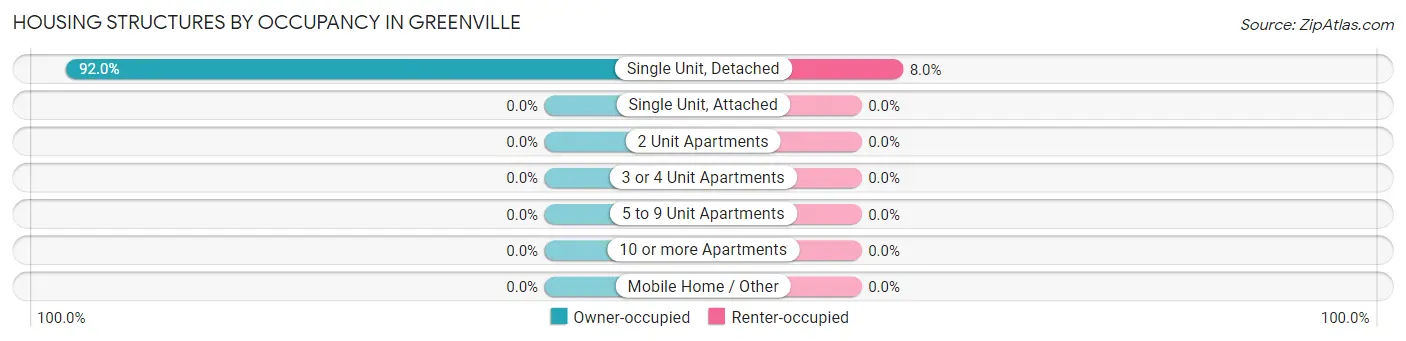
| Structure Type | Owner-occupied | Renter-occupied |
| Single Unit, Detached | 23 (92.0%) | 2 (8.0%) |
| Single Unit, Attached | 0 (0.0%) | 0 (0.0%) |
| 2 Unit Apartments | 0 (0.0%) | 0 (0.0%) |
| 3 or 4 Unit Apartments | 0 (0.0%) | 0 (0.0%) |
| 5 to 9 Unit Apartments | 0 (0.0%) | 0 (0.0%) |
| 10 or more Apartments | 0 (0.0%) | 0 (0.0%) |
| Mobile Home / Other | 0 (0.0%) | 0 (0.0%) |
| Total | 23 (92.0%) | 2 (8.0%) |
Housing Structures by Number of Rooms in Greenville
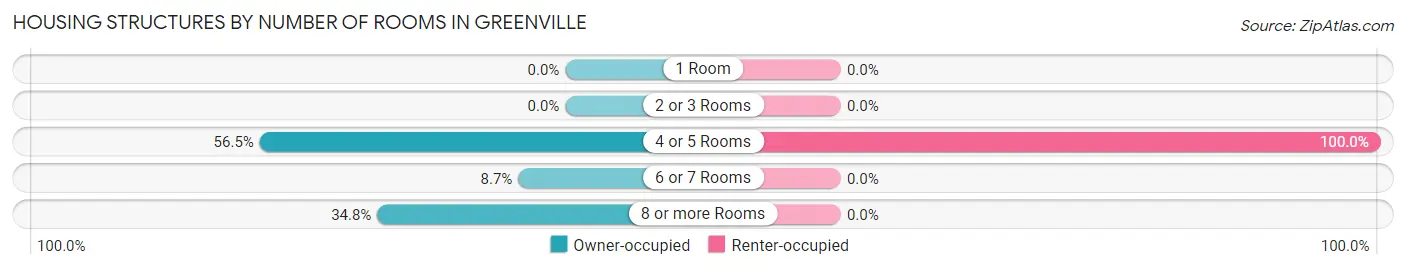
| Number of Rooms | Owner-occupied | Renter-occupied |
| 1 Room | 0 (0.0%) | 0 (0.0%) |
| 2 or 3 Rooms | 0 (0.0%) | 0 (0.0%) |
| 4 or 5 Rooms | 13 (56.5%) | 2 (100.0%) |
| 6 or 7 Rooms | 2 (8.7%) | 0 (0.0%) |
| 8 or more Rooms | 8 (34.8%) | 0 (0.0%) |
| Total | 23 (100.0%) | 2 (100.0%) |
Housing Structure by Heating Type in Greenville
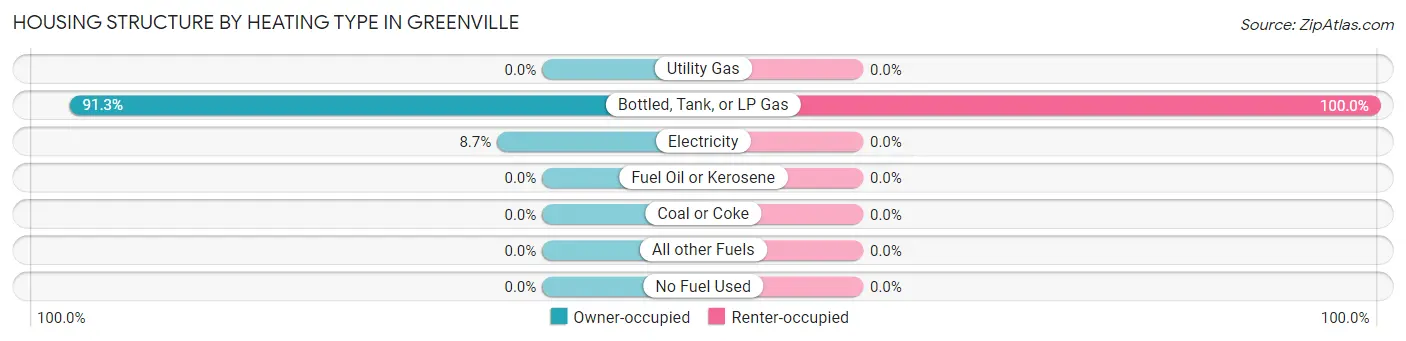
| Heating Type | Owner-occupied | Renter-occupied |
| Utility Gas | 0 (0.0%) | 0 (0.0%) |
| Bottled, Tank, or LP Gas | 21 (91.3%) | 2 (100.0%) |
| Electricity | 2 (8.7%) | 0 (0.0%) |
| Fuel Oil or Kerosene | 0 (0.0%) | 0 (0.0%) |
| Coal or Coke | 0 (0.0%) | 0 (0.0%) |
| All other Fuels | 0 (0.0%) | 0 (0.0%) |
| No Fuel Used | 0 (0.0%) | 0 (0.0%) |
| Total | 23 (100.0%) | 2 (100.0%) |
Household Vehicle Usage in Greenville
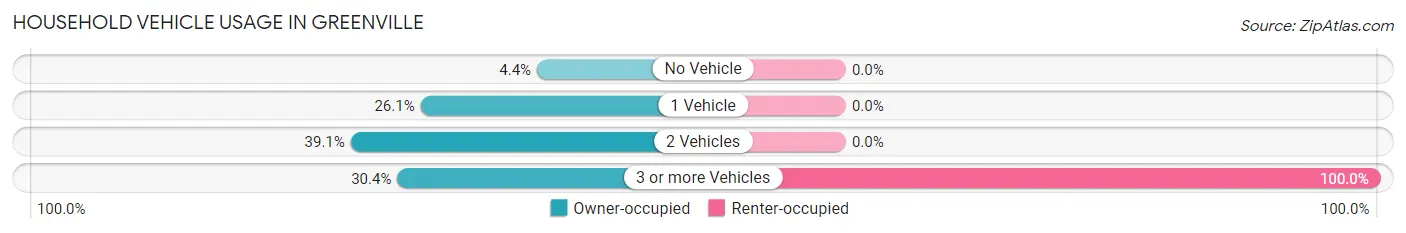
| Vehicles per Household | Owner-occupied | Renter-occupied |
| No Vehicle | 1 (4.3%) | 0 (0.0%) |
| 1 Vehicle | 6 (26.1%) | 0 (0.0%) |
| 2 Vehicles | 9 (39.1%) | 0 (0.0%) |
| 3 or more Vehicles | 7 (30.4%) | 2 (100.0%) |
| Total | 23 (100.0%) | 2 (100.0%) |
Real Estate & Mortgages in Greenville
Real Estate and Mortgage Overview in Greenville
| Characteristic | Without Mortgage | With Mortgage |
| Housing Units | 18 | 5 |
| Median Property Value | $41,400 | $78,300 |
| Median Household Income | $31,250 | $0 |
| Monthly Housing Costs | $600 | $0 |
| Real Estate Taxes | $383 | $0 |
Property Value by Mortgage Status in Greenville
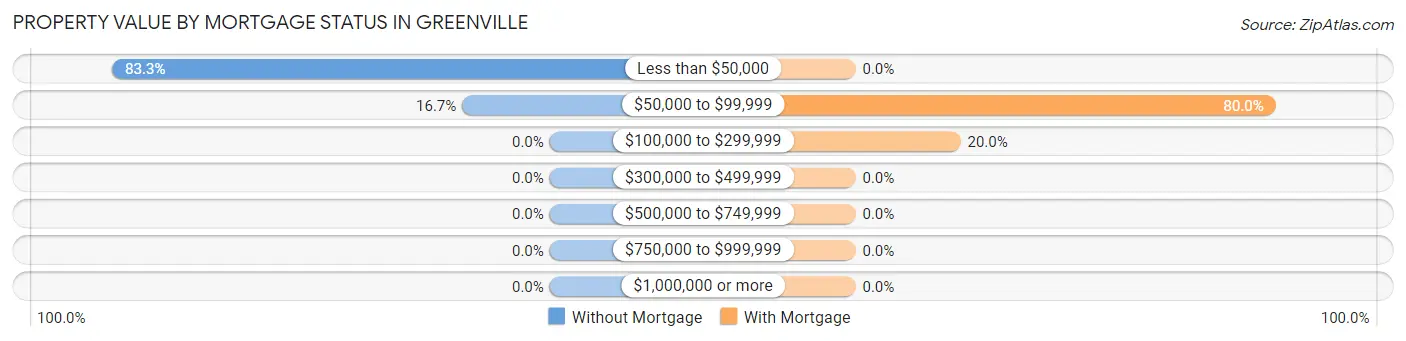
| Property Value | Without Mortgage | With Mortgage |
| Less than $50,000 | 15 (83.3%) | 0 (0.0%) |
| $50,000 to $99,999 | 3 (16.7%) | 4 (80.0%) |
| $100,000 to $299,999 | 0 (0.0%) | 1 (20.0%) |
| $300,000 to $499,999 | 0 (0.0%) | 0 (0.0%) |
| $500,000 to $749,999 | 0 (0.0%) | 0 (0.0%) |
| $750,000 to $999,999 | 0 (0.0%) | 0 (0.0%) |
| $1,000,000 or more | 0 (0.0%) | 0 (0.0%) |
| Total | 18 (100.0%) | 5 (100.0%) |
Household Income by Mortgage Status in Greenville
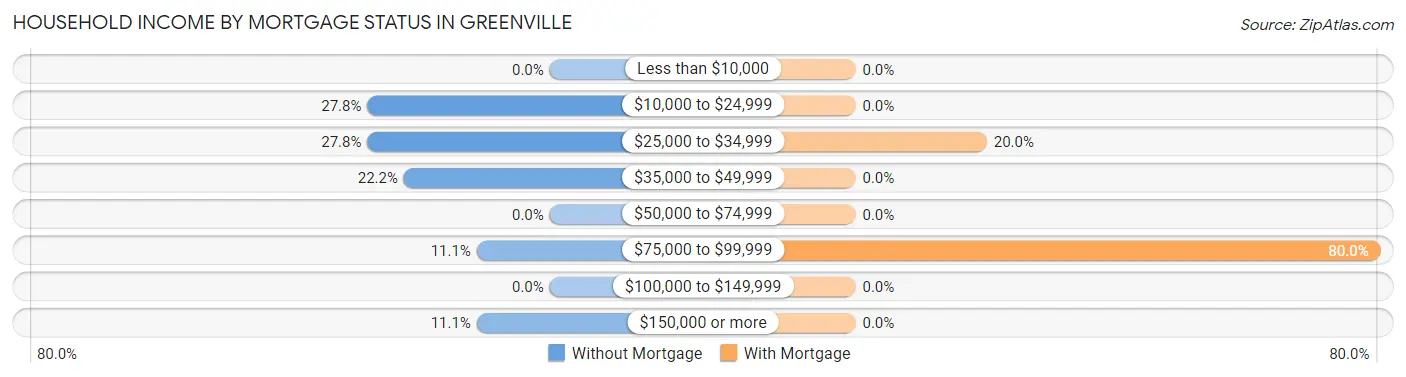
| Household Income | Without Mortgage | With Mortgage |
| Less than $10,000 | 0 (0.0%) | 0 (0.0%) |
| $10,000 to $24,999 | 5 (27.8%) | 0 (0.0%) |
| $25,000 to $34,999 | 5 (27.8%) | 1 (20.0%) |
| $35,000 to $49,999 | 4 (22.2%) | 0 (0.0%) |
| $50,000 to $74,999 | 0 (0.0%) | 0 (0.0%) |
| $75,000 to $99,999 | 2 (11.1%) | 4 (80.0%) |
| $100,000 to $149,999 | 0 (0.0%) | 0 (0.0%) |
| $150,000 or more | 2 (11.1%) | 0 (0.0%) |
| Total | 18 (100.0%) | 5 (100.0%) |
Property Value to Household Income Ratio in Greenville
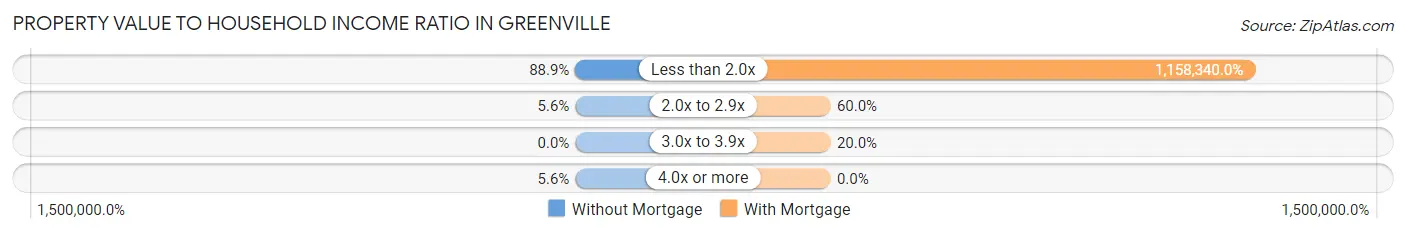
| Value-to-Income Ratio | Without Mortgage | With Mortgage |
| Less than 2.0x | 16 (88.9%) | 57,917 (1,158,340.0%) |
| 2.0x to 2.9x | 1 (5.6%) | 3 (60.0%) |
| 3.0x to 3.9x | 0 (0.0%) | 1 (20.0%) |
| 4.0x or more | 1 (5.6%) | 0 (0.0%) |
| Total | 18 (100.0%) | 5 (100.0%) |
Real Estate Taxes by Mortgage Status in Greenville
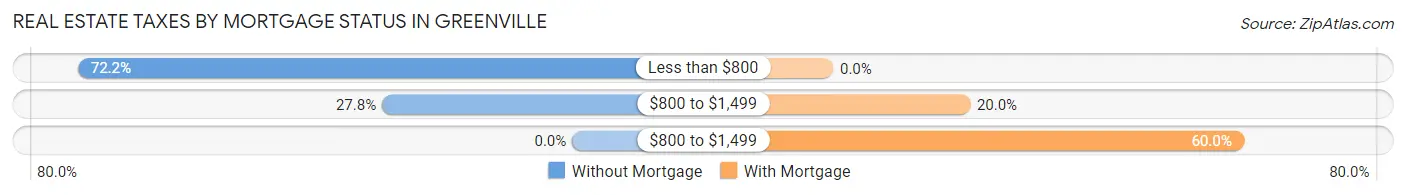
| Property Taxes | Without Mortgage | With Mortgage |
| Less than $800 | 13 (72.2%) | 0 (0.0%) |
| $800 to $1,499 | 5 (27.8%) | 1 (20.0%) |
| $800 to $1,499 | 0 (0.0%) | 3 (60.0%) |
| Total | 18 (100.0%) | 5 (100.0%) |
Health & Disability in Greenville
Health Insurance Coverage by Age in Greenville
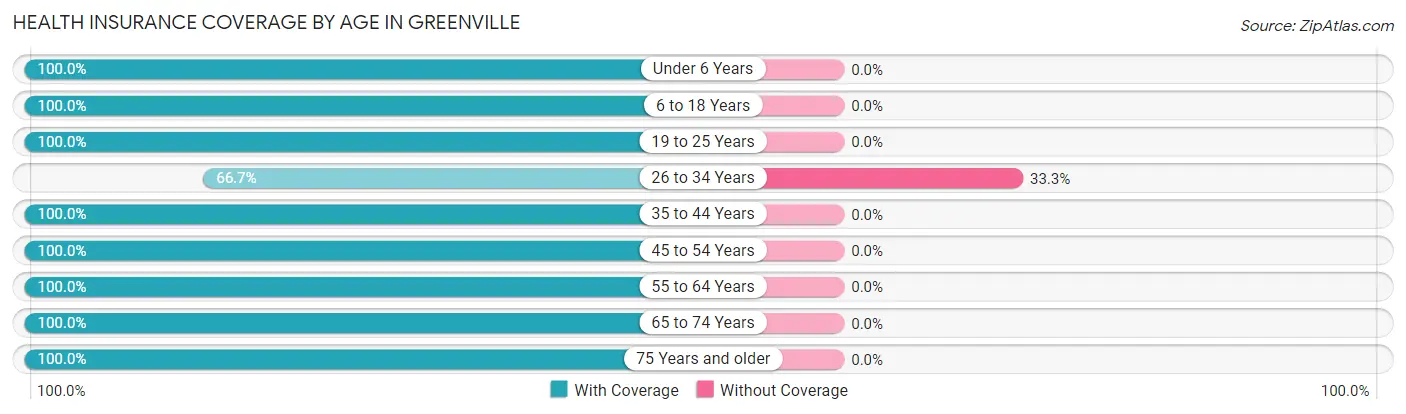
| Age Bracket | With Coverage | Without Coverage |
| Under 6 Years | 11 (100.0%) | 0 (0.0%) |
| 6 to 18 Years | 17 (100.0%) | 0 (0.0%) |
| 19 to 25 Years | 3 (100.0%) | 0 (0.0%) |
| 26 to 34 Years | 8 (66.7%) | 4 (33.3%) |
| 35 to 44 Years | 6 (100.0%) | 0 (0.0%) |
| 45 to 54 Years | 3 (100.0%) | 0 (0.0%) |
| 55 to 64 Years | 11 (100.0%) | 0 (0.0%) |
| 65 to 74 Years | 3 (100.0%) | 0 (0.0%) |
| 75 Years and older | 5 (100.0%) | 0 (0.0%) |
| Total | 67 (94.4%) | 4 (5.6%) |
Health Insurance Coverage by Citizenship Status in Greenville
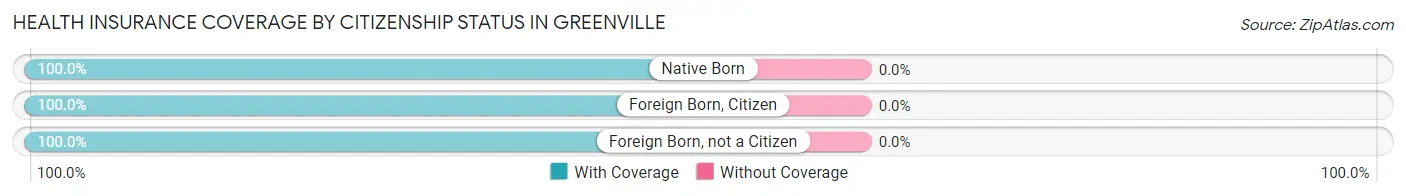
| Citizenship Status | With Coverage | Without Coverage |
| Native Born | 11 (100.0%) | 0 (0.0%) |
| Foreign Born, Citizen | 17 (100.0%) | 0 (0.0%) |
| Foreign Born, not a Citizen | 3 (100.0%) | 0 (0.0%) |
Health Insurance Coverage by Household Income in Greenville
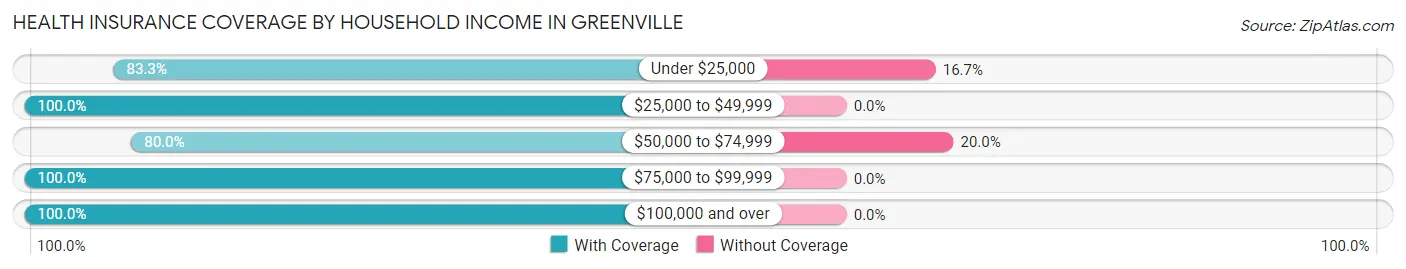
| Household Income | With Coverage | Without Coverage |
| Under $25,000 | 5 (83.3%) | 1 (16.7%) |
| $25,000 to $49,999 | 26 (100.0%) | 0 (0.0%) |
| $50,000 to $74,999 | 12 (80.0%) | 3 (20.0%) |
| $75,000 to $99,999 | 16 (100.0%) | 0 (0.0%) |
| $100,000 and over | 8 (100.0%) | 0 (0.0%) |
Public vs Private Health Insurance Coverage by Age in Greenville
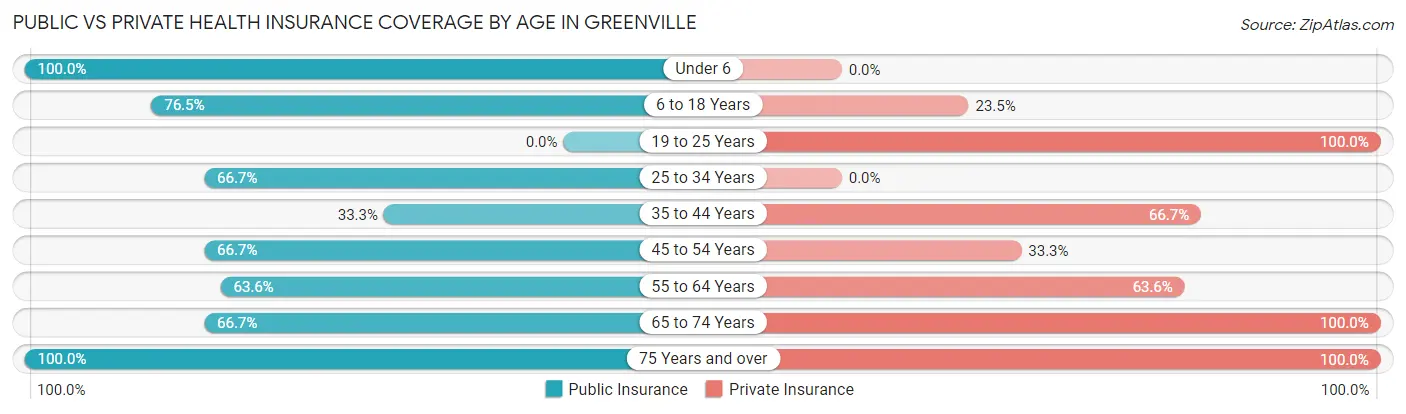
| Age Bracket | Public Insurance | Private Insurance |
| Under 6 | 11 (100.0%) | 0 (0.0%) |
| 6 to 18 Years | 13 (76.5%) | 4 (23.5%) |
| 19 to 25 Years | 0 (0.0%) | 3 (100.0%) |
| 25 to 34 Years | 8 (66.7%) | 0 (0.0%) |
| 35 to 44 Years | 2 (33.3%) | 4 (66.7%) |
| 45 to 54 Years | 2 (66.7%) | 1 (33.3%) |
| 55 to 64 Years | 7 (63.6%) | 7 (63.6%) |
| 65 to 74 Years | 2 (66.7%) | 3 (100.0%) |
| 75 Years and over | 5 (100.0%) | 5 (100.0%) |
| Total | 50 (70.4%) | 27 (38.0%) |
Disability Status by Sex by Age in Greenville
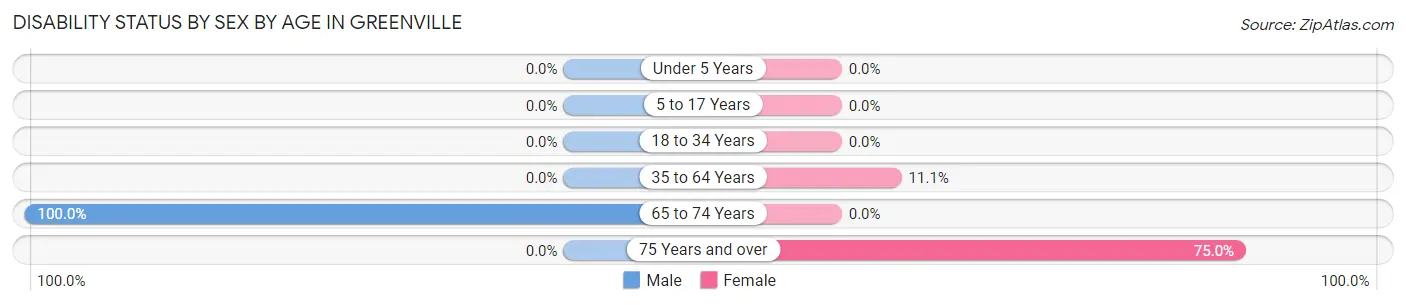
| Age Bracket | Male | Female |
| Under 5 Years | 0 (0.0%) | 0 (0.0%) |
| 5 to 17 Years | 0 (0.0%) | 0 (0.0%) |
| 18 to 34 Years | 0 (0.0%) | 0 (0.0%) |
| 35 to 64 Years | 0 (0.0%) | 1 (11.1%) |
| 65 to 74 Years | 1 (100.0%) | 0 (0.0%) |
| 75 Years and over | 0 (0.0%) | 3 (75.0%) |
Disability Class by Sex by Age in Greenville
Disability Class: Hearing Difficulty
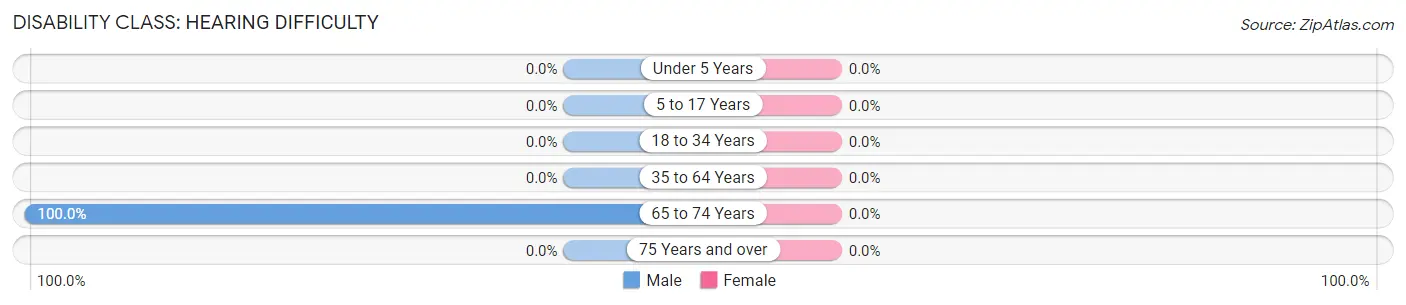
| Age Bracket | Male | Female |
| Under 5 Years | 0 (0.0%) | 0 (0.0%) |
| 5 to 17 Years | 0 (0.0%) | 0 (0.0%) |
| 18 to 34 Years | 0 (0.0%) | 0 (0.0%) |
| 35 to 64 Years | 0 (0.0%) | 0 (0.0%) |
| 65 to 74 Years | 1 (100.0%) | 0 (0.0%) |
| 75 Years and over | 0 (0.0%) | 0 (0.0%) |
Disability Class: Vision Difficulty
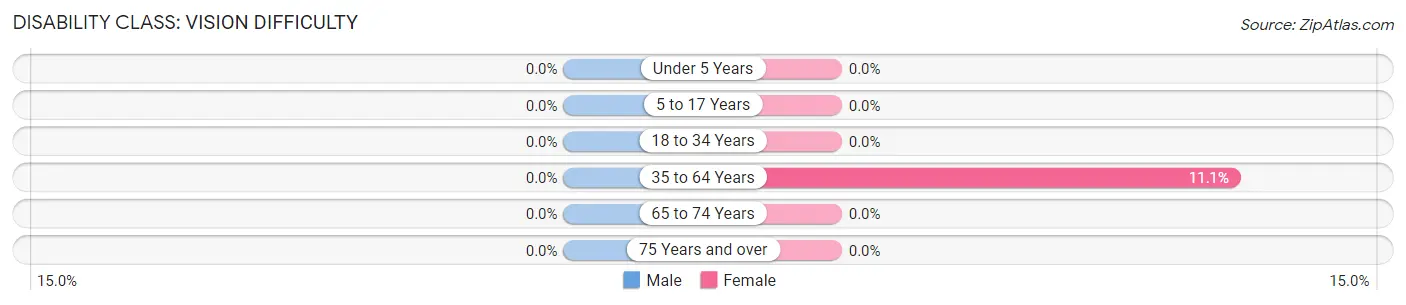
| Age Bracket | Male | Female |
| Under 5 Years | 0 (0.0%) | 0 (0.0%) |
| 5 to 17 Years | 0 (0.0%) | 0 (0.0%) |
| 18 to 34 Years | 0 (0.0%) | 0 (0.0%) |
| 35 to 64 Years | 0 (0.0%) | 1 (11.1%) |
| 65 to 74 Years | 0 (0.0%) | 0 (0.0%) |
| 75 Years and over | 0 (0.0%) | 0 (0.0%) |
Disability Class: Cognitive Difficulty
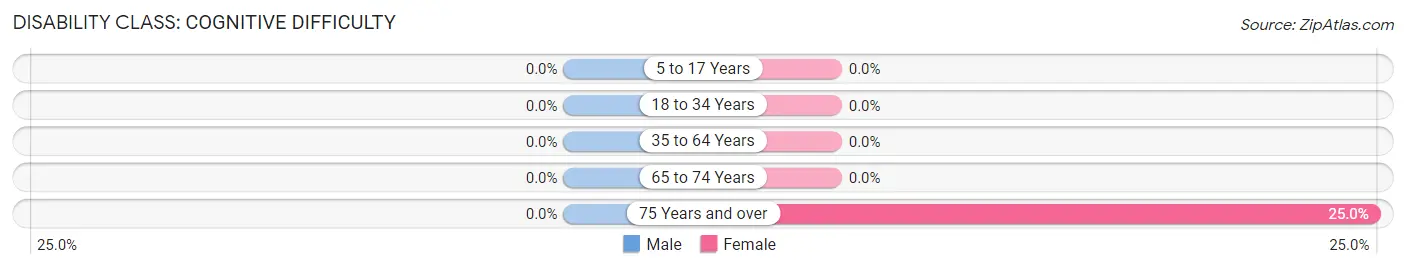
| Age Bracket | Male | Female |
| 5 to 17 Years | 0 (0.0%) | 0 (0.0%) |
| 18 to 34 Years | 0 (0.0%) | 0 (0.0%) |
| 35 to 64 Years | 0 (0.0%) | 0 (0.0%) |
| 65 to 74 Years | 0 (0.0%) | 0 (0.0%) |
| 75 Years and over | 0 (0.0%) | 1 (25.0%) |
Disability Class: Ambulatory Difficulty
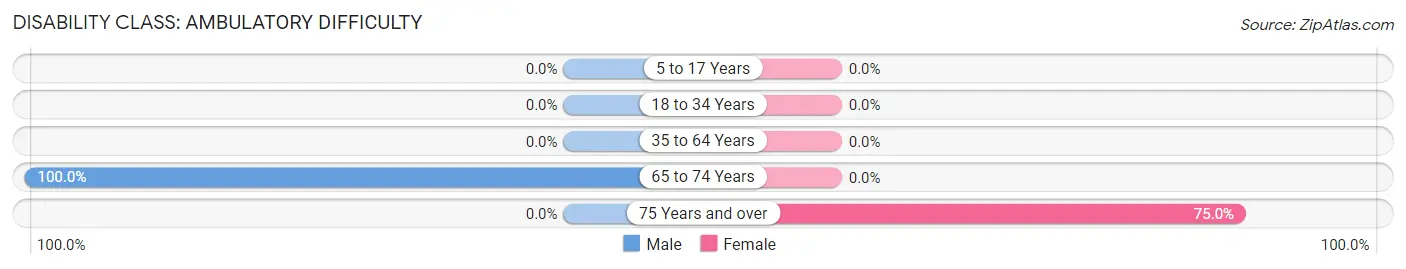
| Age Bracket | Male | Female |
| 5 to 17 Years | 0 (0.0%) | 0 (0.0%) |
| 18 to 34 Years | 0 (0.0%) | 0 (0.0%) |
| 35 to 64 Years | 0 (0.0%) | 0 (0.0%) |
| 65 to 74 Years | 1 (100.0%) | 0 (0.0%) |
| 75 Years and over | 0 (0.0%) | 3 (75.0%) |
Disability Class: Self-Care Difficulty
| Age Bracket | Male | Female |
| 5 to 17 Years | 0 (0.0%) | 0 (0.0%) |
| 18 to 34 Years | 0 (0.0%) | 0 (0.0%) |
| 35 to 64 Years | 0 (0.0%) | 0 (0.0%) |
| 65 to 74 Years | 1 (100.0%) | 0 (0.0%) |
| 75 Years and over | 0 (0.0%) | 0 (0.0%) |
Technology Access in Greenville
Computing Device Access in Greenville
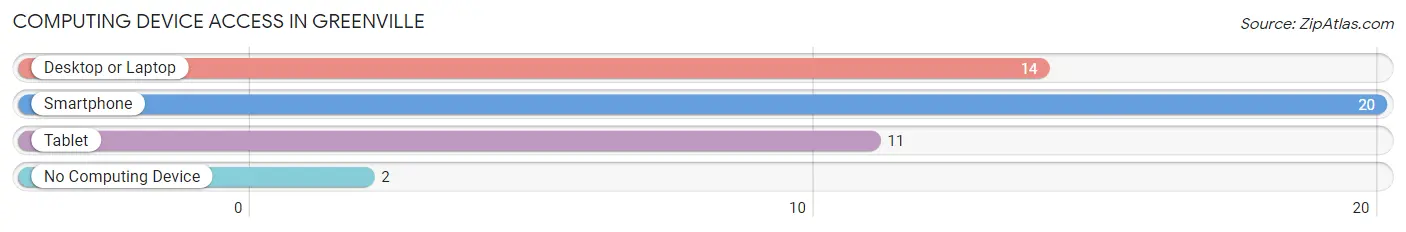
| Device Type | # Households | % Households |
| Desktop or Laptop | 14 | 56.0% |
| Smartphone | 20 | 80.0% |
| Tablet | 11 | 44.0% |
| No Computing Device | 2 | 8.0% |
| Total | 25 | 100.0% |
Internet Access in Greenville
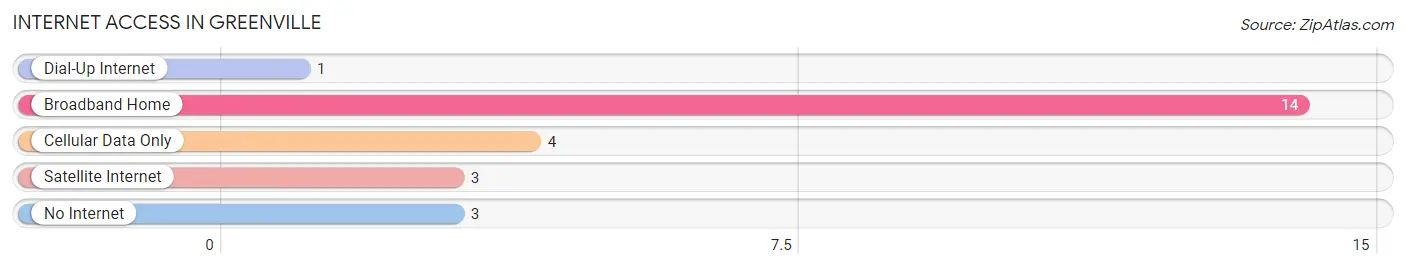
| Internet Type | # Households | % Households |
| Dial-Up Internet | 1 | 4.0% |
| Broadband Home | 14 | 56.0% |
| Cellular Data Only | 4 | 16.0% |
| Satellite Internet | 3 | 12.0% |
| No Internet | 3 | 12.0% |
| Total | 25 | 100.0% |
Greenville Summary
Greenville, Iowa is a small town located in the northwest corner of the state, in the county of Adair. It is situated on the banks of the East Nishnabotna River, and is home to a population of just over 1,000 people. The town was founded in 1854, and has a rich history of farming, industry, and small-town life.
Geography
Greenville is located in the northwest corner of Iowa, in Adair County. It is situated on the banks of the East Nishnabotna River, and is surrounded by rolling hills and farmland. The town is located approximately 30 miles from the state capital of Des Moines, and is within easy driving distance of Omaha, Nebraska and Kansas City, Missouri.
The town is situated on a flat plain, with the East Nishnabotna River running through the center of town. The river is a popular spot for fishing, canoeing, and other recreational activities. The town is also home to several parks, including the Greenville City Park, which features a playground, picnic area, and walking trails.
Economy
Greenville’s economy is largely based on agriculture and small businesses. The town is home to several farms, which produce a variety of crops, including corn, soybeans, and hay. The town is also home to several small businesses, including a grocery store, hardware store, and several restaurants.
The town is also home to several manufacturing companies, including a plastics factory and a metal fabrication plant. These companies provide jobs for many of the town’s residents.
Demographics
As of the 2010 census, Greenville had a population of 1,072 people. The town is predominantly white, with a small Hispanic population. The median household income is $41,250, and the median age is 40.
The town is home to several churches, including the First United Methodist Church, the First Presbyterian Church, and the Church of the Nazarene. The town also has a public library, a post office, and a fire department.
Conclusion
Greenville, Iowa is a small town with a rich history and a vibrant economy. The town is home to a diverse population, and is a great place to live and work. The town is surrounded by rolling hills and farmland, and is a popular spot for fishing, canoeing, and other recreational activities. The town is home to several small businesses, manufacturing companies, and churches, and is a great place to raise a family.
Common Questions
What is Per Capita Income in Greenville?
Per Capita income in Greenville is $21,963.
What is the Median Family Income in Greenville?
Median Family Income in Greenville is $50,000.
What is the Median Household income in Greenville?
Median Household Income in Greenville is $43,438.
What is Inequality or Gini Index in Greenville?
Inequality or Gini Index in Greenville is 0.41.
What is the Total Population of Greenville?
Total Population of Greenville is 71.
What is the Total Male Population of Greenville?
Total Male Population of Greenville is 46.
What is the Total Female Population of Greenville?
Total Female Population of Greenville is 25.
What is the Ratio of Males per 100 Females in Greenville?
There are 184.00 Males per 100 Females in Greenville.
What is the Ratio of Females per 100 Males in Greenville?
There are 54.35 Females per 100 Males in Greenville.
What is the Median Population Age in Greenville?
Median Population Age in Greenville is 29.1 Years.
What is the Average Family Size in Greenville
Average Family Size in Greenville is 3.8 People.
What is the Average Household Size in Greenville
Average Household Size in Greenville is 2.8 People.
How Large is the Labor Force in Greenville?
There are 36 People in the Labor Forcein in Greenville.
What is the Percentage of People in the Labor Force in Greenville?
80.0% of People are in the Labor Force in Greenville.