Granville, IA Map & Demographics
Granville Map
Granville Overview
$33,159
PER CAPITA INCOME
$79,375
AVG FAMILY INCOME
$58,750
AVG HOUSEHOLD INCOME
3.7%
WAGE / INCOME GAP [ % ]
96.3¢/ $1
WAGE / INCOME GAP [ $ ]
0.43
INEQUALITY / GINI INDEX
287
TOTAL POPULATION
147
MALE POPULATION
140
FEMALE POPULATION
105.00
MALES / 100 FEMALES
95.24
FEMALES / 100 MALES
46.6
MEDIAN AGE
2.9
AVG FAMILY SIZE
2.2
AVG HOUSEHOLD SIZE
141
LABOR FORCE [ PEOPLE ]
61.0%
PERCENT IN LABOR FORCE
0.7%
UNEMPLOYMENT RATE
Granville Zip Codes
Granville Area Codes
Income in Granville
Income Overview in Granville
Per Capita Income in Granville is $33,159, while median incomes of families and households are $79,375 and $58,750 respectively.
| Characteristic | Number | Measure |
| Per Capita Income | 287 | $33,159 |
| Median Family Income | 84 | $79,375 |
| Mean Family Income | 84 | $101,310 |
| Median Household Income | 126 | $58,750 |
| Mean Household Income | 126 | $78,895 |
| Income Deficit | 84 | $0 |
| Wage / Income Gap (%) | 287 | 3.70% |
| Wage / Income Gap ($) | 287 | 96.30¢ per $1 |
| Gini / Inequality Index | 287 | 0.43 |
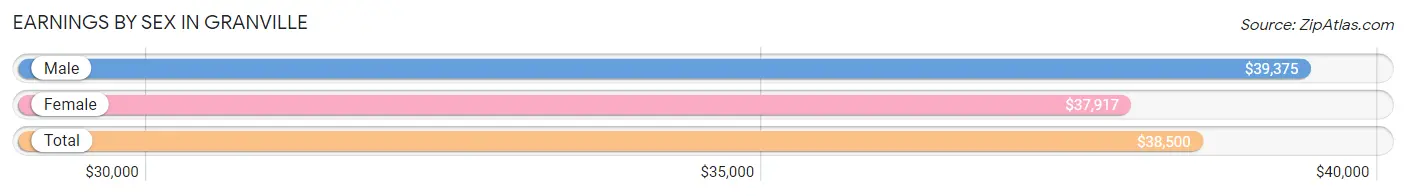
Earnings by Sex in Granville
Average Earnings in Granville are $38,500, $39,375 for men and $37,917 for women, a difference of 3.7%.
| Sex | Number | Average Earnings |
| Male | 83 (56.1%) | $39,375 |
| Female | 65 (43.9%) | $37,917 |
| Total | 148 (100.0%) | $38,500 |
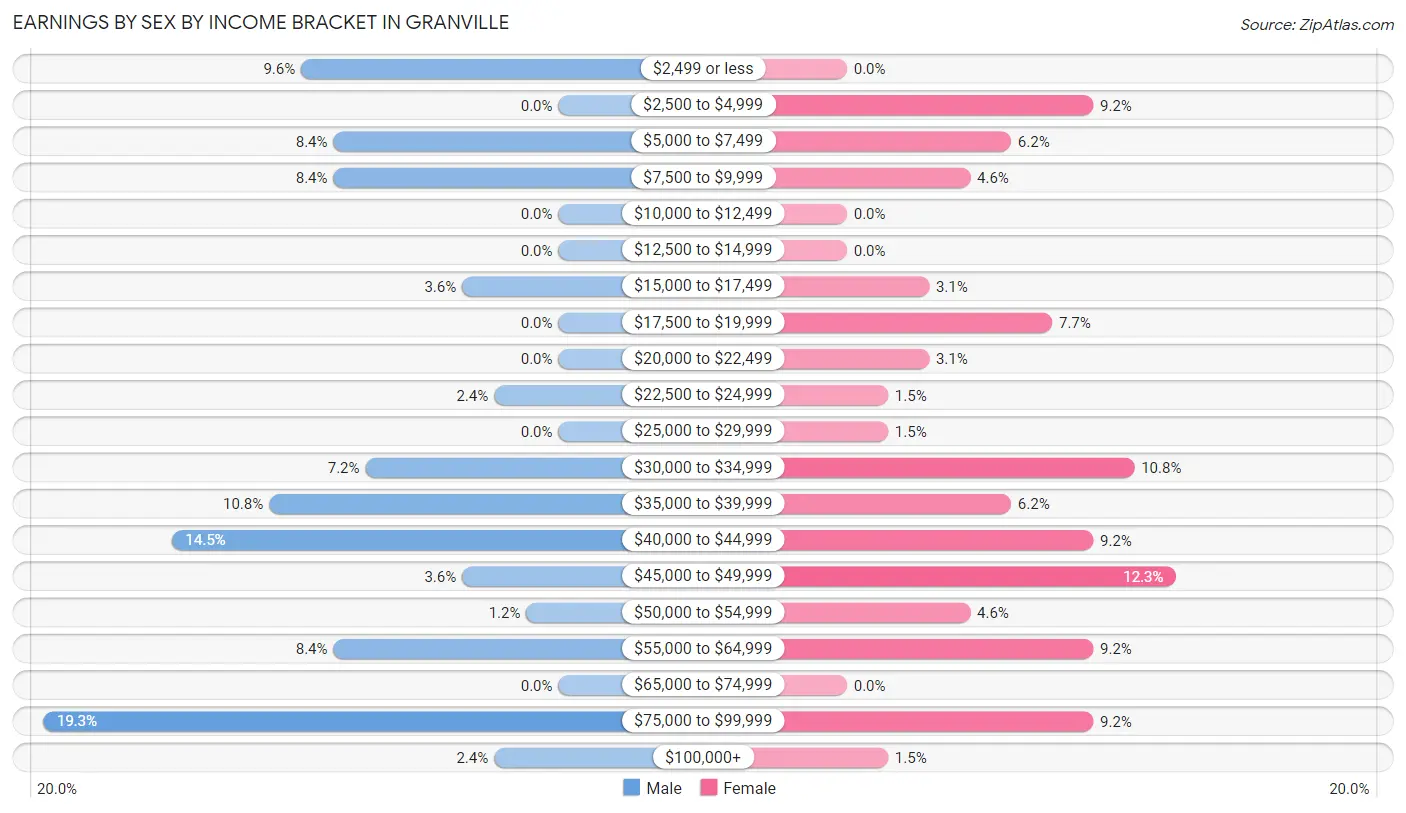
Earnings by Sex by Income Bracket in Granville
The most common earnings brackets in Granville are $75,000 to $99,999 for men (16 | 19.3%) and $45,000 to $49,999 for women (8 | 12.3%).
| Income | Male | Female |
| $2,499 or less | 8 (9.6%) | 0 (0.0%) |
| $2,500 to $4,999 | 0 (0.0%) | 6 (9.2%) |
| $5,000 to $7,499 | 7 (8.4%) | 4 (6.1%) |
| $7,500 to $9,999 | 7 (8.4%) | 3 (4.6%) |
| $10,000 to $12,499 | 0 (0.0%) | 0 (0.0%) |
| $12,500 to $14,999 | 0 (0.0%) | 0 (0.0%) |
| $15,000 to $17,499 | 3 (3.6%) | 2 (3.1%) |
| $17,500 to $19,999 | 0 (0.0%) | 5 (7.7%) |
| $20,000 to $22,499 | 0 (0.0%) | 2 (3.1%) |
| $22,500 to $24,999 | 2 (2.4%) | 1 (1.5%) |
| $25,000 to $29,999 | 0 (0.0%) | 1 (1.5%) |
| $30,000 to $34,999 | 6 (7.2%) | 7 (10.8%) |
| $35,000 to $39,999 | 9 (10.8%) | 4 (6.1%) |
| $40,000 to $44,999 | 12 (14.5%) | 6 (9.2%) |
| $45,000 to $49,999 | 3 (3.6%) | 8 (12.3%) |
| $50,000 to $54,999 | 1 (1.2%) | 3 (4.6%) |
| $55,000 to $64,999 | 7 (8.4%) | 6 (9.2%) |
| $65,000 to $74,999 | 0 (0.0%) | 0 (0.0%) |
| $75,000 to $99,999 | 16 (19.3%) | 6 (9.2%) |
| $100,000+ | 2 (2.4%) | 1 (1.5%) |
| Total | 83 (100.0%) | 65 (100.0%) |
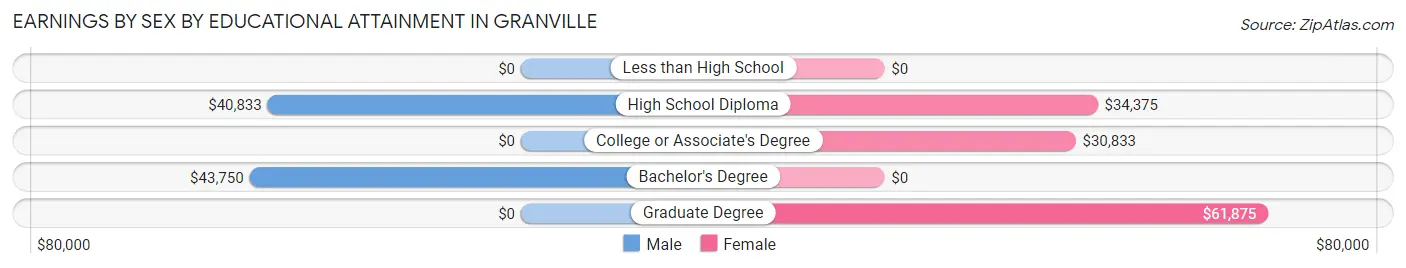
Earnings by Sex by Educational Attainment in Granville
Average earnings in Granville are $41,563 for men and $40,417 for women, a difference of 2.8%. Men with an educational attainment of bachelor's degree enjoy the highest average annual earnings of $43,750, while those with high school diploma education earn the least with $40,833. Women with an educational attainment of graduate degree earn the most with the average annual earnings of $61,875, while those with college or associate's degree education have the smallest earnings of $30,833.
| Educational Attainment | Male Income | Female Income |
| Less than High School | - | - |
| High School Diploma | $40,833 | $34,375 |
| College or Associate's Degree | - | - |
| Bachelor's Degree | $43,750 | $0 |
| Graduate Degree | - | - |
| Total | $41,563 | $40,417 |
Family Income in Granville
Family Income Brackets in Granville
According to the Granville family income data, there are 25 families falling into the $50,000 to $74,999 income range, which is the most common income bracket and makes up 29.8% of all families.
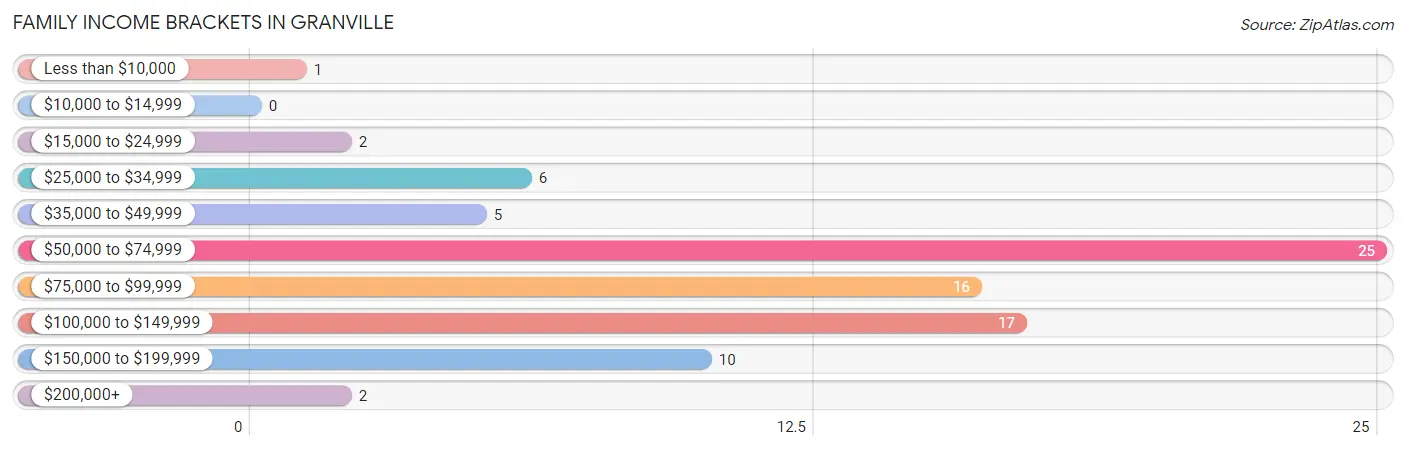
| Income Bracket | # Families | % Families |
| Less than $10,000 | 1 | 1.2% |
| $10,000 to $14,999 | 0 | 0.0% |
| $15,000 to $24,999 | 2 | 2.4% |
| $25,000 to $34,999 | 6 | 7.1% |
| $35,000 to $49,999 | 5 | 6.0% |
| $50,000 to $74,999 | 25 | 29.8% |
| $75,000 to $99,999 | 16 | 19.0% |
| $100,000 to $149,999 | 17 | 20.2% |
| $150,000 to $199,999 | 10 | 11.9% |
| $200,000+ | 2 | 2.4% |
Family Income by Famaliy Size in Granville
4-person families (10 | 11.9%) account for the highest median family income in Granville with $145,000 per family, while 3-person families (7 | 8.3%) have the highest median income of $43,958 per family member.
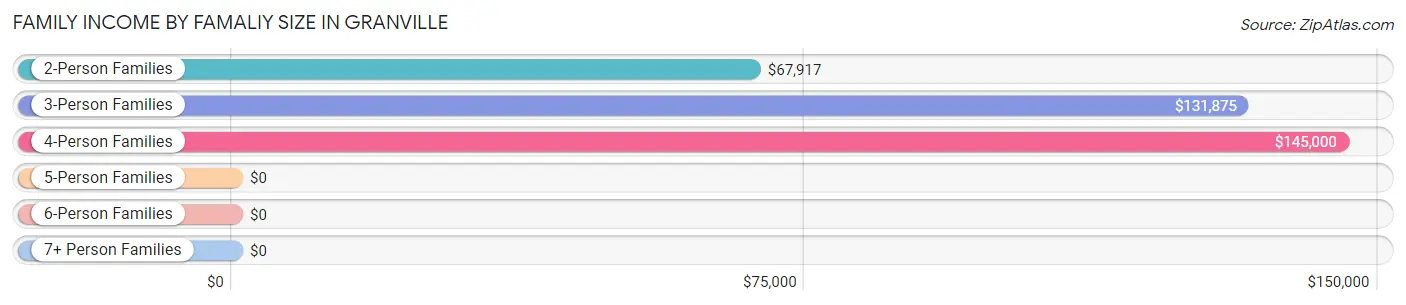
| Income Bracket | # Families | Median Income |
| 2-Person Families | 57 (67.9%) | $67,917 |
| 3-Person Families | 7 (8.3%) | $131,875 |
| 4-Person Families | 10 (11.9%) | $145,000 |
| 5-Person Families | 6 (7.1%) | $0 |
| 6-Person Families | 0 (0.0%) | $0 |
| 7+ Person Families | 4 (4.8%) | $0 |
| Total | 84 (100.0%) | $79,375 |
Family Income by Number of Earners in Granville
The median family income in Granville is $79,375, with families comprising 3+ earners (10) having the highest median family income of $106,250, while families with no earners (20) have the lowest median family income of $57,222, accounting for 11.9% and 23.8% of families, respectively.
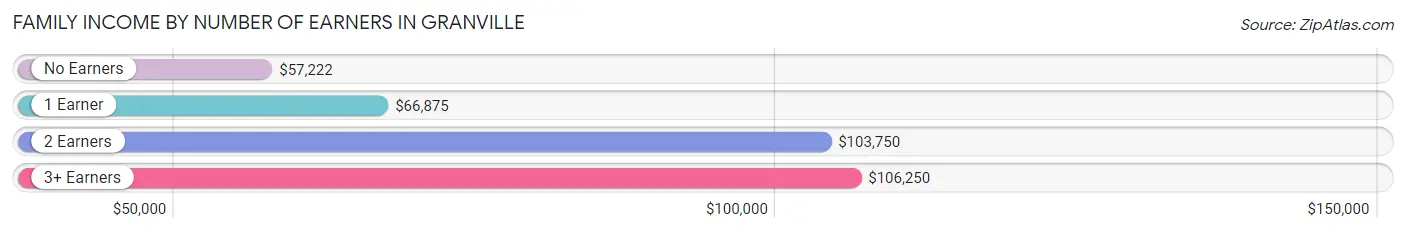
| Number of Earners | # Families | Median Income |
| No Earners | 20 (23.8%) | $57,222 |
| 1 Earner | 21 (25.0%) | $66,875 |
| 2 Earners | 33 (39.3%) | $103,750 |
| 3+ Earners | 10 (11.9%) | $106,250 |
| Total | 84 (100.0%) | $79,375 |
Household Income in Granville
Household Income Brackets in Granville
With 28 households falling in the category, the $50,000 to $74,999 income range is the most frequent in Granville, accounting for 22.2% of all households. In contrast, only 1 households (0.8%) fall into the $10,000 to $14,999 income bracket, making it the least populous group.
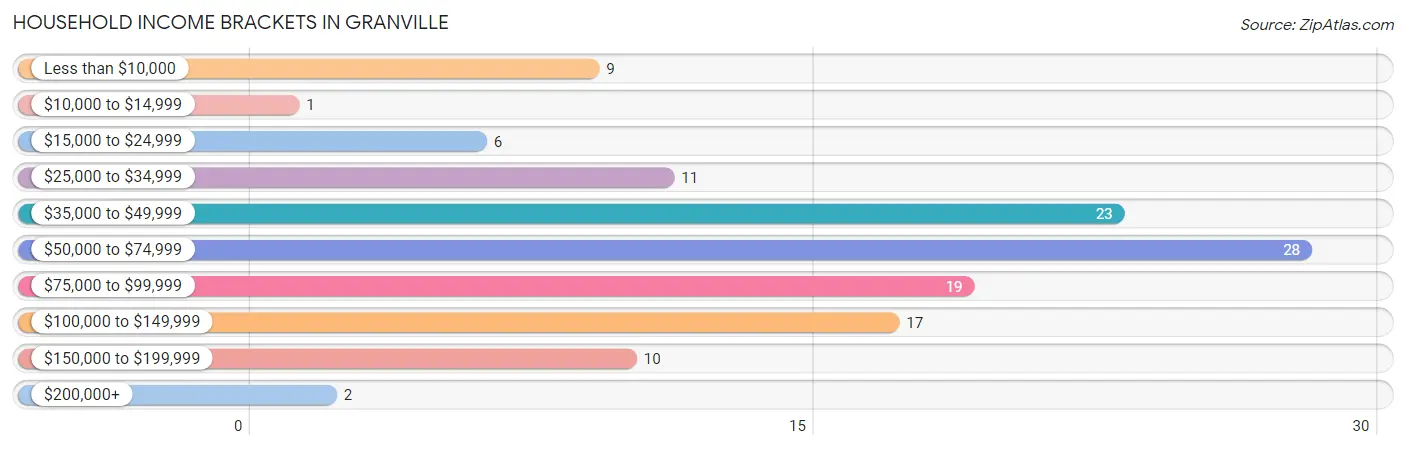
| Income Bracket | # Households | % Households |
| Less than $10,000 | 9 | 7.1% |
| $10,000 to $14,999 | 1 | 0.8% |
| $15,000 to $24,999 | 6 | 4.8% |
| $25,000 to $34,999 | 11 | 8.7% |
| $35,000 to $49,999 | 23 | 18.3% |
| $50,000 to $74,999 | 28 | 22.2% |
| $75,000 to $99,999 | 19 | 15.1% |
| $100,000 to $149,999 | 17 | 13.5% |
| $150,000 to $199,999 | 10 | 7.9% |
| $200,000+ | 2 | 1.6% |
Household Income by Householder Age in Granville
The median household income in Granville is $58,750, with the highest median household income of $79,167 found in the 45 to 64 years age bracket for the primary householder. A total of 46 households (36.5%) fall into this category. Meanwhile, the 25 to 44 years age bracket for the primary householder has the lowest median household income of $0, with 23 households (18.2%) in this group.
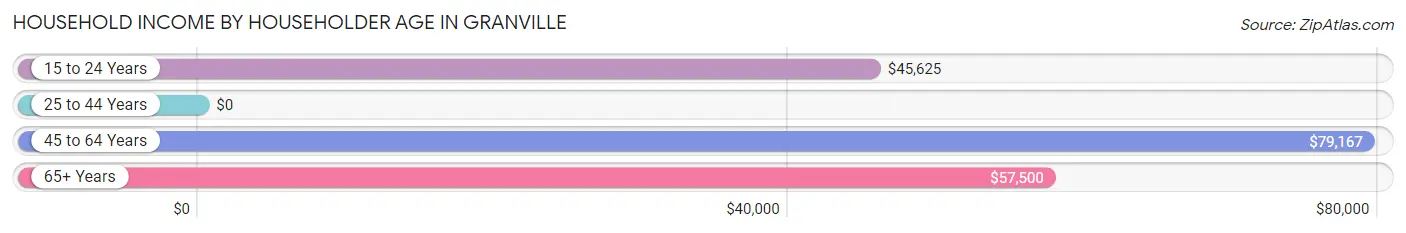
| Income Bracket | # Households | Median Income |
| 15 to 24 Years | 13 (10.3%) | $45,625 |
| 25 to 44 Years | 23 (18.2%) | $0 |
| 45 to 64 Years | 46 (36.5%) | $79,167 |
| 65+ Years | 44 (34.9%) | $57,500 |
| Total | 126 (100.0%) | $58,750 |
Poverty in Granville
Income Below Poverty by Sex and Age in Granville
With 14.3% poverty level for males and 17.9% for females among the residents of Granville, under 5 year old males and 12 to 14 year old females are the most vulnerable to poverty, with 6 males (54.5%) and 4 females (100.0%) in their respective age groups living below the poverty level.
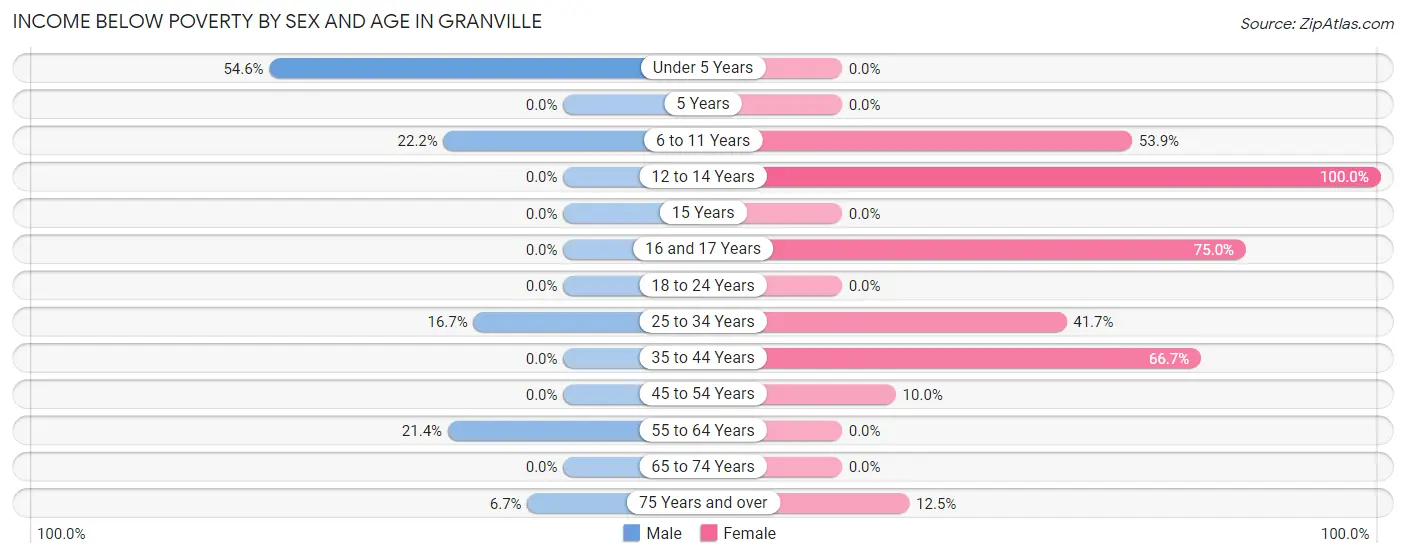
| Age Bracket | Male | Female |
| Under 5 Years | 6 (54.5%) | 0 (0.0%) |
| 5 Years | 0 (0.0%) | 0 (0.0%) |
| 6 to 11 Years | 4 (22.2%) | 7 (53.8%) |
| 12 to 14 Years | 0 (0.0%) | 4 (100.0%) |
| 15 Years | 0 (0.0%) | 0 (0.0%) |
| 16 and 17 Years | 0 (0.0%) | 3 (75.0%) |
| 18 to 24 Years | 0 (0.0%) | 0 (0.0%) |
| 25 to 34 Years | 4 (16.7%) | 5 (41.7%) |
| 35 to 44 Years | 0 (0.0%) | 2 (66.7%) |
| 45 to 54 Years | 0 (0.0%) | 1 (10.0%) |
| 55 to 64 Years | 6 (21.4%) | 0 (0.0%) |
| 65 to 74 Years | 0 (0.0%) | 0 (0.0%) |
| 75 Years and over | 1 (6.7%) | 3 (12.5%) |
| Total | 21 (14.3%) | 25 (17.9%) |
Income Above Poverty by Sex and Age in Granville
According to the poverty statistics in Granville, males aged 15 years and females aged under 5 years are the age groups that are most secure financially, with 100.0% of males and 100.0% of females in these age groups living above the poverty line.
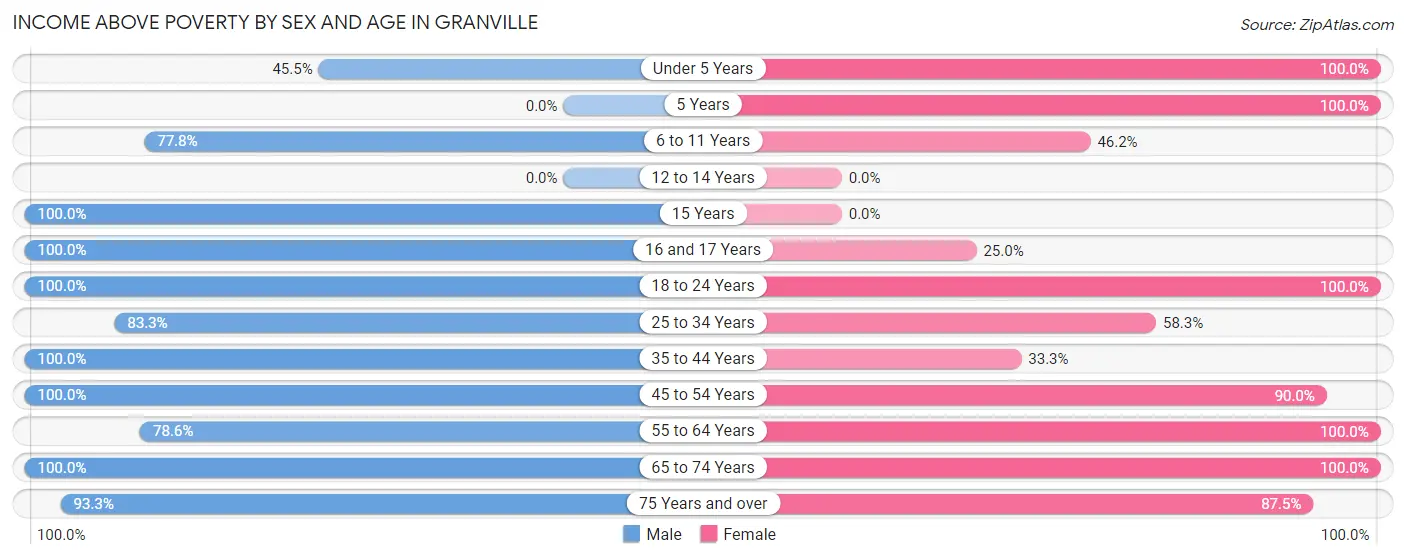
| Age Bracket | Male | Female |
| Under 5 Years | 5 (45.5%) | 7 (100.0%) |
| 5 Years | 0 (0.0%) | 1 (100.0%) |
| 6 to 11 Years | 14 (77.8%) | 6 (46.2%) |
| 12 to 14 Years | 0 (0.0%) | 0 (0.0%) |
| 15 Years | 2 (100.0%) | 0 (0.0%) |
| 16 and 17 Years | 2 (100.0%) | 1 (25.0%) |
| 18 to 24 Years | 13 (100.0%) | 19 (100.0%) |
| 25 to 34 Years | 20 (83.3%) | 7 (58.3%) |
| 35 to 44 Years | 3 (100.0%) | 1 (33.3%) |
| 45 to 54 Years | 8 (100.0%) | 9 (90.0%) |
| 55 to 64 Years | 22 (78.6%) | 32 (100.0%) |
| 65 to 74 Years | 23 (100.0%) | 11 (100.0%) |
| 75 Years and over | 14 (93.3%) | 21 (87.5%) |
| Total | 126 (85.7%) | 115 (82.1%) |
Income Below Poverty Among Married-Couple Families in Granville
The poverty statistics for married-couple families in Granville show that 5.4% or 4 of the total 74 families live below the poverty line. Families with 5 or more children have the highest poverty rate of 100.0%, comprising of 4 families. On the other hand, families with no children have the lowest poverty rate of 0.0%, which includes 0 families.
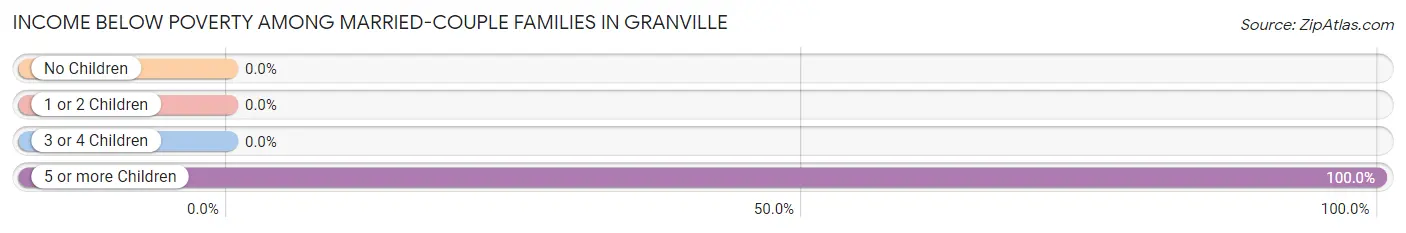
| Children | Above Poverty | Below Poverty |
| No Children | 51 (100.0%) | 0 (0.0%) |
| 1 or 2 Children | 17 (100.0%) | 0 (0.0%) |
| 3 or 4 Children | 2 (100.0%) | 0 (0.0%) |
| 5 or more Children | 0 (0.0%) | 4 (100.0%) |
| Total | 70 (94.6%) | 4 (5.4%) |
Income Below Poverty Among Single-Parent Households in Granville
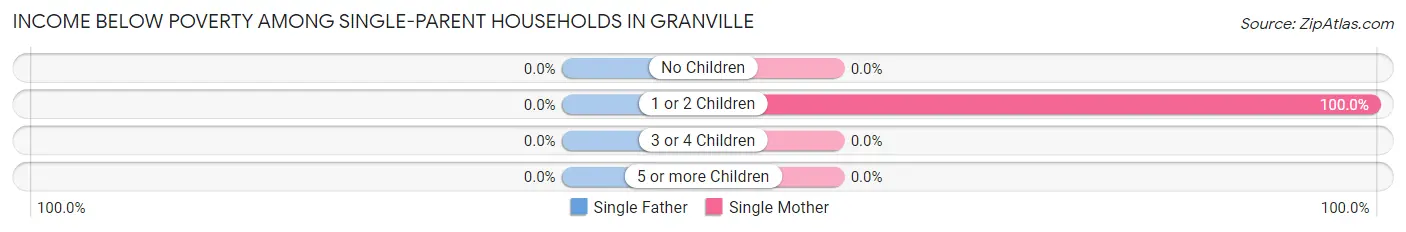
| Children | Single Father | Single Mother |
| No Children | 0 (0.0%) | 0 (0.0%) |
| 1 or 2 Children | 0 (0.0%) | 1 (100.0%) |
| 3 or 4 Children | 0 (0.0%) | 0 (0.0%) |
| 5 or more Children | 0 (0.0%) | 0 (0.0%) |
| Total | 0 (0.0%) | 1 (12.5%) |
Income Below Poverty Among Married-Couple vs Single-Parent Households in Granville
The poverty data for Granville shows that 4 of the married-couple family households (5.4%) and 1 of the single-parent households (10.0%) are living below the poverty level. Within the married-couple family households, those with 5 or more children have the highest poverty rate, with 4 households (100.0%) falling below the poverty line. Among the single-parent households, those with 1 or 2 children have the highest poverty rate, with 1 household (33.3%) living below poverty.
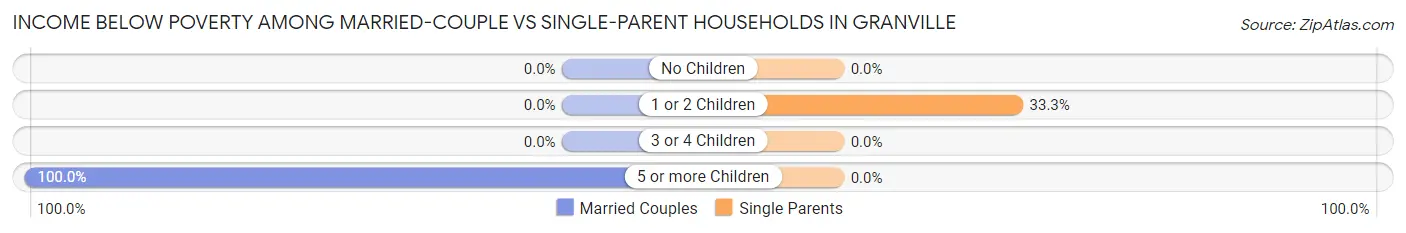
| Children | Married-Couple Families | Single-Parent Households |
| No Children | 0 (0.0%) | 0 (0.0%) |
| 1 or 2 Children | 0 (0.0%) | 1 (33.3%) |
| 3 or 4 Children | 0 (0.0%) | 0 (0.0%) |
| 5 or more Children | 4 (100.0%) | 0 (0.0%) |
| Total | 4 (5.4%) | 1 (10.0%) |
Race in Granville
The most populous races in Granville are White / Caucasian (278 | 96.9%), Hispanic or Latino (38 | 13.2%), and Two or more Races (6 | 2.1%).
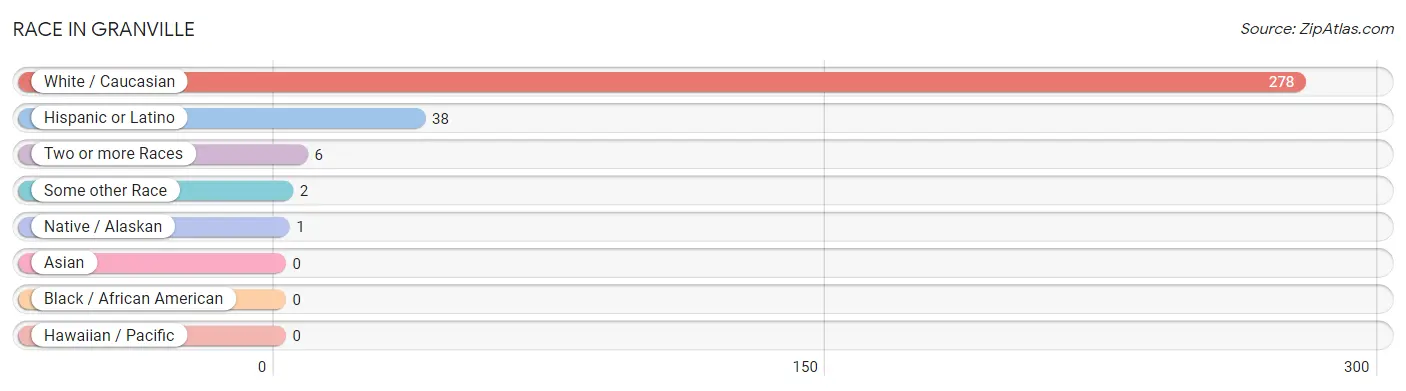
| Race | # Population | % Population |
| Asian | 0 | 0.0% |
| Black / African American | 0 | 0.0% |
| Hawaiian / Pacific | 0 | 0.0% |
| Hispanic or Latino | 38 | 13.2% |
| Native / Alaskan | 1 | 0.4% |
| White / Caucasian | 278 | 96.9% |
| Two or more Races | 6 | 2.1% |
| Some other Race | 2 | 0.7% |
| Total | 287 | 100.0% |
Ancestry in Granville
The most populous ancestries reported in Granville are German (152 | 53.0%), Central American (32 | 11.2%), Luxembourger (31 | 10.8%), Guatemalan (30 | 10.4%), and Dutch (23 | 8.0%), together accounting for 93.4% of all Granville residents.
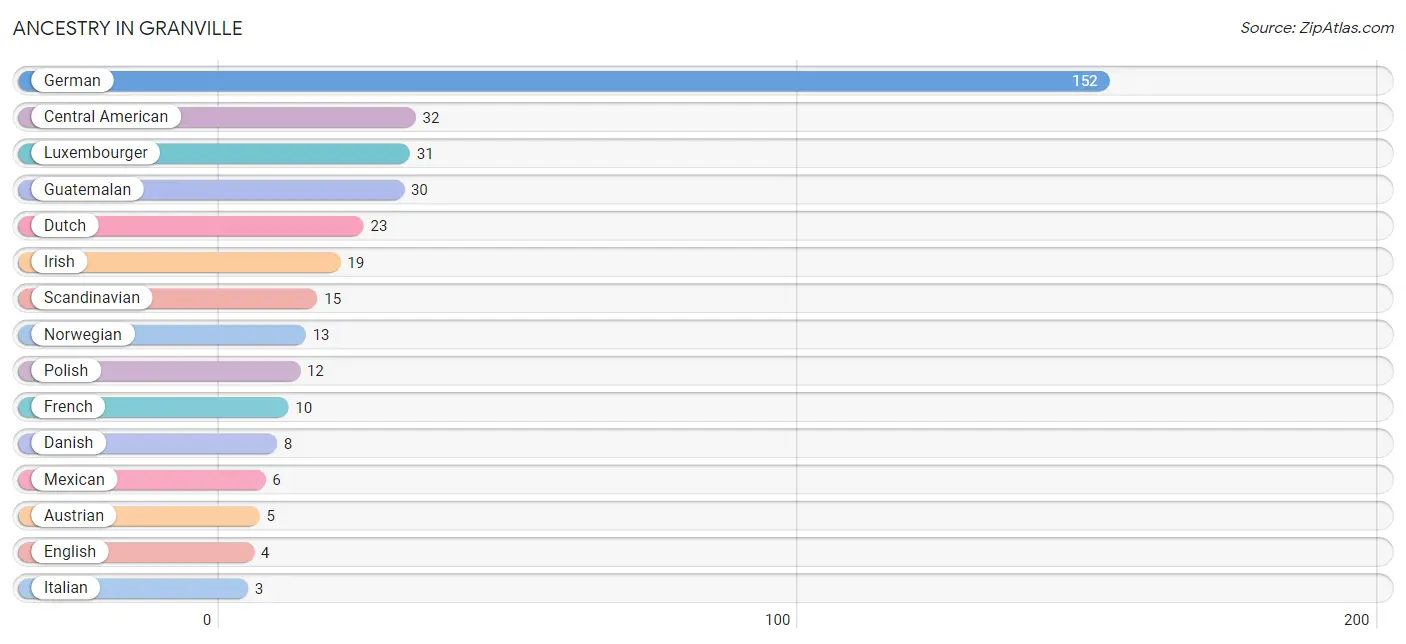
| Ancestry | # Population | % Population |
| American | 2 | 0.7% |
| Austrian | 5 | 1.7% |
| Belgian | 1 | 0.4% |
| Canadian | 2 | 0.7% |
| Central American | 32 | 11.2% |
| Danish | 8 | 2.8% |
| Dutch | 23 | 8.0% |
| English | 4 | 1.4% |
| French | 10 | 3.5% |
| German | 152 | 53.0% |
| Guatemalan | 30 | 10.4% |
| Honduran | 2 | 0.7% |
| Irish | 19 | 6.6% |
| Italian | 3 | 1.1% |
| Luxembourger | 31 | 10.8% |
| Mexican | 6 | 2.1% |
| Mexican American Indian | 1 | 0.4% |
| Norwegian | 13 | 4.5% |
| Polish | 12 | 4.2% |
| Russian | 3 | 1.1% |
| Scandinavian | 15 | 5.2% |
| Swiss | 3 | 1.1% |
| Welsh | 1 | 0.4% | View All 23 Rows |
Immigrants in Granville
The most numerous immigrant groups reported in Granville came from Central America (12 | 4.2%), Latin America (12 | 4.2%), Guatemala (9 | 3.1%), Europe (2 | 0.7%), and Germany (2 | 0.7%), together accounting for 12.9% of all Granville residents.
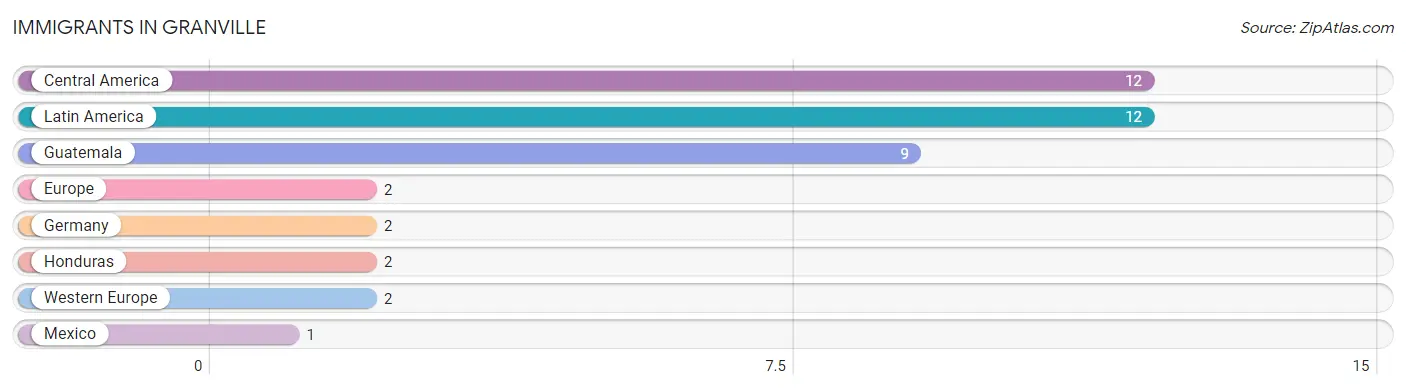
| Immigration Origin | # Population | % Population |
| Central America | 12 | 4.2% |
| Europe | 2 | 0.7% |
| Germany | 2 | 0.7% |
| Guatemala | 9 | 3.1% |
| Honduras | 2 | 0.7% |
| Latin America | 12 | 4.2% |
| Mexico | 1 | 0.4% |
| Western Europe | 2 | 0.7% | View All 8 Rows |
Sex and Age in Granville
Sex and Age in Granville
The most populous age groups in Granville are 65 to 69 Years (19 | 12.9%) for men and 60 to 64 Years (20 | 14.3%) for women.
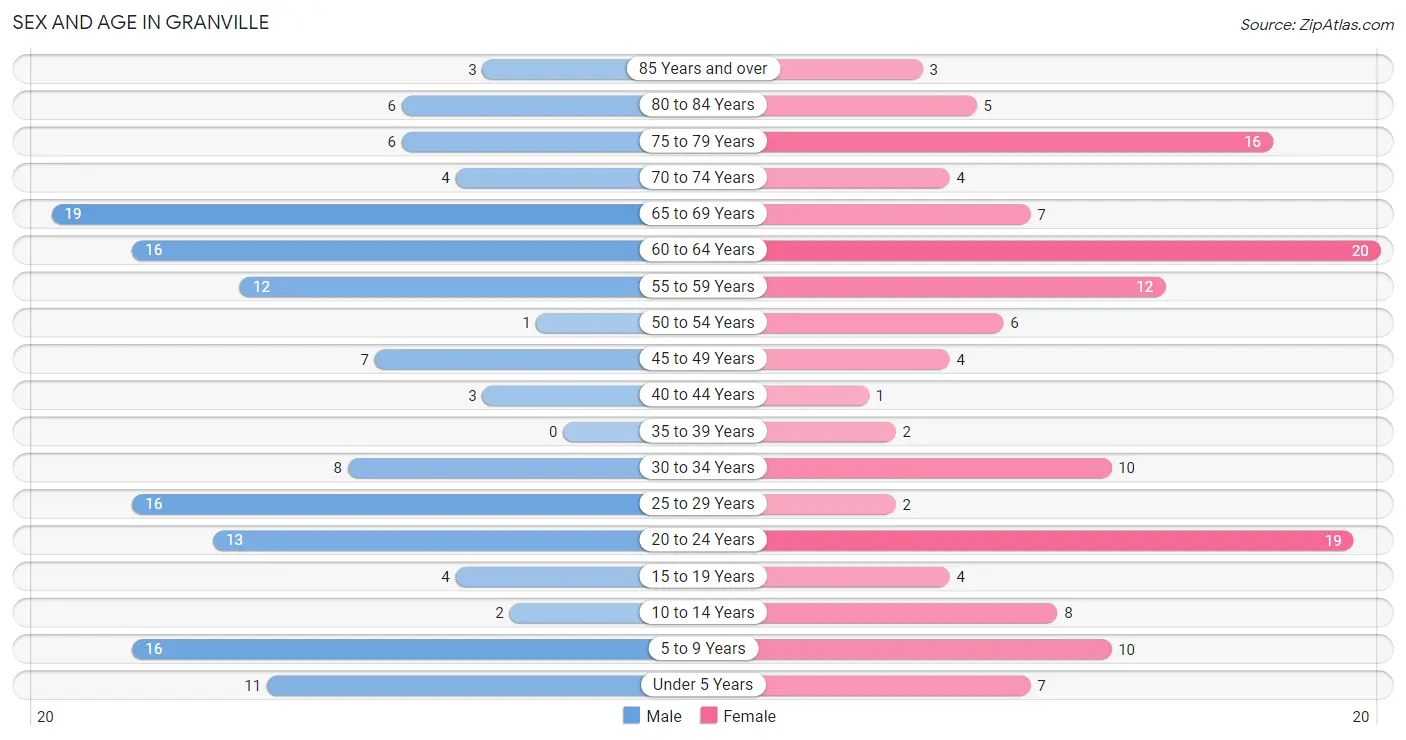
| Age Bracket | Male | Female |
| Under 5 Years | 11 (7.5%) | 7 (5.0%) |
| 5 to 9 Years | 16 (10.9%) | 10 (7.1%) |
| 10 to 14 Years | 2 (1.4%) | 8 (5.7%) |
| 15 to 19 Years | 4 (2.7%) | 4 (2.9%) |
| 20 to 24 Years | 13 (8.8%) | 19 (13.6%) |
| 25 to 29 Years | 16 (10.9%) | 2 (1.4%) |
| 30 to 34 Years | 8 (5.4%) | 10 (7.1%) |
| 35 to 39 Years | 0 (0.0%) | 2 (1.4%) |
| 40 to 44 Years | 3 (2.0%) | 1 (0.7%) |
| 45 to 49 Years | 7 (4.8%) | 4 (2.9%) |
| 50 to 54 Years | 1 (0.7%) | 6 (4.3%) |
| 55 to 59 Years | 12 (8.2%) | 12 (8.6%) |
| 60 to 64 Years | 16 (10.9%) | 20 (14.3%) |
| 65 to 69 Years | 19 (12.9%) | 7 (5.0%) |
| 70 to 74 Years | 4 (2.7%) | 4 (2.9%) |
| 75 to 79 Years | 6 (4.1%) | 16 (11.4%) |
| 80 to 84 Years | 6 (4.1%) | 5 (3.6%) |
| 85 Years and over | 3 (2.0%) | 3 (2.1%) |
| Total | 147 (100.0%) | 140 (100.0%) |
Families and Households in Granville
Median Family Size in Granville
The median family size in Granville is 2.85 persons per family, with single male/father families (2 | 2.4%) accounting for the largest median family size of 6 persons per family. On the other hand, single female/mother families (8 | 9.5%) represent the smallest median family size with 2.50 persons per family.
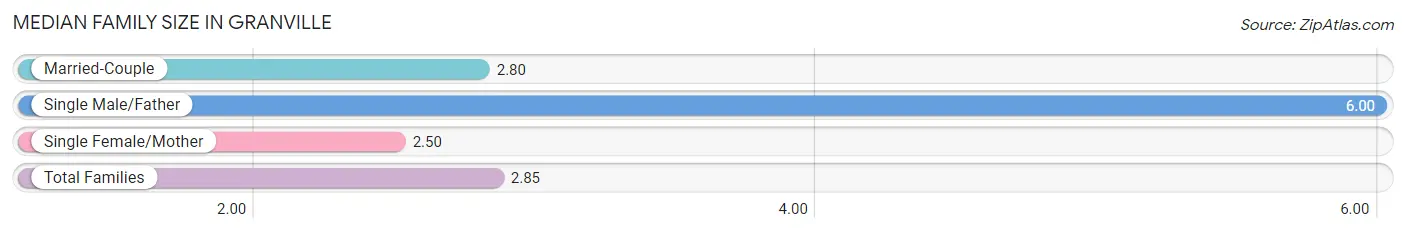
| Family Type | # Families | Family Size |
| Married-Couple | 74 (88.1%) | 2.80 |
| Single Male/Father | 2 (2.4%) | 6.00 |
| Single Female/Mother | 8 (9.5%) | 2.50 |
| Total Families | 84 (100.0%) | 2.85 |
Median Household Size in Granville
The median household size in Granville is 2.24 persons per household, with single male/father households (2 | 1.6%) accounting for the largest median household size of 6 persons per household. non-family households (42 | 33.3%) represent the smallest median household size with 1.02 persons per household.
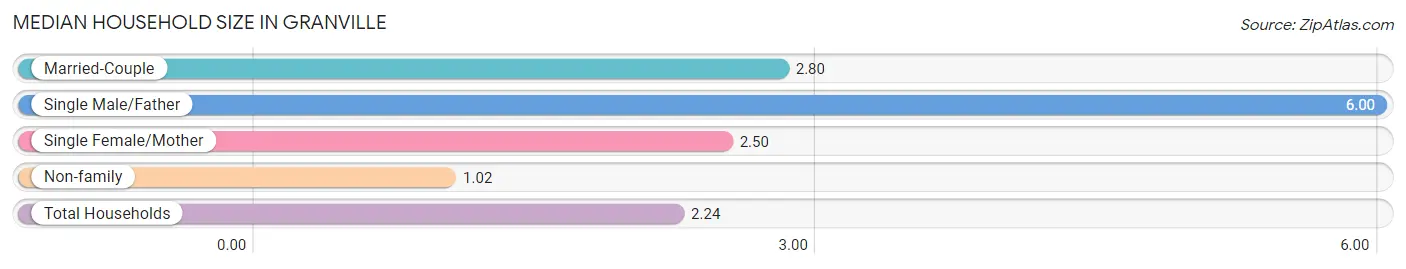
| Household Type | # Households | Household Size |
| Married-Couple | 74 (58.7%) | 2.80 |
| Single Male/Father | 2 (1.6%) | 6.00 |
| Single Female/Mother | 8 (6.4%) | 2.50 |
| Non-family | 42 (33.3%) | 1.02 |
| Total Households | 126 (100.0%) | 2.24 |
Household Size by Marriage Status in Granville
Out of a total of 126 households in Granville, 84 (66.7%) are family households, while 42 (33.3%) are nonfamily households. The most numerous type of family households are 2-person households, comprising 57, and the most common type of nonfamily households are 1-person households, comprising 40.
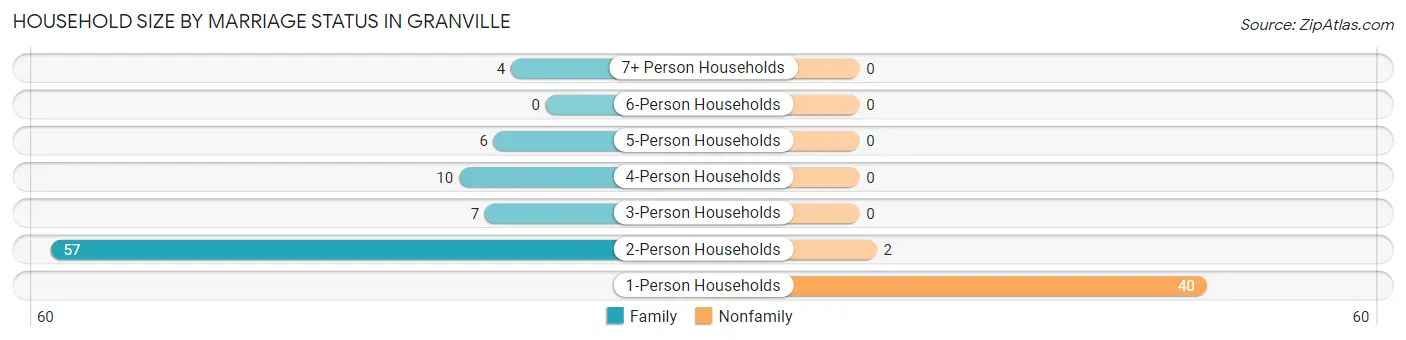
| Household Size | Family Households | Nonfamily Households |
| 1-Person Households | - | 40 (31.8%) |
| 2-Person Households | 57 (45.2%) | 2 (1.6%) |
| 3-Person Households | 7 (5.6%) | 0 (0.0%) |
| 4-Person Households | 10 (7.9%) | 0 (0.0%) |
| 5-Person Households | 6 (4.8%) | 0 (0.0%) |
| 6-Person Households | 0 (0.0%) | 0 (0.0%) |
| 7+ Person Households | 4 (3.2%) | 0 (0.0%) |
| Total | 84 (66.7%) | 42 (33.3%) |
Female Fertility in Granville
Fertility by Age in Granville
Average fertility rate in Granville is 114.0 births per 1,000 women. Women in the age bracket of 20 to 34 years have the highest fertility rate with 161.0 births per 1,000 women. Women in the age bracket of 20 to 34 years acount for 100.0% of all women with births.
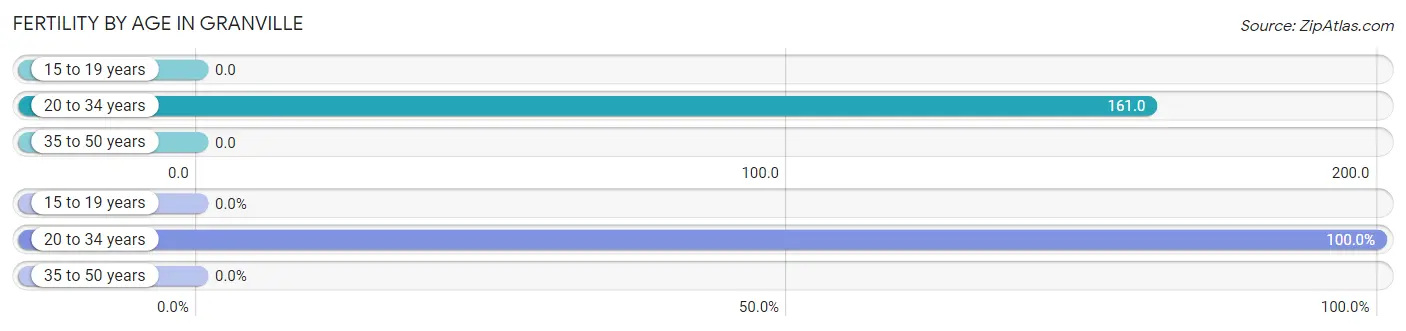
| Age Bracket | Women with Births | Births / 1,000 Women |
| 15 to 19 years | 0 (0.0%) | 0.0 |
| 20 to 34 years | 5 (100.0%) | 161.0 |
| 35 to 50 years | 0 (0.0%) | 0.0 |
| Total | 5 (100.0%) | 114.0 |
Fertility by Age by Marriage Status in Granville
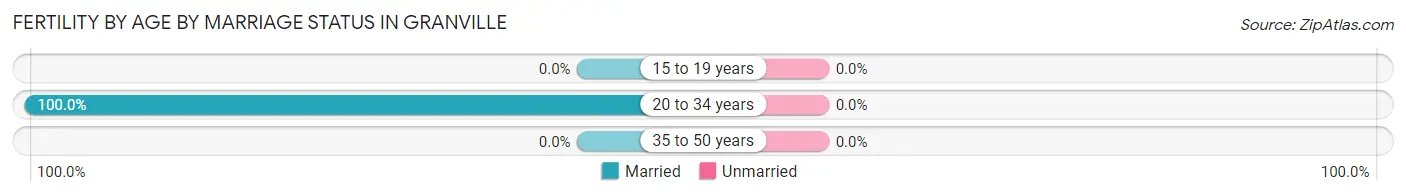
| Age Bracket | Married | Unmarried |
| 15 to 19 years | 0 (0.0%) | 0 (0.0%) |
| 20 to 34 years | 5 (100.0%) | 0 (0.0%) |
| 35 to 50 years | 0 (0.0%) | 0 (0.0%) |
| Total | 5 (100.0%) | 0 (0.0%) |
Fertility by Education in Granville
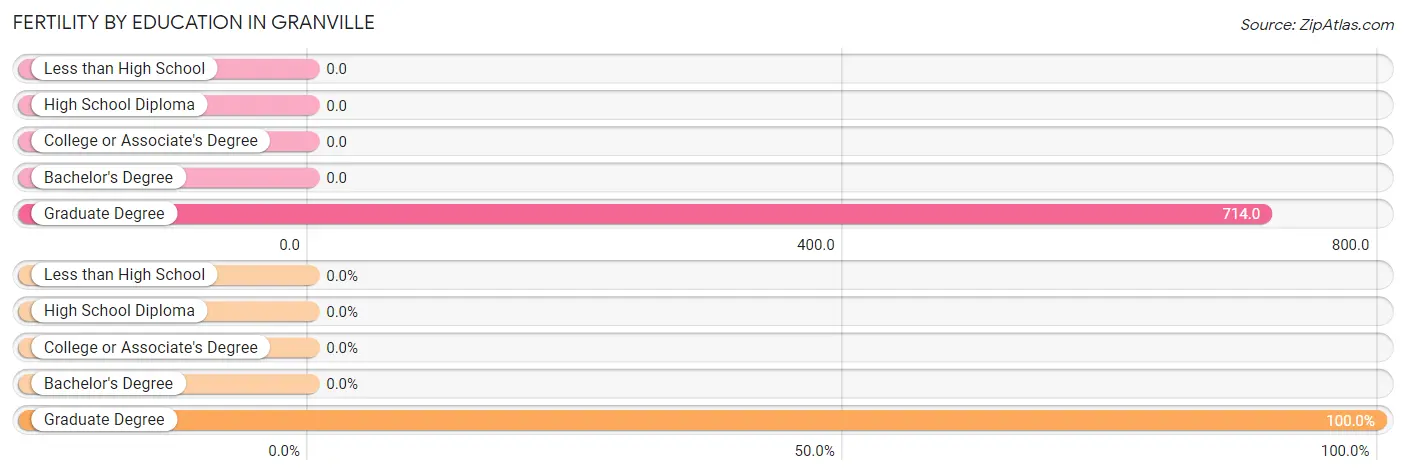
| Educational Attainment | Women with Births | Births / 1,000 Women |
| Less than High School | 0 (0.0%) | 0.0 |
| High School Diploma | 0 (0.0%) | 0.0 |
| College or Associate's Degree | 0 (0.0%) | 0.0 |
| Bachelor's Degree | 0 (0.0%) | 0.0 |
| Graduate Degree | 5 (100.0%) | 714.0 |
| Total | 5 (100.0%) | 114.0 |
Fertility by Education by Marriage Status in Granville
| Educational Attainment | Married | Unmarried |
| Less than High School | 0 (0.0%) | 0 (0.0%) |
| High School Diploma | 0 (0.0%) | 0 (0.0%) |
| College or Associate's Degree | 0 (0.0%) | 0 (0.0%) |
| Bachelor's Degree | 0 (0.0%) | 0 (0.0%) |
| Graduate Degree | 5 (100.0%) | 0 (0.0%) |
| Total | 5 (100.0%) | 0 (0.0%) |
Employment Characteristics in Granville
Employment by Class of Employer in Granville
Among the 138 employed individuals in Granville, private company employees (102 | 73.9%), self-employed (not incorporated) (10 | 7.2%), and local government employees (9 | 6.5%) make up the most common classes of employment.
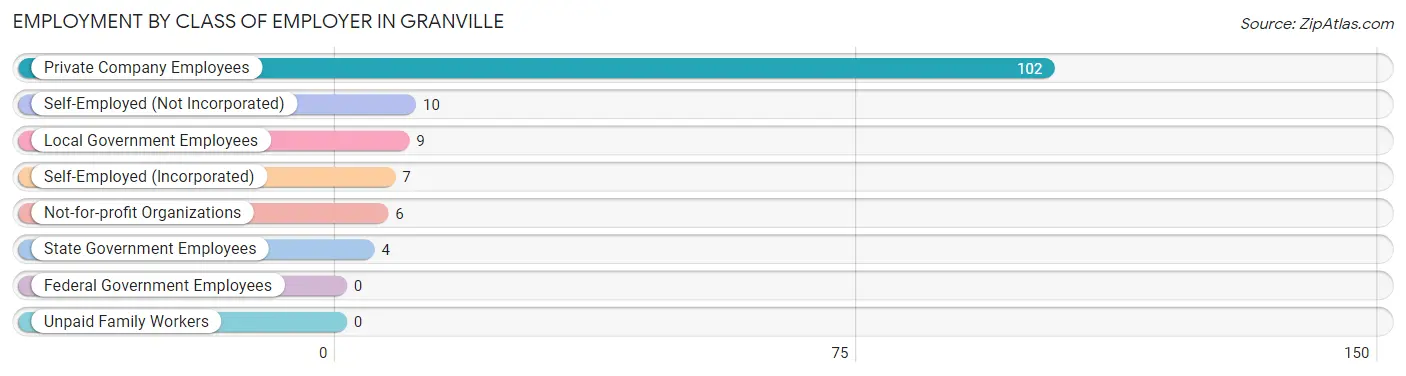
| Employer Class | # Employees | % Employees |
| Private Company Employees | 102 | 73.9% |
| Self-Employed (Incorporated) | 7 | 5.1% |
| Self-Employed (Not Incorporated) | 10 | 7.2% |
| Not-for-profit Organizations | 6 | 4.3% |
| Local Government Employees | 9 | 6.5% |
| State Government Employees | 4 | 2.9% |
| Federal Government Employees | 0 | 0.0% |
| Unpaid Family Workers | 0 | 0.0% |
| Total | 138 | 100.0% |
Employment Status by Age in Granville
According to the labor force statistics for Granville, out of the total population over 16 years of age (231), 61.0% or 141 individuals are in the labor force, with 0.7% or 1 of them unemployed. The age group with the highest labor force participation rate is 25 to 29 years, with 100.0% or 18 individuals in the labor force. Within the labor force, the 20 to 24 years age range has the highest percentage of unemployed individuals, with 3.3% or 1 of them being unemployed.
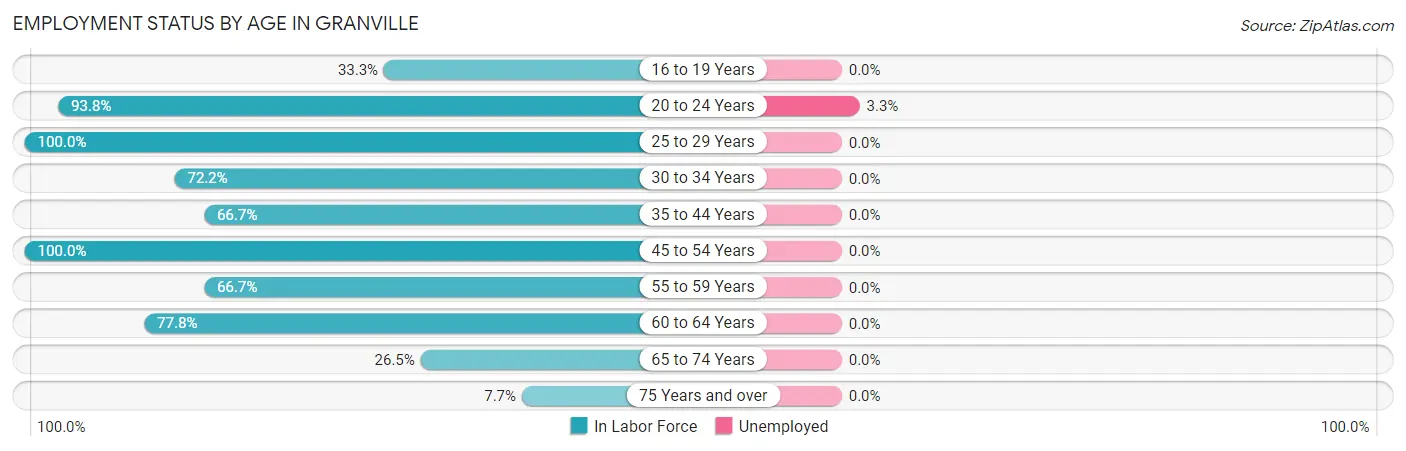
| Age Bracket | In Labor Force | Unemployed |
| 16 to 19 Years | 2 (33.3%) | 0 (0.0%) |
| 20 to 24 Years | 30 (93.8%) | 1 (3.3%) |
| 25 to 29 Years | 18 (100.0%) | 0 (0.0%) |
| 30 to 34 Years | 13 (72.2%) | 0 (0.0%) |
| 35 to 44 Years | 4 (66.7%) | 0 (0.0%) |
| 45 to 54 Years | 18 (100.0%) | 0 (0.0%) |
| 55 to 59 Years | 16 (66.7%) | 0 (0.0%) |
| 60 to 64 Years | 28 (77.8%) | 0 (0.0%) |
| 65 to 74 Years | 9 (26.5%) | 0 (0.0%) |
| 75 Years and over | 3 (7.7%) | 0 (0.0%) |
| Total | 141 (61.0%) | 1 (0.7%) |
Employment Status by Educational Attainment in Granville
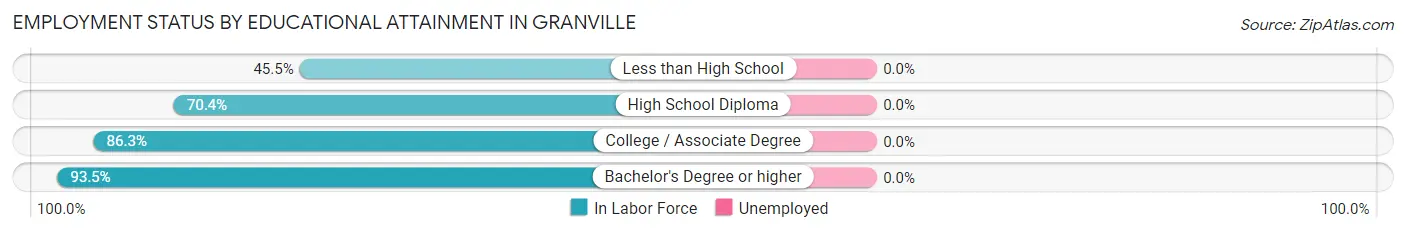
| Educational Attainment | In Labor Force | Unemployed |
| Less than High School | 5 (45.5%) | 0 (0.0%) |
| High School Diploma | 19 (70.4%) | 0 (0.0%) |
| College / Associate Degree | 44 (86.3%) | 0 (0.0%) |
| Bachelor's Degree or higher | 29 (93.5%) | 0 (0.0%) |
| Total | 97 (80.8%) | 0 (0.0%) |
Employment Occupations by Sex in Granville
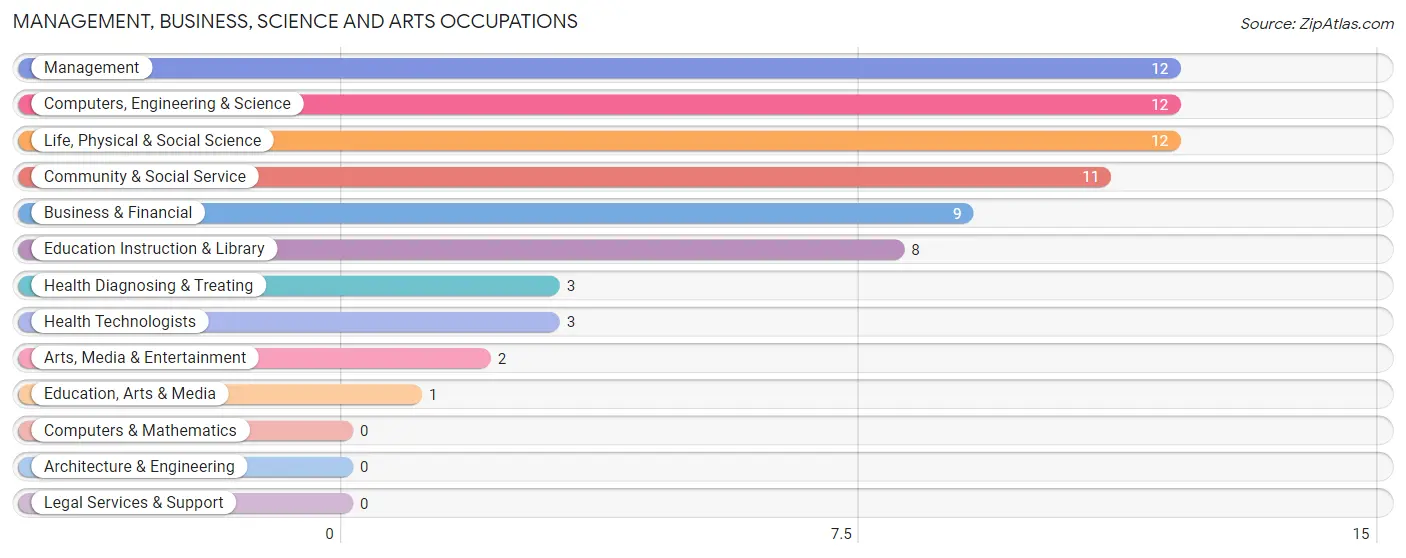
Management, Business, Science and Arts Occupations
The most common Management, Business, Science and Arts occupations in Granville are Management (12 | 8.6%), Computers, Engineering & Science (12 | 8.6%), Life, Physical & Social Science (12 | 8.6%), Community & Social Service (11 | 7.9%), and Business & Financial (9 | 6.4%).
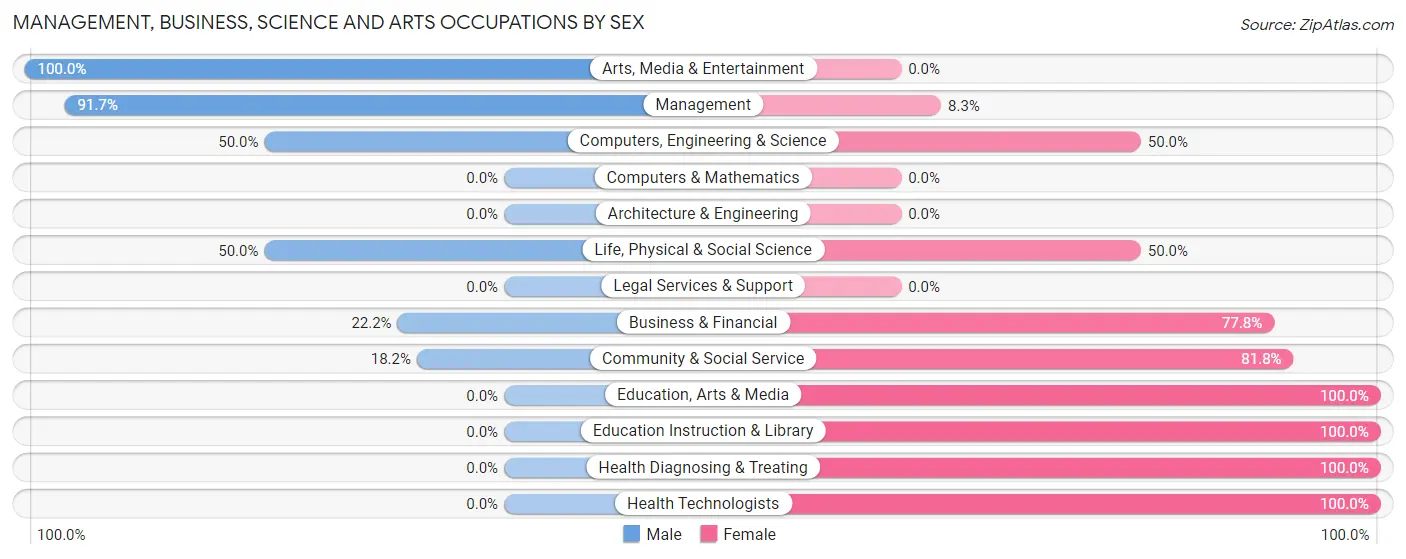
Management, Business, Science and Arts Occupations by Sex
Within the Management, Business, Science and Arts occupations in Granville, the most male-oriented occupations are Arts, Media & Entertainment (100.0%), Management (91.7%), and Computers, Engineering & Science (50.0%), while the most female-oriented occupations are Education, Arts & Media (100.0%), Education Instruction & Library (100.0%), and Health Diagnosing & Treating (100.0%).
| Occupation | Male | Female |
| Management | 11 (91.7%) | 1 (8.3%) |
| Business & Financial | 2 (22.2%) | 7 (77.8%) |
| Computers, Engineering & Science | 6 (50.0%) | 6 (50.0%) |
| Computers & Mathematics | 0 (0.0%) | 0 (0.0%) |
| Architecture & Engineering | 0 (0.0%) | 0 (0.0%) |
| Life, Physical & Social Science | 6 (50.0%) | 6 (50.0%) |
| Community & Social Service | 2 (18.2%) | 9 (81.8%) |
| Education, Arts & Media | 0 (0.0%) | 1 (100.0%) |
| Legal Services & Support | 0 (0.0%) | 0 (0.0%) |
| Education Instruction & Library | 0 (0.0%) | 8 (100.0%) |
| Arts, Media & Entertainment | 2 (100.0%) | 0 (0.0%) |
| Health Diagnosing & Treating | 0 (0.0%) | 3 (100.0%) |
| Health Technologists | 0 (0.0%) | 3 (100.0%) |
| Total (Category) | 21 (44.7%) | 26 (55.3%) |
| Total (Overall) | 78 (55.7%) | 62 (44.3%) |
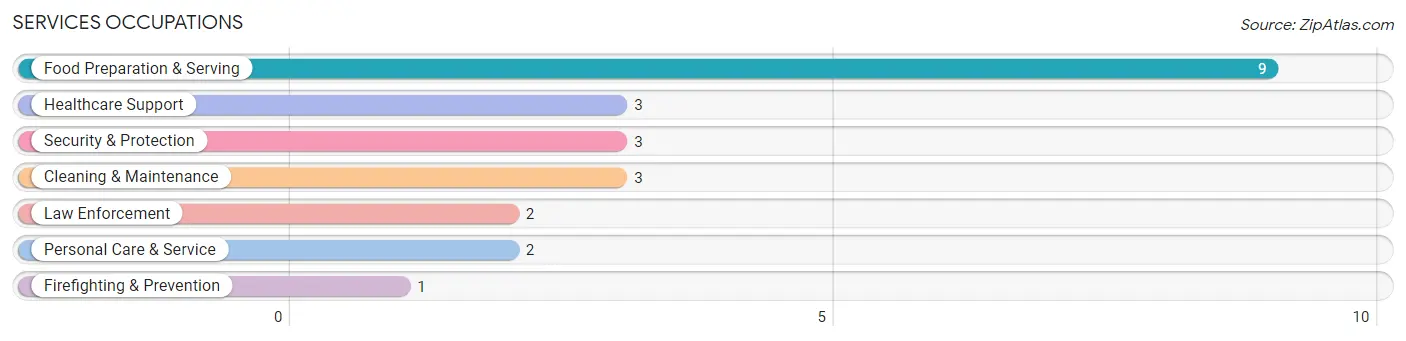
Services Occupations
The most common Services occupations in Granville are Food Preparation & Serving (9 | 6.4%), Healthcare Support (3 | 2.1%), Security & Protection (3 | 2.1%), Cleaning & Maintenance (3 | 2.1%), and Law Enforcement (2 | 1.4%).
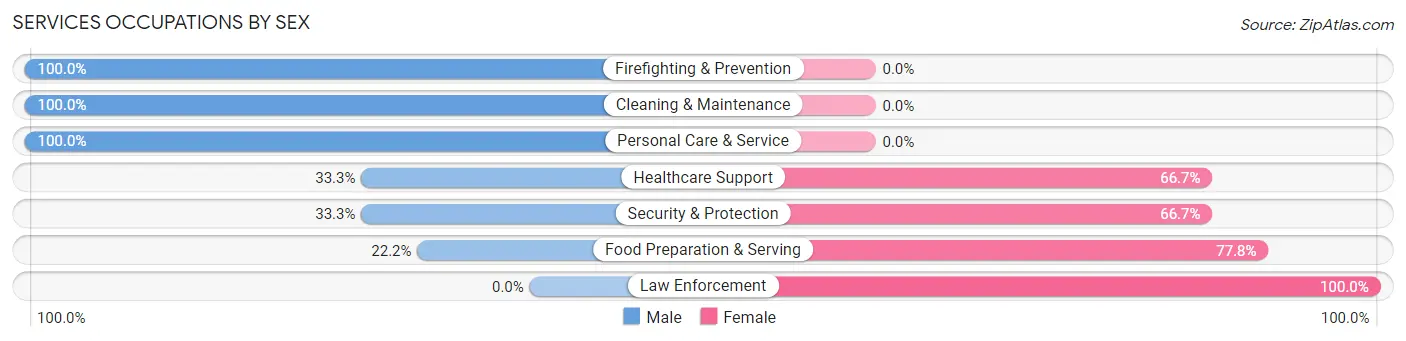
Services Occupations by Sex
Within the Services occupations in Granville, the most male-oriented occupations are Firefighting & Prevention (100.0%), Cleaning & Maintenance (100.0%), and Personal Care & Service (100.0%), while the most female-oriented occupations are Law Enforcement (100.0%), Food Preparation & Serving (77.8%), and Healthcare Support (66.7%).
| Occupation | Male | Female |
| Healthcare Support | 1 (33.3%) | 2 (66.7%) |
| Security & Protection | 1 (33.3%) | 2 (66.7%) |
| Firefighting & Prevention | 1 (100.0%) | 0 (0.0%) |
| Law Enforcement | 0 (0.0%) | 2 (100.0%) |
| Food Preparation & Serving | 2 (22.2%) | 7 (77.8%) |
| Cleaning & Maintenance | 3 (100.0%) | 0 (0.0%) |
| Personal Care & Service | 2 (100.0%) | 0 (0.0%) |
| Total (Category) | 9 (45.0%) | 11 (55.0%) |
| Total (Overall) | 78 (55.7%) | 62 (44.3%) |
Sales and Office Occupations
The most common Sales and Office occupations in Granville are Office & Administration (26 | 18.6%), and Sales & Related (13 | 9.3%).

Sales and Office Occupations by Sex

| Occupation | Male | Female |
| Sales & Related | 13 (100.0%) | 0 (0.0%) |
| Office & Administration | 7 (26.9%) | 19 (73.1%) |
| Total (Category) | 20 (51.3%) | 19 (48.7%) |
| Total (Overall) | 78 (55.7%) | 62 (44.3%) |
Natural Resources, Construction and Maintenance Occupations
The most common Natural Resources, Construction and Maintenance occupations in Granville are Installation, Maintenance & Repair (8 | 5.7%), Farming, Fishing & Forestry (6 | 4.3%), and Construction & Extraction (3 | 2.1%).

Natural Resources, Construction and Maintenance Occupations by Sex
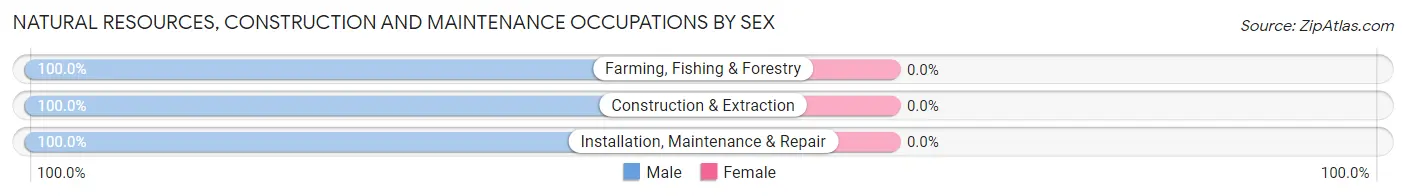
| Occupation | Male | Female |
| Farming, Fishing & Forestry | 6 (100.0%) | 0 (0.0%) |
| Construction & Extraction | 3 (100.0%) | 0 (0.0%) |
| Installation, Maintenance & Repair | 8 (100.0%) | 0 (0.0%) |
| Total (Category) | 17 (100.0%) | 0 (0.0%) |
| Total (Overall) | 78 (55.7%) | 62 (44.3%) |
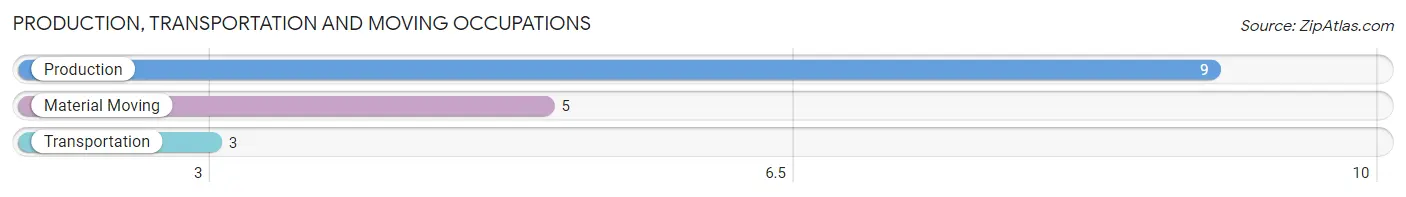
Production, Transportation and Moving Occupations
The most common Production, Transportation and Moving occupations in Granville are Production (9 | 6.4%), Material Moving (5 | 3.6%), and Transportation (3 | 2.1%).
Production, Transportation and Moving Occupations by Sex
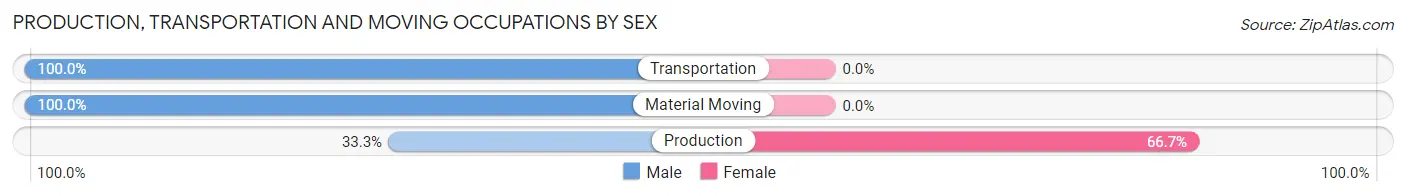
| Occupation | Male | Female |
| Production | 3 (33.3%) | 6 (66.7%) |
| Transportation | 3 (100.0%) | 0 (0.0%) |
| Material Moving | 5 (100.0%) | 0 (0.0%) |
| Total (Category) | 11 (64.7%) | 6 (35.3%) |
| Total (Overall) | 78 (55.7%) | 62 (44.3%) |
Employment Industries by Sex in Granville
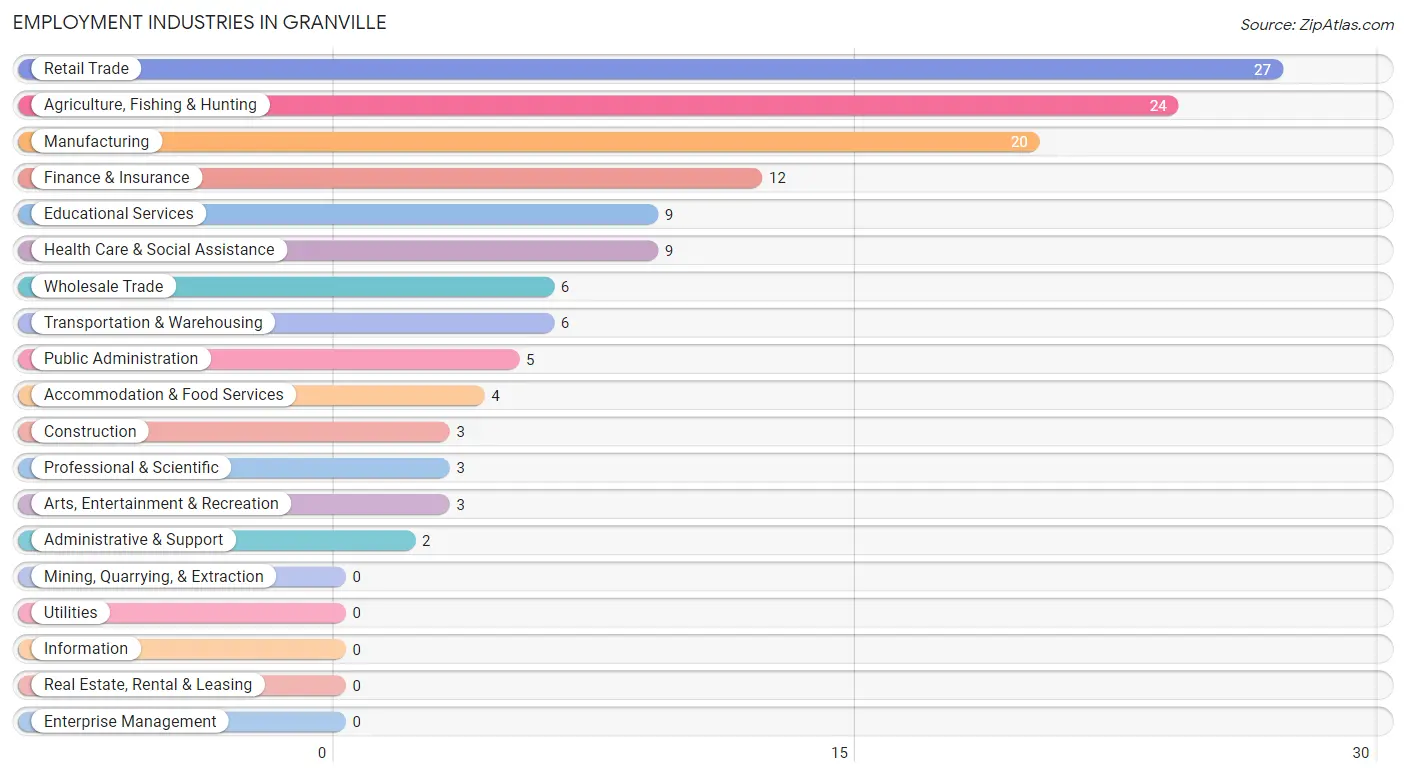
Employment Industries in Granville
The major employment industries in Granville include Retail Trade (27 | 19.3%), Agriculture, Fishing & Hunting (24 | 17.1%), Manufacturing (20 | 14.3%), Finance & Insurance (12 | 8.6%), and Educational Services (9 | 6.4%).
Employment Industries by Sex in Granville
The Granville industries that see more men than women are Construction (100.0%), Wholesale Trade (100.0%), and Professional & Scientific (100.0%), whereas the industries that tend to have a higher number of women are Transportation & Warehousing (100.0%), Educational Services (100.0%), and Health Care & Social Assistance (88.9%).
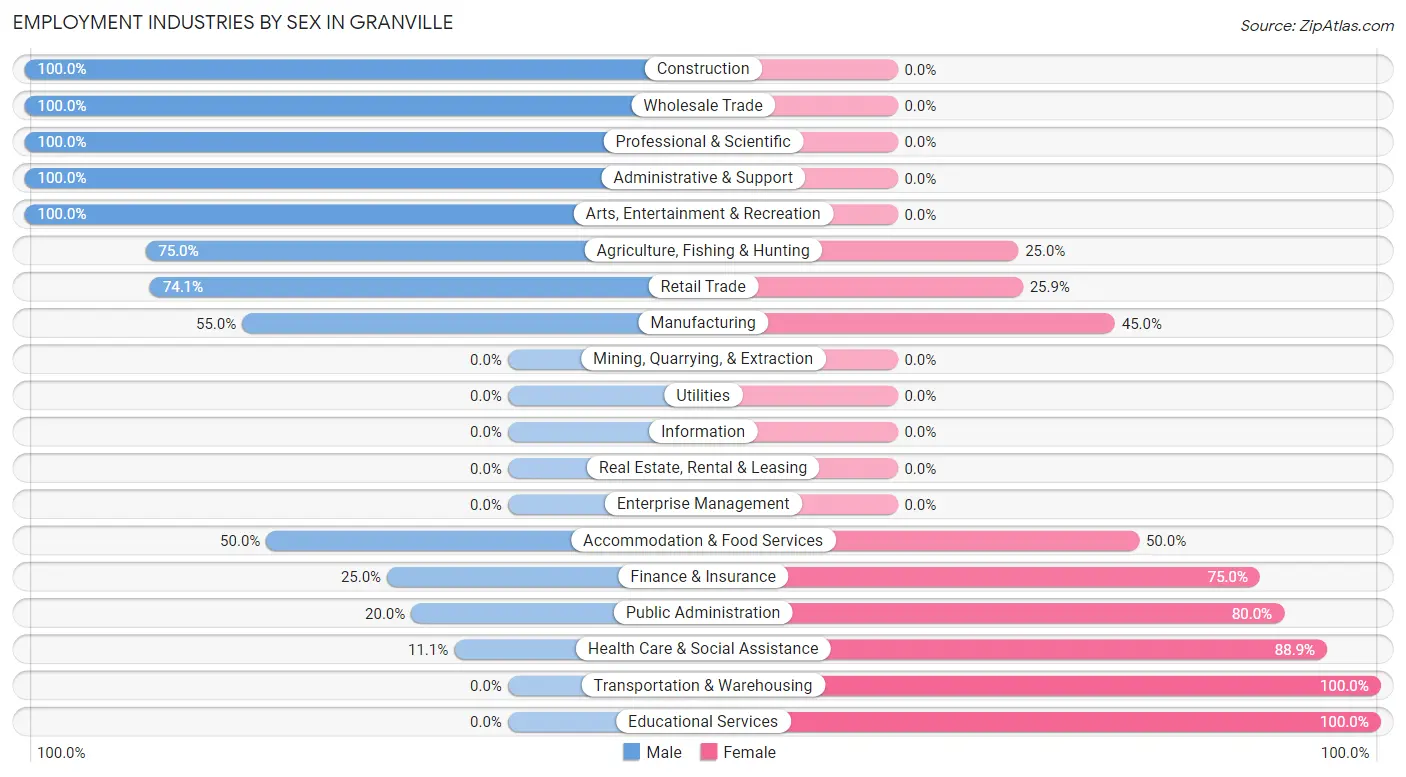
| Industry | Male | Female |
| Agriculture, Fishing & Hunting | 18 (75.0%) | 6 (25.0%) |
| Mining, Quarrying, & Extraction | 0 (0.0%) | 0 (0.0%) |
| Construction | 3 (100.0%) | 0 (0.0%) |
| Manufacturing | 11 (55.0%) | 9 (45.0%) |
| Wholesale Trade | 6 (100.0%) | 0 (0.0%) |
| Retail Trade | 20 (74.1%) | 7 (25.9%) |
| Transportation & Warehousing | 0 (0.0%) | 6 (100.0%) |
| Utilities | 0 (0.0%) | 0 (0.0%) |
| Information | 0 (0.0%) | 0 (0.0%) |
| Finance & Insurance | 3 (25.0%) | 9 (75.0%) |
| Real Estate, Rental & Leasing | 0 (0.0%) | 0 (0.0%) |
| Professional & Scientific | 3 (100.0%) | 0 (0.0%) |
| Enterprise Management | 0 (0.0%) | 0 (0.0%) |
| Administrative & Support | 2 (100.0%) | 0 (0.0%) |
| Educational Services | 0 (0.0%) | 9 (100.0%) |
| Health Care & Social Assistance | 1 (11.1%) | 8 (88.9%) |
| Arts, Entertainment & Recreation | 3 (100.0%) | 0 (0.0%) |
| Accommodation & Food Services | 2 (50.0%) | 2 (50.0%) |
| Public Administration | 1 (20.0%) | 4 (80.0%) |
| Total | 78 (55.7%) | 62 (44.3%) |
Education in Granville
School Enrollment in Granville
The most common levels of schooling among the 49 students in Granville are elementary school (27 | 55.1%), middle school (8 | 16.3%), and high school (8 | 16.3%).
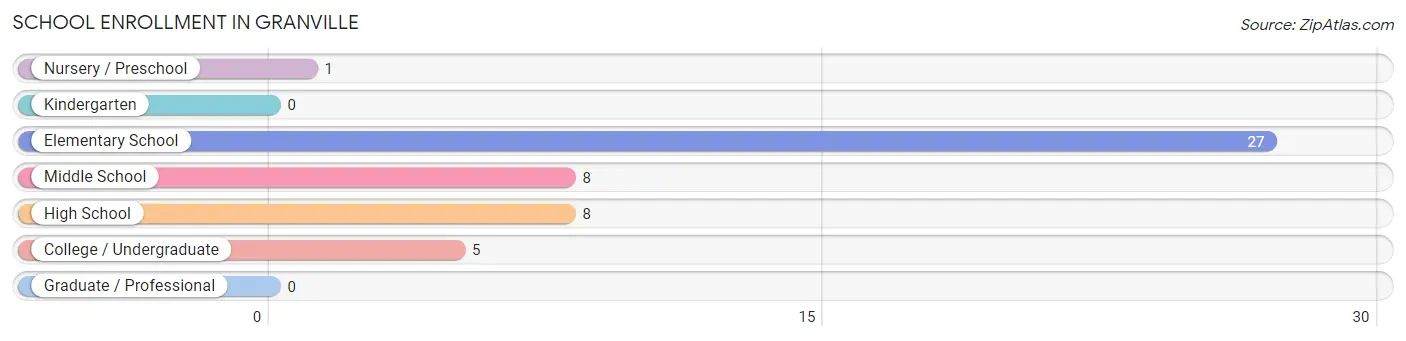
| School Level | # Students | % Students |
| Nursery / Preschool | 1 | 2.0% |
| Kindergarten | 0 | 0.0% |
| Elementary School | 27 | 55.1% |
| Middle School | 8 | 16.3% |
| High School | 8 | 16.3% |
| College / Undergraduate | 5 | 10.2% |
| Graduate / Professional | 0 | 0.0% |
| Total | 49 | 100.0% |
School Enrollment by Age by Funding Source in Granville
Out of a total of 49 students who are enrolled in schools in Granville, 13 (26.5%) attend a private institution, while the remaining 36 (73.5%) are enrolled in public schools. The age group of 20 to 24 year olds has the highest likelihood of being enrolled in private schools, with 3 (60.0% in the age bracket) enrolled. Conversely, the age group of 5 to 9 year old has the lowest likelihood of being enrolled in a private school, with 22 (84.6% in the age bracket) attending a public institution.
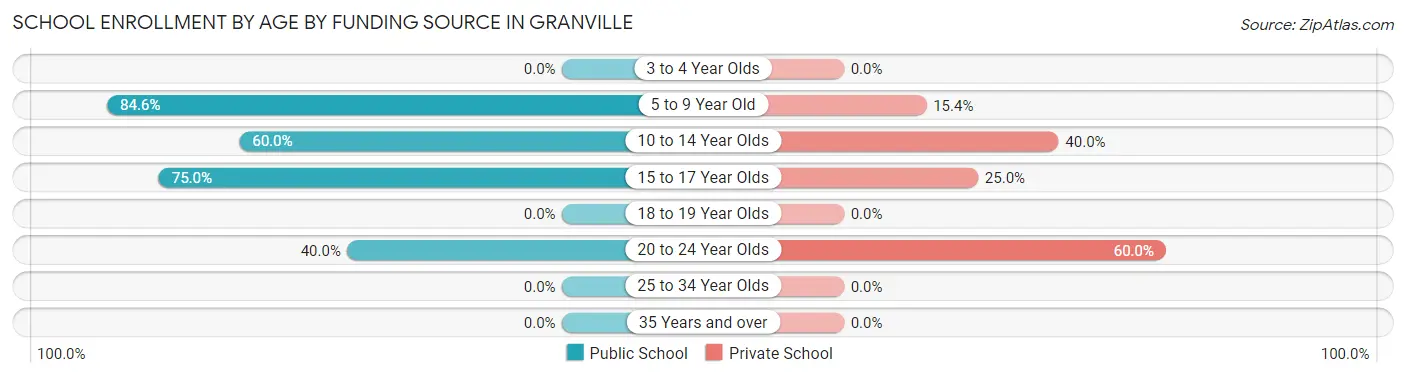
| Age Bracket | Public School | Private School |
| 3 to 4 Year Olds | 0 (0.0%) | 0 (0.0%) |
| 5 to 9 Year Old | 22 (84.6%) | 4 (15.4%) |
| 10 to 14 Year Olds | 6 (60.0%) | 4 (40.0%) |
| 15 to 17 Year Olds | 6 (75.0%) | 2 (25.0%) |
| 18 to 19 Year Olds | 0 (0.0%) | 0 (0.0%) |
| 20 to 24 Year Olds | 2 (40.0%) | 3 (60.0%) |
| 25 to 34 Year Olds | 0 (0.0%) | 0 (0.0%) |
| 35 Years and over | 0 (0.0%) | 0 (0.0%) |
| Total | 36 (73.5%) | 13 (26.5%) |
Educational Attainment by Field of Study in Granville
Business (15 | 35.7%), bio, nature & agricultural (8 | 19.1%), education (8 | 19.1%), literature & languages (4 | 9.5%), and liberal arts & history (3 | 7.1%) are the most common fields of study among 42 individuals in Granville who have obtained a bachelor's degree or higher.
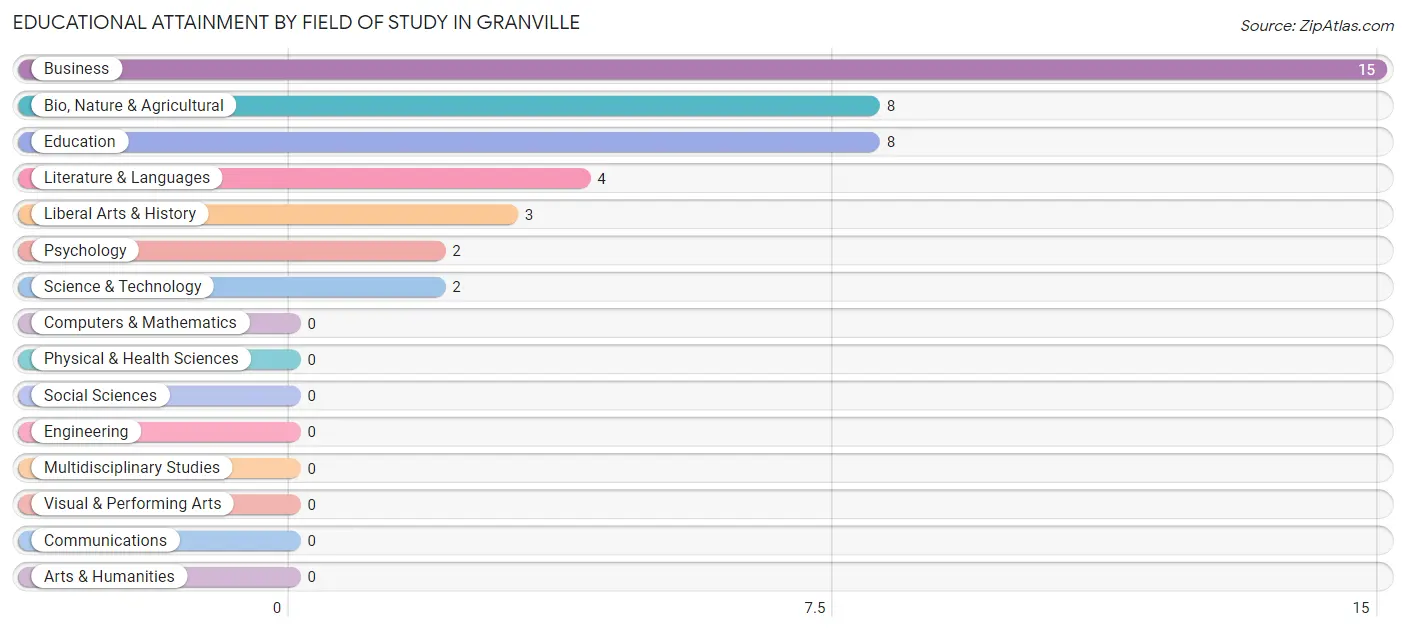
| Field of Study | # Graduates | % Graduates |
| Computers & Mathematics | 0 | 0.0% |
| Bio, Nature & Agricultural | 8 | 19.1% |
| Physical & Health Sciences | 0 | 0.0% |
| Psychology | 2 | 4.8% |
| Social Sciences | 0 | 0.0% |
| Engineering | 0 | 0.0% |
| Multidisciplinary Studies | 0 | 0.0% |
| Science & Technology | 2 | 4.8% |
| Business | 15 | 35.7% |
| Education | 8 | 19.1% |
| Literature & Languages | 4 | 9.5% |
| Liberal Arts & History | 3 | 7.1% |
| Visual & Performing Arts | 0 | 0.0% |
| Communications | 0 | 0.0% |
| Arts & Humanities | 0 | 0.0% |
| Total | 42 | 100.0% |
Transportation & Commute in Granville
Vehicle Availability by Sex in Granville
The most prevalent vehicle ownership categories in Granville are males with 3 vehicles (30, accounting for 39.5%) and females with 3 vehicles (28, making up 49.2%).
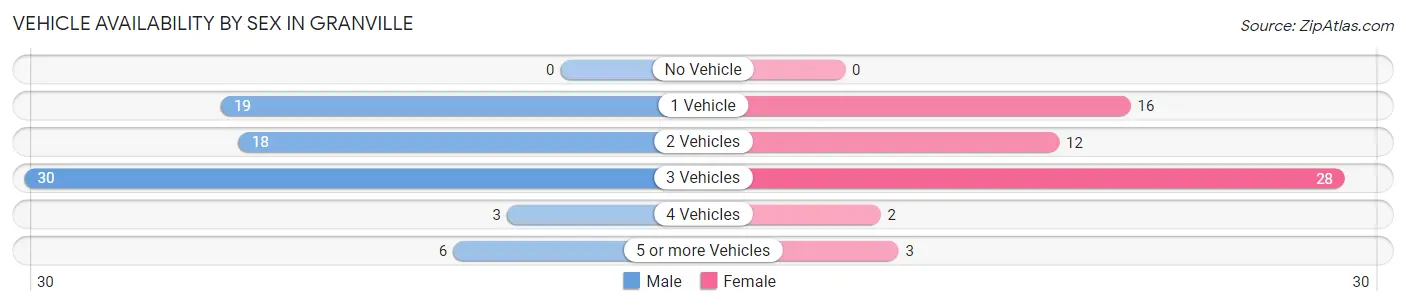
| Vehicles Available | Male | Female |
| No Vehicle | 0 (0.0%) | 0 (0.0%) |
| 1 Vehicle | 19 (25.0%) | 16 (26.2%) |
| 2 Vehicles | 18 (23.7%) | 12 (19.7%) |
| 3 Vehicles | 30 (39.5%) | 28 (45.9%) |
| 4 Vehicles | 3 (4.0%) | 2 (3.3%) |
| 5 or more Vehicles | 6 (7.9%) | 3 (4.9%) |
| Total | 76 (100.0%) | 61 (100.0%) |
Commute Time in Granville
The most frequently occuring commute durations in Granville are 15 to 19 minutes (45 commuters, 33.8%), 5 to 9 minutes (22 commuters, 16.5%), and 20 to 24 minutes (22 commuters, 16.5%).
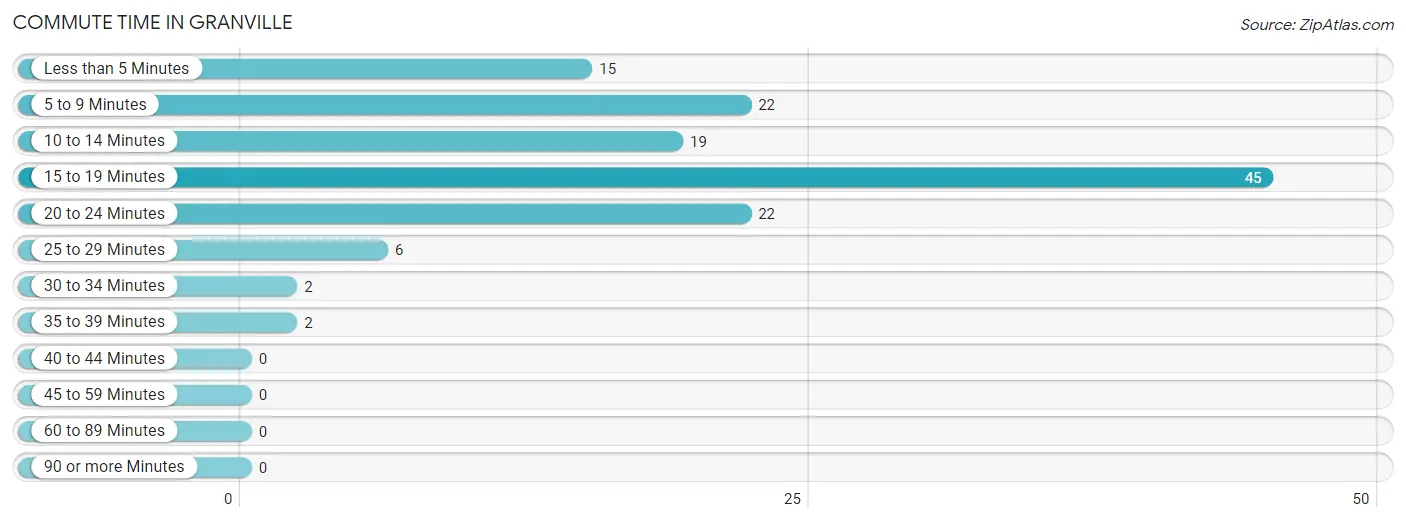
| Commute Time | # Commuters | % Commuters |
| Less than 5 Minutes | 15 | 11.3% |
| 5 to 9 Minutes | 22 | 16.5% |
| 10 to 14 Minutes | 19 | 14.3% |
| 15 to 19 Minutes | 45 | 33.8% |
| 20 to 24 Minutes | 22 | 16.5% |
| 25 to 29 Minutes | 6 | 4.5% |
| 30 to 34 Minutes | 2 | 1.5% |
| 35 to 39 Minutes | 2 | 1.5% |
| 40 to 44 Minutes | 0 | 0.0% |
| 45 to 59 Minutes | 0 | 0.0% |
| 60 to 89 Minutes | 0 | 0.0% |
| 90 or more Minutes | 0 | 0.0% |
Commute Time by Sex in Granville
The most common commute times in Granville are 15 to 19 minutes (20 commuters, 26.3%) for males and 15 to 19 minutes (25 commuters, 43.9%) for females.
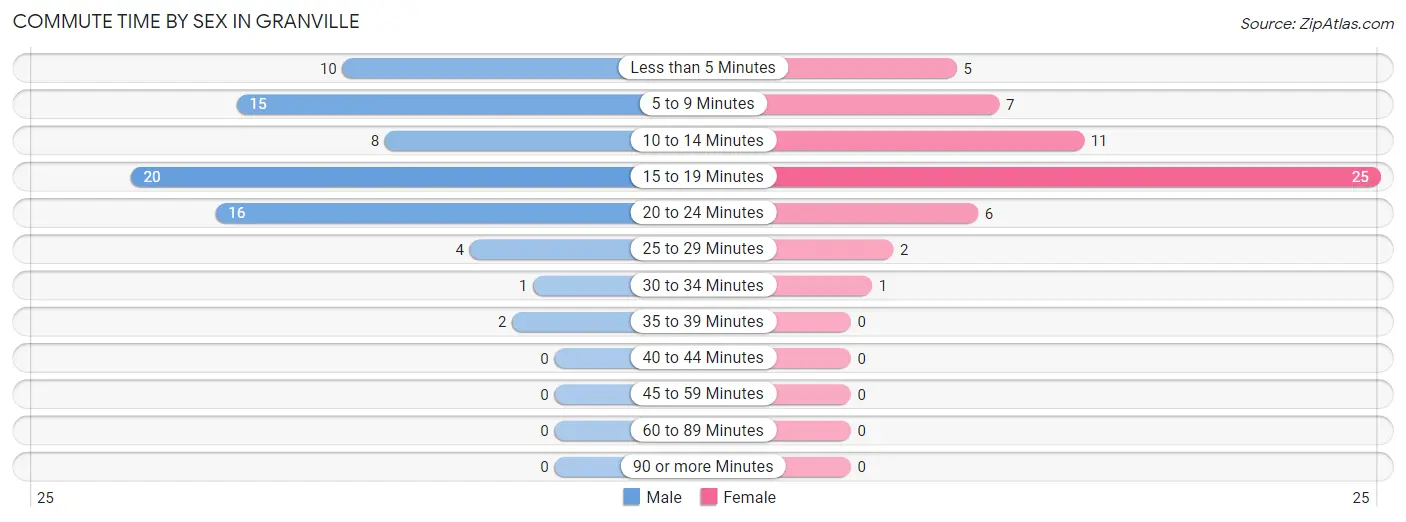
| Commute Time | Male | Female |
| Less than 5 Minutes | 10 (13.2%) | 5 (8.8%) |
| 5 to 9 Minutes | 15 (19.7%) | 7 (12.3%) |
| 10 to 14 Minutes | 8 (10.5%) | 11 (19.3%) |
| 15 to 19 Minutes | 20 (26.3%) | 25 (43.9%) |
| 20 to 24 Minutes | 16 (21.0%) | 6 (10.5%) |
| 25 to 29 Minutes | 4 (5.3%) | 2 (3.5%) |
| 30 to 34 Minutes | 1 (1.3%) | 1 (1.8%) |
| 35 to 39 Minutes | 2 (2.6%) | 0 (0.0%) |
| 40 to 44 Minutes | 0 (0.0%) | 0 (0.0%) |
| 45 to 59 Minutes | 0 (0.0%) | 0 (0.0%) |
| 60 to 89 Minutes | 0 (0.0%) | 0 (0.0%) |
| 90 or more Minutes | 0 (0.0%) | 0 (0.0%) |
Time of Departure to Work by Sex in Granville
The most frequent times of departure to work in Granville are 7:00 AM to 7:29 AM (13, 17.1%) for males and 7:30 AM to 7:59 AM (15, 26.3%) for females.
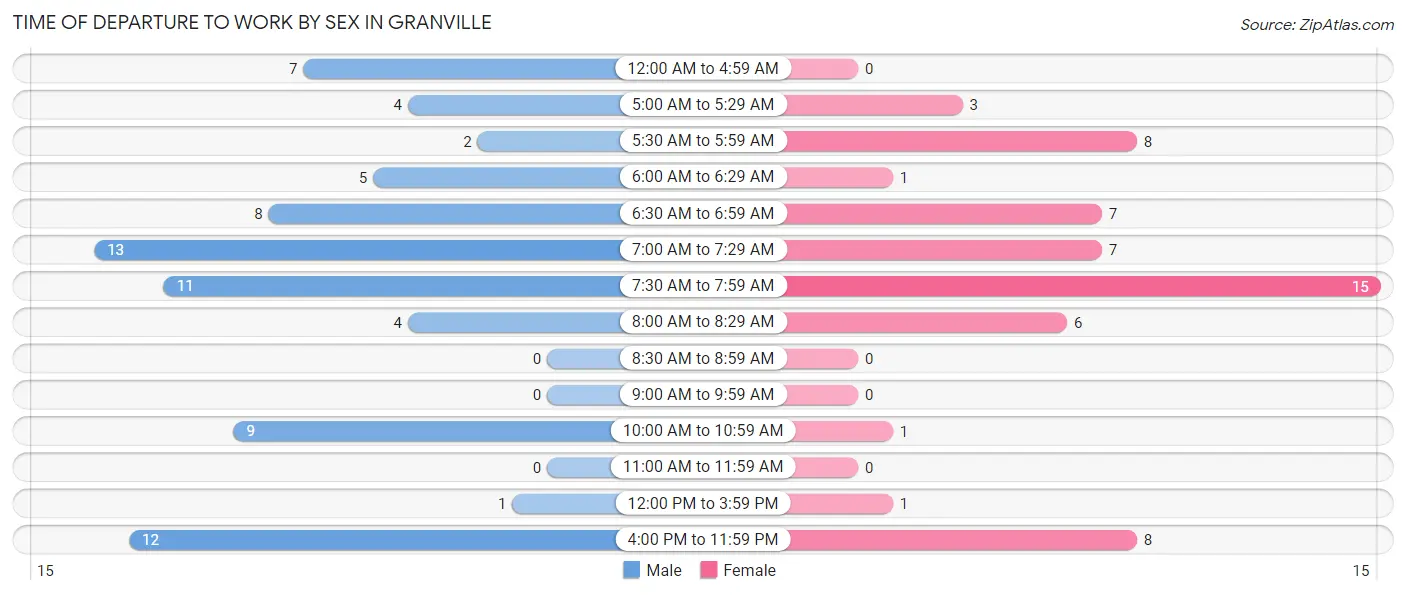
| Time of Departure | Male | Female |
| 12:00 AM to 4:59 AM | 7 (9.2%) | 0 (0.0%) |
| 5:00 AM to 5:29 AM | 4 (5.3%) | 3 (5.3%) |
| 5:30 AM to 5:59 AM | 2 (2.6%) | 8 (14.0%) |
| 6:00 AM to 6:29 AM | 5 (6.6%) | 1 (1.8%) |
| 6:30 AM to 6:59 AM | 8 (10.5%) | 7 (12.3%) |
| 7:00 AM to 7:29 AM | 13 (17.1%) | 7 (12.3%) |
| 7:30 AM to 7:59 AM | 11 (14.5%) | 15 (26.3%) |
| 8:00 AM to 8:29 AM | 4 (5.3%) | 6 (10.5%) |
| 8:30 AM to 8:59 AM | 0 (0.0%) | 0 (0.0%) |
| 9:00 AM to 9:59 AM | 0 (0.0%) | 0 (0.0%) |
| 10:00 AM to 10:59 AM | 9 (11.8%) | 1 (1.8%) |
| 11:00 AM to 11:59 AM | 0 (0.0%) | 0 (0.0%) |
| 12:00 PM to 3:59 PM | 1 (1.3%) | 1 (1.8%) |
| 4:00 PM to 11:59 PM | 12 (15.8%) | 8 (14.0%) |
| Total | 76 (100.0%) | 57 (100.0%) |
Housing Occupancy in Granville
Occupancy by Ownership in Granville
Of the total 126 dwellings in Granville, owner-occupied units account for 104 (82.5%), while renter-occupied units make up 22 (17.5%).
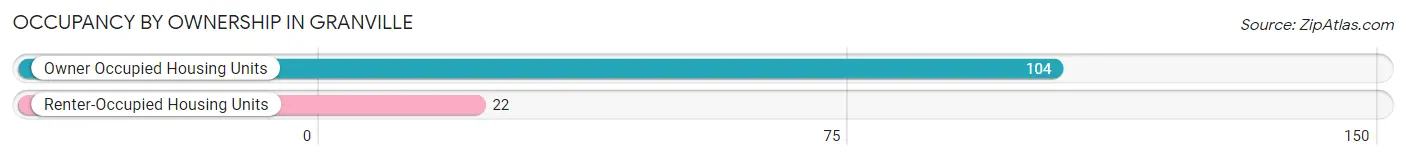
| Occupancy | # Housing Units | % Housing Units |
| Owner Occupied Housing Units | 104 | 82.5% |
| Renter-Occupied Housing Units | 22 | 17.5% |
| Total Occupied Housing Units | 126 | 100.0% |
Occupancy by Household Size in Granville
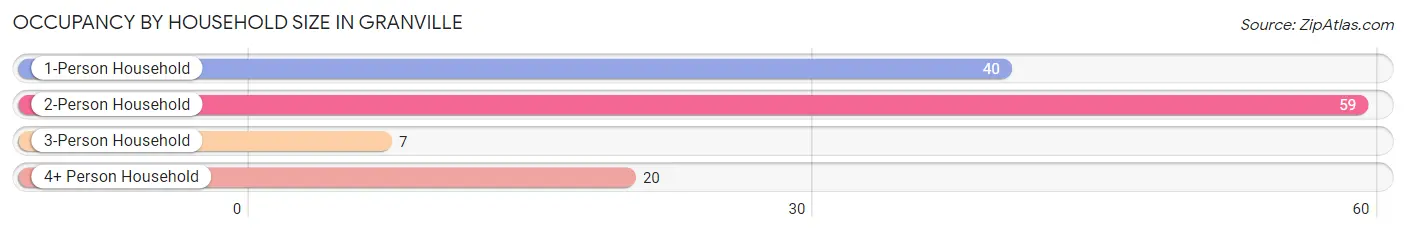
| Household Size | # Housing Units | % Housing Units |
| 1-Person Household | 40 | 31.8% |
| 2-Person Household | 59 | 46.8% |
| 3-Person Household | 7 | 5.6% |
| 4+ Person Household | 20 | 15.9% |
| Total Housing Units | 126 | 100.0% |
Occupancy by Ownership by Household Size in Granville
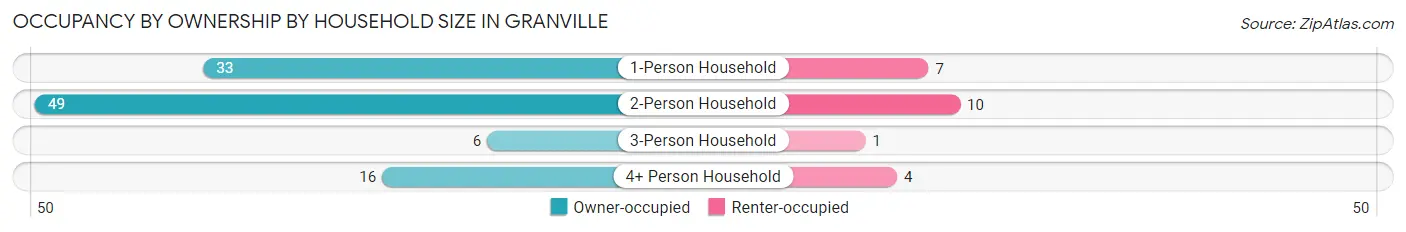
| Household Size | Owner-occupied | Renter-occupied |
| 1-Person Household | 33 (82.5%) | 7 (17.5%) |
| 2-Person Household | 49 (83.1%) | 10 (17.0%) |
| 3-Person Household | 6 (85.7%) | 1 (14.3%) |
| 4+ Person Household | 16 (80.0%) | 4 (20.0%) |
| Total Housing Units | 104 (82.5%) | 22 (17.5%) |
Occupancy by Educational Attainment in Granville
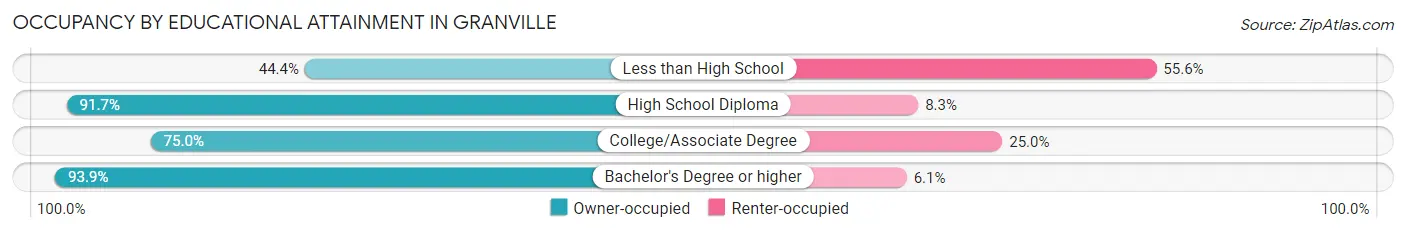
| Household Size | Owner-occupied | Renter-occupied |
| Less than High School | 4 (44.4%) | 5 (55.6%) |
| High School Diploma | 33 (91.7%) | 3 (8.3%) |
| College/Associate Degree | 36 (75.0%) | 12 (25.0%) |
| Bachelor's Degree or higher | 31 (93.9%) | 2 (6.1%) |
Occupancy by Age of Householder in Granville
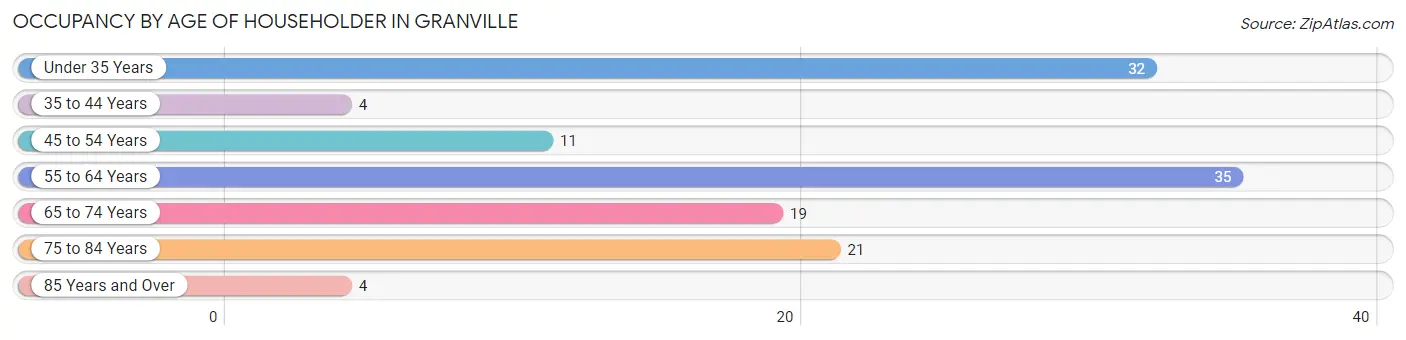
| Age Bracket | # Households | % Households |
| Under 35 Years | 32 | 25.4% |
| 35 to 44 Years | 4 | 3.2% |
| 45 to 54 Years | 11 | 8.7% |
| 55 to 64 Years | 35 | 27.8% |
| 65 to 74 Years | 19 | 15.1% |
| 75 to 84 Years | 21 | 16.7% |
| 85 Years and Over | 4 | 3.2% |
| Total | 126 | 100.0% |
Housing Finances in Granville
Median Income by Occupancy in Granville
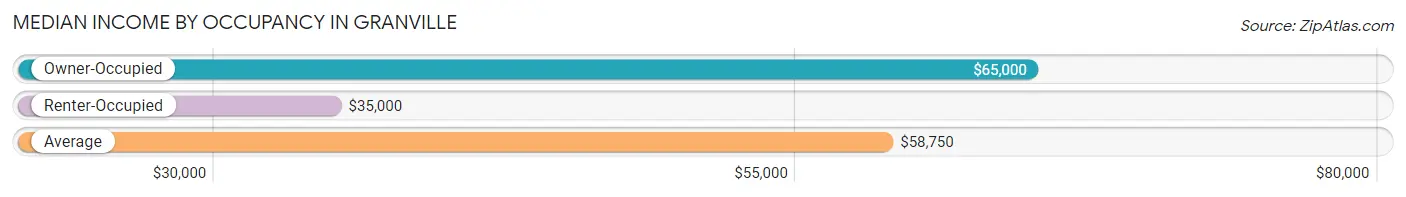
| Occupancy Type | # Households | Median Income |
| Owner-Occupied | 104 (82.5%) | $65,000 |
| Renter-Occupied | 22 (17.5%) | $35,000 |
| Average | 126 (100.0%) | $58,750 |
Occupancy by Householder Income Bracket in Granville
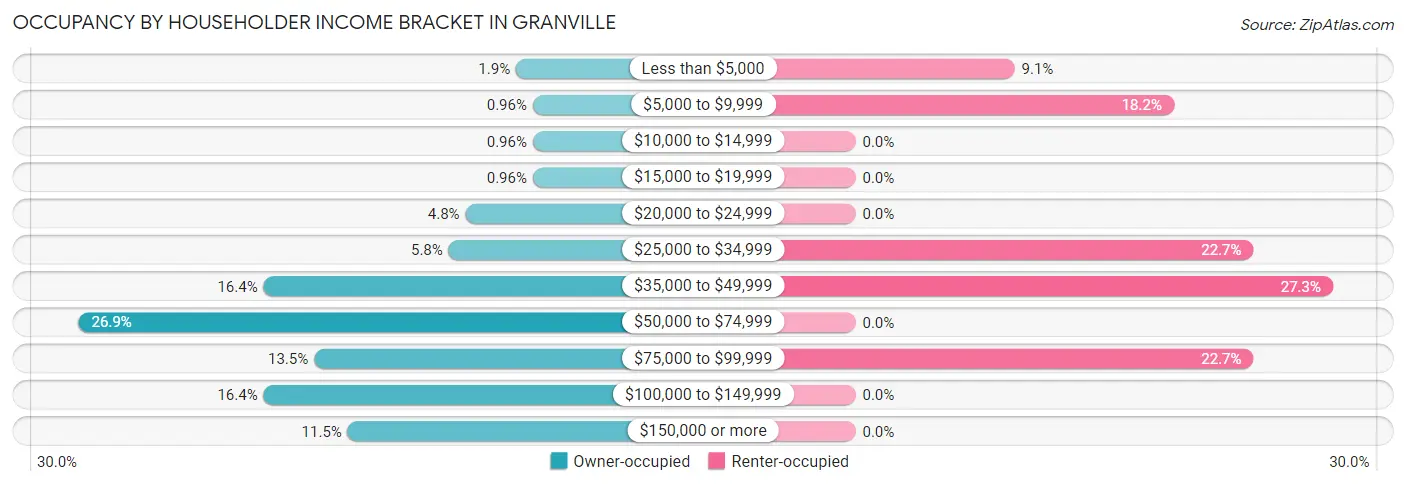
| Income Bracket | Owner-occupied | Renter-occupied |
| Less than $5,000 | 2 (1.9%) | 2 (9.1%) |
| $5,000 to $9,999 | 1 (1.0%) | 4 (18.2%) |
| $10,000 to $14,999 | 1 (1.0%) | 0 (0.0%) |
| $15,000 to $19,999 | 1 (1.0%) | 0 (0.0%) |
| $20,000 to $24,999 | 5 (4.8%) | 0 (0.0%) |
| $25,000 to $34,999 | 6 (5.8%) | 5 (22.7%) |
| $35,000 to $49,999 | 17 (16.4%) | 6 (27.3%) |
| $50,000 to $74,999 | 28 (26.9%) | 0 (0.0%) |
| $75,000 to $99,999 | 14 (13.5%) | 5 (22.7%) |
| $100,000 to $149,999 | 17 (16.4%) | 0 (0.0%) |
| $150,000 or more | 12 (11.5%) | 0 (0.0%) |
| Total | 104 (100.0%) | 22 (100.0%) |
Monthly Housing Cost Tiers in Granville
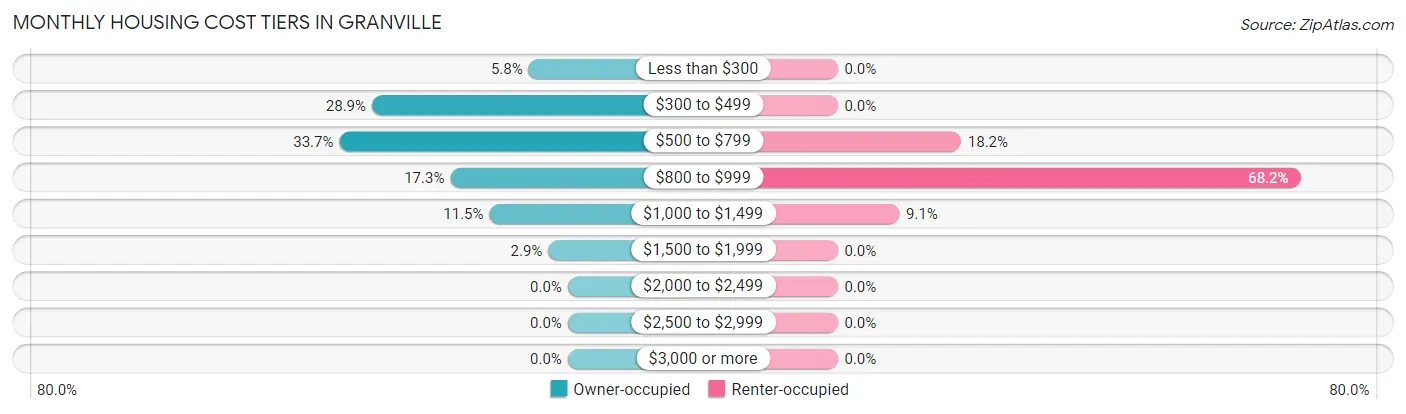
| Monthly Cost | Owner-occupied | Renter-occupied |
| Less than $300 | 6 (5.8%) | 0 (0.0%) |
| $300 to $499 | 30 (28.8%) | 0 (0.0%) |
| $500 to $799 | 35 (33.7%) | 4 (18.2%) |
| $800 to $999 | 18 (17.3%) | 15 (68.2%) |
| $1,000 to $1,499 | 12 (11.5%) | 2 (9.1%) |
| $1,500 to $1,999 | 3 (2.9%) | 0 (0.0%) |
| $2,000 to $2,499 | 0 (0.0%) | 0 (0.0%) |
| $2,500 to $2,999 | 0 (0.0%) | 0 (0.0%) |
| $3,000 or more | 0 (0.0%) | 0 (0.0%) |
| Total | 104 (100.0%) | 22 (100.0%) |
Physical Housing Characteristics in Granville
Housing Structures in Granville
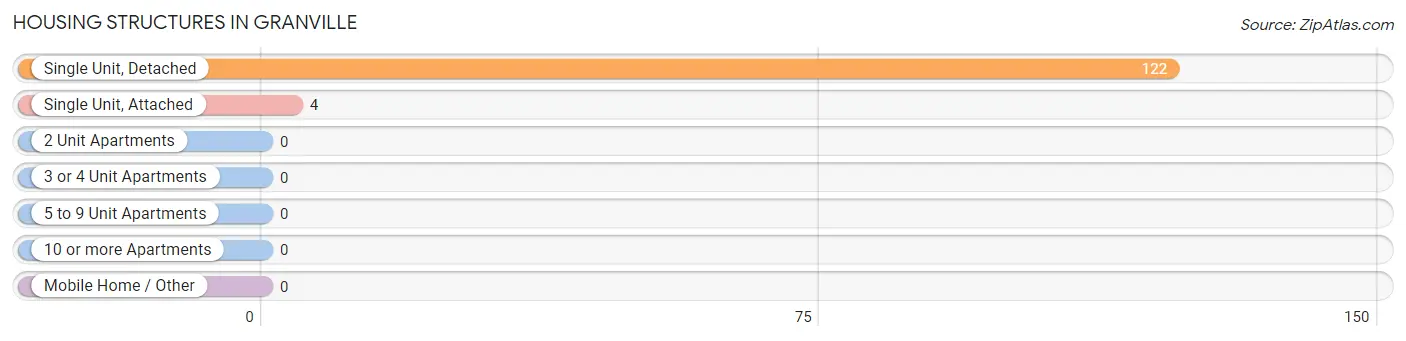
| Structure Type | # Housing Units | % Housing Units |
| Single Unit, Detached | 122 | 96.8% |
| Single Unit, Attached | 4 | 3.2% |
| 2 Unit Apartments | 0 | 0.0% |
| 3 or 4 Unit Apartments | 0 | 0.0% |
| 5 to 9 Unit Apartments | 0 | 0.0% |
| 10 or more Apartments | 0 | 0.0% |
| Mobile Home / Other | 0 | 0.0% |
| Total | 126 | 100.0% |
Housing Structures by Occupancy in Granville
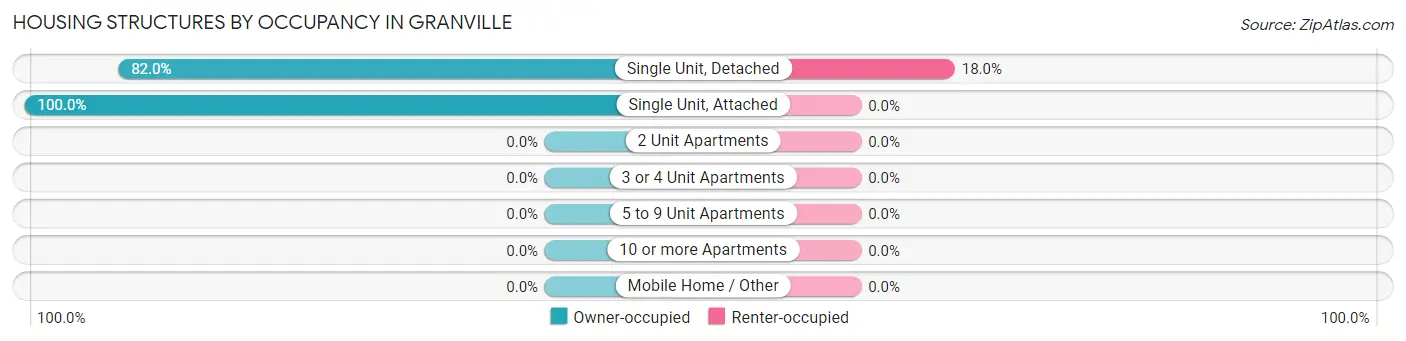
| Structure Type | Owner-occupied | Renter-occupied |
| Single Unit, Detached | 100 (82.0%) | 22 (18.0%) |
| Single Unit, Attached | 4 (100.0%) | 0 (0.0%) |
| 2 Unit Apartments | 0 (0.0%) | 0 (0.0%) |
| 3 or 4 Unit Apartments | 0 (0.0%) | 0 (0.0%) |
| 5 to 9 Unit Apartments | 0 (0.0%) | 0 (0.0%) |
| 10 or more Apartments | 0 (0.0%) | 0 (0.0%) |
| Mobile Home / Other | 0 (0.0%) | 0 (0.0%) |
| Total | 104 (82.5%) | 22 (17.5%) |
Housing Structures by Number of Rooms in Granville
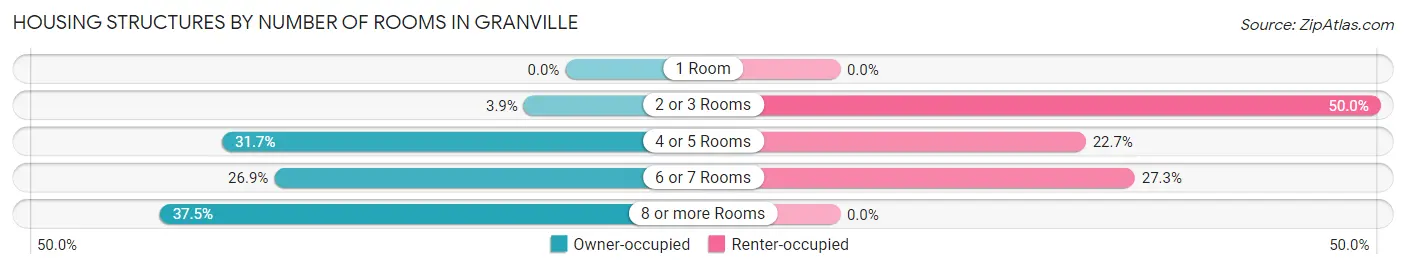
| Number of Rooms | Owner-occupied | Renter-occupied |
| 1 Room | 0 (0.0%) | 0 (0.0%) |
| 2 or 3 Rooms | 4 (3.8%) | 11 (50.0%) |
| 4 or 5 Rooms | 33 (31.7%) | 5 (22.7%) |
| 6 or 7 Rooms | 28 (26.9%) | 6 (27.3%) |
| 8 or more Rooms | 39 (37.5%) | 0 (0.0%) |
| Total | 104 (100.0%) | 22 (100.0%) |
Housing Structure by Heating Type in Granville
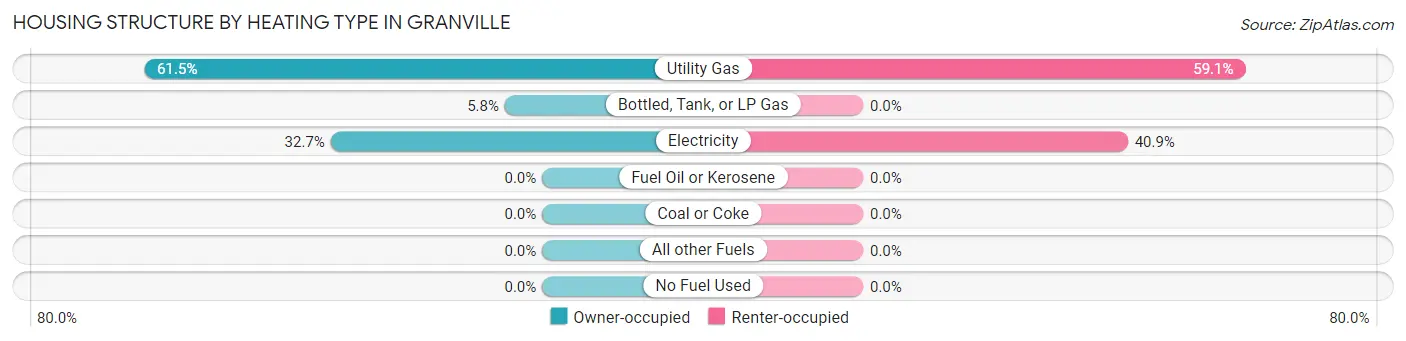
| Heating Type | Owner-occupied | Renter-occupied |
| Utility Gas | 64 (61.5%) | 13 (59.1%) |
| Bottled, Tank, or LP Gas | 6 (5.8%) | 0 (0.0%) |
| Electricity | 34 (32.7%) | 9 (40.9%) |
| Fuel Oil or Kerosene | 0 (0.0%) | 0 (0.0%) |
| Coal or Coke | 0 (0.0%) | 0 (0.0%) |
| All other Fuels | 0 (0.0%) | 0 (0.0%) |
| No Fuel Used | 0 (0.0%) | 0 (0.0%) |
| Total | 104 (100.0%) | 22 (100.0%) |
Household Vehicle Usage in Granville
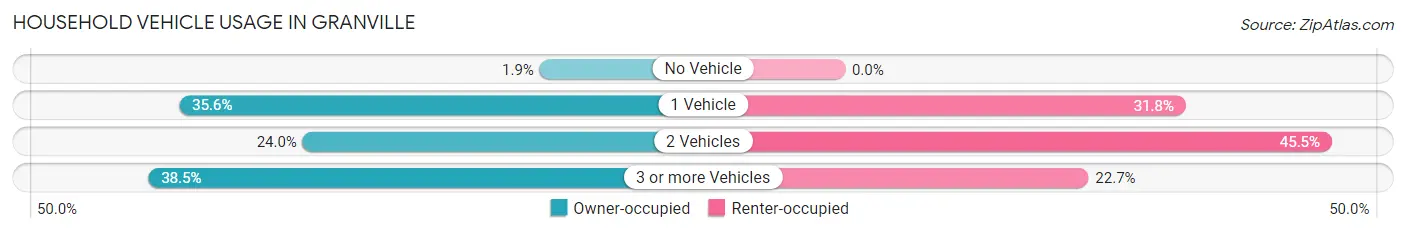
| Vehicles per Household | Owner-occupied | Renter-occupied |
| No Vehicle | 2 (1.9%) | 0 (0.0%) |
| 1 Vehicle | 37 (35.6%) | 7 (31.8%) |
| 2 Vehicles | 25 (24.0%) | 10 (45.5%) |
| 3 or more Vehicles | 40 (38.5%) | 5 (22.7%) |
| Total | 104 (100.0%) | 22 (100.0%) |
Real Estate & Mortgages in Granville
Real Estate and Mortgage Overview in Granville
| Characteristic | Without Mortgage | With Mortgage |
| Housing Units | 62 | 42 |
| Median Property Value | $150,000 | $112,500 |
| Median Household Income | $66,250 | $5 |
| Monthly Housing Costs | $486 | $0 |
| Real Estate Taxes | $1,771 | $6 |
Property Value by Mortgage Status in Granville
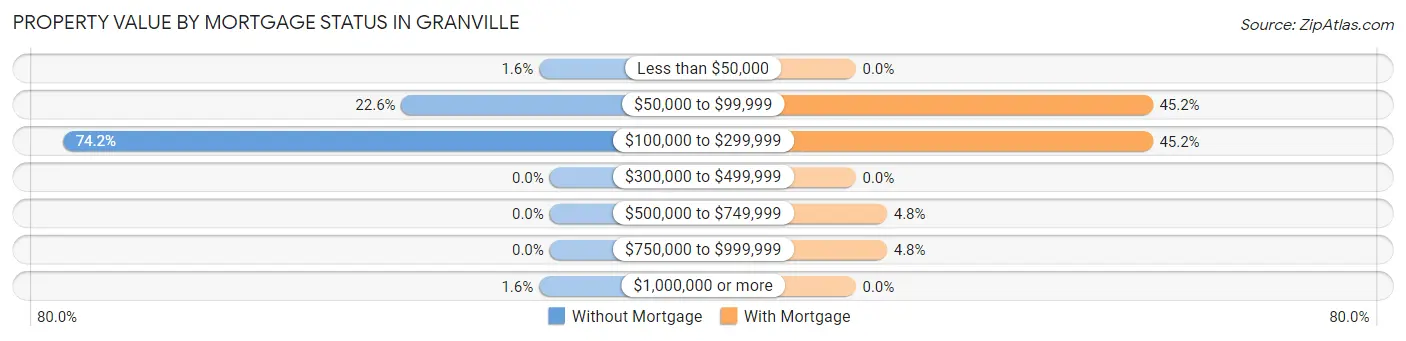
| Property Value | Without Mortgage | With Mortgage |
| Less than $50,000 | 1 (1.6%) | 0 (0.0%) |
| $50,000 to $99,999 | 14 (22.6%) | 19 (45.2%) |
| $100,000 to $299,999 | 46 (74.2%) | 19 (45.2%) |
| $300,000 to $499,999 | 0 (0.0%) | 0 (0.0%) |
| $500,000 to $749,999 | 0 (0.0%) | 2 (4.8%) |
| $750,000 to $999,999 | 0 (0.0%) | 2 (4.8%) |
| $1,000,000 or more | 1 (1.6%) | 0 (0.0%) |
| Total | 62 (100.0%) | 42 (100.0%) |
Household Income by Mortgage Status in Granville
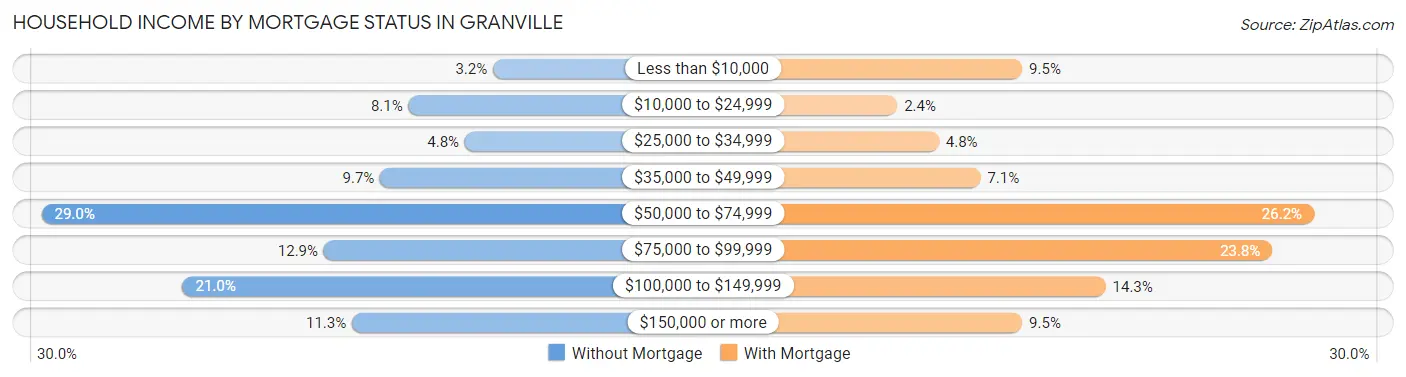
| Household Income | Without Mortgage | With Mortgage |
| Less than $10,000 | 2 (3.2%) | 4 (9.5%) |
| $10,000 to $24,999 | 5 (8.1%) | 1 (2.4%) |
| $25,000 to $34,999 | 3 (4.8%) | 2 (4.8%) |
| $35,000 to $49,999 | 6 (9.7%) | 3 (7.1%) |
| $50,000 to $74,999 | 18 (29.0%) | 11 (26.2%) |
| $75,000 to $99,999 | 8 (12.9%) | 10 (23.8%) |
| $100,000 to $149,999 | 13 (21.0%) | 6 (14.3%) |
| $150,000 or more | 7 (11.3%) | 4 (9.5%) |
| Total | 62 (100.0%) | 42 (100.0%) |
Property Value to Household Income Ratio in Granville
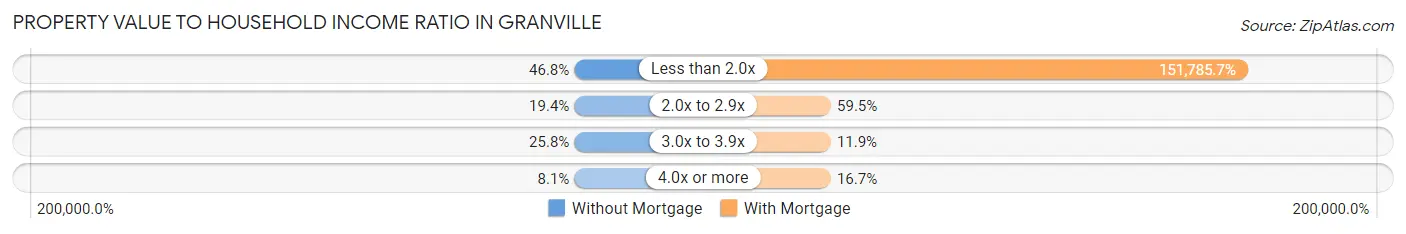
| Value-to-Income Ratio | Without Mortgage | With Mortgage |
| Less than 2.0x | 29 (46.8%) | 63,750 (151,785.7%) |
| 2.0x to 2.9x | 12 (19.4%) | 25 (59.5%) |
| 3.0x to 3.9x | 16 (25.8%) | 5 (11.9%) |
| 4.0x or more | 5 (8.1%) | 7 (16.7%) |
| Total | 62 (100.0%) | 42 (100.0%) |
Real Estate Taxes by Mortgage Status in Granville
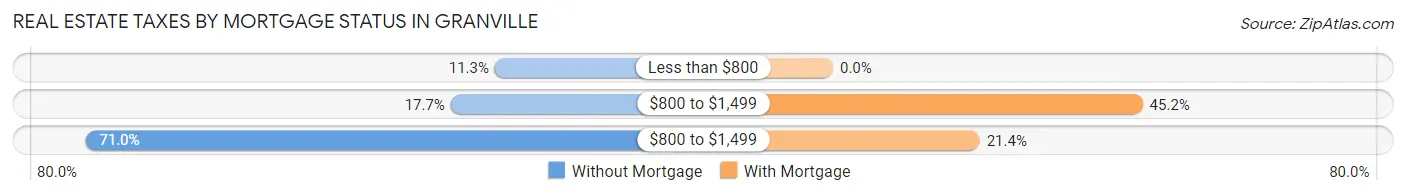
| Property Taxes | Without Mortgage | With Mortgage |
| Less than $800 | 7 (11.3%) | 0 (0.0%) |
| $800 to $1,499 | 11 (17.7%) | 19 (45.2%) |
| $800 to $1,499 | 44 (71.0%) | 9 (21.4%) |
| Total | 62 (100.0%) | 42 (100.0%) |
Health & Disability in Granville
Health Insurance Coverage by Age in Granville
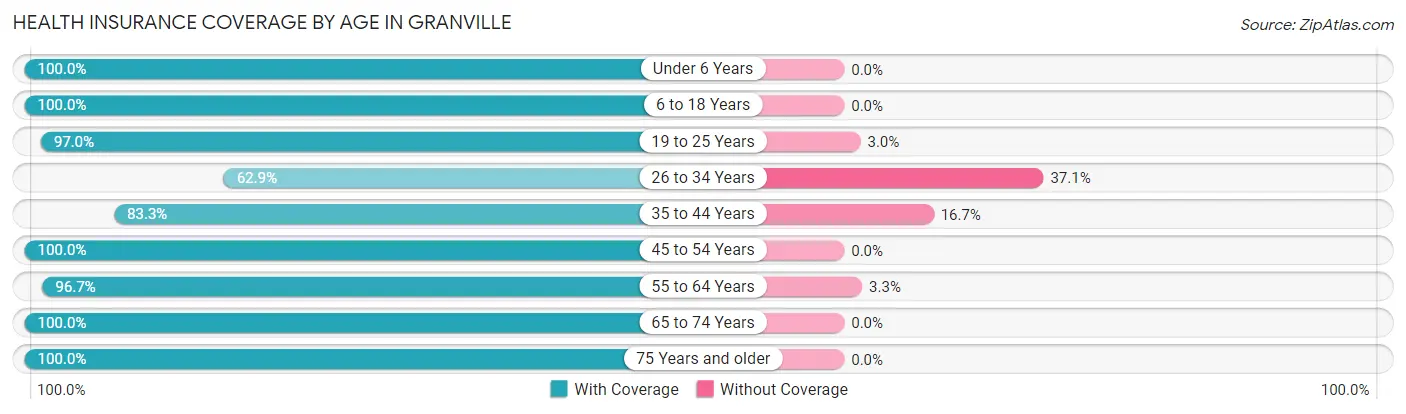
| Age Bracket | With Coverage | Without Coverage |
| Under 6 Years | 19 (100.0%) | 0 (0.0%) |
| 6 to 18 Years | 43 (100.0%) | 0 (0.0%) |
| 19 to 25 Years | 32 (97.0%) | 1 (3.0%) |
| 26 to 34 Years | 22 (62.9%) | 13 (37.1%) |
| 35 to 44 Years | 5 (83.3%) | 1 (16.7%) |
| 45 to 54 Years | 18 (100.0%) | 0 (0.0%) |
| 55 to 64 Years | 58 (96.7%) | 2 (3.3%) |
| 65 to 74 Years | 34 (100.0%) | 0 (0.0%) |
| 75 Years and older | 39 (100.0%) | 0 (0.0%) |
| Total | 270 (94.1%) | 17 (5.9%) |
Health Insurance Coverage by Citizenship Status in Granville
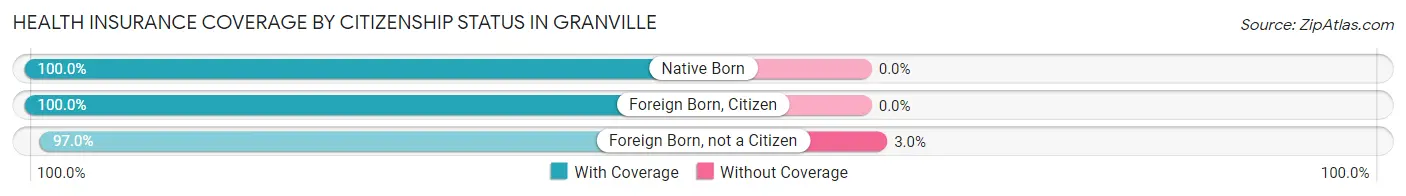
| Citizenship Status | With Coverage | Without Coverage |
| Native Born | 19 (100.0%) | 0 (0.0%) |
| Foreign Born, Citizen | 43 (100.0%) | 0 (0.0%) |
| Foreign Born, not a Citizen | 32 (97.0%) | 1 (3.0%) |
Health Insurance Coverage by Household Income in Granville
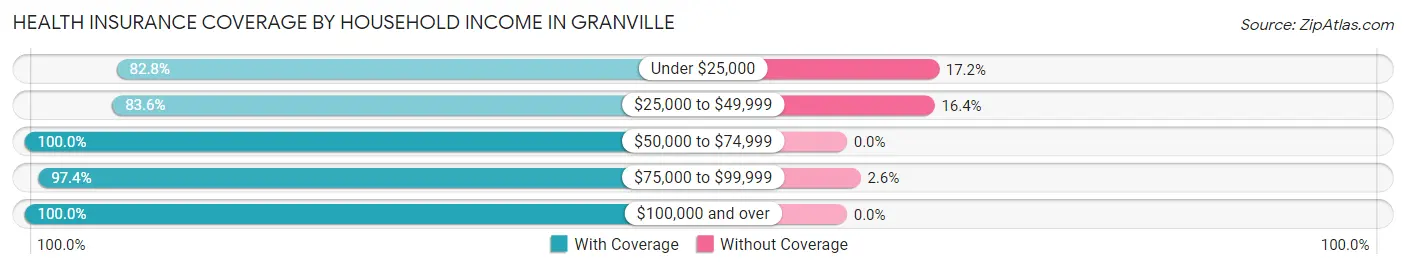
| Household Income | With Coverage | Without Coverage |
| Under $25,000 | 24 (82.8%) | 5 (17.2%) |
| $25,000 to $49,999 | 56 (83.6%) | 11 (16.4%) |
| $50,000 to $74,999 | 60 (100.0%) | 0 (0.0%) |
| $75,000 to $99,999 | 38 (97.4%) | 1 (2.6%) |
| $100,000 and over | 87 (100.0%) | 0 (0.0%) |
Public vs Private Health Insurance Coverage by Age in Granville
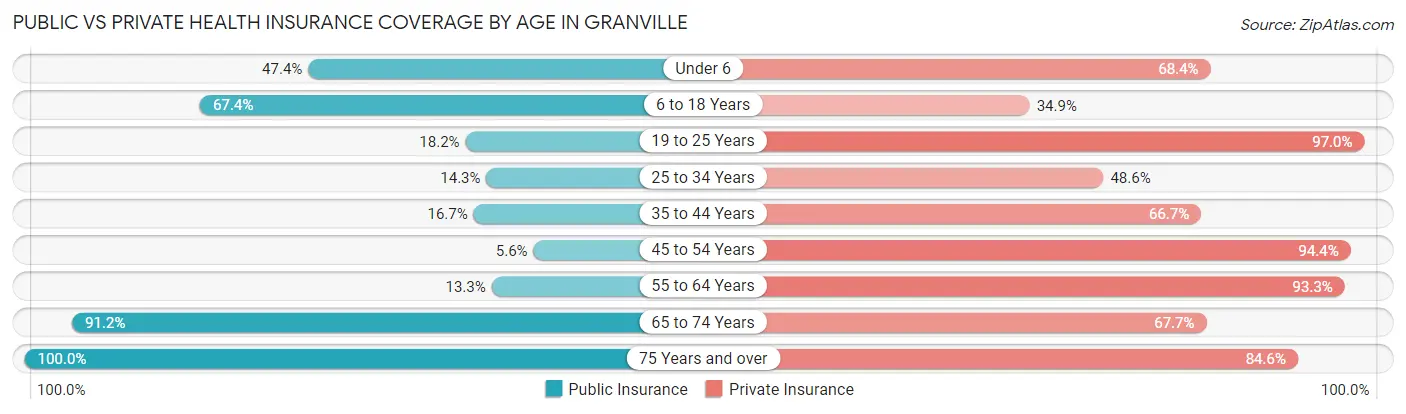
| Age Bracket | Public Insurance | Private Insurance |
| Under 6 | 9 (47.4%) | 13 (68.4%) |
| 6 to 18 Years | 29 (67.4%) | 15 (34.9%) |
| 19 to 25 Years | 6 (18.2%) | 32 (97.0%) |
| 25 to 34 Years | 5 (14.3%) | 17 (48.6%) |
| 35 to 44 Years | 1 (16.7%) | 4 (66.7%) |
| 45 to 54 Years | 1 (5.6%) | 17 (94.4%) |
| 55 to 64 Years | 8 (13.3%) | 56 (93.3%) |
| 65 to 74 Years | 31 (91.2%) | 23 (67.6%) |
| 75 Years and over | 39 (100.0%) | 33 (84.6%) |
| Total | 129 (45.0%) | 210 (73.2%) |
Disability Status by Sex by Age in Granville
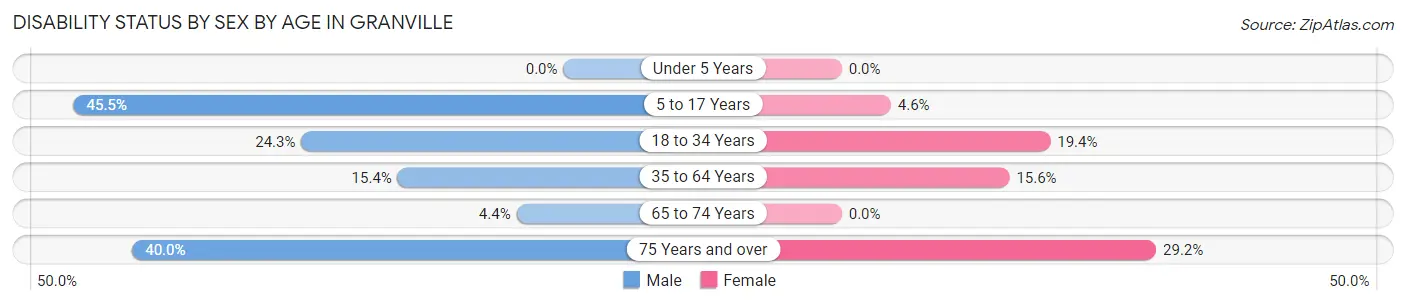
| Age Bracket | Male | Female |
| Under 5 Years | 0 (0.0%) | 0 (0.0%) |
| 5 to 17 Years | 10 (45.5%) | 1 (4.5%) |
| 18 to 34 Years | 9 (24.3%) | 6 (19.4%) |
| 35 to 64 Years | 6 (15.4%) | 7 (15.6%) |
| 65 to 74 Years | 1 (4.3%) | 0 (0.0%) |
| 75 Years and over | 6 (40.0%) | 7 (29.2%) |
Disability Class by Sex by Age in Granville
Disability Class: Hearing Difficulty
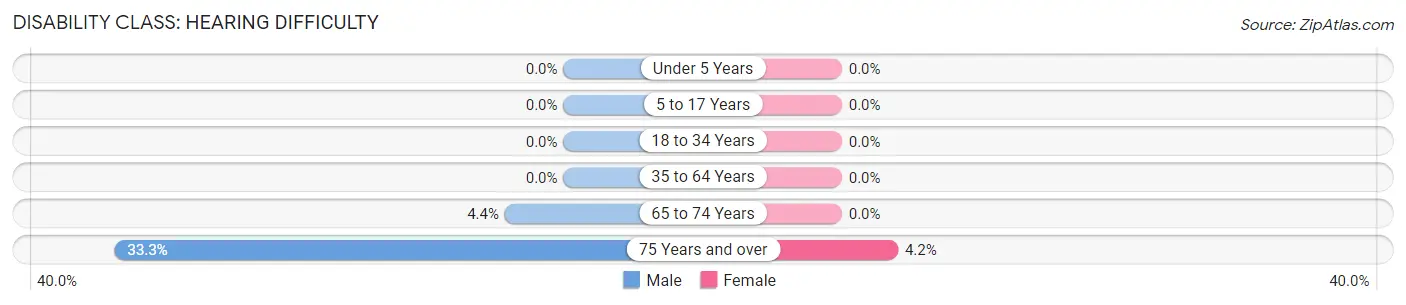
| Age Bracket | Male | Female |
| Under 5 Years | 0 (0.0%) | 0 (0.0%) |
| 5 to 17 Years | 0 (0.0%) | 0 (0.0%) |
| 18 to 34 Years | 0 (0.0%) | 0 (0.0%) |
| 35 to 64 Years | 0 (0.0%) | 0 (0.0%) |
| 65 to 74 Years | 1 (4.3%) | 0 (0.0%) |
| 75 Years and over | 5 (33.3%) | 1 (4.2%) |
Disability Class: Vision Difficulty
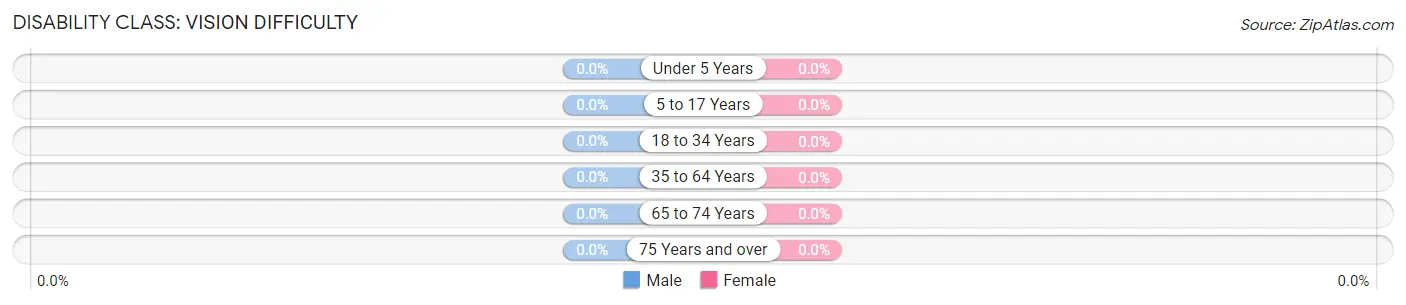
| Age Bracket | Male | Female |
| Under 5 Years | 0 (0.0%) | 0 (0.0%) |
| 5 to 17 Years | 0 (0.0%) | 0 (0.0%) |
| 18 to 34 Years | 0 (0.0%) | 0 (0.0%) |
| 35 to 64 Years | 0 (0.0%) | 0 (0.0%) |
| 65 to 74 Years | 0 (0.0%) | 0 (0.0%) |
| 75 Years and over | 0 (0.0%) | 0 (0.0%) |
Disability Class: Cognitive Difficulty
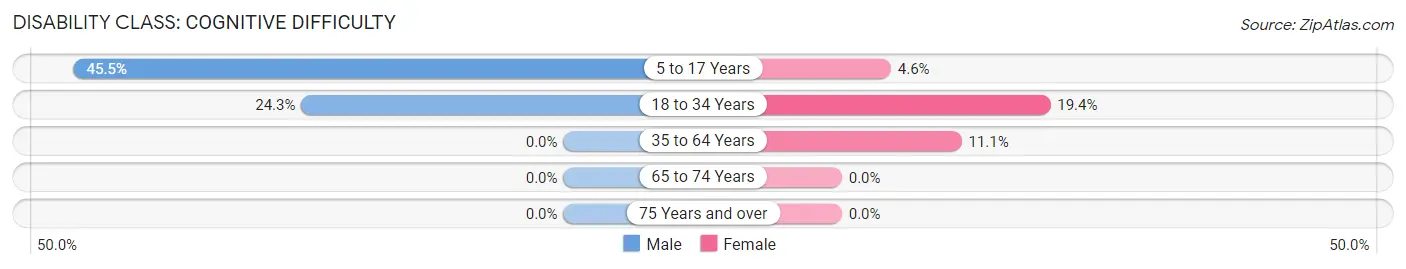
| Age Bracket | Male | Female |
| 5 to 17 Years | 10 (45.5%) | 1 (4.5%) |
| 18 to 34 Years | 9 (24.3%) | 6 (19.4%) |
| 35 to 64 Years | 0 (0.0%) | 5 (11.1%) |
| 65 to 74 Years | 0 (0.0%) | 0 (0.0%) |
| 75 Years and over | 0 (0.0%) | 0 (0.0%) |
Disability Class: Ambulatory Difficulty
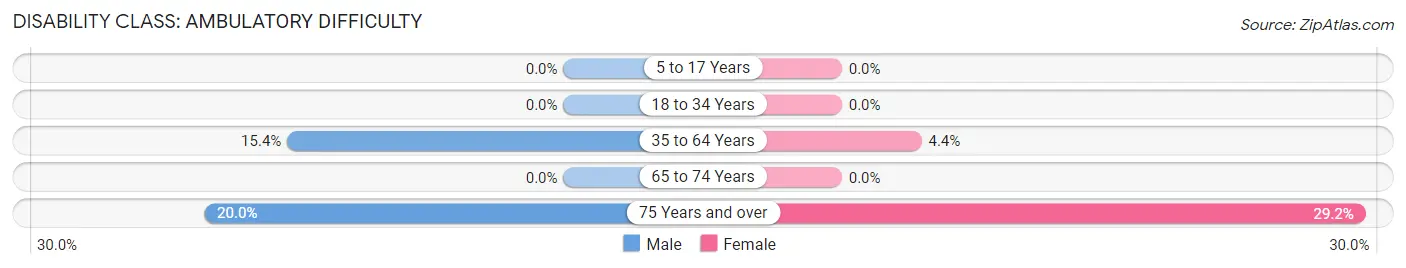
| Age Bracket | Male | Female |
| 5 to 17 Years | 0 (0.0%) | 0 (0.0%) |
| 18 to 34 Years | 0 (0.0%) | 0 (0.0%) |
| 35 to 64 Years | 6 (15.4%) | 2 (4.4%) |
| 65 to 74 Years | 0 (0.0%) | 0 (0.0%) |
| 75 Years and over | 3 (20.0%) | 7 (29.2%) |
Disability Class: Self-Care Difficulty
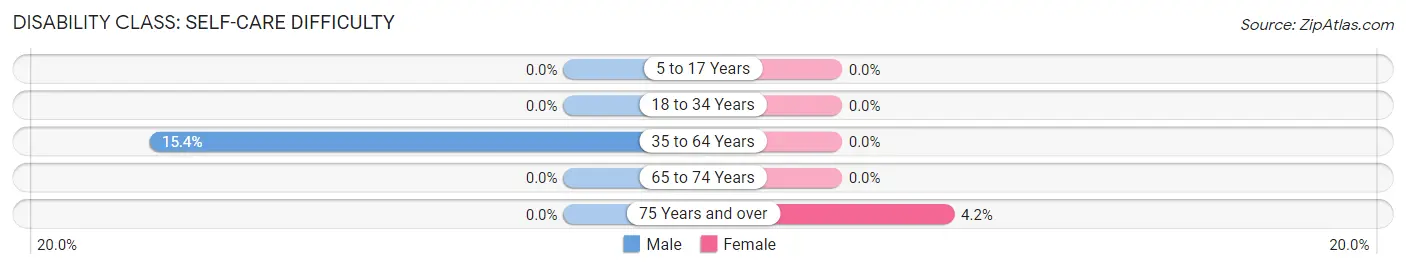
| Age Bracket | Male | Female |
| 5 to 17 Years | 0 (0.0%) | 0 (0.0%) |
| 18 to 34 Years | 0 (0.0%) | 0 (0.0%) |
| 35 to 64 Years | 6 (15.4%) | 0 (0.0%) |
| 65 to 74 Years | 0 (0.0%) | 0 (0.0%) |
| 75 Years and over | 0 (0.0%) | 1 (4.2%) |
Technology Access in Granville
Computing Device Access in Granville
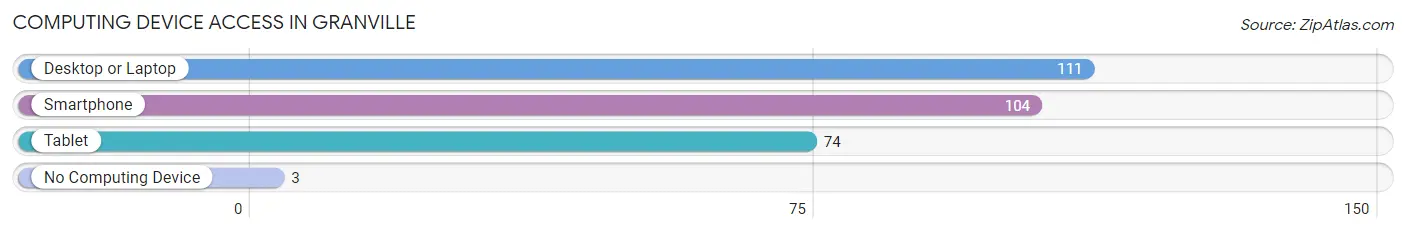
| Device Type | # Households | % Households |
| Desktop or Laptop | 111 | 88.1% |
| Smartphone | 104 | 82.5% |
| Tablet | 74 | 58.7% |
| No Computing Device | 3 | 2.4% |
| Total | 126 | 100.0% |
Internet Access in Granville
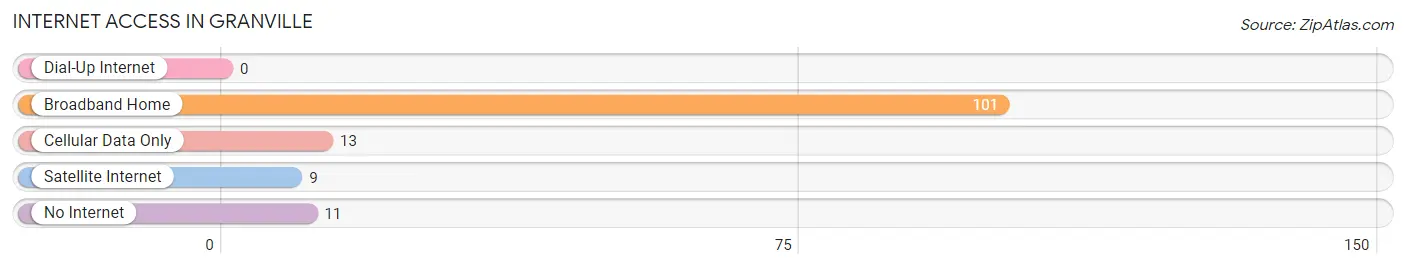
| Internet Type | # Households | % Households |
| Dial-Up Internet | 0 | 0.0% |
| Broadband Home | 101 | 80.2% |
| Cellular Data Only | 13 | 10.3% |
| Satellite Internet | 9 | 7.1% |
| No Internet | 11 | 8.7% |
| Total | 126 | 100.0% |
Granville Summary
Granville, Iowa is a small town located in the northwest corner of the state, in the county of Osceola. It is situated on the banks of the Des Moines River, and is home to a population of just over 500 people. The town was founded in 1856, and has a rich history of farming, industry, and small-town life.
Geography
Granville is located in the northwest corner of Iowa, in Osceola County. It is situated on the banks of the Des Moines River, and is surrounded by rolling hills and farmland. The town is located about 25 miles from the state capital of Des Moines, and is about a two-hour drive from the larger cities of Omaha and Minneapolis.
The town is situated on the edge of the Loess Hills, a region of steep, rolling hills that were formed by wind-blown silt deposits. The hills are home to a variety of wildlife, including deer, wild turkeys, and a variety of birds. The area is also known for its rich soil, which is ideal for farming.
Economy
Granville’s economy is largely based on agriculture. The town is home to several large farms, which produce a variety of crops, including corn, soybeans, and hay. The town also has a number of small businesses, including a grocery store, a hardware store, and a few restaurants.
The town is also home to a number of manufacturing companies, which produce a variety of products, including furniture, clothing, and automotive parts. The town is also home to a number of small businesses, including a bakery, a florist, and a few antique stores.
Demographics
Granville is home to a population of just over 500 people. The town is predominantly white, with a small minority population of African Americans, Hispanics, and Native Americans. The median household income in the town is just over $40,000, and the median age is around 40 years old.
The town is home to a number of churches, including the United Methodist Church, the Catholic Church, and the Lutheran Church. The town also has a public library, a post office, and a few parks.
Conclusion
Granville, Iowa is a small town with a rich history and a vibrant economy. The town is situated on the banks of the Des Moines River, and is surrounded by rolling hills and farmland. The town is home to a population of just over 500 people, and is predominantly white. The town is home to a number of businesses, churches, and parks, and is a great place to live and work.
Common Questions
What is Per Capita Income in Granville?
Per Capita income in Granville is $33,159.
What is the Median Family Income in Granville?
Median Family Income in Granville is $79,375.
What is the Median Household income in Granville?
Median Household Income in Granville is $58,750.
What is Income or Wage Gap in Granville?
Income or Wage Gap in Granville is 3.7%.
Women in Granville earn 96.3 cents for every dollar earned by a man.
What is Inequality or Gini Index in Granville?
Inequality or Gini Index in Granville is 0.43.
What is the Total Population of Granville?
Total Population of Granville is 287.
What is the Total Male Population of Granville?
Total Male Population of Granville is 147.
What is the Total Female Population of Granville?
Total Female Population of Granville is 140.
What is the Ratio of Males per 100 Females in Granville?
There are 105.00 Males per 100 Females in Granville.
What is the Ratio of Females per 100 Males in Granville?
There are 95.24 Females per 100 Males in Granville.
What is the Median Population Age in Granville?
Median Population Age in Granville is 46.6 Years.
What is the Average Family Size in Granville
Average Family Size in Granville is 2.9 People.
What is the Average Household Size in Granville
Average Household Size in Granville is 2.2 People.
How Large is the Labor Force in Granville?
There are 141 People in the Labor Forcein in Granville.
What is the Percentage of People in the Labor Force in Granville?
61.0% of People are in the Labor Force in Granville.
What is the Unemployment Rate in Granville?
Unemployment Rate in Granville is 0.7%.