Renwick, IA Map & Demographics
Renwick Map
Renwick Overview
$29,756
PER CAPITA INCOME
$67,500
AVG FAMILY INCOME
$53,438
AVG HOUSEHOLD INCOME
48.0%
WAGE / INCOME GAP [ % ]
52.0¢/ $1
WAGE / INCOME GAP [ $ ]
0.33
INEQUALITY / GINI INDEX
264
TOTAL POPULATION
131
MALE POPULATION
133
FEMALE POPULATION
98.50
MALES / 100 FEMALES
101.53
FEMALES / 100 MALES
42.0
MEDIAN AGE
2.6
AVG FAMILY SIZE
2.1
AVG HOUSEHOLD SIZE
167
LABOR FORCE [ PEOPLE ]
75.6%
PERCENT IN LABOR FORCE
0.6%
UNEMPLOYMENT RATE
Renwick Zip Codes
Renwick Area Codes
Income in Renwick
Income Overview in Renwick
Per Capita Income in Renwick is $29,756, while median incomes of families and households are $67,500 and $53,438 respectively.
| Characteristic | Number | Measure |
| Per Capita Income | 264 | $29,756 |
| Median Family Income | 72 | $67,500 |
| Mean Family Income | 72 | $68,297 |
| Median Household Income | 125 | $53,438 |
| Mean Household Income | 125 | $62,701 |
| Income Deficit | 72 | $0 |
| Wage / Income Gap (%) | 264 | 47.97% |
| Wage / Income Gap ($) | 264 | 52.03¢ per $1 |
| Gini / Inequality Index | 264 | 0.33 |
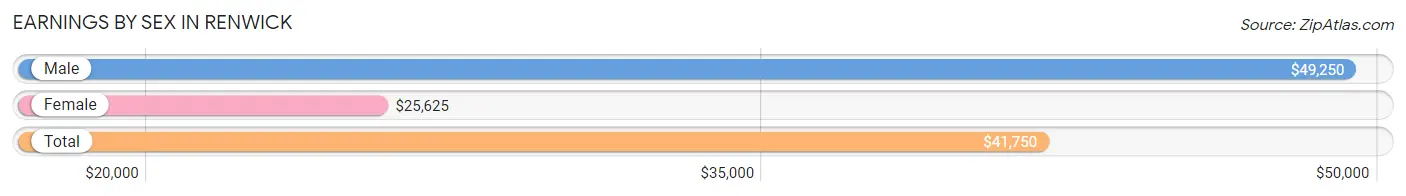
Earnings by Sex in Renwick
Average Earnings in Renwick are $41,750, $49,250 for men and $25,625 for women, a difference of 48.0%.
| Sex | Number | Average Earnings |
| Male | 98 (58.3%) | $49,250 |
| Female | 70 (41.7%) | $25,625 |
| Total | 168 (100.0%) | $41,750 |
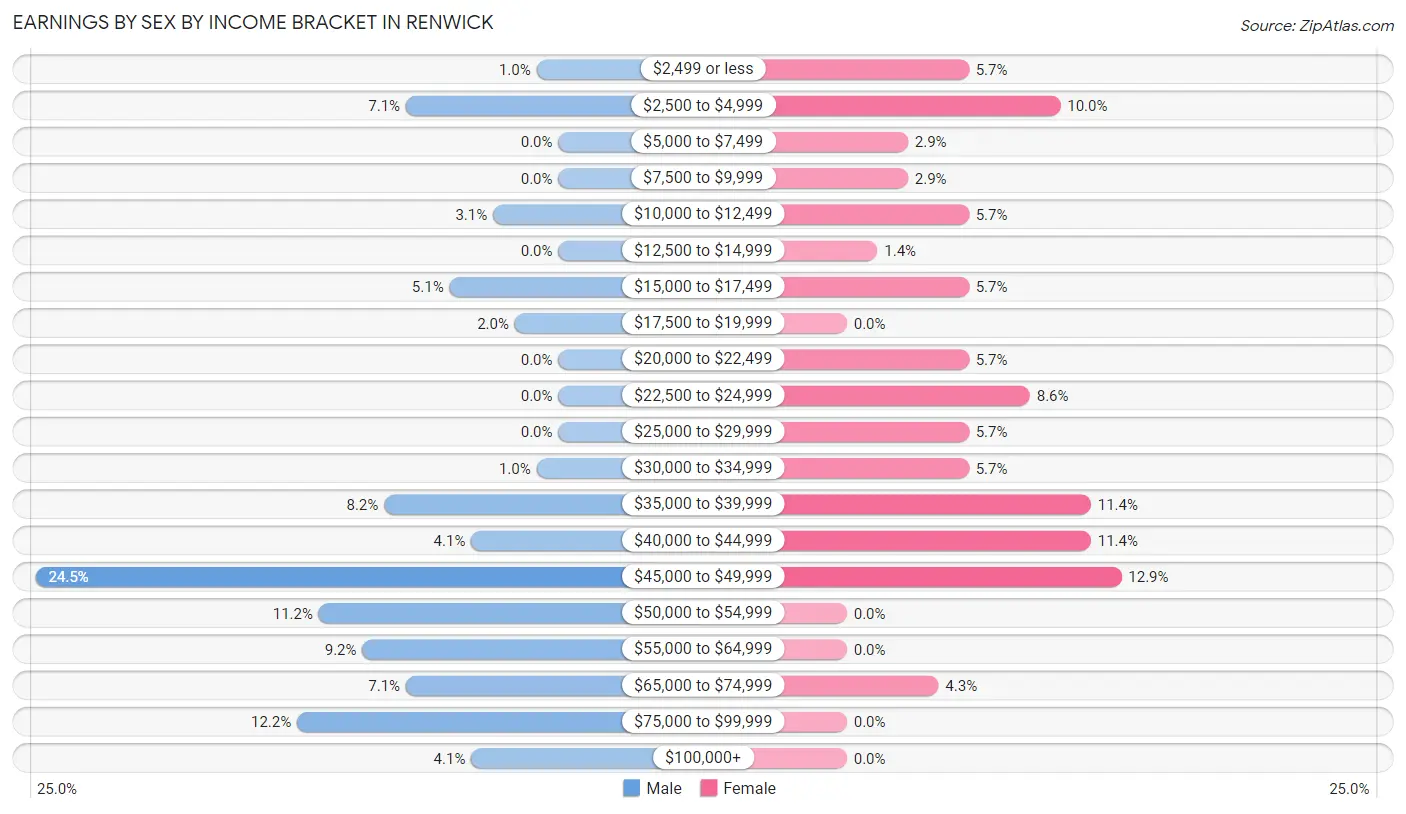
Earnings by Sex by Income Bracket in Renwick
The most common earnings brackets in Renwick are $45,000 to $49,999 for men (24 | 24.5%) and $45,000 to $49,999 for women (9 | 12.9%).
| Income | Male | Female |
| $2,499 or less | 1 (1.0%) | 4 (5.7%) |
| $2,500 to $4,999 | 7 (7.1%) | 7 (10.0%) |
| $5,000 to $7,499 | 0 (0.0%) | 2 (2.9%) |
| $7,500 to $9,999 | 0 (0.0%) | 2 (2.9%) |
| $10,000 to $12,499 | 3 (3.1%) | 4 (5.7%) |
| $12,500 to $14,999 | 0 (0.0%) | 1 (1.4%) |
| $15,000 to $17,499 | 5 (5.1%) | 4 (5.7%) |
| $17,500 to $19,999 | 2 (2.0%) | 0 (0.0%) |
| $20,000 to $22,499 | 0 (0.0%) | 4 (5.7%) |
| $22,500 to $24,999 | 0 (0.0%) | 6 (8.6%) |
| $25,000 to $29,999 | 0 (0.0%) | 4 (5.7%) |
| $30,000 to $34,999 | 1 (1.0%) | 4 (5.7%) |
| $35,000 to $39,999 | 8 (8.2%) | 8 (11.4%) |
| $40,000 to $44,999 | 4 (4.1%) | 8 (11.4%) |
| $45,000 to $49,999 | 24 (24.5%) | 9 (12.9%) |
| $50,000 to $54,999 | 11 (11.2%) | 0 (0.0%) |
| $55,000 to $64,999 | 9 (9.2%) | 0 (0.0%) |
| $65,000 to $74,999 | 7 (7.1%) | 3 (4.3%) |
| $75,000 to $99,999 | 12 (12.2%) | 0 (0.0%) |
| $100,000+ | 4 (4.1%) | 0 (0.0%) |
| Total | 98 (100.0%) | 70 (100.0%) |
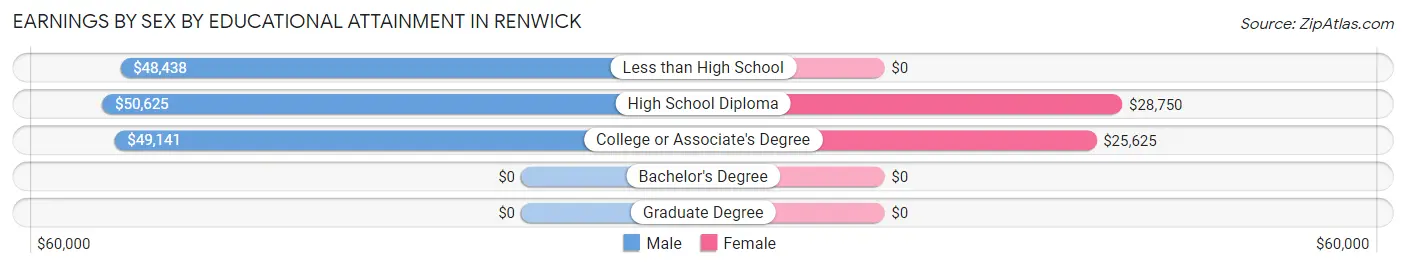
Earnings by Sex by Educational Attainment in Renwick
Average earnings in Renwick are $49,625 for men and $25,625 for women, a difference of 48.4%. Men with an educational attainment of high school diploma enjoy the highest average annual earnings of $50,625, while those with less than high school education earn the least with $48,438. Women with an educational attainment of high school diploma earn the most with the average annual earnings of $28,750, while those with college or associate's degree education have the smallest earnings of $25,625.
| Educational Attainment | Male Income | Female Income |
| Less than High School | $48,438 | $0 |
| High School Diploma | $50,625 | $28,750 |
| College or Associate's Degree | $49,141 | $25,625 |
| Bachelor's Degree | - | - |
| Graduate Degree | - | - |
| Total | $49,625 | $25,625 |
Family Income in Renwick
Family Income Brackets in Renwick
According to the Renwick family income data, there are 19 families falling into the $50,000 to $74,999 income range, which is the most common income bracket and makes up 26.4% of all families.
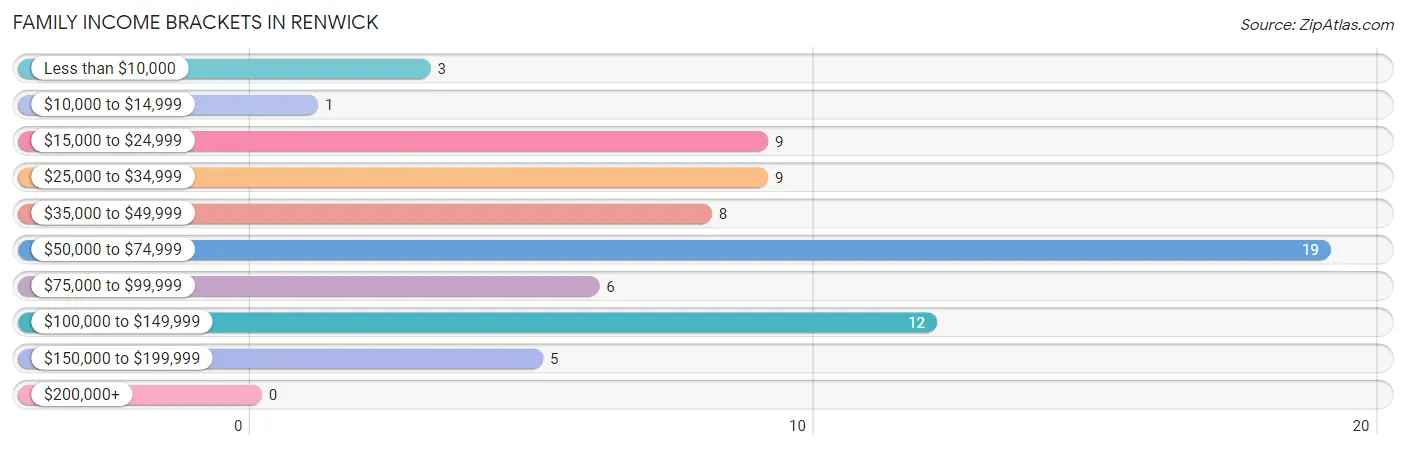
| Income Bracket | # Families | % Families |
| Less than $10,000 | 3 | 4.2% |
| $10,000 to $14,999 | 1 | 1.4% |
| $15,000 to $24,999 | 9 | 12.5% |
| $25,000 to $34,999 | 9 | 12.5% |
| $35,000 to $49,999 | 8 | 11.1% |
| $50,000 to $74,999 | 19 | 26.4% |
| $75,000 to $99,999 | 6 | 8.3% |
| $100,000 to $149,999 | 12 | 16.7% |
| $150,000 to $199,999 | 5 | 6.9% |
| $200,000+ | 0 | 0.0% |
Family Income by Famaliy Size in Renwick
4-person families (9 | 12.5%) account for the highest median family income in Renwick with $66,250 per family, while 2-person families (51 | 70.8%) have the highest median income of $28,125 per family member.
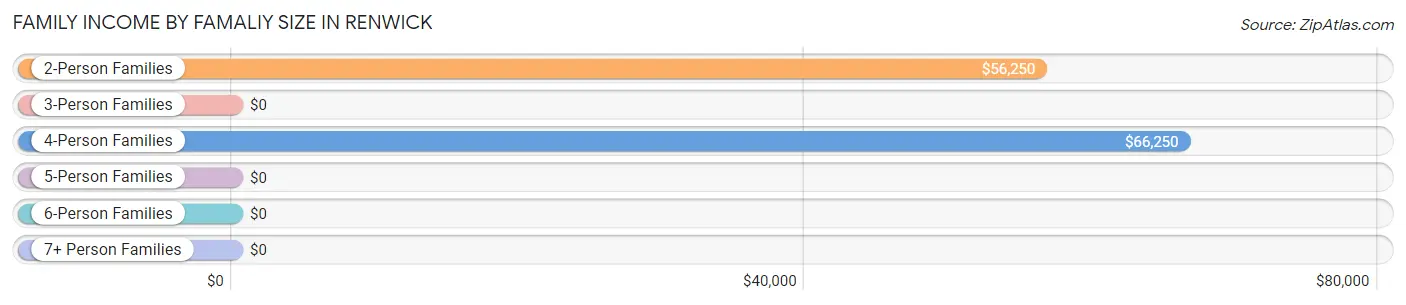
| Income Bracket | # Families | Median Income |
| 2-Person Families | 51 (70.8%) | $56,250 |
| 3-Person Families | 3 (4.2%) | $0 |
| 4-Person Families | 9 (12.5%) | $66,250 |
| 5-Person Families | 7 (9.7%) | $0 |
| 6-Person Families | 2 (2.8%) | $0 |
| 7+ Person Families | 0 (0.0%) | $0 |
| Total | 72 (100.0%) | $67,500 |
Family Income by Number of Earners in Renwick
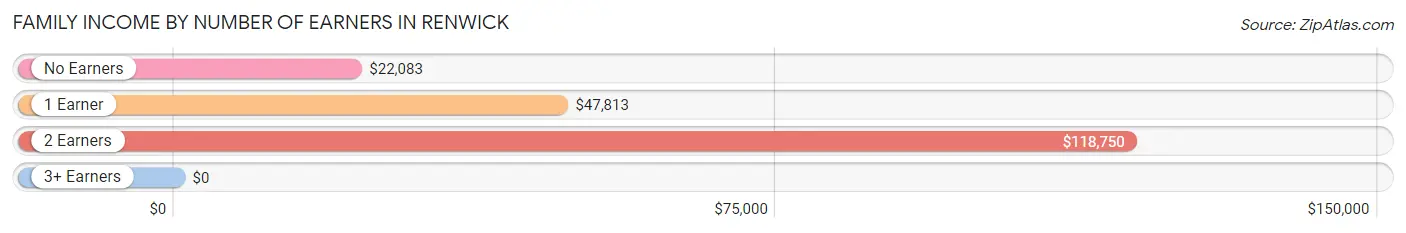
| Number of Earners | # Families | Median Income |
| No Earners | 13 (18.1%) | $22,083 |
| 1 Earner | 27 (37.5%) | $47,813 |
| 2 Earners | 29 (40.3%) | $118,750 |
| 3+ Earners | 3 (4.2%) | $0 |
| Total | 72 (100.0%) | $67,500 |
Household Income in Renwick
Household Income Brackets in Renwick
With 35 households falling in the category, the $50,000 to $74,999 income range is the most frequent in Renwick, accounting for 28.0% of all households.
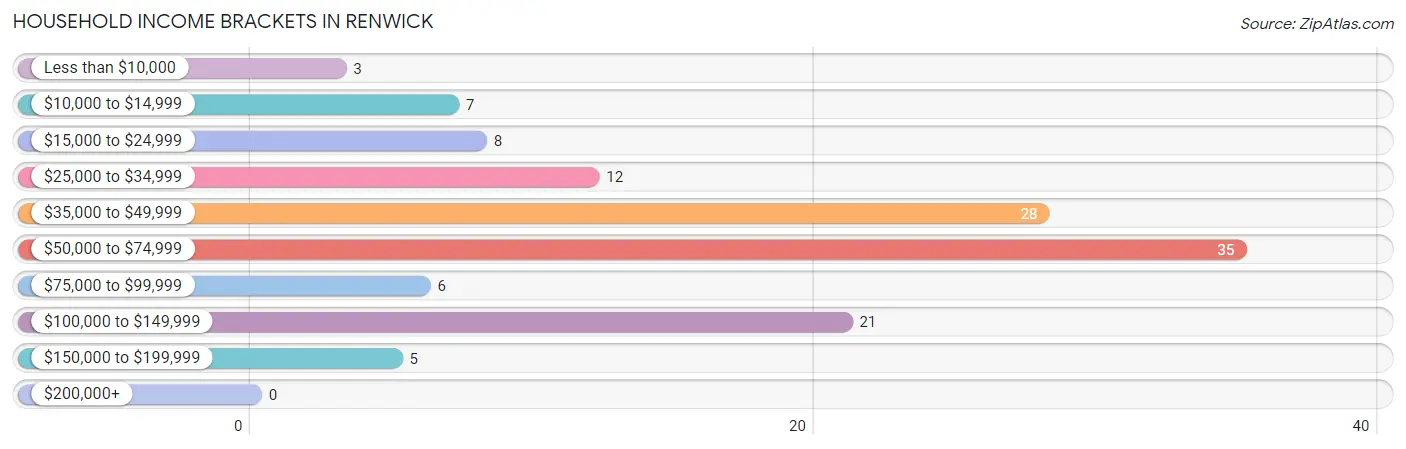
| Income Bracket | # Households | % Households |
| Less than $10,000 | 3 | 2.4% |
| $10,000 to $14,999 | 7 | 5.6% |
| $15,000 to $24,999 | 8 | 6.4% |
| $25,000 to $34,999 | 12 | 9.6% |
| $35,000 to $49,999 | 28 | 22.4% |
| $50,000 to $74,999 | 35 | 28.0% |
| $75,000 to $99,999 | 6 | 4.8% |
| $100,000 to $149,999 | 21 | 16.8% |
| $150,000 to $199,999 | 5 | 4.0% |
| $200,000+ | 0 | 0.0% |
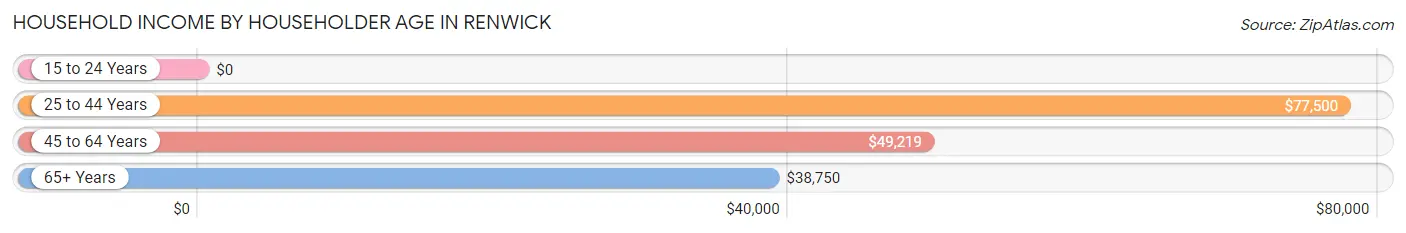
Household Income by Householder Age in Renwick
The median household income in Renwick is $53,438, with the highest median household income of $77,500 found in the 25 to 44 years age bracket for the primary householder. A total of 20 households (16.0%) fall into this category. Meanwhile, the 15 to 24 years age bracket for the primary householder has the lowest median household income of $0, with 17 households (13.6%) in this group.
| Income Bracket | # Households | Median Income |
| 15 to 24 Years | 17 (13.6%) | $0 |
| 25 to 44 Years | 20 (16.0%) | $77,500 |
| 45 to 64 Years | 62 (49.6%) | $49,219 |
| 65+ Years | 26 (20.8%) | $38,750 |
| Total | 125 (100.0%) | $53,438 |
Poverty in Renwick
Income Below Poverty by Sex and Age in Renwick
With 4.6% poverty level for males and 12.0% for females among the residents of Renwick, 75 year old and over males and 25 to 34 year old females are the most vulnerable to poverty, with 2 males (20.0%) and 3 females (37.5%) in their respective age groups living below the poverty level.
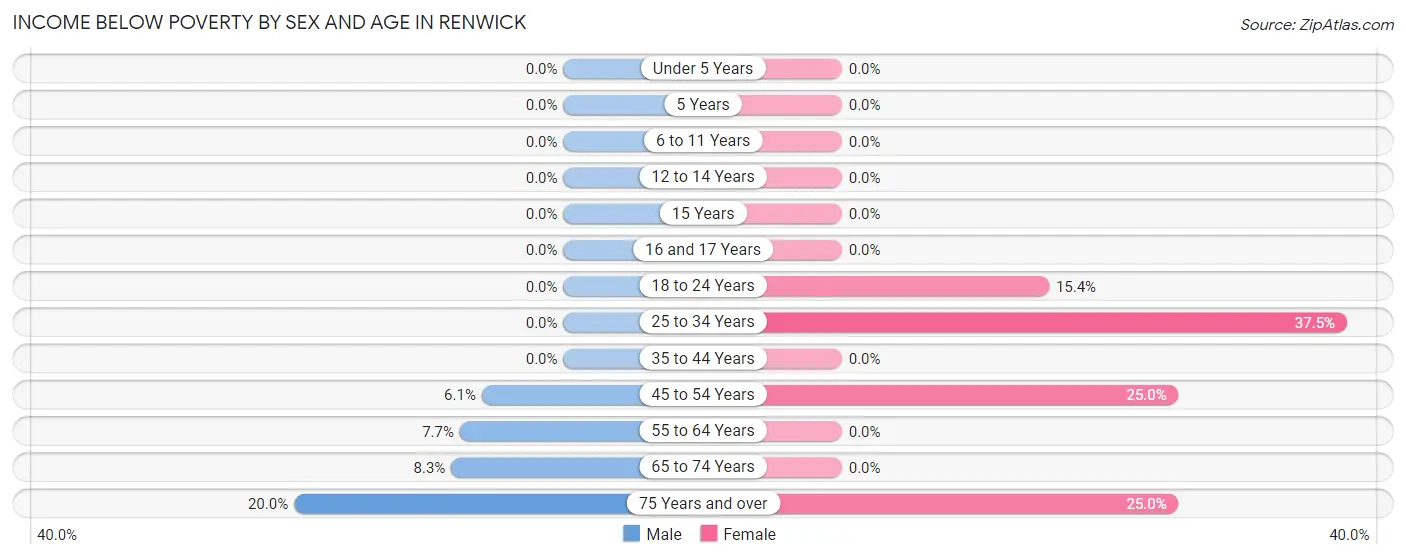
| Age Bracket | Male | Female |
| Under 5 Years | 0 (0.0%) | 0 (0.0%) |
| 5 Years | 0 (0.0%) | 0 (0.0%) |
| 6 to 11 Years | 0 (0.0%) | 0 (0.0%) |
| 12 to 14 Years | 0 (0.0%) | 0 (0.0%) |
| 15 Years | 0 (0.0%) | 0 (0.0%) |
| 16 and 17 Years | 0 (0.0%) | 0 (0.0%) |
| 18 to 24 Years | 0 (0.0%) | 4 (15.4%) |
| 25 to 34 Years | 0 (0.0%) | 3 (37.5%) |
| 35 to 44 Years | 0 (0.0%) | 0 (0.0%) |
| 45 to 54 Years | 2 (6.1%) | 7 (25.0%) |
| 55 to 64 Years | 1 (7.7%) | 0 (0.0%) |
| 65 to 74 Years | 1 (8.3%) | 0 (0.0%) |
| 75 Years and over | 2 (20.0%) | 2 (25.0%) |
| Total | 6 (4.6%) | 16 (12.0%) |
Income Above Poverty by Sex and Age in Renwick
According to the poverty statistics in Renwick, males aged under 5 years and females aged under 5 years are the age groups that are most secure financially, with 100.0% of males and 100.0% of females in these age groups living above the poverty line.
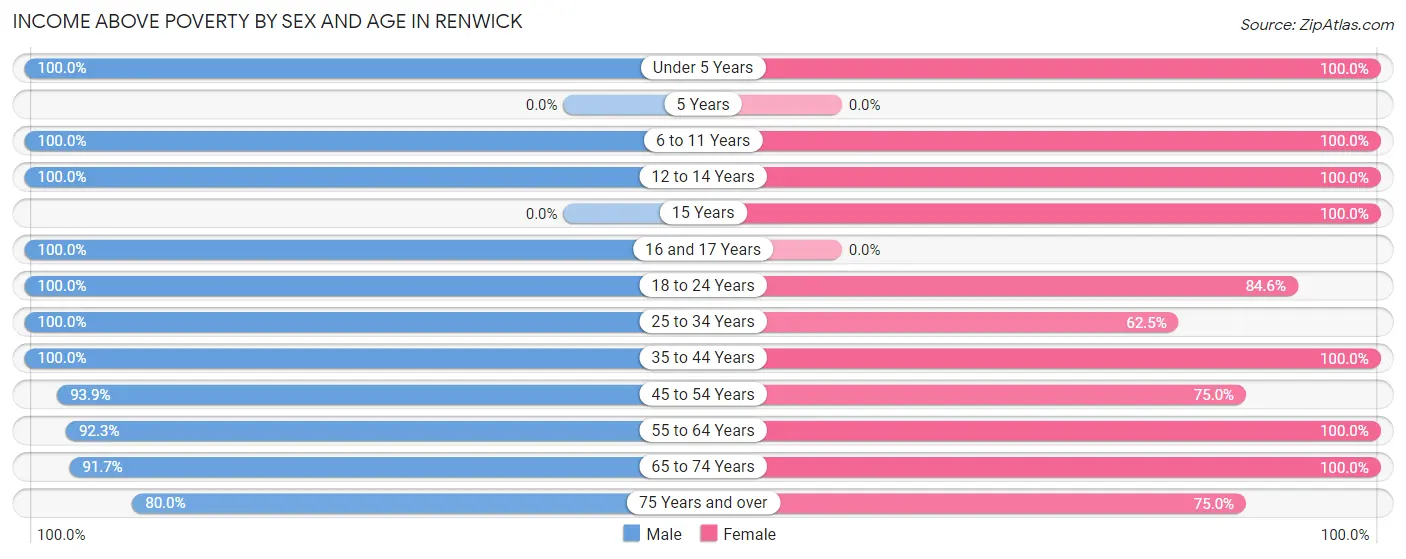
| Age Bracket | Male | Female |
| Under 5 Years | 7 (100.0%) | 10 (100.0%) |
| 5 Years | 0 (0.0%) | 0 (0.0%) |
| 6 to 11 Years | 3 (100.0%) | 10 (100.0%) |
| 12 to 14 Years | 2 (100.0%) | 9 (100.0%) |
| 15 Years | 0 (0.0%) | 2 (100.0%) |
| 16 and 17 Years | 7 (100.0%) | 0 (0.0%) |
| 18 to 24 Years | 15 (100.0%) | 22 (84.6%) |
| 25 to 34 Years | 15 (100.0%) | 5 (62.5%) |
| 35 to 44 Years | 14 (100.0%) | 5 (100.0%) |
| 45 to 54 Years | 31 (93.9%) | 21 (75.0%) |
| 55 to 64 Years | 12 (92.3%) | 21 (100.0%) |
| 65 to 74 Years | 11 (91.7%) | 6 (100.0%) |
| 75 Years and over | 8 (80.0%) | 6 (75.0%) |
| Total | 125 (95.4%) | 117 (88.0%) |
Income Below Poverty Among Married-Couple Families in Renwick
The poverty statistics for married-couple families in Renwick show that 3.7% or 2 of the total 54 families live below the poverty line. Families with no children have the highest poverty rate of 5.0%, comprising of 2 families. On the other hand, families with 1 or 2 children have the lowest poverty rate of 0.0%, which includes 0 families.
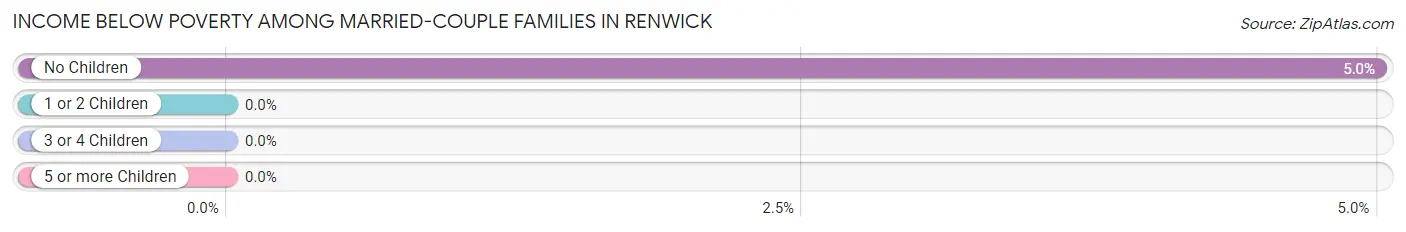
| Children | Above Poverty | Below Poverty |
| No Children | 38 (95.0%) | 2 (5.0%) |
| 1 or 2 Children | 11 (100.0%) | 0 (0.0%) |
| 3 or 4 Children | 3 (100.0%) | 0 (0.0%) |
| 5 or more Children | 0 (0.0%) | 0 (0.0%) |
| Total | 52 (96.3%) | 2 (3.7%) |
Income Below Poverty Among Single-Parent Households in Renwick
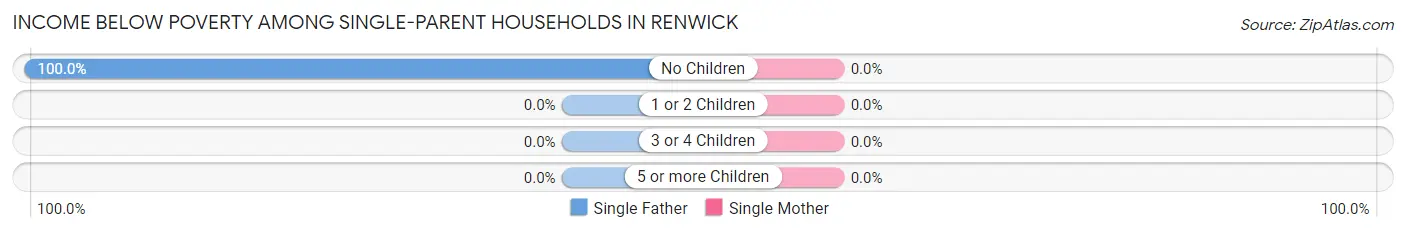
| Children | Single Father | Single Mother |
| No Children | 2 (100.0%) | 0 (0.0%) |
| 1 or 2 Children | 0 (0.0%) | 0 (0.0%) |
| 3 or 4 Children | 0 (0.0%) | 0 (0.0%) |
| 5 or more Children | 0 (0.0%) | 0 (0.0%) |
| Total | 2 (28.6%) | 0 (0.0%) |
Income Below Poverty Among Married-Couple vs Single-Parent Households in Renwick
The poverty data for Renwick shows that 2 of the married-couple family households (3.7%) and 2 of the single-parent households (11.1%) are living below the poverty level. Within the married-couple family households, those with no children have the highest poverty rate, with 2 households (5.0%) falling below the poverty line. Among the single-parent households, those with no children have the highest poverty rate, with 2 household (66.7%) living below poverty.
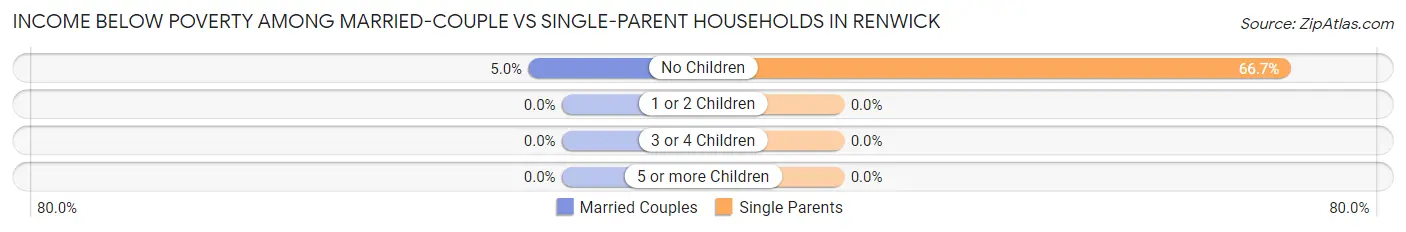
| Children | Married-Couple Families | Single-Parent Households |
| No Children | 2 (5.0%) | 2 (66.7%) |
| 1 or 2 Children | 0 (0.0%) | 0 (0.0%) |
| 3 or 4 Children | 0 (0.0%) | 0 (0.0%) |
| 5 or more Children | 0 (0.0%) | 0 (0.0%) |
| Total | 2 (3.7%) | 2 (11.1%) |
Race in Renwick
The most populous races in Renwick are White / Caucasian (210 | 79.5%), Two or more Races (38 | 14.4%), and Hispanic or Latino (31 | 11.7%).
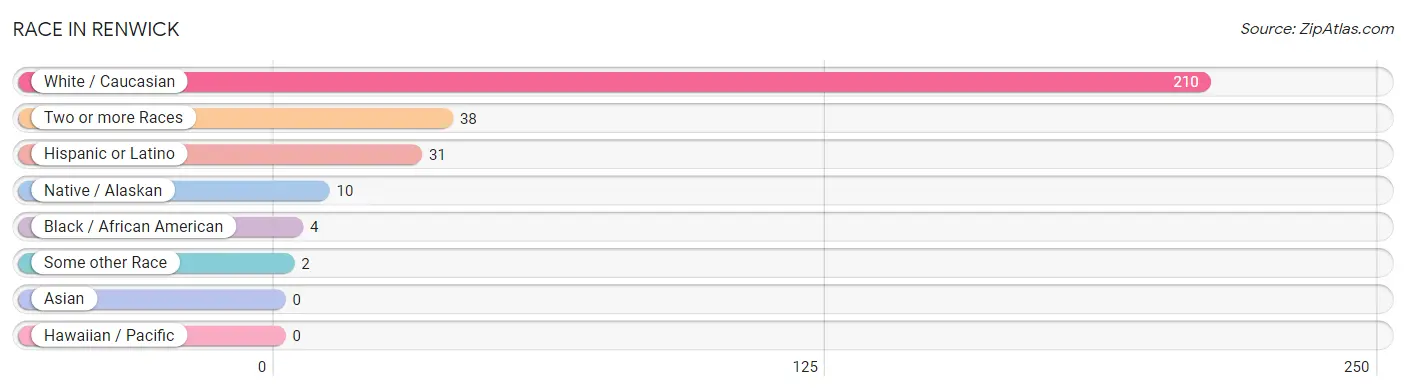
| Race | # Population | % Population |
| Asian | 0 | 0.0% |
| Black / African American | 4 | 1.5% |
| Hawaiian / Pacific | 0 | 0.0% |
| Hispanic or Latino | 31 | 11.7% |
| Native / Alaskan | 10 | 3.8% |
| White / Caucasian | 210 | 79.5% |
| Two or more Races | 38 | 14.4% |
| Some other Race | 2 | 0.8% |
| Total | 264 | 100.0% |
Ancestry in Renwick
The most populous ancestries reported in Renwick are German (75 | 28.4%), Irish (32 | 12.1%), Norwegian (28 | 10.6%), Mexican (23 | 8.7%), and European (19 | 7.2%), together accounting for 67.0% of all Renwick residents.
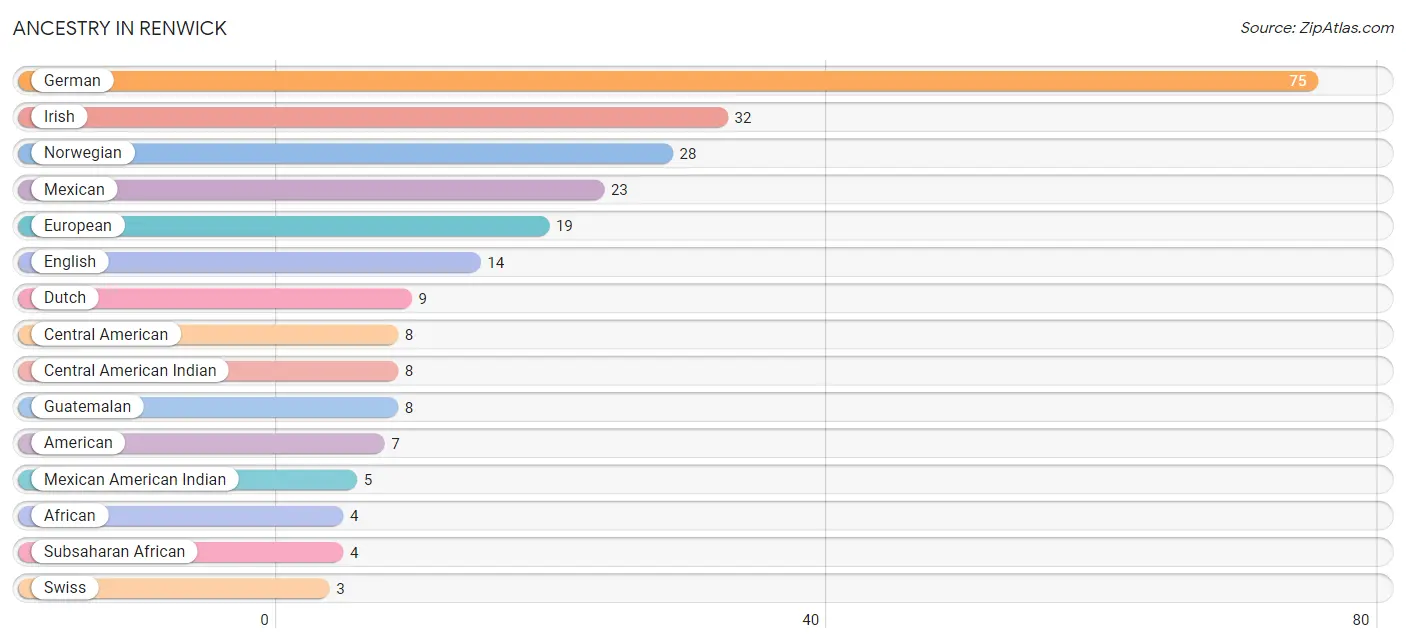
| Ancestry | # Population | % Population |
| African | 4 | 1.5% |
| American | 7 | 2.6% |
| Austrian | 1 | 0.4% |
| Central American | 8 | 3.0% |
| Central American Indian | 8 | 3.0% |
| Danish | 1 | 0.4% |
| Dutch | 9 | 3.4% |
| English | 14 | 5.3% |
| European | 19 | 7.2% |
| French | 1 | 0.4% |
| German | 75 | 28.4% |
| Guatemalan | 8 | 3.0% |
| Irish | 32 | 12.1% |
| Italian | 2 | 0.8% |
| Mexican | 23 | 8.7% |
| Mexican American Indian | 5 | 1.9% |
| Norwegian | 28 | 10.6% |
| Polish | 2 | 0.8% |
| Subsaharan African | 4 | 1.5% |
| Swedish | 1 | 0.4% |
| Swiss | 3 | 1.1% | View All 21 Rows |
Immigrants in Renwick
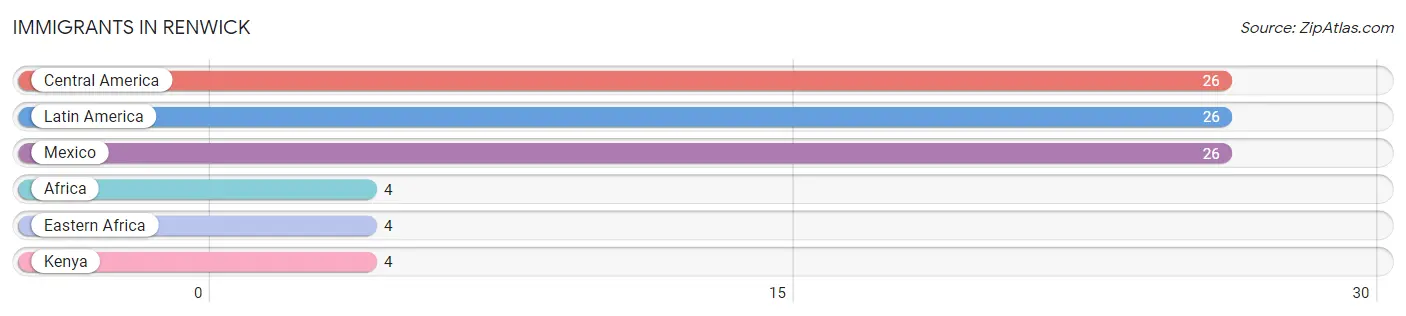
The most numerous immigrant groups reported in Renwick came from Central America (26 | 9.9%), Latin America (26 | 9.9%), Mexico (26 | 9.9%), Africa (4 | 1.5%), and Eastern Africa (4 | 1.5%), together accounting for 32.6% of all Renwick residents.
| Immigration Origin | # Population | % Population |
| Africa | 4 | 1.5% |
| Central America | 26 | 9.9% |
| Eastern Africa | 4 | 1.5% |
| Kenya | 4 | 1.5% |
| Latin America | 26 | 9.9% |
| Mexico | 26 | 9.9% | View All 6 Rows |
Sex and Age in Renwick
Sex and Age in Renwick
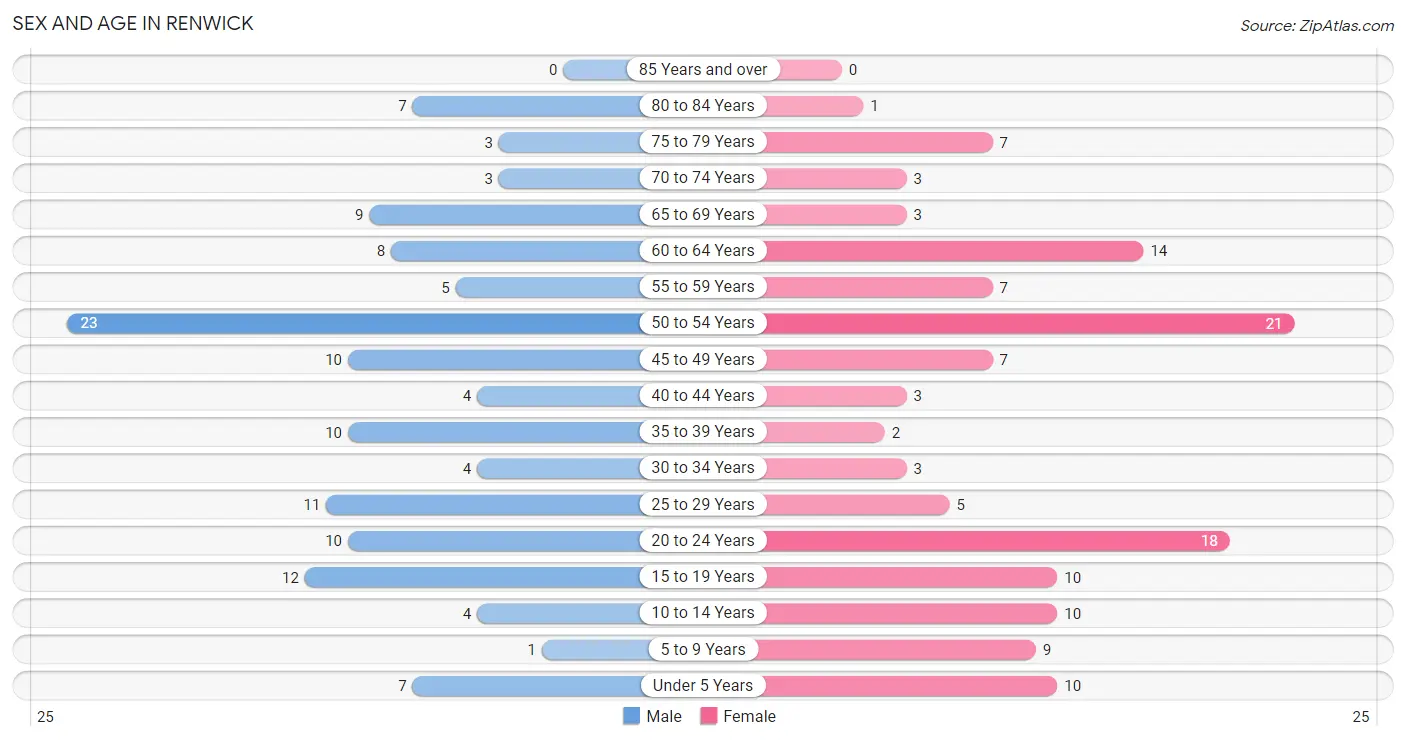
The most populous age groups in Renwick are 50 to 54 Years (23 | 17.6%) for men and 50 to 54 Years (21 | 15.8%) for women.
| Age Bracket | Male | Female |
| Under 5 Years | 7 (5.3%) | 10 (7.5%) |
| 5 to 9 Years | 1 (0.8%) | 9 (6.8%) |
| 10 to 14 Years | 4 (3.0%) | 10 (7.5%) |
| 15 to 19 Years | 12 (9.2%) | 10 (7.5%) |
| 20 to 24 Years | 10 (7.6%) | 18 (13.5%) |
| 25 to 29 Years | 11 (8.4%) | 5 (3.8%) |
| 30 to 34 Years | 4 (3.0%) | 3 (2.3%) |
| 35 to 39 Years | 10 (7.6%) | 2 (1.5%) |
| 40 to 44 Years | 4 (3.0%) | 3 (2.3%) |
| 45 to 49 Years | 10 (7.6%) | 7 (5.3%) |
| 50 to 54 Years | 23 (17.6%) | 21 (15.8%) |
| 55 to 59 Years | 5 (3.8%) | 7 (5.3%) |
| 60 to 64 Years | 8 (6.1%) | 14 (10.5%) |
| 65 to 69 Years | 9 (6.9%) | 3 (2.3%) |
| 70 to 74 Years | 3 (2.3%) | 3 (2.3%) |
| 75 to 79 Years | 3 (2.3%) | 7 (5.3%) |
| 80 to 84 Years | 7 (5.3%) | 1 (0.7%) |
| 85 Years and over | 0 (0.0%) | 0 (0.0%) |
| Total | 131 (100.0%) | 133 (100.0%) |
Families and Households in Renwick
Median Family Size in Renwick
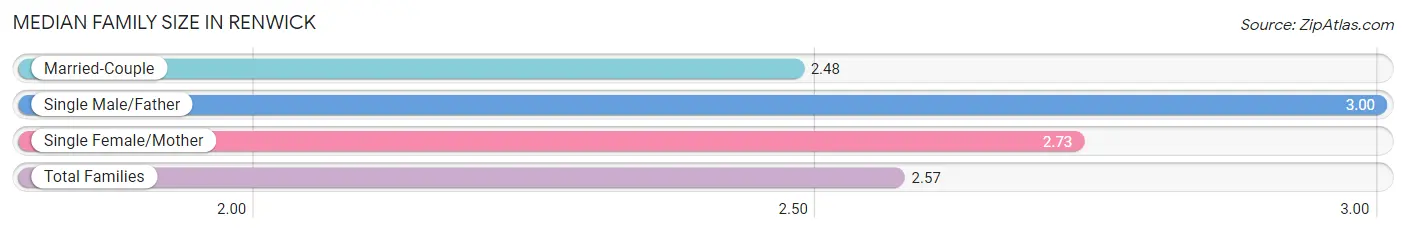
The median family size in Renwick is 2.57 persons per family, with single male/father families (7 | 9.7%) accounting for the largest median family size of 3 persons per family. On the other hand, married-couple families (54 | 75.0%) represent the smallest median family size with 2.48 persons per family.
| Family Type | # Families | Family Size |
| Married-Couple | 54 (75.0%) | 2.48 |
| Single Male/Father | 7 (9.7%) | 3.00 |
| Single Female/Mother | 11 (15.3%) | 2.73 |
| Total Families | 72 (100.0%) | 2.57 |
Median Household Size in Renwick
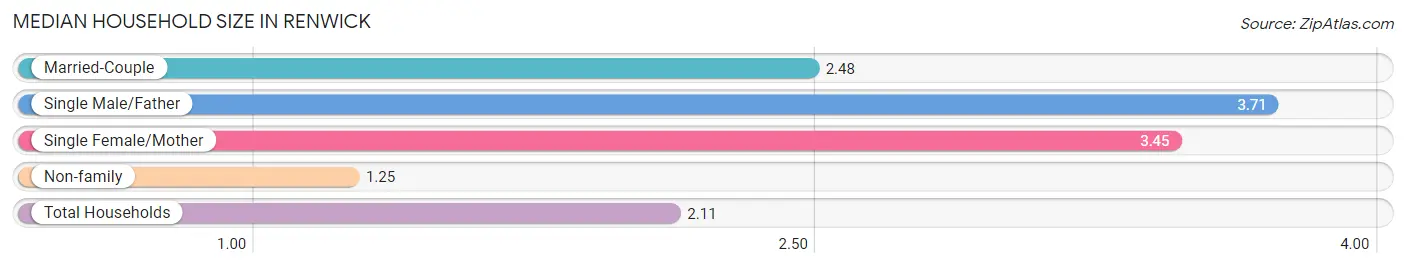
The median household size in Renwick is 2.11 persons per household, with single male/father households (7 | 5.6%) accounting for the largest median household size of 3.71 persons per household. non-family households (53 | 42.4%) represent the smallest median household size with 1.25 persons per household.
| Household Type | # Households | Household Size |
| Married-Couple | 54 (43.2%) | 2.48 |
| Single Male/Father | 7 (5.6%) | 3.71 |
| Single Female/Mother | 11 (8.8%) | 3.45 |
| Non-family | 53 (42.4%) | 1.25 |
| Total Households | 125 (100.0%) | 2.11 |
Household Size by Marriage Status in Renwick
Out of a total of 125 households in Renwick, 72 (57.6%) are family households, while 53 (42.4%) are nonfamily households. The most numerous type of family households are 2-person households, comprising 45, and the most common type of nonfamily households are 1-person households, comprising 43.
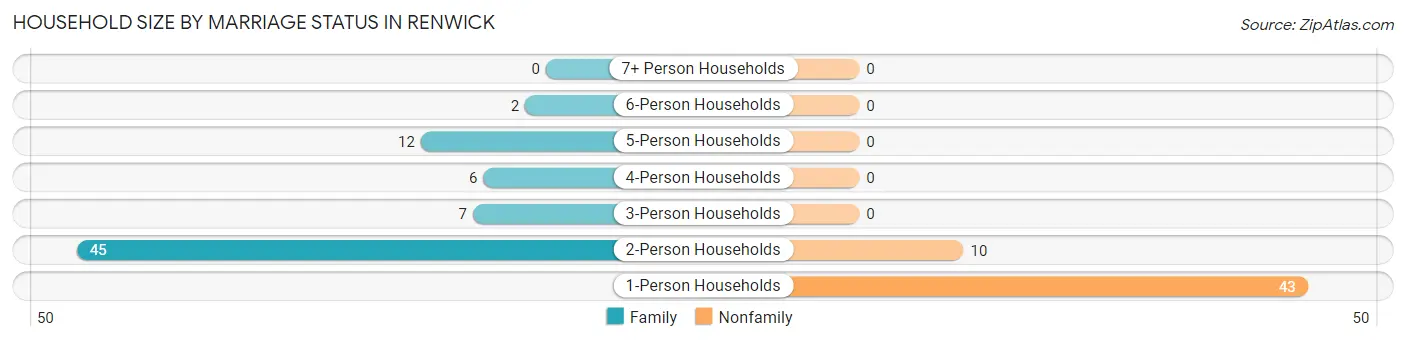
| Household Size | Family Households | Nonfamily Households |
| 1-Person Households | - | 43 (34.4%) |
| 2-Person Households | 45 (36.0%) | 10 (8.0%) |
| 3-Person Households | 7 (5.6%) | 0 (0.0%) |
| 4-Person Households | 6 (4.8%) | 0 (0.0%) |
| 5-Person Households | 12 (9.6%) | 0 (0.0%) |
| 6-Person Households | 2 (1.6%) | 0 (0.0%) |
| 7+ Person Households | 0 (0.0%) | 0 (0.0%) |
| Total | 72 (57.6%) | 53 (42.4%) |
Female Fertility in Renwick
Fertility by Age in Renwick
Average fertility rate in Renwick is 179.0 births per 1,000 women. Women in the age bracket of 20 to 34 years have the highest fertility rate with 385.0 births per 1,000 women. Women in the age bracket of 20 to 34 years acount for 100.0% of all women with births.
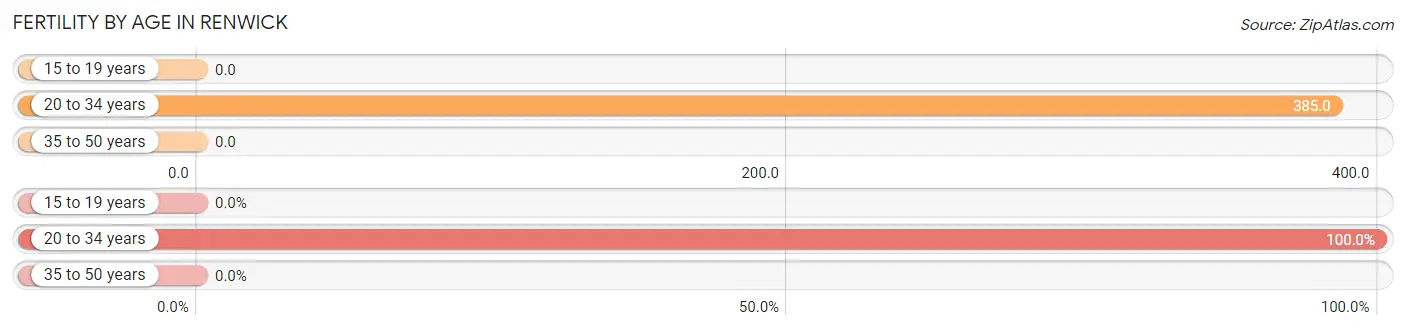
| Age Bracket | Women with Births | Births / 1,000 Women |
| 15 to 19 years | 0 (0.0%) | 0.0 |
| 20 to 34 years | 10 (100.0%) | 385.0 |
| 35 to 50 years | 0 (0.0%) | 0.0 |
| Total | 10 (100.0%) | 179.0 |
Fertility by Age by Marriage Status in Renwick
20.0% of women with births (10) in Renwick are married. The highest percentage of unmarried women with births falls into 20 to 34 years age bracket with 80.0% of them unmarried at the time of birth, while the lowest percentage of unmarried women with births belong to 20 to 34 years age bracket with 80.0% of them unmarried.
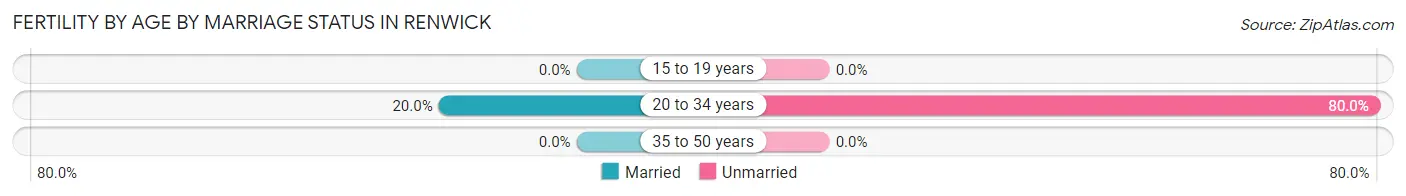
| Age Bracket | Married | Unmarried |
| 15 to 19 years | 0 (0.0%) | 0 (0.0%) |
| 20 to 34 years | 2 (20.0%) | 8 (80.0%) |
| 35 to 50 years | 0 (0.0%) | 0 (0.0%) |
| Total | 2 (20.0%) | 8 (80.0%) |
Fertility by Education in Renwick
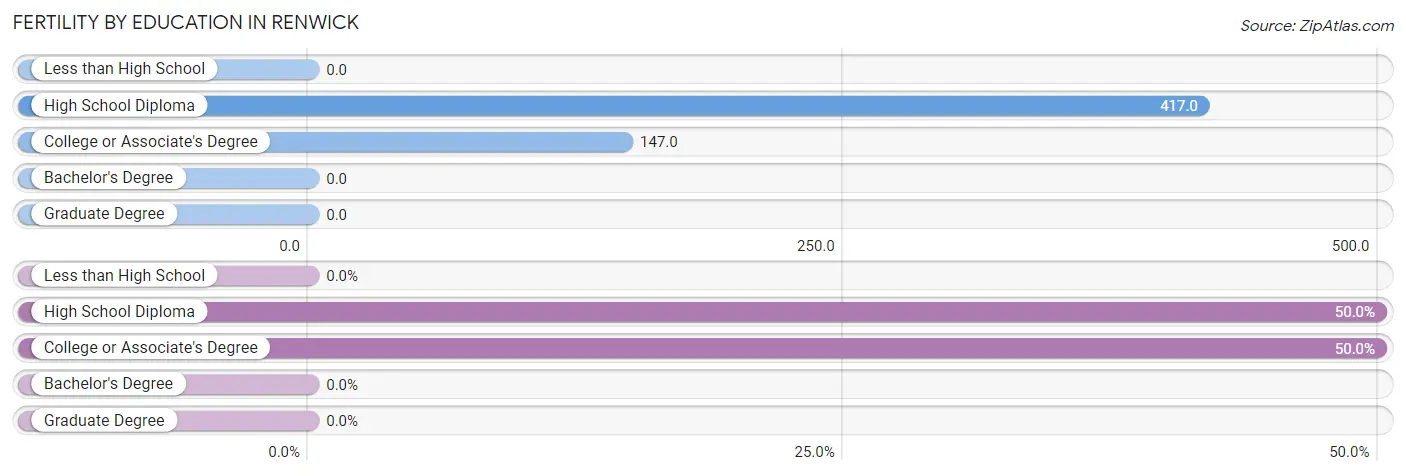
| Educational Attainment | Women with Births | Births / 1,000 Women |
| Less than High School | 0 (0.0%) | 0.0 |
| High School Diploma | 5 (50.0%) | 417.0 |
| College or Associate's Degree | 5 (50.0%) | 147.0 |
| Bachelor's Degree | 0 (0.0%) | 0.0 |
| Graduate Degree | 0 (0.0%) | 0.0 |
| Total | 10 (100.0%) | 179.0 |
Fertility by Education by Marriage Status in Renwick
80.0% of women with births in Renwick are unmarried. Women with the educational attainment of high school diploma are most likely to be married with 40.0% of them married at childbirth, while women with the educational attainment of college or associate's degree are least likely to be married with 100.0% of them unmarried at childbirth.
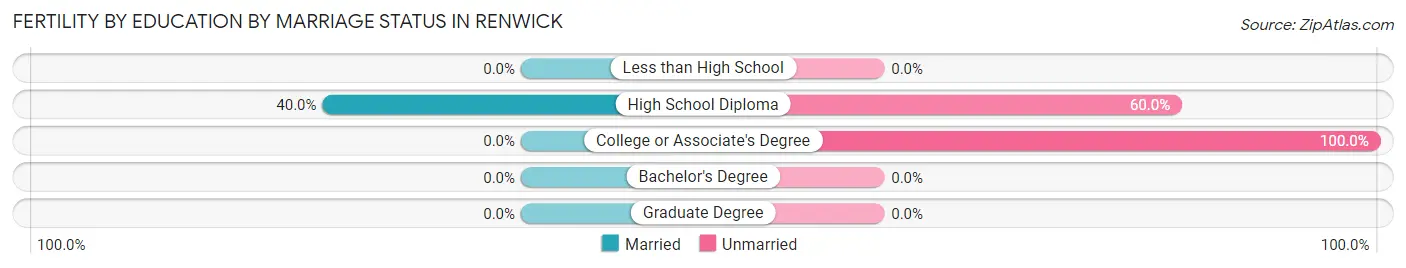
| Educational Attainment | Married | Unmarried |
| Less than High School | 0 (0.0%) | 0 (0.0%) |
| High School Diploma | 2 (40.0%) | 3 (60.0%) |
| College or Associate's Degree | 0 (0.0%) | 5 (100.0%) |
| Bachelor's Degree | 0 (0.0%) | 0 (0.0%) |
| Graduate Degree | 0 (0.0%) | 0 (0.0%) |
| Total | 2 (20.0%) | 8 (80.0%) |
Employment Characteristics in Renwick
Employment by Class of Employer in Renwick
Among the 166 employed individuals in Renwick, private company employees (120 | 72.3%), self-employed (not incorporated) (15 | 9.0%), and local government employees (12 | 7.2%) make up the most common classes of employment.
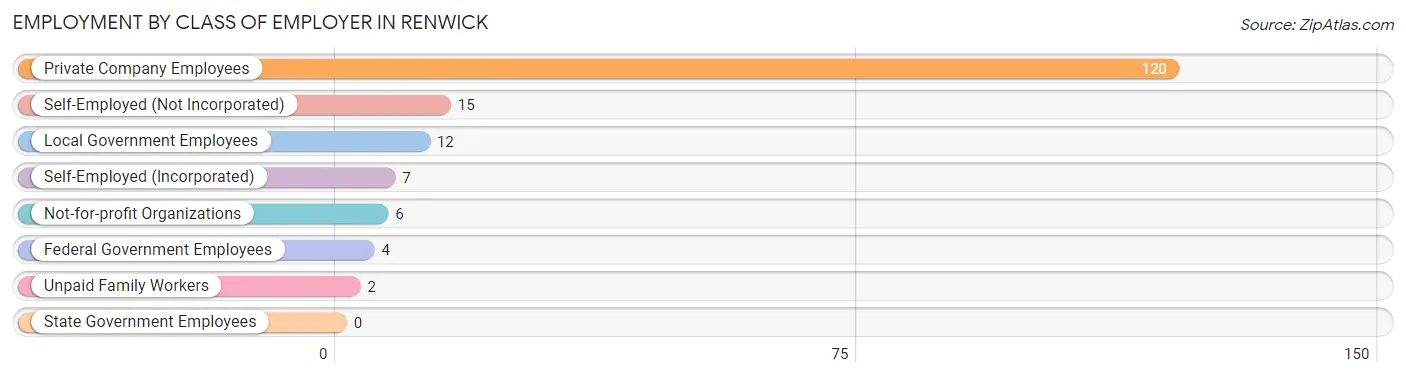
| Employer Class | # Employees | % Employees |
| Private Company Employees | 120 | 72.3% |
| Self-Employed (Incorporated) | 7 | 4.2% |
| Self-Employed (Not Incorporated) | 15 | 9.0% |
| Not-for-profit Organizations | 6 | 3.6% |
| Local Government Employees | 12 | 7.2% |
| State Government Employees | 0 | 0.0% |
| Federal Government Employees | 4 | 2.4% |
| Unpaid Family Workers | 2 | 1.2% |
| Total | 166 | 100.0% |
Employment Status by Age in Renwick
According to the labor force statistics for Renwick, out of the total population over 16 years of age (221), 75.6% or 167 individuals are in the labor force, with 0.6% or 1 of them unemployed. The age group with the highest labor force participation rate is 20 to 24 years, with 100.0% or 28 individuals in the labor force. Within the labor force, the 30 to 34 years age range has the highest percentage of unemployed individuals, with 16.7% or 1 of them being unemployed.
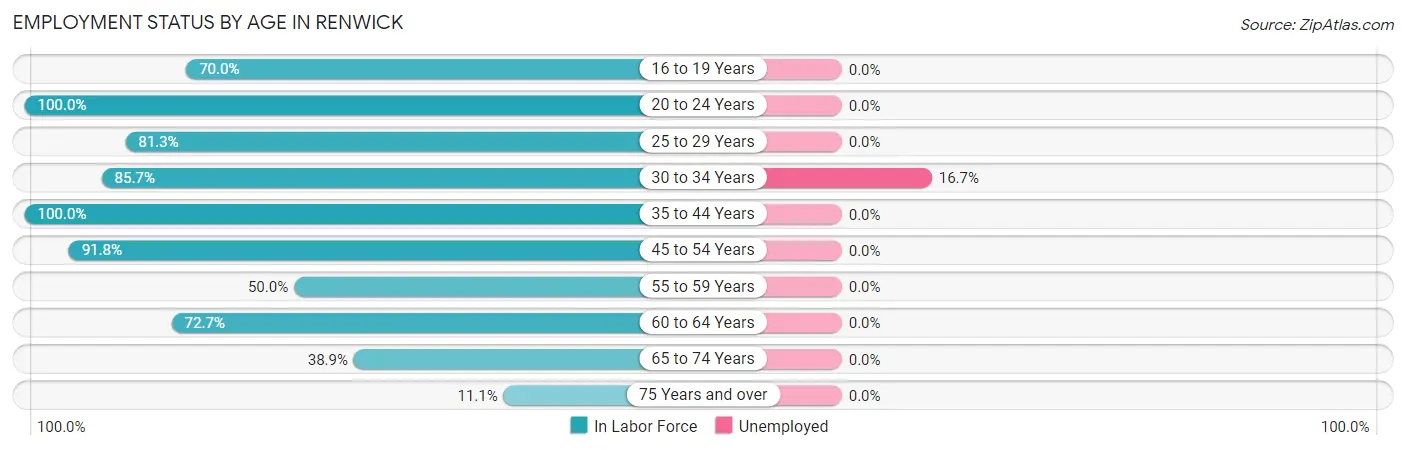
| Age Bracket | In Labor Force | Unemployed |
| 16 to 19 Years | 14 (70.0%) | 0 (0.0%) |
| 20 to 24 Years | 28 (100.0%) | 0 (0.0%) |
| 25 to 29 Years | 13 (81.3%) | 0 (0.0%) |
| 30 to 34 Years | 6 (85.7%) | 1 (16.7%) |
| 35 to 44 Years | 19 (100.0%) | 0 (0.0%) |
| 45 to 54 Years | 56 (91.8%) | 0 (0.0%) |
| 55 to 59 Years | 6 (50.0%) | 0 (0.0%) |
| 60 to 64 Years | 16 (72.7%) | 0 (0.0%) |
| 65 to 74 Years | 7 (38.9%) | 0 (0.0%) |
| 75 Years and over | 2 (11.1%) | 0 (0.0%) |
| Total | 167 (75.6%) | 1 (0.6%) |
Employment Status by Educational Attainment in Renwick
According to labor force statistics for Renwick, 84.7% of individuals (116) out of the total population between 25 and 64 years of age (137) are in the labor force, with 0.9% or 1 of them being unemployed. The group with the highest labor force participation rate are those with the educational attainment of bachelor's degree or higher, with 100.0% or 18 individuals in the labor force. Within the labor force, individuals with college / associate degree education have the highest percentage of unemployment, with 1.7% or 1 of them being unemployed.
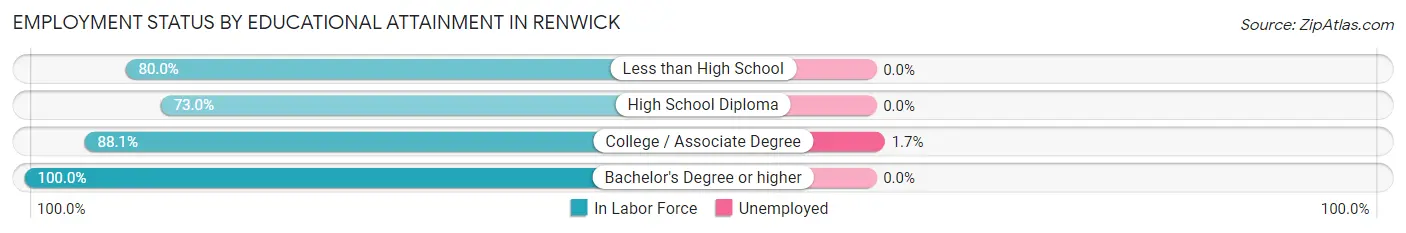
| Educational Attainment | In Labor Force | Unemployed |
| Less than High School | 12 (80.0%) | 0 (0.0%) |
| High School Diploma | 27 (73.0%) | 0 (0.0%) |
| College / Associate Degree | 59 (88.1%) | 1 (1.7%) |
| Bachelor's Degree or higher | 18 (100.0%) | 0 (0.0%) |
| Total | 116 (84.7%) | 1 (0.9%) |
Employment Occupations by Sex in Renwick
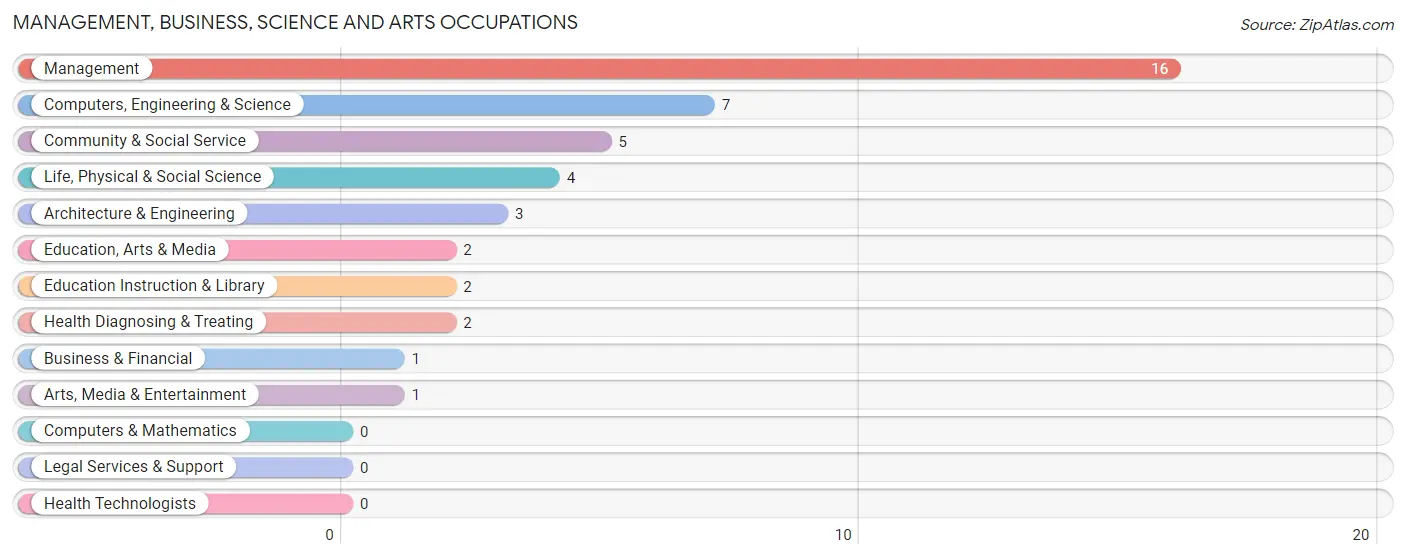
Management, Business, Science and Arts Occupations
The most common Management, Business, Science and Arts occupations in Renwick are Management (16 | 9.6%), Computers, Engineering & Science (7 | 4.2%), Community & Social Service (5 | 3.0%), Life, Physical & Social Science (4 | 2.4%), and Architecture & Engineering (3 | 1.8%).
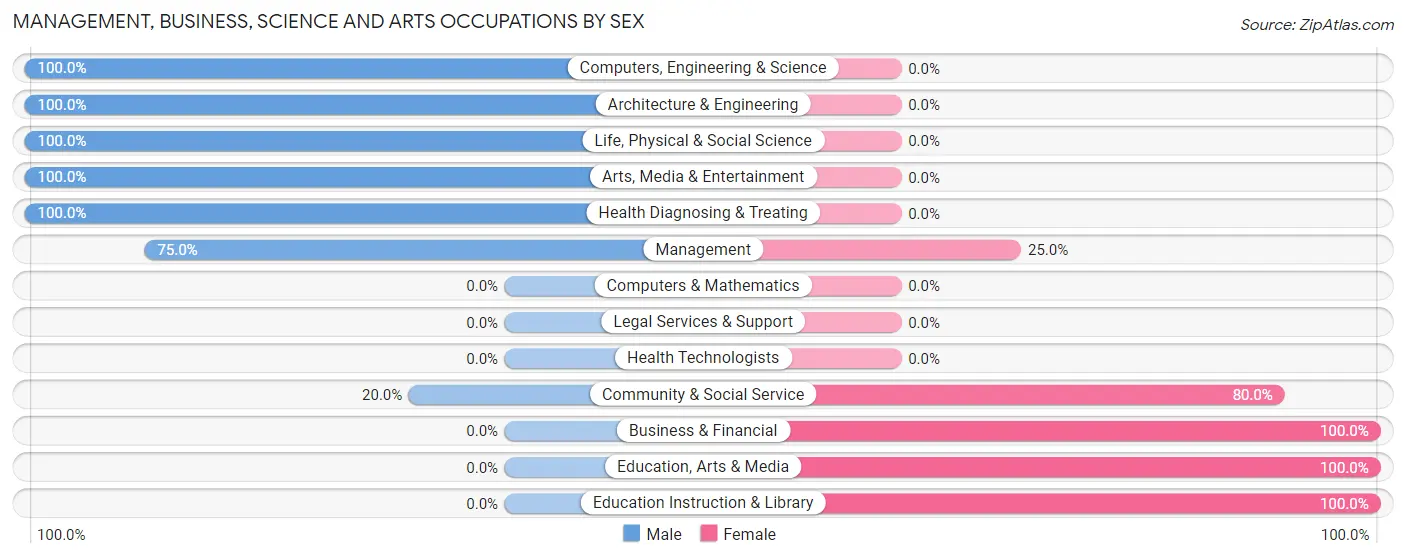
Management, Business, Science and Arts Occupations by Sex
Within the Management, Business, Science and Arts occupations in Renwick, the most male-oriented occupations are Computers, Engineering & Science (100.0%), Architecture & Engineering (100.0%), and Life, Physical & Social Science (100.0%), while the most female-oriented occupations are Business & Financial (100.0%), Education, Arts & Media (100.0%), and Education Instruction & Library (100.0%).
| Occupation | Male | Female |
| Management | 12 (75.0%) | 4 (25.0%) |
| Business & Financial | 0 (0.0%) | 1 (100.0%) |
| Computers, Engineering & Science | 7 (100.0%) | 0 (0.0%) |
| Computers & Mathematics | 0 (0.0%) | 0 (0.0%) |
| Architecture & Engineering | 3 (100.0%) | 0 (0.0%) |
| Life, Physical & Social Science | 4 (100.0%) | 0 (0.0%) |
| Community & Social Service | 1 (20.0%) | 4 (80.0%) |
| Education, Arts & Media | 0 (0.0%) | 2 (100.0%) |
| Legal Services & Support | 0 (0.0%) | 0 (0.0%) |
| Education Instruction & Library | 0 (0.0%) | 2 (100.0%) |
| Arts, Media & Entertainment | 1 (100.0%) | 0 (0.0%) |
| Health Diagnosing & Treating | 2 (100.0%) | 0 (0.0%) |
| Health Technologists | 0 (0.0%) | 0 (0.0%) |
| Total (Category) | 22 (71.0%) | 9 (29.0%) |
| Total (Overall) | 98 (59.0%) | 68 (41.0%) |
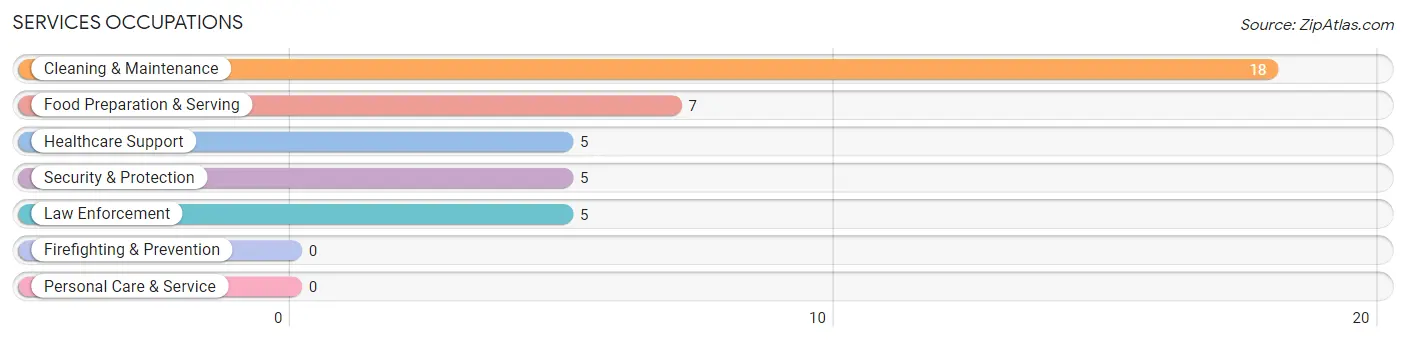
Services Occupations
The most common Services occupations in Renwick are Cleaning & Maintenance (18 | 10.8%), Food Preparation & Serving (7 | 4.2%), Healthcare Support (5 | 3.0%), Security & Protection (5 | 3.0%), and Law Enforcement (5 | 3.0%).
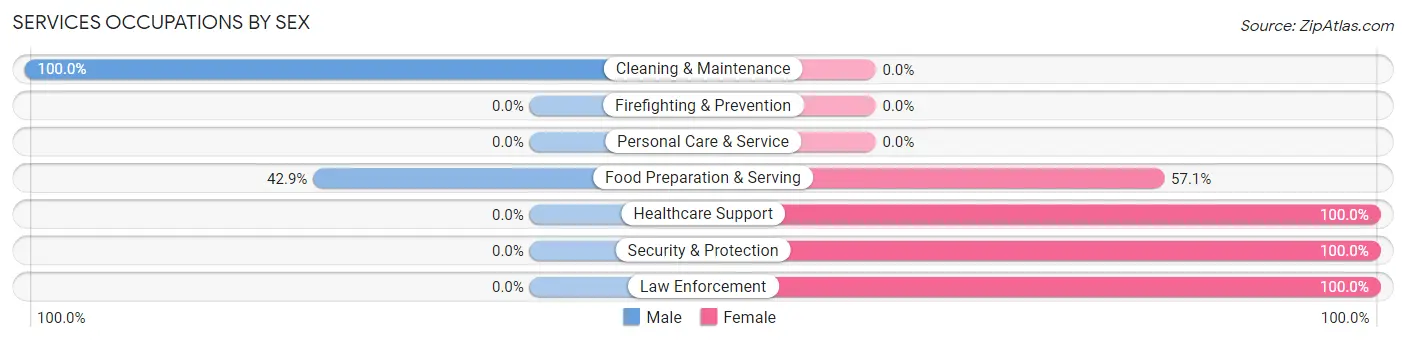
Services Occupations by Sex
Within the Services occupations in Renwick, the most male-oriented occupations are Cleaning & Maintenance (100.0%), and Food Preparation & Serving (42.9%), while the most female-oriented occupations are Healthcare Support (100.0%), Security & Protection (100.0%), and Law Enforcement (100.0%).
| Occupation | Male | Female |
| Healthcare Support | 0 (0.0%) | 5 (100.0%) |
| Security & Protection | 0 (0.0%) | 5 (100.0%) |
| Firefighting & Prevention | 0 (0.0%) | 0 (0.0%) |
| Law Enforcement | 0 (0.0%) | 5 (100.0%) |
| Food Preparation & Serving | 3 (42.9%) | 4 (57.1%) |
| Cleaning & Maintenance | 18 (100.0%) | 0 (0.0%) |
| Personal Care & Service | 0 (0.0%) | 0 (0.0%) |
| Total (Category) | 21 (60.0%) | 14 (40.0%) |
| Total (Overall) | 98 (59.0%) | 68 (41.0%) |
Sales and Office Occupations
The most common Sales and Office occupations in Renwick are Office & Administration (24 | 14.5%), and Sales & Related (11 | 6.6%).
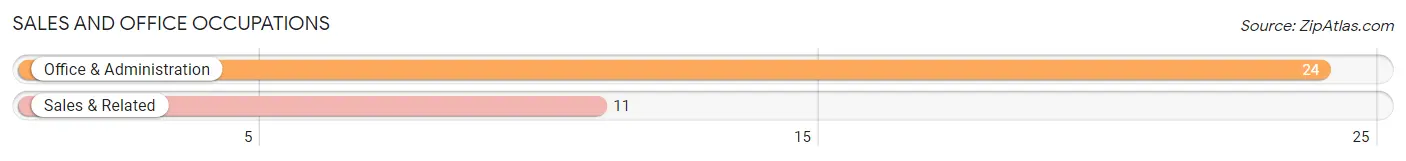
Sales and Office Occupations by Sex
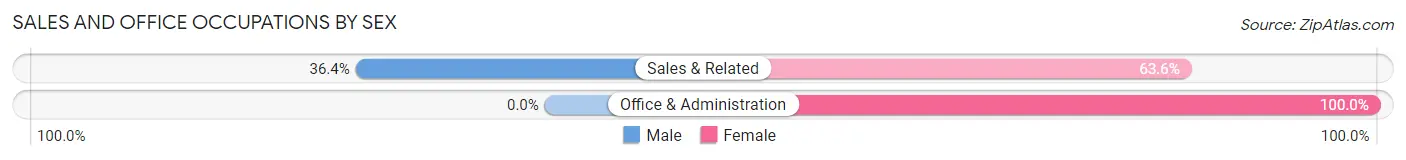
| Occupation | Male | Female |
| Sales & Related | 4 (36.4%) | 7 (63.6%) |
| Office & Administration | 0 (0.0%) | 24 (100.0%) |
| Total (Category) | 4 (11.4%) | 31 (88.6%) |
| Total (Overall) | 98 (59.0%) | 68 (41.0%) |
Natural Resources, Construction and Maintenance Occupations
The most common Natural Resources, Construction and Maintenance occupations in Renwick are Construction & Extraction (14 | 8.4%), Farming, Fishing & Forestry (12 | 7.2%), and Installation, Maintenance & Repair (9 | 5.4%).
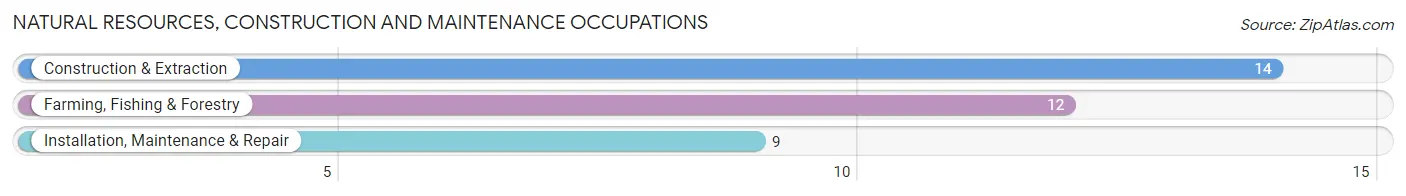
Natural Resources, Construction and Maintenance Occupations by Sex
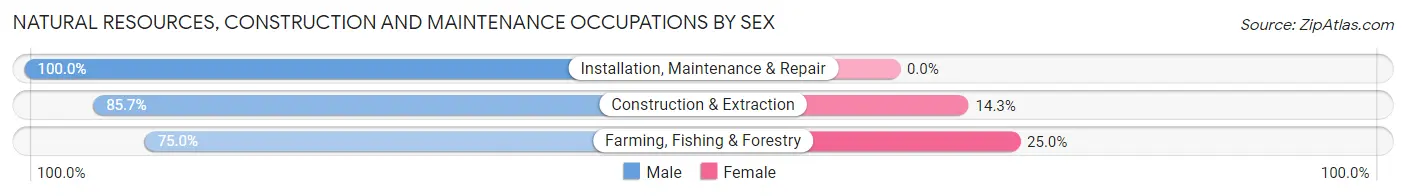
| Occupation | Male | Female |
| Farming, Fishing & Forestry | 9 (75.0%) | 3 (25.0%) |
| Construction & Extraction | 12 (85.7%) | 2 (14.3%) |
| Installation, Maintenance & Repair | 9 (100.0%) | 0 (0.0%) |
| Total (Category) | 30 (85.7%) | 5 (14.3%) |
| Total (Overall) | 98 (59.0%) | 68 (41.0%) |
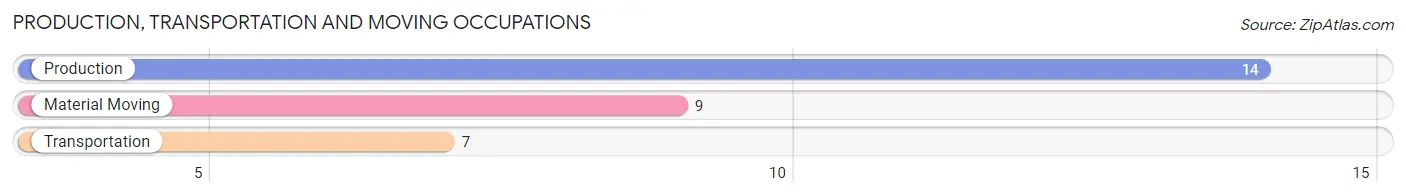
Production, Transportation and Moving Occupations
The most common Production, Transportation and Moving occupations in Renwick are Production (14 | 8.4%), Material Moving (9 | 5.4%), and Transportation (7 | 4.2%).
Production, Transportation and Moving Occupations by Sex
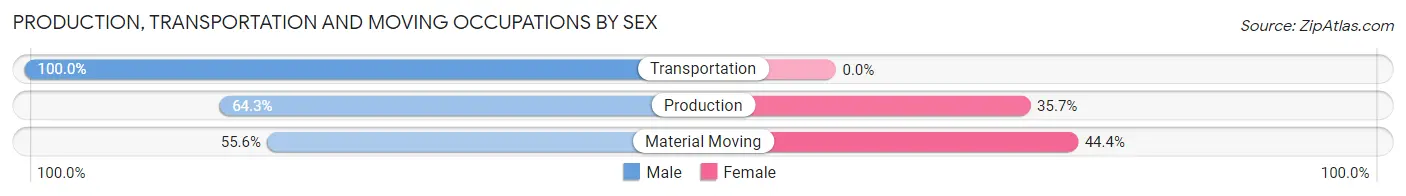
| Occupation | Male | Female |
| Production | 9 (64.3%) | 5 (35.7%) |
| Transportation | 7 (100.0%) | 0 (0.0%) |
| Material Moving | 5 (55.6%) | 4 (44.4%) |
| Total (Category) | 21 (70.0%) | 9 (30.0%) |
| Total (Overall) | 98 (59.0%) | 68 (41.0%) |
Employment Industries by Sex in Renwick
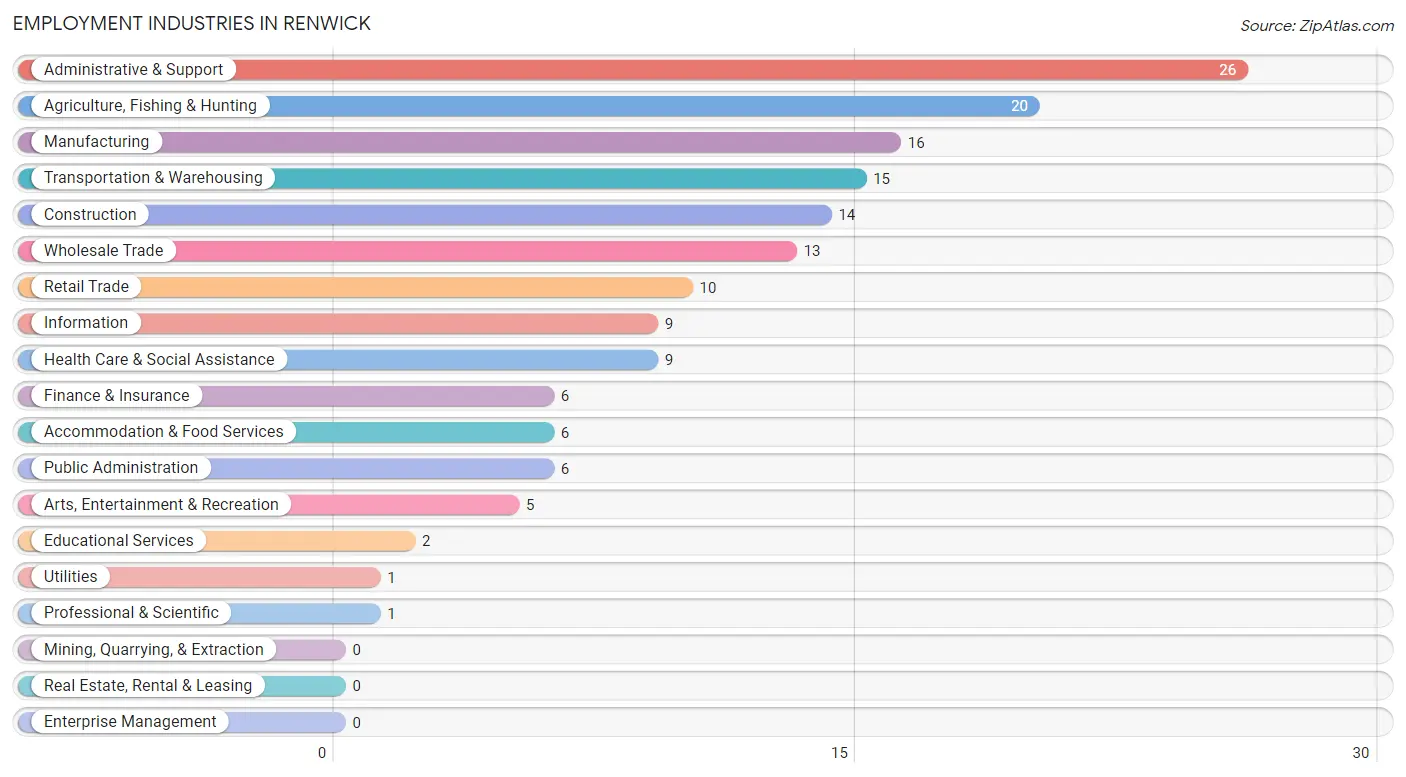
Employment Industries in Renwick
The major employment industries in Renwick include Administrative & Support (26 | 15.7%), Agriculture, Fishing & Hunting (20 | 12.0%), Manufacturing (16 | 9.6%), Transportation & Warehousing (15 | 9.0%), and Construction (14 | 8.4%).
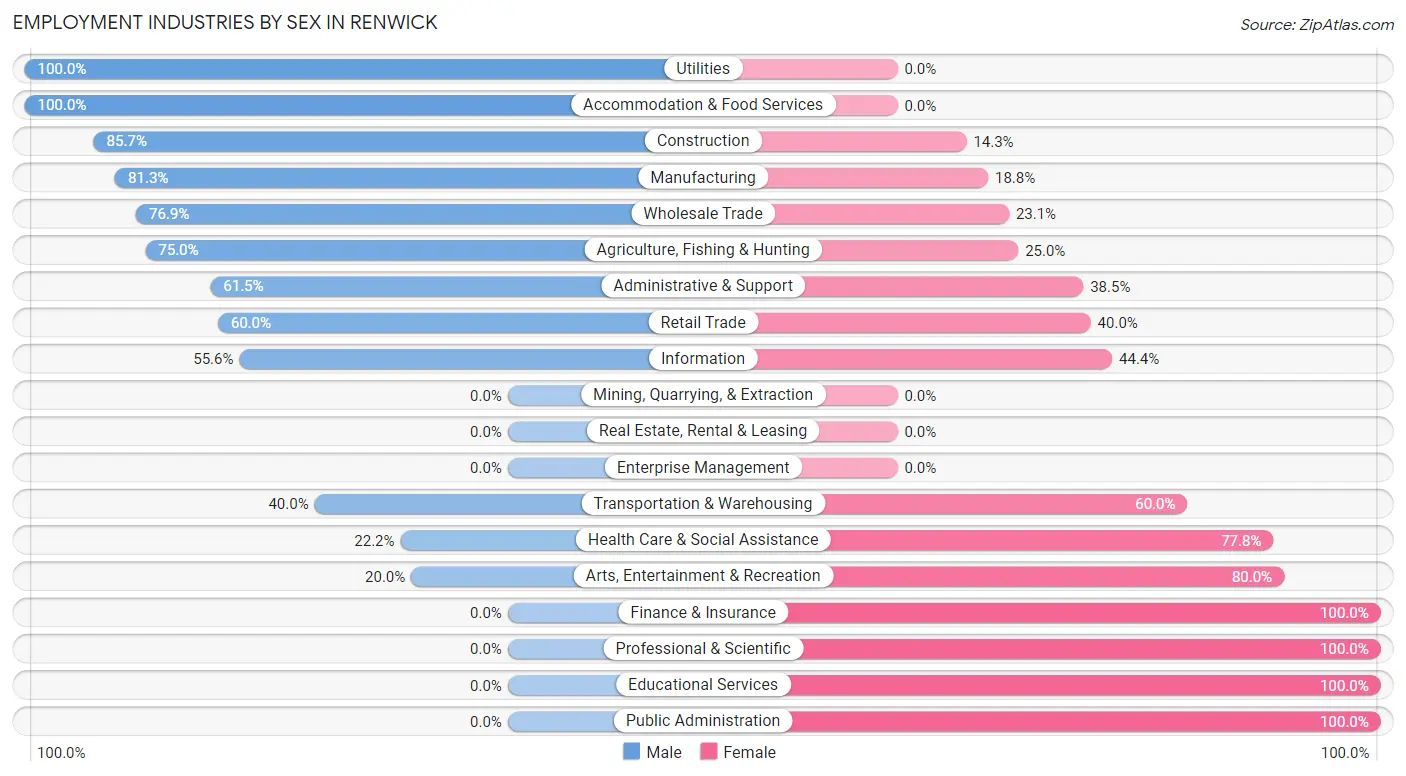
Employment Industries by Sex in Renwick
The Renwick industries that see more men than women are Utilities (100.0%), Accommodation & Food Services (100.0%), and Construction (85.7%), whereas the industries that tend to have a higher number of women are Finance & Insurance (100.0%), Professional & Scientific (100.0%), and Educational Services (100.0%).
| Industry | Male | Female |
| Agriculture, Fishing & Hunting | 15 (75.0%) | 5 (25.0%) |
| Mining, Quarrying, & Extraction | 0 (0.0%) | 0 (0.0%) |
| Construction | 12 (85.7%) | 2 (14.3%) |
| Manufacturing | 13 (81.2%) | 3 (18.8%) |
| Wholesale Trade | 10 (76.9%) | 3 (23.1%) |
| Retail Trade | 6 (60.0%) | 4 (40.0%) |
| Transportation & Warehousing | 6 (40.0%) | 9 (60.0%) |
| Utilities | 1 (100.0%) | 0 (0.0%) |
| Information | 5 (55.6%) | 4 (44.4%) |
| Finance & Insurance | 0 (0.0%) | 6 (100.0%) |
| Real Estate, Rental & Leasing | 0 (0.0%) | 0 (0.0%) |
| Professional & Scientific | 0 (0.0%) | 1 (100.0%) |
| Enterprise Management | 0 (0.0%) | 0 (0.0%) |
| Administrative & Support | 16 (61.5%) | 10 (38.5%) |
| Educational Services | 0 (0.0%) | 2 (100.0%) |
| Health Care & Social Assistance | 2 (22.2%) | 7 (77.8%) |
| Arts, Entertainment & Recreation | 1 (20.0%) | 4 (80.0%) |
| Accommodation & Food Services | 6 (100.0%) | 0 (0.0%) |
| Public Administration | 0 (0.0%) | 6 (100.0%) |
| Total | 98 (59.0%) | 68 (41.0%) |
Education in Renwick
School Enrollment in Renwick
The most common levels of schooling among the 40 students in Renwick are middle school (14 | 35.0%), high school (13 | 32.5%), and elementary school (10 | 25.0%).
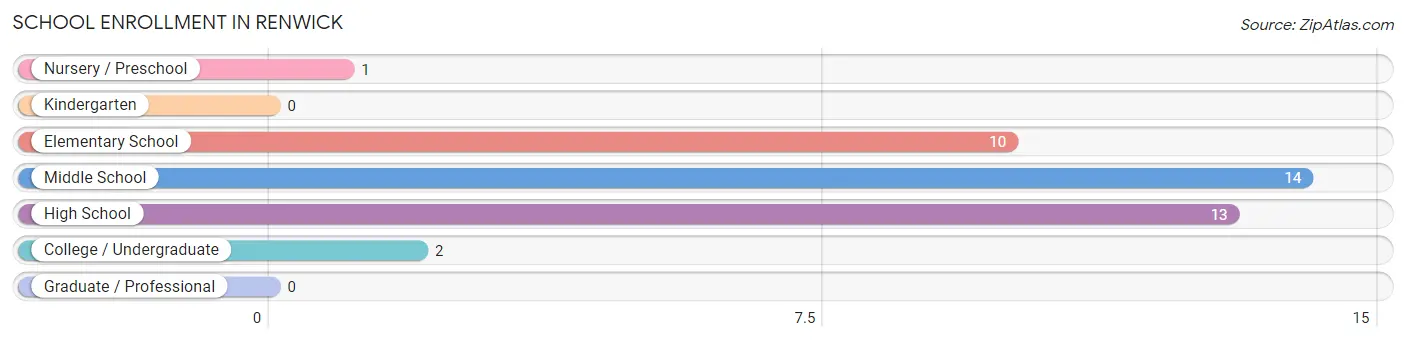
| School Level | # Students | % Students |
| Nursery / Preschool | 1 | 2.5% |
| Kindergarten | 0 | 0.0% |
| Elementary School | 10 | 25.0% |
| Middle School | 14 | 35.0% |
| High School | 13 | 32.5% |
| College / Undergraduate | 2 | 5.0% |
| Graduate / Professional | 0 | 0.0% |
| Total | 40 | 100.0% |
School Enrollment by Age by Funding Source in Renwick
Out of a total of 40 students who are enrolled in schools in Renwick, 1 (2.5%) attend a private institution, while the remaining 39 (97.5%) are enrolled in public schools. The age group of 3 to 4 year olds has the highest likelihood of being enrolled in private schools, with 1 (100.0% in the age bracket) enrolled. Conversely, the age group of 5 to 9 year old has the lowest likelihood of being enrolled in a private school, with 10 (100.0% in the age bracket) attending a public institution.
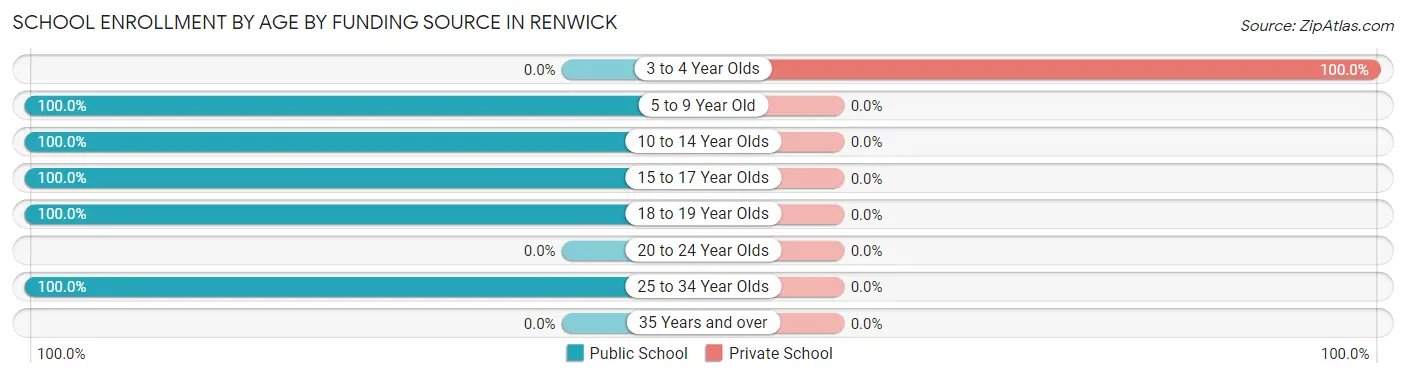
| Age Bracket | Public School | Private School |
| 3 to 4 Year Olds | 0 (0.0%) | 1 (100.0%) |
| 5 to 9 Year Old | 10 (100.0%) | 0 (0.0%) |
| 10 to 14 Year Olds | 14 (100.0%) | 0 (0.0%) |
| 15 to 17 Year Olds | 9 (100.0%) | 0 (0.0%) |
| 18 to 19 Year Olds | 4 (100.0%) | 0 (0.0%) |
| 20 to 24 Year Olds | 0 (0.0%) | 0 (0.0%) |
| 25 to 34 Year Olds | 2 (100.0%) | 0 (0.0%) |
| 35 Years and over | 0 (0.0%) | 0 (0.0%) |
| Total | 39 (97.5%) | 1 (2.5%) |
Educational Attainment by Field of Study in Renwick
Engineering (6 | 28.6%), social sciences (5 | 23.8%), business (5 | 23.8%), education (3 | 14.3%), and arts & humanities (2 | 9.5%) are the most common fields of study among 21 individuals in Renwick who have obtained a bachelor's degree or higher.
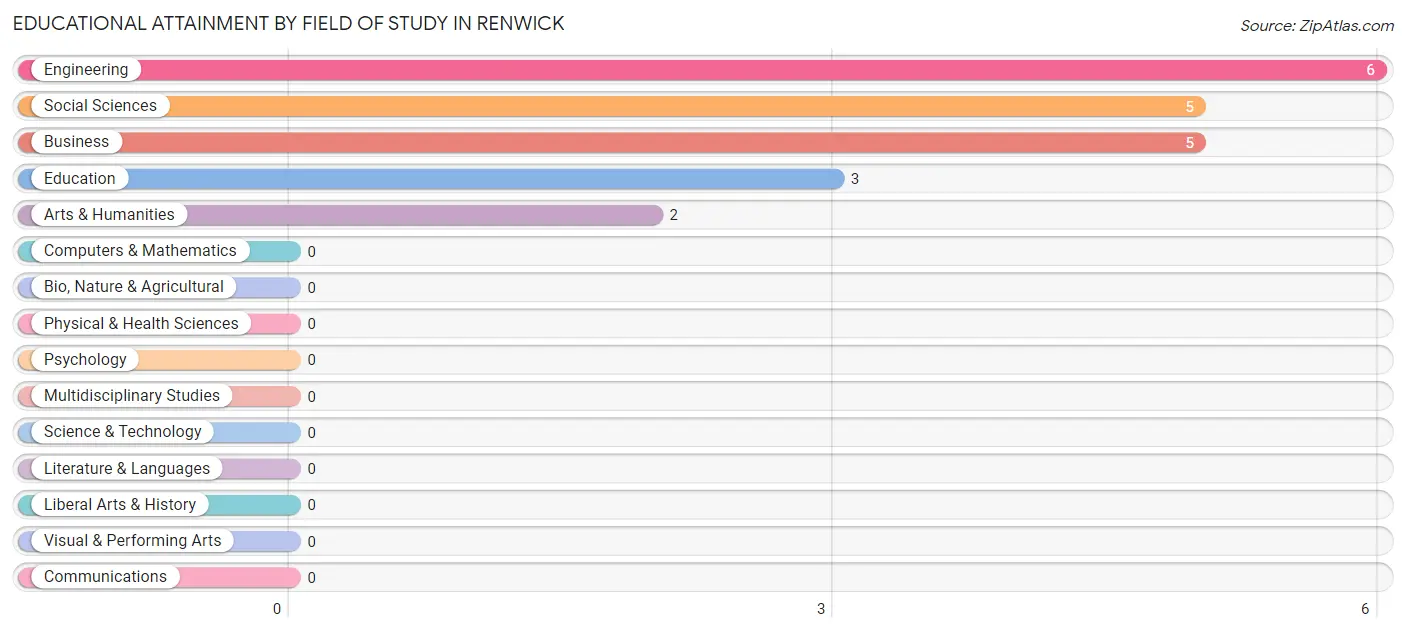
| Field of Study | # Graduates | % Graduates |
| Computers & Mathematics | 0 | 0.0% |
| Bio, Nature & Agricultural | 0 | 0.0% |
| Physical & Health Sciences | 0 | 0.0% |
| Psychology | 0 | 0.0% |
| Social Sciences | 5 | 23.8% |
| Engineering | 6 | 28.6% |
| Multidisciplinary Studies | 0 | 0.0% |
| Science & Technology | 0 | 0.0% |
| Business | 5 | 23.8% |
| Education | 3 | 14.3% |
| Literature & Languages | 0 | 0.0% |
| Liberal Arts & History | 0 | 0.0% |
| Visual & Performing Arts | 0 | 0.0% |
| Communications | 0 | 0.0% |
| Arts & Humanities | 2 | 9.5% |
| Total | 21 | 100.0% |
Transportation & Commute in Renwick
Vehicle Availability by Sex in Renwick
The most prevalent vehicle ownership categories in Renwick are males with 2 vehicles (52, accounting for 53.1%) and females with 2 vehicles (37, making up 76.5%).
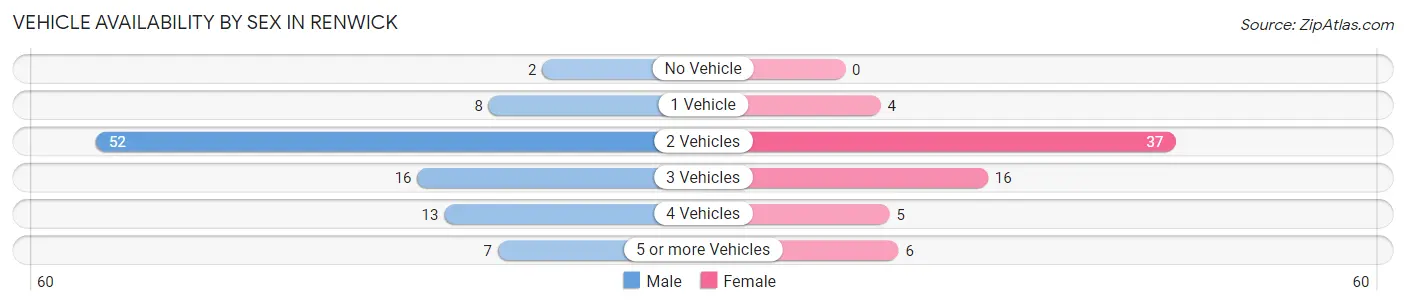
| Vehicles Available | Male | Female |
| No Vehicle | 2 (2.0%) | 0 (0.0%) |
| 1 Vehicle | 8 (8.2%) | 4 (5.9%) |
| 2 Vehicles | 52 (53.1%) | 37 (54.4%) |
| 3 Vehicles | 16 (16.3%) | 16 (23.5%) |
| 4 Vehicles | 13 (13.3%) | 5 (7.3%) |
| 5 or more Vehicles | 7 (7.1%) | 6 (8.8%) |
| Total | 98 (100.0%) | 68 (100.0%) |
Commute Time in Renwick
The most frequently occuring commute durations in Renwick are 20 to 24 minutes (29 commuters, 19.9%), 30 to 34 minutes (27 commuters, 18.5%), and 15 to 19 minutes (20 commuters, 13.7%).
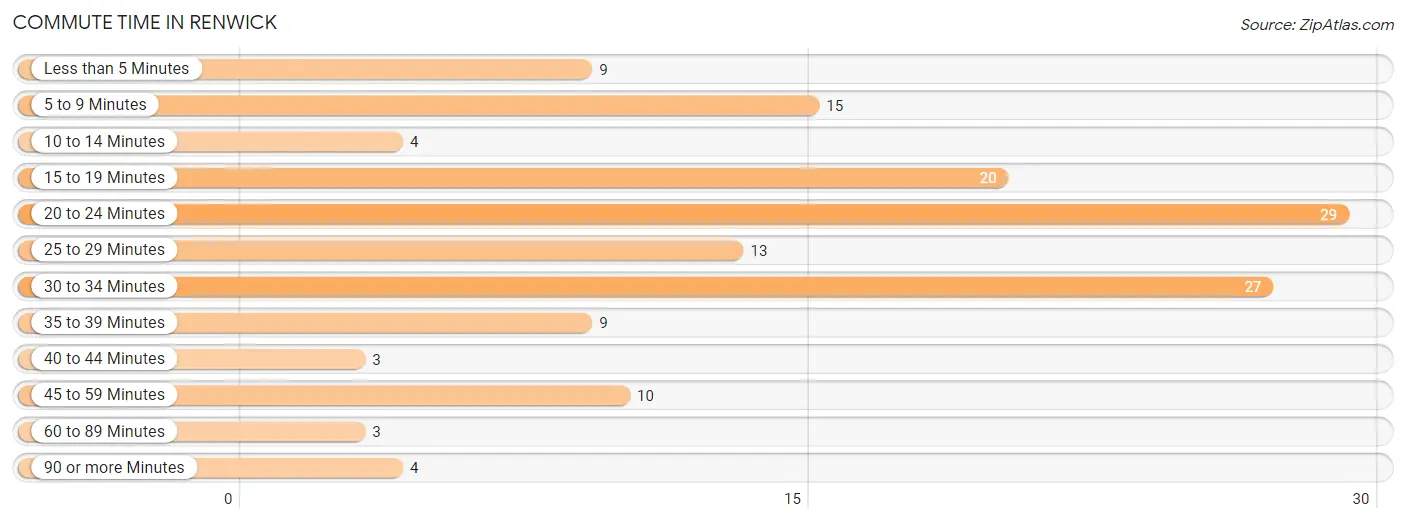
| Commute Time | # Commuters | % Commuters |
| Less than 5 Minutes | 9 | 6.2% |
| 5 to 9 Minutes | 15 | 10.3% |
| 10 to 14 Minutes | 4 | 2.7% |
| 15 to 19 Minutes | 20 | 13.7% |
| 20 to 24 Minutes | 29 | 19.9% |
| 25 to 29 Minutes | 13 | 8.9% |
| 30 to 34 Minutes | 27 | 18.5% |
| 35 to 39 Minutes | 9 | 6.2% |
| 40 to 44 Minutes | 3 | 2.1% |
| 45 to 59 Minutes | 10 | 6.9% |
| 60 to 89 Minutes | 3 | 2.1% |
| 90 or more Minutes | 4 | 2.7% |
Commute Time by Sex in Renwick
The most common commute times in Renwick are 30 to 34 minutes (25 commuters, 27.2%) for males and 20 to 24 minutes (21 commuters, 38.9%) for females.
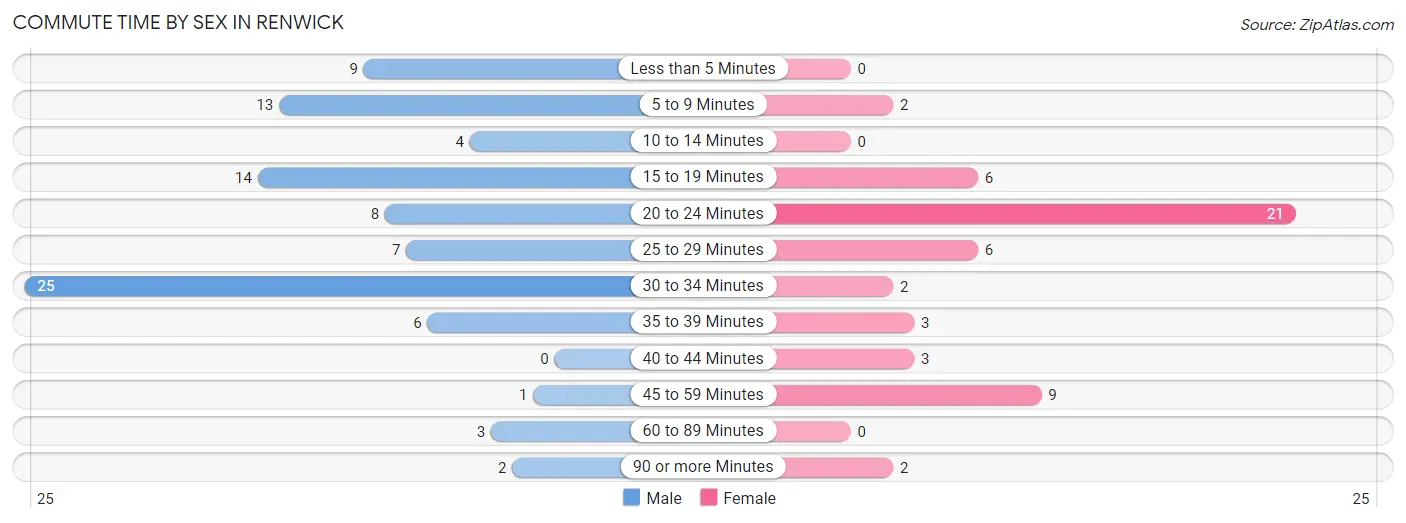
| Commute Time | Male | Female |
| Less than 5 Minutes | 9 (9.8%) | 0 (0.0%) |
| 5 to 9 Minutes | 13 (14.1%) | 2 (3.7%) |
| 10 to 14 Minutes | 4 (4.3%) | 0 (0.0%) |
| 15 to 19 Minutes | 14 (15.2%) | 6 (11.1%) |
| 20 to 24 Minutes | 8 (8.7%) | 21 (38.9%) |
| 25 to 29 Minutes | 7 (7.6%) | 6 (11.1%) |
| 30 to 34 Minutes | 25 (27.2%) | 2 (3.7%) |
| 35 to 39 Minutes | 6 (6.5%) | 3 (5.6%) |
| 40 to 44 Minutes | 0 (0.0%) | 3 (5.6%) |
| 45 to 59 Minutes | 1 (1.1%) | 9 (16.7%) |
| 60 to 89 Minutes | 3 (3.3%) | 0 (0.0%) |
| 90 or more Minutes | 2 (2.2%) | 2 (3.7%) |
Time of Departure to Work by Sex in Renwick
The most frequent times of departure to work in Renwick are 7:00 AM to 7:29 AM (27, 29.3%) for males and 7:30 AM to 7:59 AM (14, 25.9%) for females.
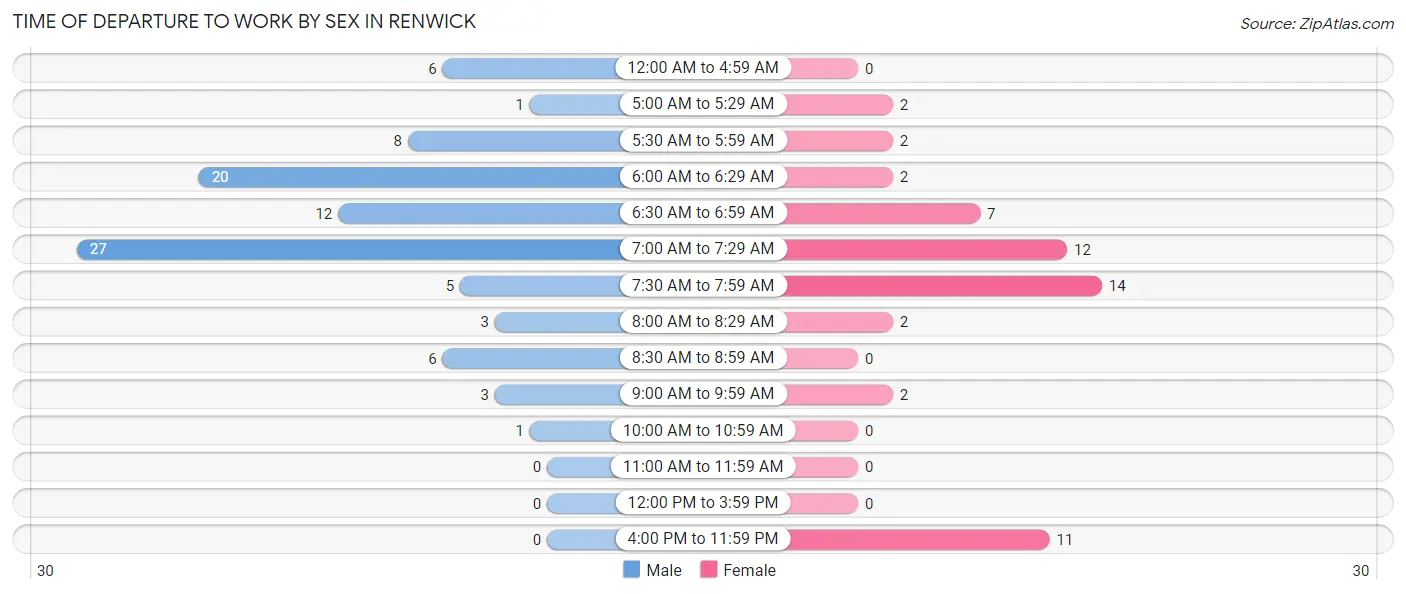
| Time of Departure | Male | Female |
| 12:00 AM to 4:59 AM | 6 (6.5%) | 0 (0.0%) |
| 5:00 AM to 5:29 AM | 1 (1.1%) | 2 (3.7%) |
| 5:30 AM to 5:59 AM | 8 (8.7%) | 2 (3.7%) |
| 6:00 AM to 6:29 AM | 20 (21.7%) | 2 (3.7%) |
| 6:30 AM to 6:59 AM | 12 (13.0%) | 7 (13.0%) |
| 7:00 AM to 7:29 AM | 27 (29.3%) | 12 (22.2%) |
| 7:30 AM to 7:59 AM | 5 (5.4%) | 14 (25.9%) |
| 8:00 AM to 8:29 AM | 3 (3.3%) | 2 (3.7%) |
| 8:30 AM to 8:59 AM | 6 (6.5%) | 0 (0.0%) |
| 9:00 AM to 9:59 AM | 3 (3.3%) | 2 (3.7%) |
| 10:00 AM to 10:59 AM | 1 (1.1%) | 0 (0.0%) |
| 11:00 AM to 11:59 AM | 0 (0.0%) | 0 (0.0%) |
| 12:00 PM to 3:59 PM | 0 (0.0%) | 0 (0.0%) |
| 4:00 PM to 11:59 PM | 0 (0.0%) | 11 (20.4%) |
| Total | 92 (100.0%) | 54 (100.0%) |
Housing Occupancy in Renwick
Occupancy by Ownership in Renwick
Of the total 125 dwellings in Renwick, owner-occupied units account for 106 (84.8%), while renter-occupied units make up 19 (15.2%).
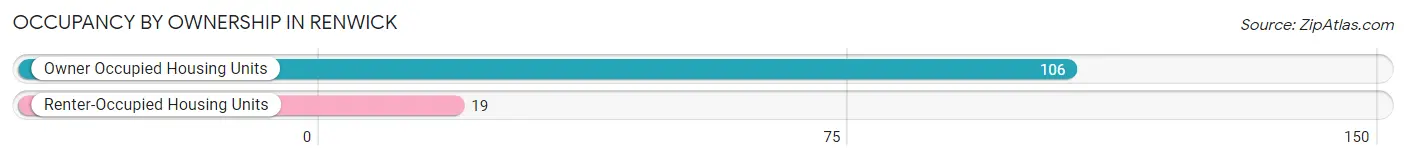
| Occupancy | # Housing Units | % Housing Units |
| Owner Occupied Housing Units | 106 | 84.8% |
| Renter-Occupied Housing Units | 19 | 15.2% |
| Total Occupied Housing Units | 125 | 100.0% |
Occupancy by Household Size in Renwick
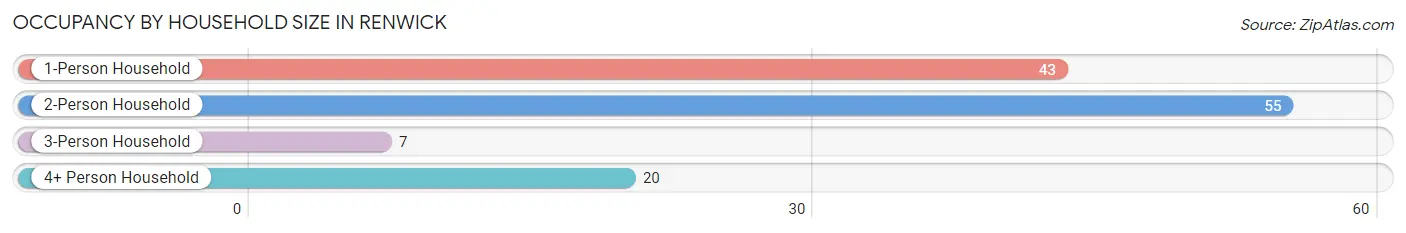
| Household Size | # Housing Units | % Housing Units |
| 1-Person Household | 43 | 34.4% |
| 2-Person Household | 55 | 44.0% |
| 3-Person Household | 7 | 5.6% |
| 4+ Person Household | 20 | 16.0% |
| Total Housing Units | 125 | 100.0% |
Occupancy by Ownership by Household Size in Renwick
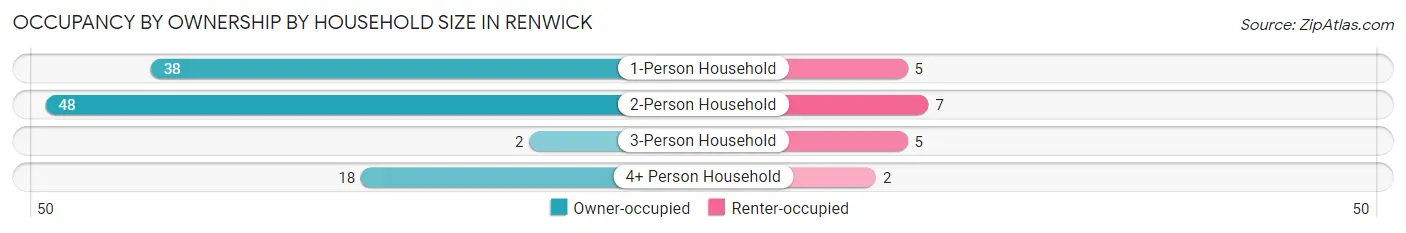
| Household Size | Owner-occupied | Renter-occupied |
| 1-Person Household | 38 (88.4%) | 5 (11.6%) |
| 2-Person Household | 48 (87.3%) | 7 (12.7%) |
| 3-Person Household | 2 (28.6%) | 5 (71.4%) |
| 4+ Person Household | 18 (90.0%) | 2 (10.0%) |
| Total Housing Units | 106 (84.8%) | 19 (15.2%) |
Occupancy by Educational Attainment in Renwick
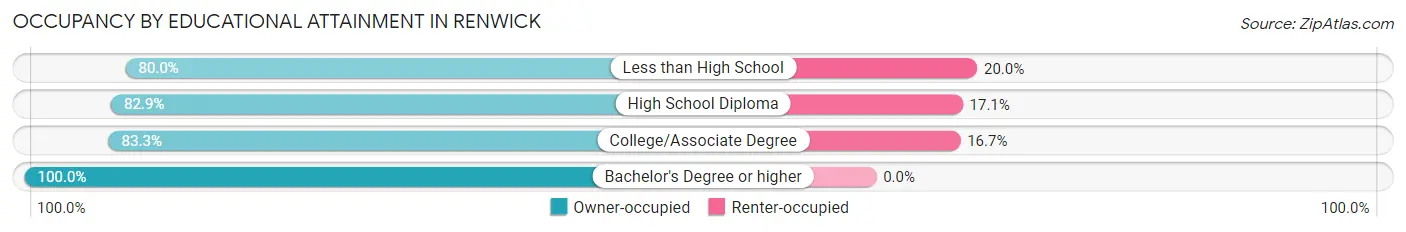
| Household Size | Owner-occupied | Renter-occupied |
| Less than High School | 8 (80.0%) | 2 (20.0%) |
| High School Diploma | 29 (82.9%) | 6 (17.1%) |
| College/Associate Degree | 55 (83.3%) | 11 (16.7%) |
| Bachelor's Degree or higher | 14 (100.0%) | 0 (0.0%) |
Occupancy by Age of Householder in Renwick
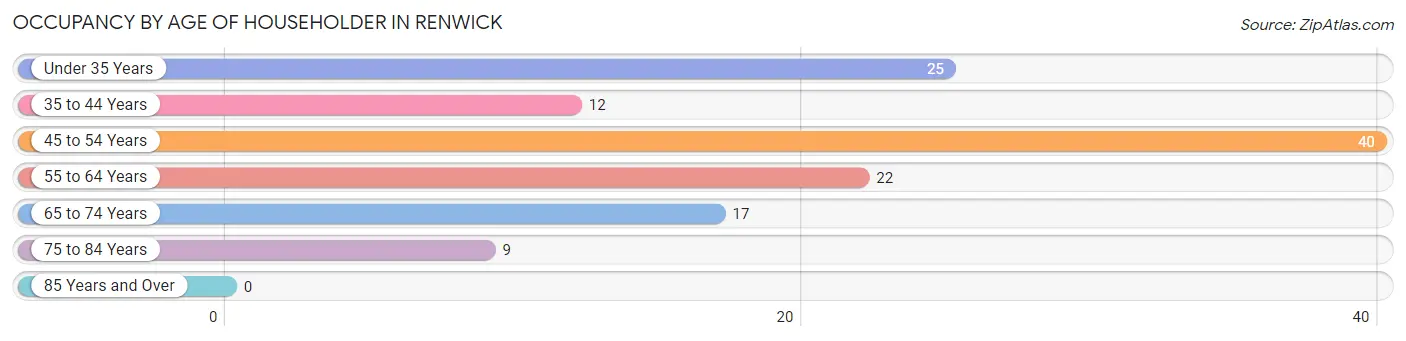
| Age Bracket | # Households | % Households |
| Under 35 Years | 25 | 20.0% |
| 35 to 44 Years | 12 | 9.6% |
| 45 to 54 Years | 40 | 32.0% |
| 55 to 64 Years | 22 | 17.6% |
| 65 to 74 Years | 17 | 13.6% |
| 75 to 84 Years | 9 | 7.2% |
| 85 Years and Over | 0 | 0.0% |
| Total | 125 | 100.0% |
Housing Finances in Renwick
Median Income by Occupancy in Renwick
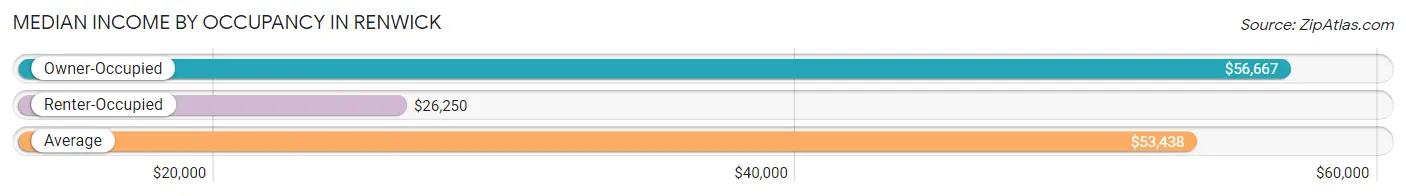
| Occupancy Type | # Households | Median Income |
| Owner-Occupied | 106 (84.8%) | $56,667 |
| Renter-Occupied | 19 (15.2%) | $26,250 |
| Average | 125 (100.0%) | $53,438 |
Occupancy by Householder Income Bracket in Renwick
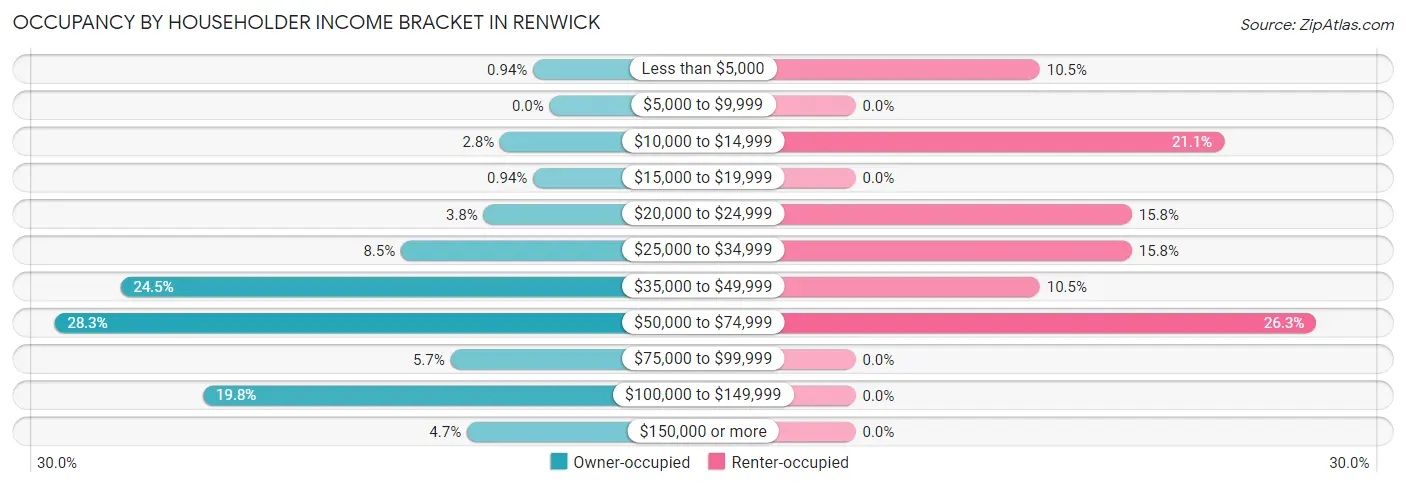
| Income Bracket | Owner-occupied | Renter-occupied |
| Less than $5,000 | 1 (0.9%) | 2 (10.5%) |
| $5,000 to $9,999 | 0 (0.0%) | 0 (0.0%) |
| $10,000 to $14,999 | 3 (2.8%) | 4 (21.0%) |
| $15,000 to $19,999 | 1 (0.9%) | 0 (0.0%) |
| $20,000 to $24,999 | 4 (3.8%) | 3 (15.8%) |
| $25,000 to $34,999 | 9 (8.5%) | 3 (15.8%) |
| $35,000 to $49,999 | 26 (24.5%) | 2 (10.5%) |
| $50,000 to $74,999 | 30 (28.3%) | 5 (26.3%) |
| $75,000 to $99,999 | 6 (5.7%) | 0 (0.0%) |
| $100,000 to $149,999 | 21 (19.8%) | 0 (0.0%) |
| $150,000 or more | 5 (4.7%) | 0 (0.0%) |
| Total | 106 (100.0%) | 19 (100.0%) |
Monthly Housing Cost Tiers in Renwick
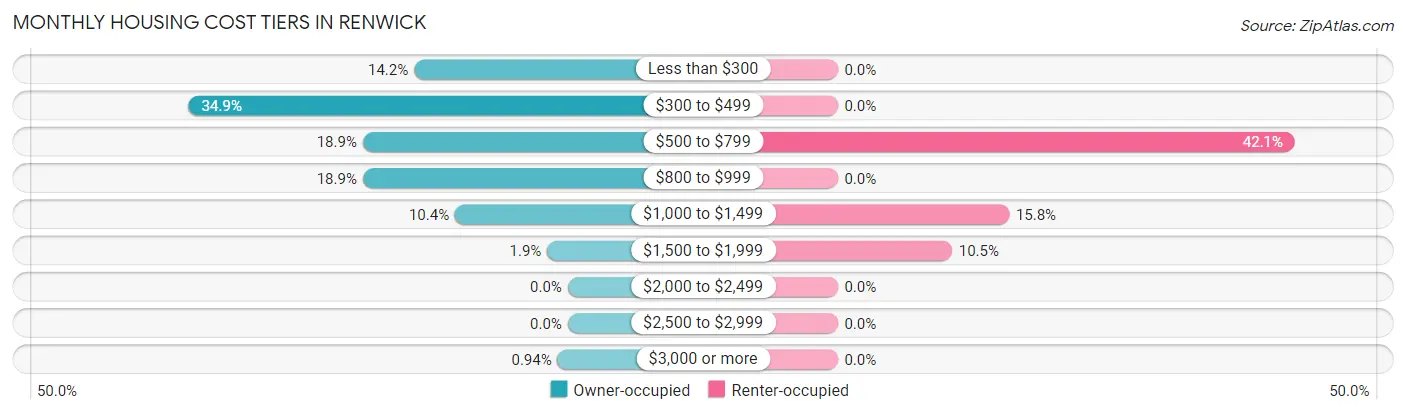
| Monthly Cost | Owner-occupied | Renter-occupied |
| Less than $300 | 15 (14.1%) | 0 (0.0%) |
| $300 to $499 | 37 (34.9%) | 0 (0.0%) |
| $500 to $799 | 20 (18.9%) | 8 (42.1%) |
| $800 to $999 | 20 (18.9%) | 0 (0.0%) |
| $1,000 to $1,499 | 11 (10.4%) | 3 (15.8%) |
| $1,500 to $1,999 | 2 (1.9%) | 2 (10.5%) |
| $2,000 to $2,499 | 0 (0.0%) | 0 (0.0%) |
| $2,500 to $2,999 | 0 (0.0%) | 0 (0.0%) |
| $3,000 or more | 1 (0.9%) | 0 (0.0%) |
| Total | 106 (100.0%) | 19 (100.0%) |
Physical Housing Characteristics in Renwick
Housing Structures in Renwick
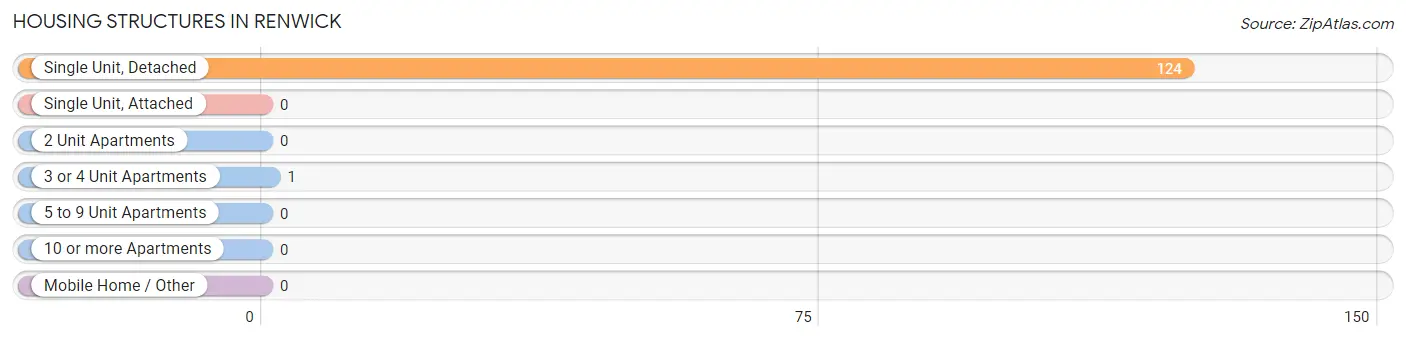
| Structure Type | # Housing Units | % Housing Units |
| Single Unit, Detached | 124 | 99.2% |
| Single Unit, Attached | 0 | 0.0% |
| 2 Unit Apartments | 0 | 0.0% |
| 3 or 4 Unit Apartments | 1 | 0.8% |
| 5 to 9 Unit Apartments | 0 | 0.0% |
| 10 or more Apartments | 0 | 0.0% |
| Mobile Home / Other | 0 | 0.0% |
| Total | 125 | 100.0% |
Housing Structures by Occupancy in Renwick
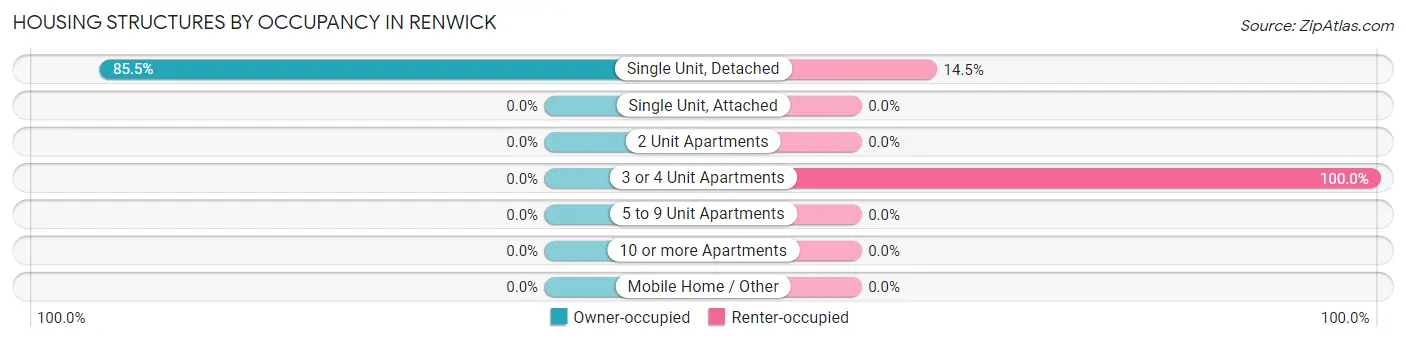
| Structure Type | Owner-occupied | Renter-occupied |
| Single Unit, Detached | 106 (85.5%) | 18 (14.5%) |
| Single Unit, Attached | 0 (0.0%) | 0 (0.0%) |
| 2 Unit Apartments | 0 (0.0%) | 0 (0.0%) |
| 3 or 4 Unit Apartments | 0 (0.0%) | 1 (100.0%) |
| 5 to 9 Unit Apartments | 0 (0.0%) | 0 (0.0%) |
| 10 or more Apartments | 0 (0.0%) | 0 (0.0%) |
| Mobile Home / Other | 0 (0.0%) | 0 (0.0%) |
| Total | 106 (84.8%) | 19 (15.2%) |
Housing Structures by Number of Rooms in Renwick
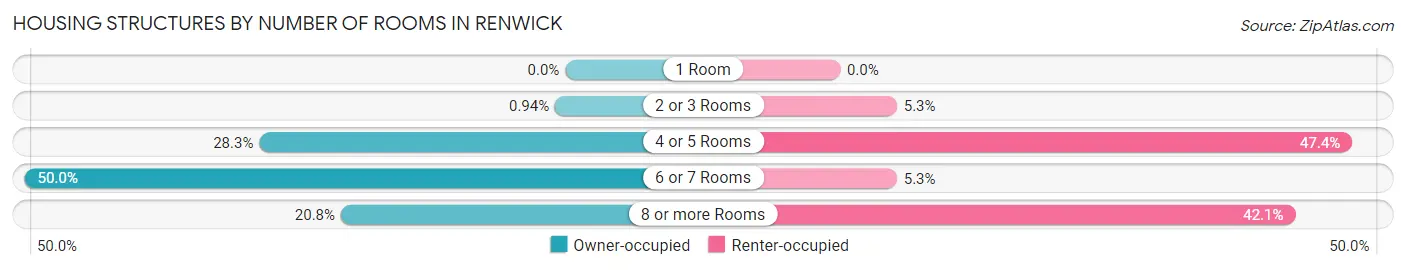
| Number of Rooms | Owner-occupied | Renter-occupied |
| 1 Room | 0 (0.0%) | 0 (0.0%) |
| 2 or 3 Rooms | 1 (0.9%) | 1 (5.3%) |
| 4 or 5 Rooms | 30 (28.3%) | 9 (47.4%) |
| 6 or 7 Rooms | 53 (50.0%) | 1 (5.3%) |
| 8 or more Rooms | 22 (20.7%) | 8 (42.1%) |
| Total | 106 (100.0%) | 19 (100.0%) |
Housing Structure by Heating Type in Renwick
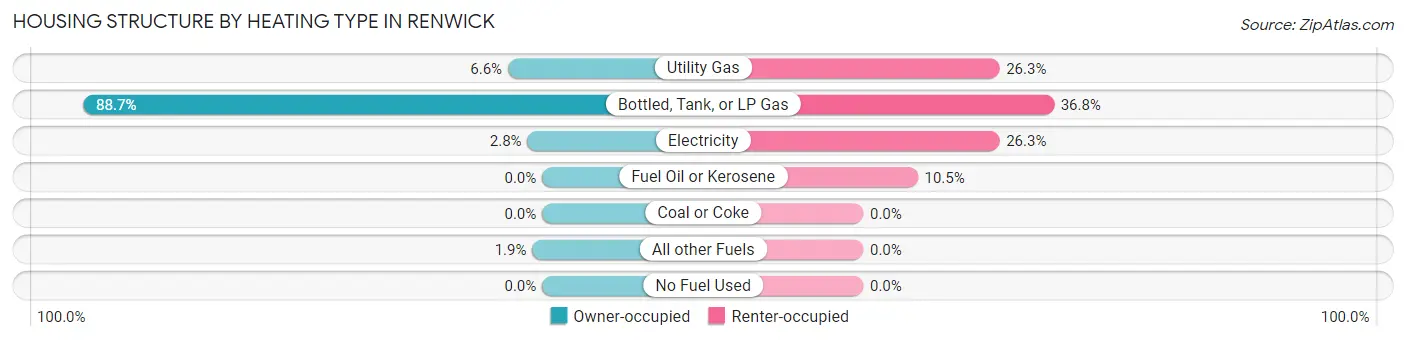
| Heating Type | Owner-occupied | Renter-occupied |
| Utility Gas | 7 (6.6%) | 5 (26.3%) |
| Bottled, Tank, or LP Gas | 94 (88.7%) | 7 (36.8%) |
| Electricity | 3 (2.8%) | 5 (26.3%) |
| Fuel Oil or Kerosene | 0 (0.0%) | 2 (10.5%) |
| Coal or Coke | 0 (0.0%) | 0 (0.0%) |
| All other Fuels | 2 (1.9%) | 0 (0.0%) |
| No Fuel Used | 0 (0.0%) | 0 (0.0%) |
| Total | 106 (100.0%) | 19 (100.0%) |
Household Vehicle Usage in Renwick
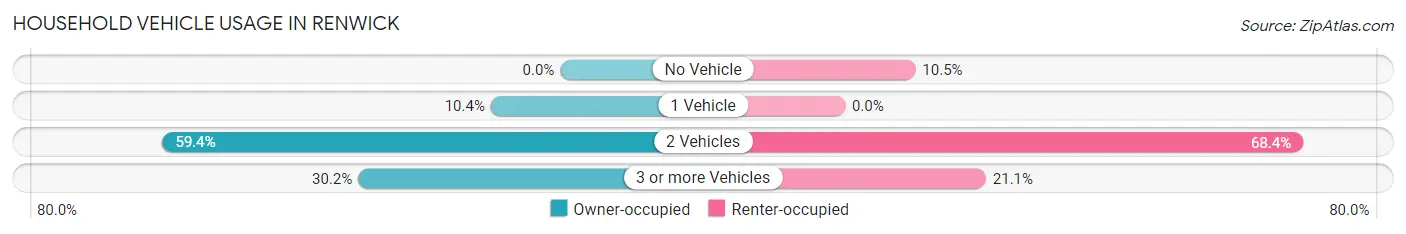
| Vehicles per Household | Owner-occupied | Renter-occupied |
| No Vehicle | 0 (0.0%) | 2 (10.5%) |
| 1 Vehicle | 11 (10.4%) | 0 (0.0%) |
| 2 Vehicles | 63 (59.4%) | 13 (68.4%) |
| 3 or more Vehicles | 32 (30.2%) | 4 (21.0%) |
| Total | 106 (100.0%) | 19 (100.0%) |
Real Estate & Mortgages in Renwick
Real Estate and Mortgage Overview in Renwick
| Characteristic | Without Mortgage | With Mortgage |
| Housing Units | 68 | 38 |
| Median Property Value | $47,600 | $82,700 |
| Median Household Income | $49,219 | $1 |
| Monthly Housing Costs | $445 | $1 |
| Real Estate Taxes | $592 | $0 |
Property Value by Mortgage Status in Renwick
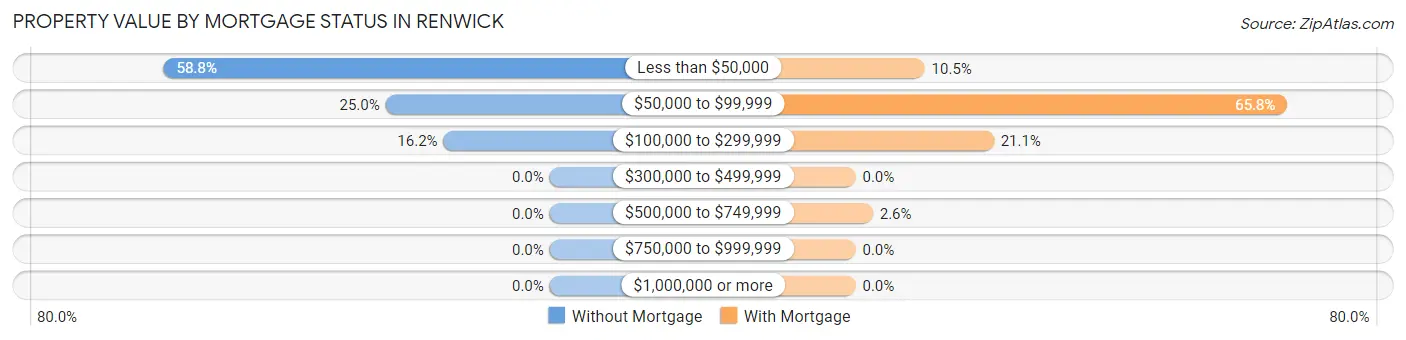
| Property Value | Without Mortgage | With Mortgage |
| Less than $50,000 | 40 (58.8%) | 4 (10.5%) |
| $50,000 to $99,999 | 17 (25.0%) | 25 (65.8%) |
| $100,000 to $299,999 | 11 (16.2%) | 8 (21.0%) |
| $300,000 to $499,999 | 0 (0.0%) | 0 (0.0%) |
| $500,000 to $749,999 | 0 (0.0%) | 1 (2.6%) |
| $750,000 to $999,999 | 0 (0.0%) | 0 (0.0%) |
| $1,000,000 or more | 0 (0.0%) | 0 (0.0%) |
| Total | 68 (100.0%) | 38 (100.0%) |
Household Income by Mortgage Status in Renwick
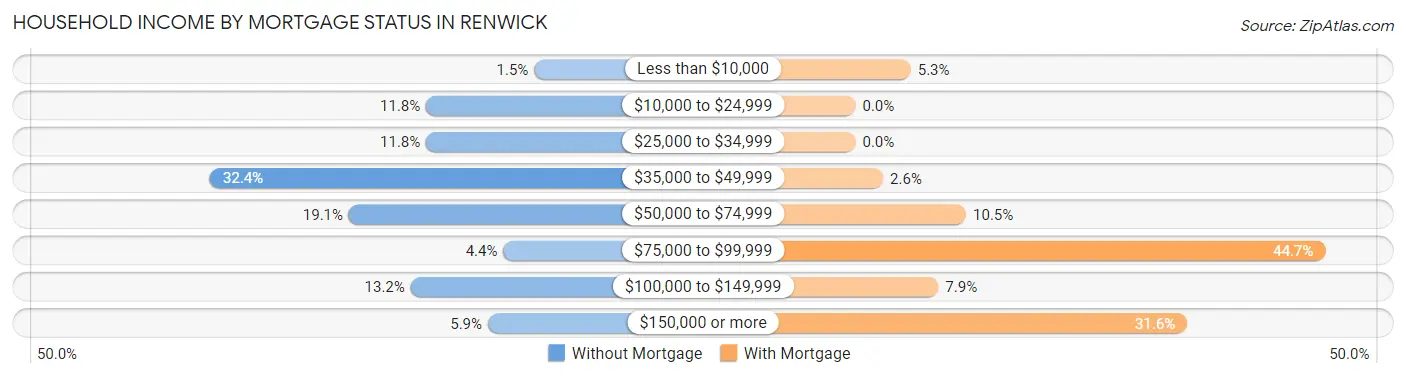
| Household Income | Without Mortgage | With Mortgage |
| Less than $10,000 | 1 (1.5%) | 2 (5.3%) |
| $10,000 to $24,999 | 8 (11.8%) | 0 (0.0%) |
| $25,000 to $34,999 | 8 (11.8%) | 0 (0.0%) |
| $35,000 to $49,999 | 22 (32.4%) | 1 (2.6%) |
| $50,000 to $74,999 | 13 (19.1%) | 4 (10.5%) |
| $75,000 to $99,999 | 3 (4.4%) | 17 (44.7%) |
| $100,000 to $149,999 | 9 (13.2%) | 3 (7.9%) |
| $150,000 or more | 4 (5.9%) | 12 (31.6%) |
| Total | 68 (100.0%) | 38 (100.0%) |
Property Value to Household Income Ratio in Renwick
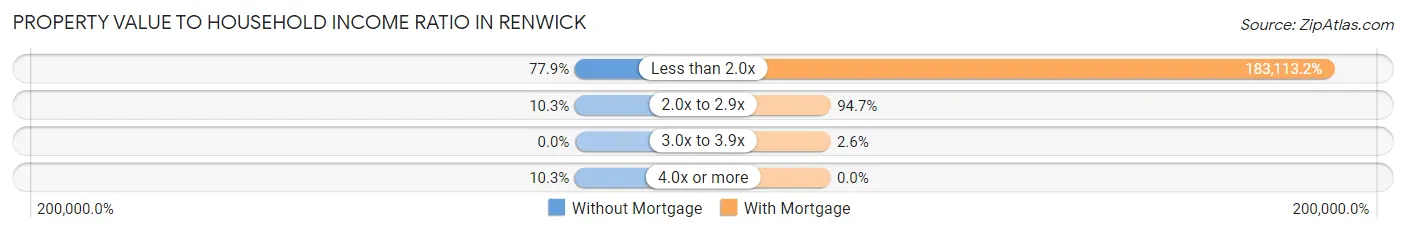
| Value-to-Income Ratio | Without Mortgage | With Mortgage |
| Less than 2.0x | 53 (77.9%) | 69,583 (183,113.2%) |
| 2.0x to 2.9x | 7 (10.3%) | 36 (94.7%) |
| 3.0x to 3.9x | 0 (0.0%) | 1 (2.6%) |
| 4.0x or more | 7 (10.3%) | 0 (0.0%) |
| Total | 68 (100.0%) | 38 (100.0%) |
Real Estate Taxes by Mortgage Status in Renwick
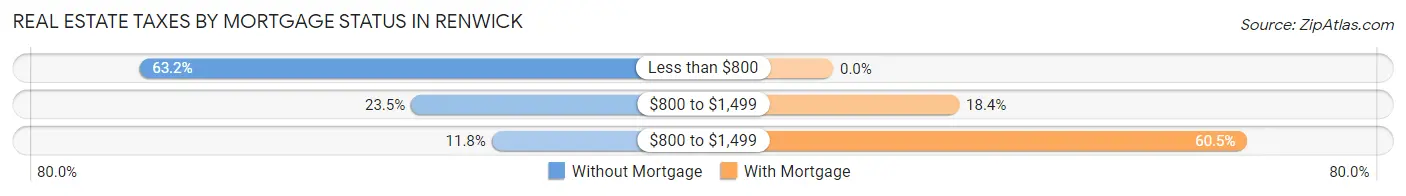
| Property Taxes | Without Mortgage | With Mortgage |
| Less than $800 | 43 (63.2%) | 0 (0.0%) |
| $800 to $1,499 | 16 (23.5%) | 7 (18.4%) |
| $800 to $1,499 | 8 (11.8%) | 23 (60.5%) |
| Total | 68 (100.0%) | 38 (100.0%) |
Health & Disability in Renwick
Health Insurance Coverage by Age in Renwick
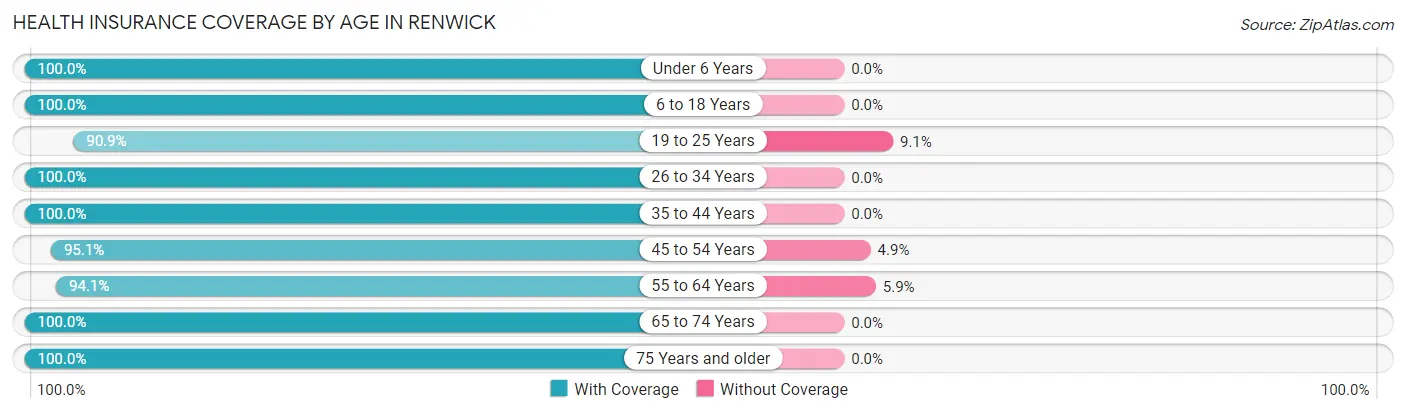
| Age Bracket | With Coverage | Without Coverage |
| Under 6 Years | 17 (100.0%) | 0 (0.0%) |
| 6 to 18 Years | 37 (100.0%) | 0 (0.0%) |
| 19 to 25 Years | 40 (90.9%) | 4 (9.1%) |
| 26 to 34 Years | 16 (100.0%) | 0 (0.0%) |
| 35 to 44 Years | 19 (100.0%) | 0 (0.0%) |
| 45 to 54 Years | 58 (95.1%) | 3 (4.9%) |
| 55 to 64 Years | 32 (94.1%) | 2 (5.9%) |
| 65 to 74 Years | 18 (100.0%) | 0 (0.0%) |
| 75 Years and older | 18 (100.0%) | 0 (0.0%) |
| Total | 255 (96.6%) | 9 (3.4%) |
Health Insurance Coverage by Citizenship Status in Renwick
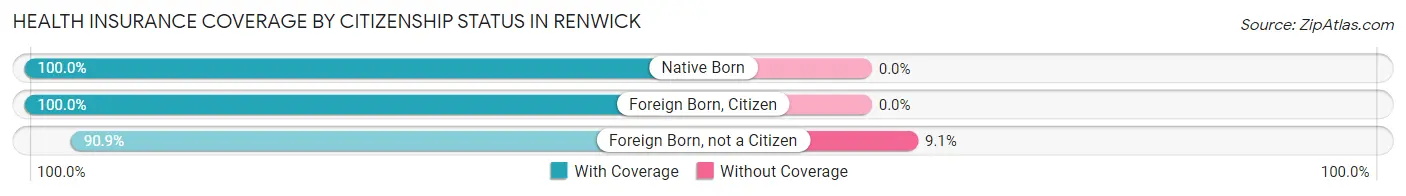
| Citizenship Status | With Coverage | Without Coverage |
| Native Born | 17 (100.0%) | 0 (0.0%) |
| Foreign Born, Citizen | 37 (100.0%) | 0 (0.0%) |
| Foreign Born, not a Citizen | 40 (90.9%) | 4 (9.1%) |
Health Insurance Coverage by Household Income in Renwick
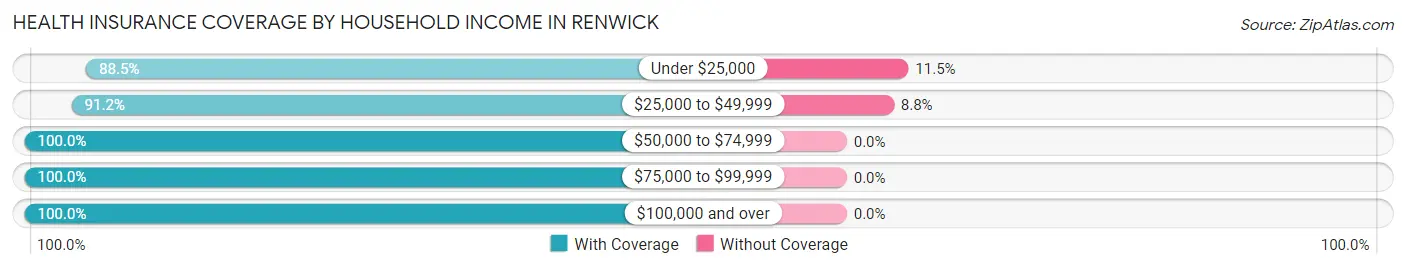
| Household Income | With Coverage | Without Coverage |
| Under $25,000 | 23 (88.5%) | 3 (11.5%) |
| $25,000 to $49,999 | 62 (91.2%) | 6 (8.8%) |
| $50,000 to $74,999 | 94 (100.0%) | 0 (0.0%) |
| $75,000 to $99,999 | 18 (100.0%) | 0 (0.0%) |
| $100,000 and over | 58 (100.0%) | 0 (0.0%) |
Public vs Private Health Insurance Coverage by Age in Renwick
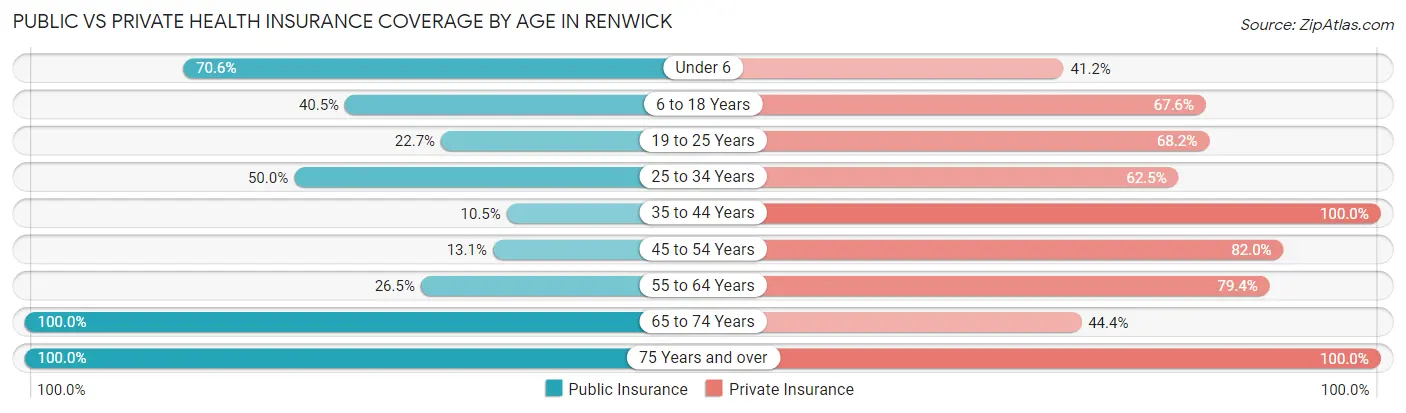
| Age Bracket | Public Insurance | Private Insurance |
| Under 6 | 12 (70.6%) | 7 (41.2%) |
| 6 to 18 Years | 15 (40.5%) | 25 (67.6%) |
| 19 to 25 Years | 10 (22.7%) | 30 (68.2%) |
| 25 to 34 Years | 8 (50.0%) | 10 (62.5%) |
| 35 to 44 Years | 2 (10.5%) | 19 (100.0%) |
| 45 to 54 Years | 8 (13.1%) | 50 (82.0%) |
| 55 to 64 Years | 9 (26.5%) | 27 (79.4%) |
| 65 to 74 Years | 18 (100.0%) | 8 (44.4%) |
| 75 Years and over | 18 (100.0%) | 18 (100.0%) |
| Total | 100 (37.9%) | 194 (73.5%) |
Disability Status by Sex by Age in Renwick
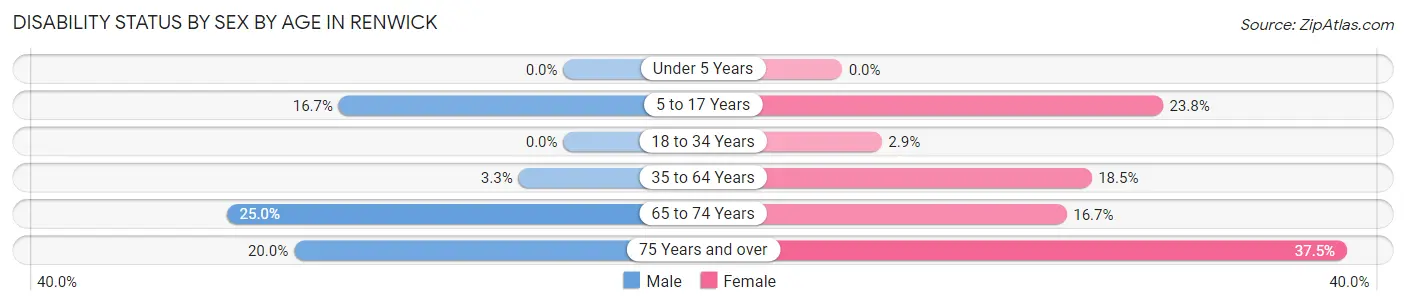
| Age Bracket | Male | Female |
| Under 5 Years | 0 (0.0%) | 0 (0.0%) |
| 5 to 17 Years | 2 (16.7%) | 5 (23.8%) |
| 18 to 34 Years | 0 (0.0%) | 1 (2.9%) |
| 35 to 64 Years | 2 (3.3%) | 10 (18.5%) |
| 65 to 74 Years | 3 (25.0%) | 1 (16.7%) |
| 75 Years and over | 2 (20.0%) | 3 (37.5%) |
Disability Class by Sex by Age in Renwick
Disability Class: Hearing Difficulty
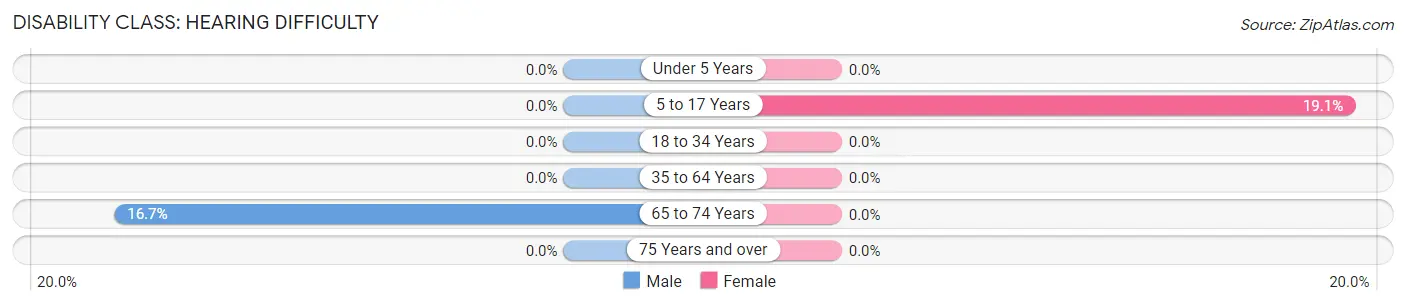
| Age Bracket | Male | Female |
| Under 5 Years | 0 (0.0%) | 0 (0.0%) |
| 5 to 17 Years | 0 (0.0%) | 4 (19.1%) |
| 18 to 34 Years | 0 (0.0%) | 0 (0.0%) |
| 35 to 64 Years | 0 (0.0%) | 0 (0.0%) |
| 65 to 74 Years | 2 (16.7%) | 0 (0.0%) |
| 75 Years and over | 0 (0.0%) | 0 (0.0%) |
Disability Class: Vision Difficulty
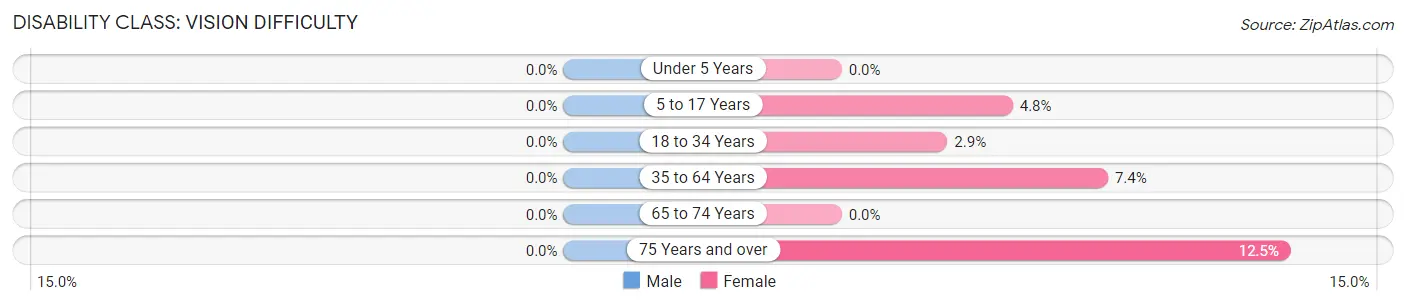
| Age Bracket | Male | Female |
| Under 5 Years | 0 (0.0%) | 0 (0.0%) |
| 5 to 17 Years | 0 (0.0%) | 1 (4.8%) |
| 18 to 34 Years | 0 (0.0%) | 1 (2.9%) |
| 35 to 64 Years | 0 (0.0%) | 4 (7.4%) |
| 65 to 74 Years | 0 (0.0%) | 0 (0.0%) |
| 75 Years and over | 0 (0.0%) | 1 (12.5%) |
Disability Class: Cognitive Difficulty
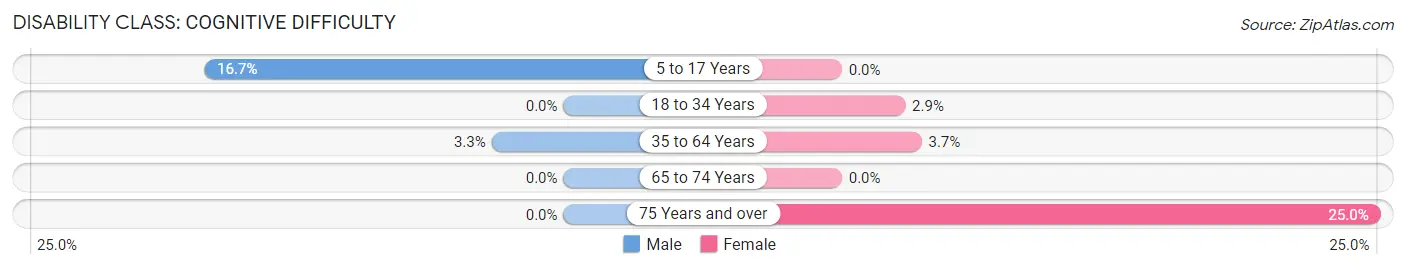
| Age Bracket | Male | Female |
| 5 to 17 Years | 2 (16.7%) | 0 (0.0%) |
| 18 to 34 Years | 0 (0.0%) | 1 (2.9%) |
| 35 to 64 Years | 2 (3.3%) | 2 (3.7%) |
| 65 to 74 Years | 0 (0.0%) | 0 (0.0%) |
| 75 Years and over | 0 (0.0%) | 2 (25.0%) |
Disability Class: Ambulatory Difficulty
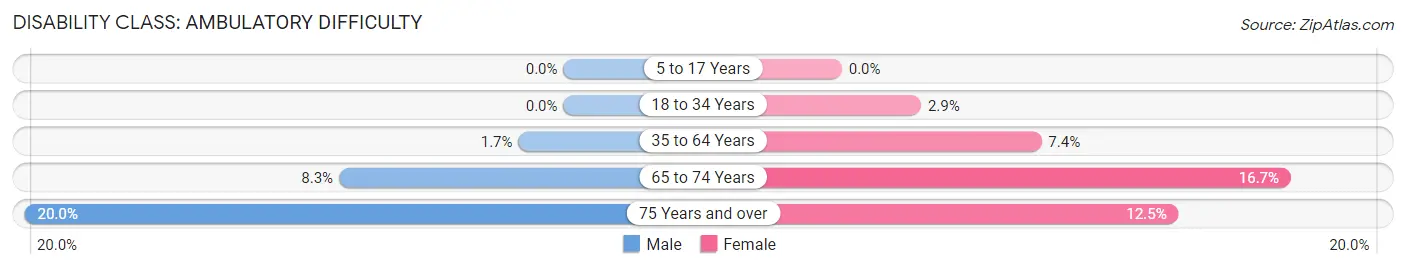
| Age Bracket | Male | Female |
| 5 to 17 Years | 0 (0.0%) | 0 (0.0%) |
| 18 to 34 Years | 0 (0.0%) | 1 (2.9%) |
| 35 to 64 Years | 1 (1.7%) | 4 (7.4%) |
| 65 to 74 Years | 1 (8.3%) | 1 (16.7%) |
| 75 Years and over | 2 (20.0%) | 1 (12.5%) |
Disability Class: Self-Care Difficulty
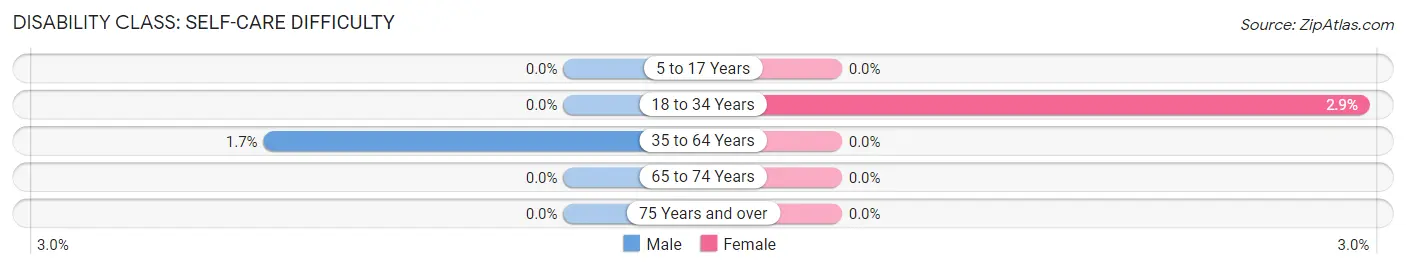
| Age Bracket | Male | Female |
| 5 to 17 Years | 0 (0.0%) | 0 (0.0%) |
| 18 to 34 Years | 0 (0.0%) | 1 (2.9%) |
| 35 to 64 Years | 1 (1.7%) | 0 (0.0%) |
| 65 to 74 Years | 0 (0.0%) | 0 (0.0%) |
| 75 Years and over | 0 (0.0%) | 0 (0.0%) |
Technology Access in Renwick
Computing Device Access in Renwick
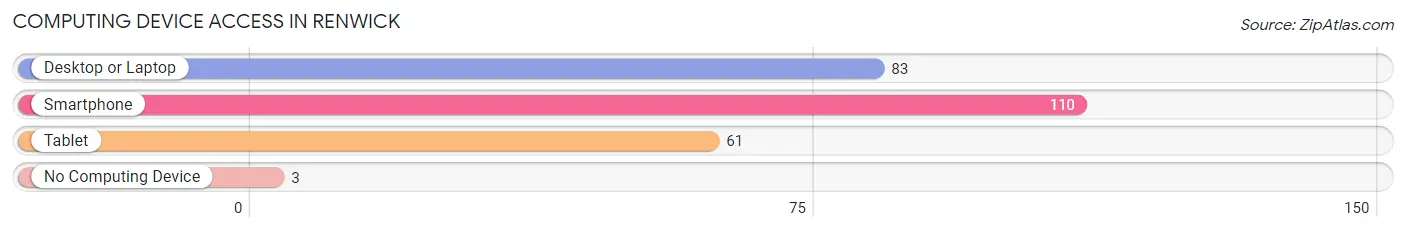
| Device Type | # Households | % Households |
| Desktop or Laptop | 83 | 66.4% |
| Smartphone | 110 | 88.0% |
| Tablet | 61 | 48.8% |
| No Computing Device | 3 | 2.4% |
| Total | 125 | 100.0% |
Internet Access in Renwick
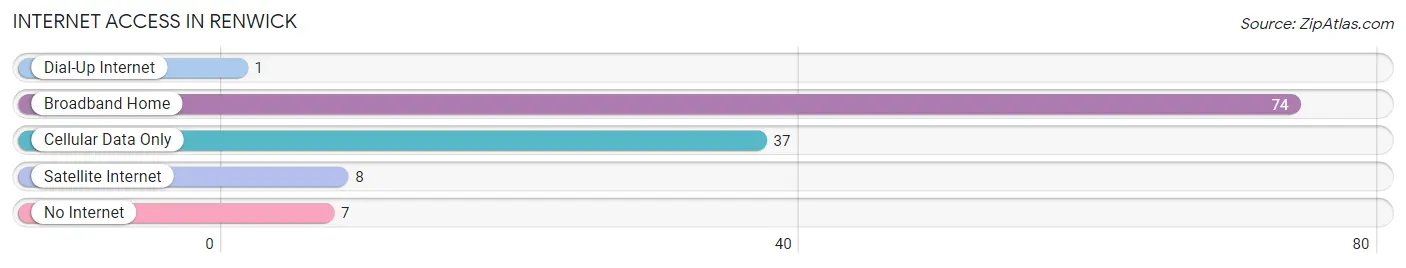
| Internet Type | # Households | % Households |
| Dial-Up Internet | 1 | 0.8% |
| Broadband Home | 74 | 59.2% |
| Cellular Data Only | 37 | 29.6% |
| Satellite Internet | 8 | 6.4% |
| No Internet | 7 | 5.6% |
| Total | 125 | 100.0% |
Renwick Summary
Renwick, Iowa is a small town located in Humboldt County in the state of Iowa. It is situated on the banks of the Des Moines River, approximately 30 miles northwest of Fort Dodge. The population of Renwick was estimated to be 845 in 2020.
History
Renwick was founded in 1856 by a group of settlers from New York. The town was named after the Renwick family, who were among the first settlers. The town was originally a farming community, but in the late 19th century, it became a center for the lumber industry. The lumber industry was the main source of employment for the town until the early 20th century, when the industry began to decline.
In the early 20th century, Renwick began to diversify its economy. The town became a center for the production of agricultural equipment, and several factories were built in the area. The town also became a center for the production of furniture and other wood products.
Geography
Renwick is located in the northwest corner of Humboldt County, Iowa. It is situated on the banks of the Des Moines River, approximately 30 miles northwest of Fort Dodge. The town is surrounded by rolling hills and farmland. The climate in Renwick is generally mild, with temperatures ranging from the low 30s in the winter to the mid-80s in the summer.
Economy
Renwick’s economy is largely based on agriculture and manufacturing. The town is home to several factories that produce agricultural equipment, furniture, and other wood products. The town also has several small businesses, including restaurants, retail stores, and service providers.
Demographics
Renwick’s population was estimated to be 845 in 2020. The town is predominantly white, with a small Hispanic population. The median household income in Renwick is $45,000, and the median home value is $125,000. The town has a low unemployment rate of 3.2%.
Renwick is a small town with a rich history and a diverse economy. The town is home to several factories and small businesses, and the population is largely white. The town has a low unemployment rate and a median household income of $45,000. Renwick is a great place to live and work, and it is a great example of a small town in Iowa.
Common Questions
What is Per Capita Income in Renwick?
Per Capita income in Renwick is $29,756.
What is the Median Family Income in Renwick?
Median Family Income in Renwick is $67,500.
What is the Median Household income in Renwick?
Median Household Income in Renwick is $53,438.
What is Income or Wage Gap in Renwick?
Income or Wage Gap in Renwick is 48.0%.
Women in Renwick earn 52.0 cents for every dollar earned by a man.
What is Inequality or Gini Index in Renwick?
Inequality or Gini Index in Renwick is 0.33.
What is the Total Population of Renwick?
Total Population of Renwick is 264.
What is the Total Male Population of Renwick?
Total Male Population of Renwick is 131.
What is the Total Female Population of Renwick?
Total Female Population of Renwick is 133.
What is the Ratio of Males per 100 Females in Renwick?
There are 98.50 Males per 100 Females in Renwick.
What is the Ratio of Females per 100 Males in Renwick?
There are 101.53 Females per 100 Males in Renwick.
What is the Median Population Age in Renwick?
Median Population Age in Renwick is 42.0 Years.
What is the Average Family Size in Renwick
Average Family Size in Renwick is 2.6 People.
What is the Average Household Size in Renwick
Average Household Size in Renwick is 2.1 People.
How Large is the Labor Force in Renwick?
There are 167 People in the Labor Forcein in Renwick.
What is the Percentage of People in the Labor Force in Renwick?
75.6% of People are in the Labor Force in Renwick.
What is the Unemployment Rate in Renwick?
Unemployment Rate in Renwick is 0.6%.