Nemaha, IA Map & Demographics
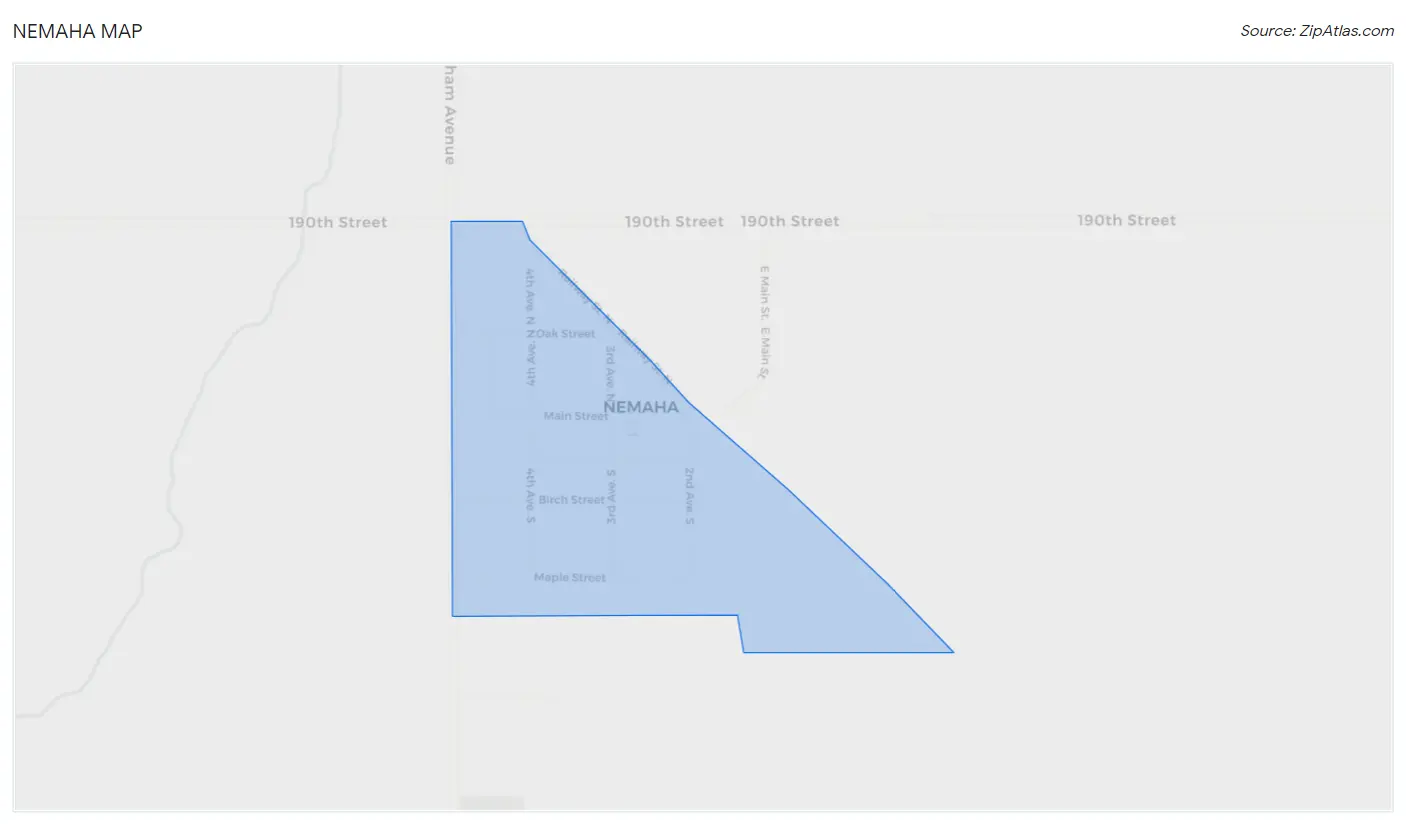
Nemaha Map
Nemaha Overview
$19,150
PER CAPITA INCOME
$60,417
AVG FAMILY INCOME
$60,417
AVG HOUSEHOLD INCOME
46.9%
WAGE / INCOME GAP [ % ]
53.1¢/ $1
WAGE / INCOME GAP [ $ ]
0.18
INEQUALITY / GINI INDEX
101
TOTAL POPULATION
52
MALE POPULATION
49
FEMALE POPULATION
106.12
MALES / 100 FEMALES
94.23
FEMALES / 100 MALES
29.4
MEDIAN AGE
3.3
AVG FAMILY SIZE
2.9
AVG HOUSEHOLD SIZE
37
LABOR FORCE [ PEOPLE ]
61.7%
PERCENT IN LABOR FORCE
5.4%
UNEMPLOYMENT RATE
Nemaha Zip Codes
Nemaha Area Codes
Income in Nemaha
Income Overview in Nemaha
Per Capita Income in Nemaha is $19,150, while median incomes of families and households are $60,417 and $60,417 respectively.
| Characteristic | Number | Measure |
| Per Capita Income | 101 | $19,150 |
| Median Family Income | 27 | $60,417 |
| Mean Family Income | 27 | $57,330 |
| Median Household Income | 35 | $60,417 |
| Mean Household Income | 35 | $55,349 |
| Income Deficit | 27 | $0 |
| Wage / Income Gap (%) | 101 | 46.94% |
| Wage / Income Gap ($) | 101 | 53.06¢ per $1 |
| Gini / Inequality Index | 101 | 0.18 |
Earnings by Sex in Nemaha
Average Earnings in Nemaha are $33,750, $40,833 for men and $21,667 for women, a difference of 46.9%.
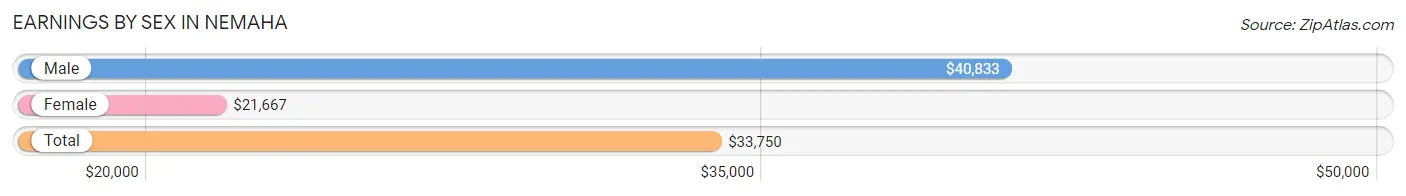
| Sex | Number | Average Earnings |
| Male | 20 (50.0%) | $40,833 |
| Female | 20 (50.0%) | $21,667 |
| Total | 40 (100.0%) | $33,750 |
Earnings by Sex by Income Bracket in Nemaha
The most common earnings brackets in Nemaha are $30,000 to $34,999 for men (4 | 20.0%) and $20,000 to $22,499 for women (6 | 30.0%).
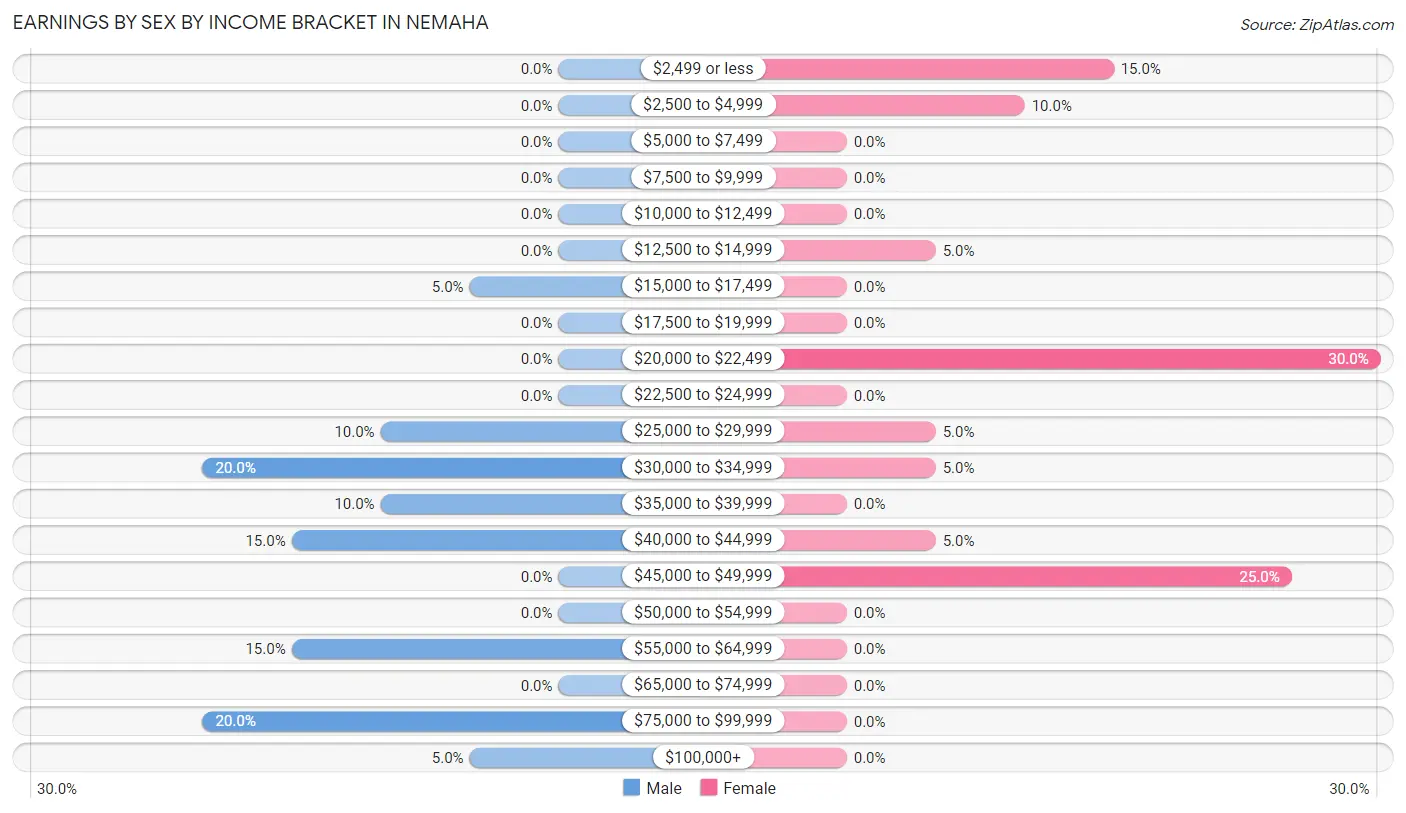
| Income | Male | Female |
| $2,499 or less | 0 (0.0%) | 3 (15.0%) |
| $2,500 to $4,999 | 0 (0.0%) | 2 (10.0%) |
| $5,000 to $7,499 | 0 (0.0%) | 0 (0.0%) |
| $7,500 to $9,999 | 0 (0.0%) | 0 (0.0%) |
| $10,000 to $12,499 | 0 (0.0%) | 0 (0.0%) |
| $12,500 to $14,999 | 0 (0.0%) | 1 (5.0%) |
| $15,000 to $17,499 | 1 (5.0%) | 0 (0.0%) |
| $17,500 to $19,999 | 0 (0.0%) | 0 (0.0%) |
| $20,000 to $22,499 | 0 (0.0%) | 6 (30.0%) |
| $22,500 to $24,999 | 0 (0.0%) | 0 (0.0%) |
| $25,000 to $29,999 | 2 (10.0%) | 1 (5.0%) |
| $30,000 to $34,999 | 4 (20.0%) | 1 (5.0%) |
| $35,000 to $39,999 | 2 (10.0%) | 0 (0.0%) |
| $40,000 to $44,999 | 3 (15.0%) | 1 (5.0%) |
| $45,000 to $49,999 | 0 (0.0%) | 5 (25.0%) |
| $50,000 to $54,999 | 0 (0.0%) | 0 (0.0%) |
| $55,000 to $64,999 | 3 (15.0%) | 0 (0.0%) |
| $65,000 to $74,999 | 0 (0.0%) | 0 (0.0%) |
| $75,000 to $99,999 | 4 (20.0%) | 0 (0.0%) |
| $100,000+ | 1 (5.0%) | 0 (0.0%) |
| Total | 20 (100.0%) | 20 (100.0%) |
Earnings by Sex by Educational Attainment in Nemaha
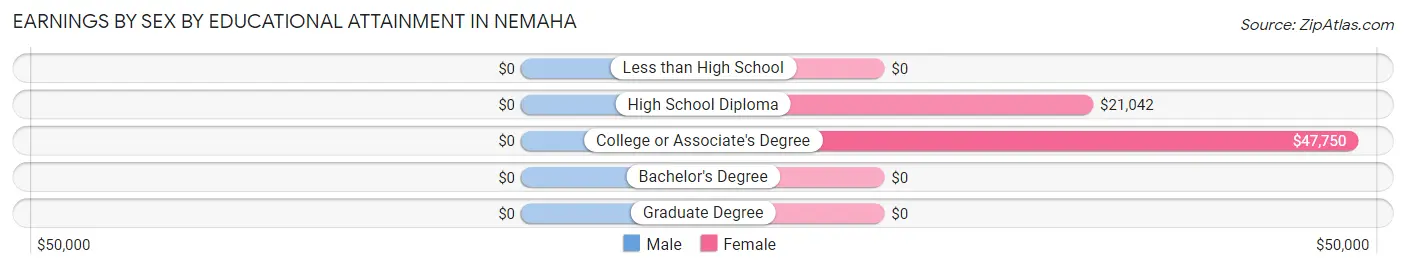
| Educational Attainment | Male Income | Female Income |
| Less than High School | - | - |
| High School Diploma | - | - |
| College or Associate's Degree | - | - |
| Bachelor's Degree | - | - |
| Graduate Degree | - | - |
| Total | $40,833 | $21,667 |
Family Income in Nemaha
Family Income Brackets in Nemaha
According to the Nemaha family income data, there are 12 families falling into the $50,000 to $74,999 income range, which is the most common income bracket and makes up 44.4% of all families.
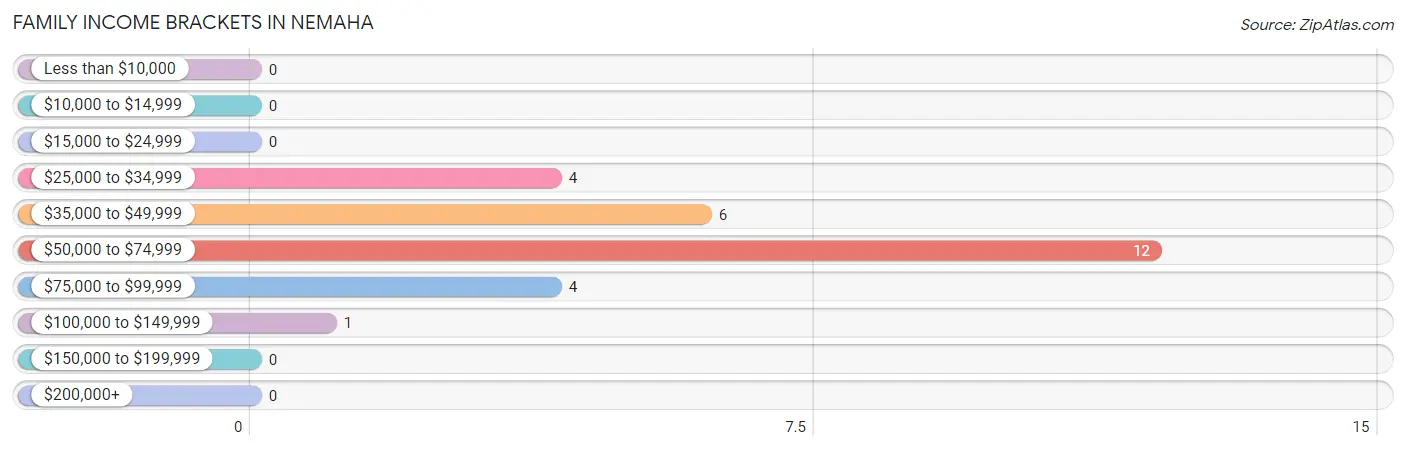
| Income Bracket | # Families | % Families |
| Less than $10,000 | 0 | 0.0% |
| $10,000 to $14,999 | 0 | 0.0% |
| $15,000 to $24,999 | 0 | 0.0% |
| $25,000 to $34,999 | 4 | 14.8% |
| $35,000 to $49,999 | 6 | 22.2% |
| $50,000 to $74,999 | 12 | 44.4% |
| $75,000 to $99,999 | 4 | 14.8% |
| $100,000 to $149,999 | 1 | 3.7% |
| $150,000 to $199,999 | 0 | 0.0% |
| $200,000+ | 0 | 0.0% |
Family Income by Famaliy Size in Nemaha
2-person families (17 | 63.0%) account for the highest median family income in Nemaha with $44,375 per family, while 2-person families (17 | 63.0%) have the highest median income of $22,188 per family member.
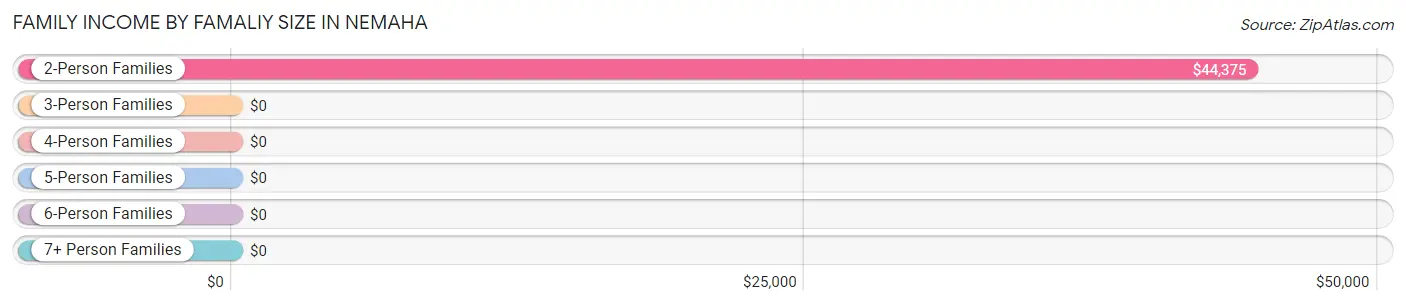
| Income Bracket | # Families | Median Income |
| 2-Person Families | 17 (63.0%) | $44,375 |
| 3-Person Families | 0 (0.0%) | $0 |
| 4-Person Families | 6 (22.2%) | $0 |
| 5-Person Families | 0 (0.0%) | $0 |
| 6-Person Families | 3 (11.1%) | $0 |
| 7+ Person Families | 1 (3.7%) | $0 |
| Total | 27 (100.0%) | $60,417 |
Family Income by Number of Earners in Nemaha
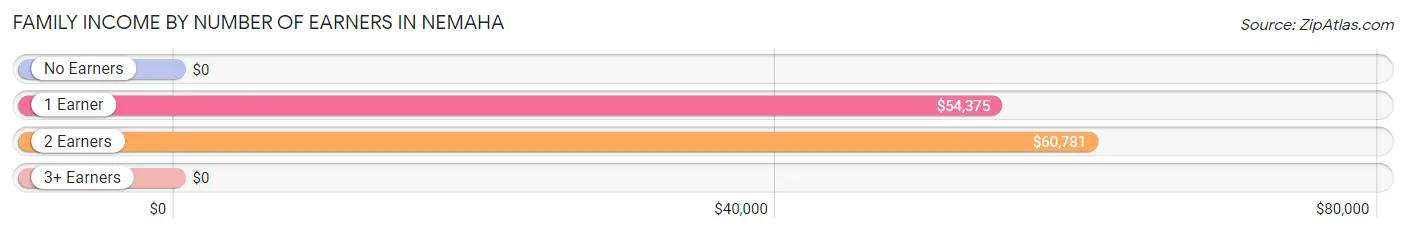
| Number of Earners | # Families | Median Income |
| No Earners | 1 (3.7%) | $0 |
| 1 Earner | 13 (48.1%) | $54,375 |
| 2 Earners | 13 (48.1%) | $60,781 |
| 3+ Earners | 0 (0.0%) | $0 |
| Total | 27 (100.0%) | $60,417 |
Household Income in Nemaha
Household Income Brackets in Nemaha
With 18 households falling in the category, the $50,000 to $74,999 income range is the most frequent in Nemaha, accounting for 51.4% of all households.
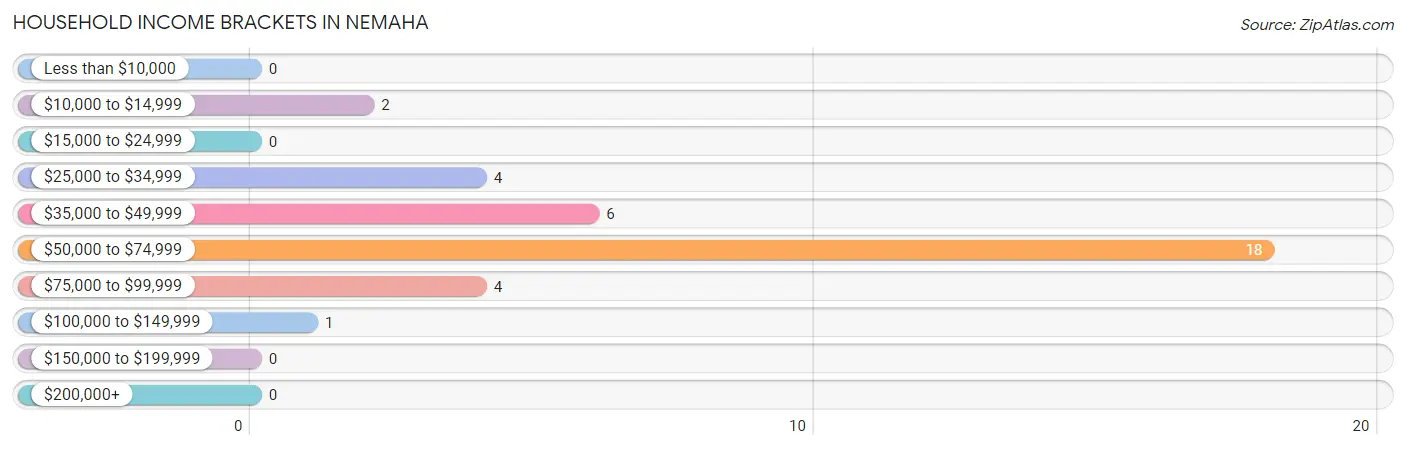
| Income Bracket | # Households | % Households |
| Less than $10,000 | 0 | 0.0% |
| $10,000 to $14,999 | 2 | 5.7% |
| $15,000 to $24,999 | 0 | 0.0% |
| $25,000 to $34,999 | 4 | 11.4% |
| $35,000 to $49,999 | 6 | 17.1% |
| $50,000 to $74,999 | 18 | 51.4% |
| $75,000 to $99,999 | 4 | 11.4% |
| $100,000 to $149,999 | 1 | 2.9% |
| $150,000 to $199,999 | 0 | 0.0% |
| $200,000+ | 0 | 0.0% |
Household Income by Householder Age in Nemaha
The median household income in Nemaha is $60,417, with the highest median household income of $62,813 found in the 45 to 64 years age bracket for the primary householder. A total of 17 households (48.6%) fall into this category.
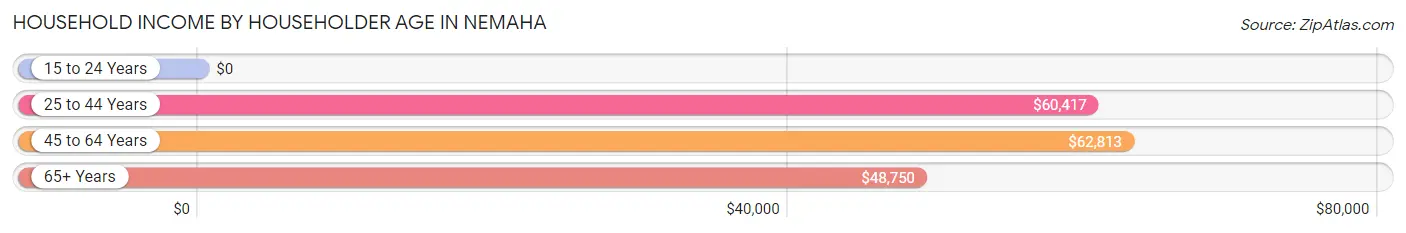
| Income Bracket | # Households | Median Income |
| 15 to 24 Years | 0 (0.0%) | $0 |
| 25 to 44 Years | 12 (34.3%) | $60,417 |
| 45 to 64 Years | 17 (48.6%) | $62,813 |
| 65+ Years | 6 (17.1%) | $48,750 |
| Total | 35 (100.0%) | $60,417 |
Poverty in Nemaha
Income Below Poverty by Sex and Age in Nemaha
With 3.8% poverty level for males and 4.1% for females among the residents of Nemaha, 55 to 64 year old males and 65 to 74 year old females are the most vulnerable to poverty, with 2 males (16.7%) and 2 females (40.0%) in their respective age groups living below the poverty level.
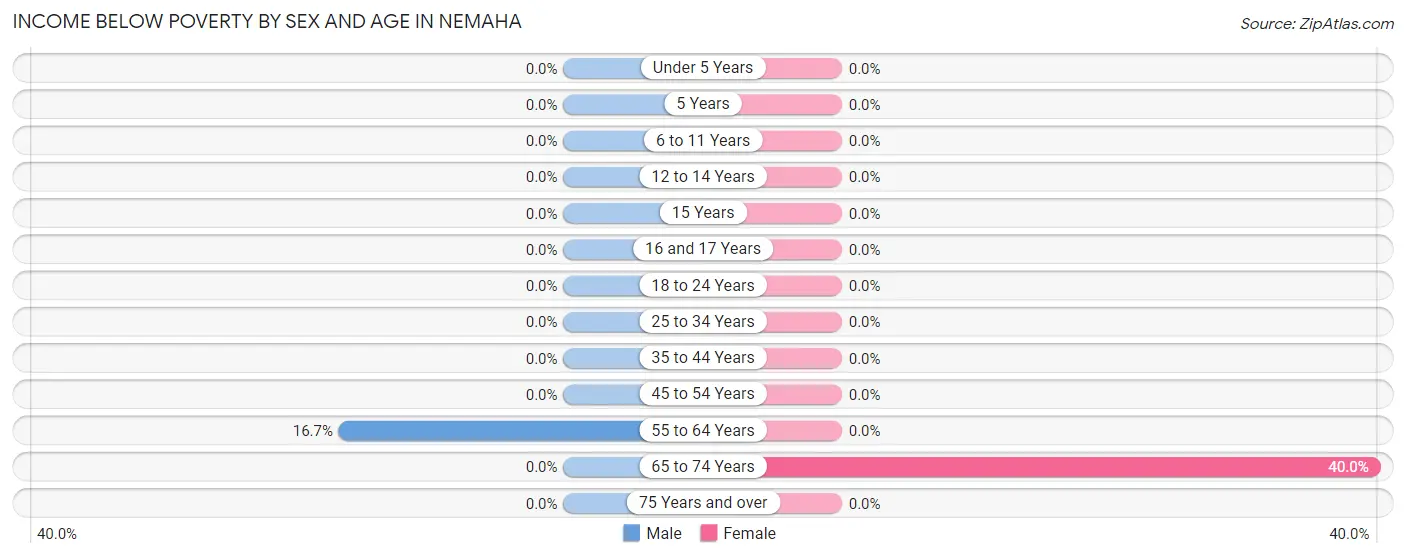
| Age Bracket | Male | Female |
| Under 5 Years | 0 (0.0%) | 0 (0.0%) |
| 5 Years | 0 (0.0%) | 0 (0.0%) |
| 6 to 11 Years | 0 (0.0%) | 0 (0.0%) |
| 12 to 14 Years | 0 (0.0%) | 0 (0.0%) |
| 15 Years | 0 (0.0%) | 0 (0.0%) |
| 16 and 17 Years | 0 (0.0%) | 0 (0.0%) |
| 18 to 24 Years | 0 (0.0%) | 0 (0.0%) |
| 25 to 34 Years | 0 (0.0%) | 0 (0.0%) |
| 35 to 44 Years | 0 (0.0%) | 0 (0.0%) |
| 45 to 54 Years | 0 (0.0%) | 0 (0.0%) |
| 55 to 64 Years | 2 (16.7%) | 0 (0.0%) |
| 65 to 74 Years | 0 (0.0%) | 2 (40.0%) |
| 75 Years and over | 0 (0.0%) | 0 (0.0%) |
| Total | 2 (3.8%) | 2 (4.1%) |
Income Above Poverty by Sex and Age in Nemaha
According to the poverty statistics in Nemaha, males aged under 5 years and females aged under 5 years are the age groups that are most secure financially, with 100.0% of males and 100.0% of females in these age groups living above the poverty line.
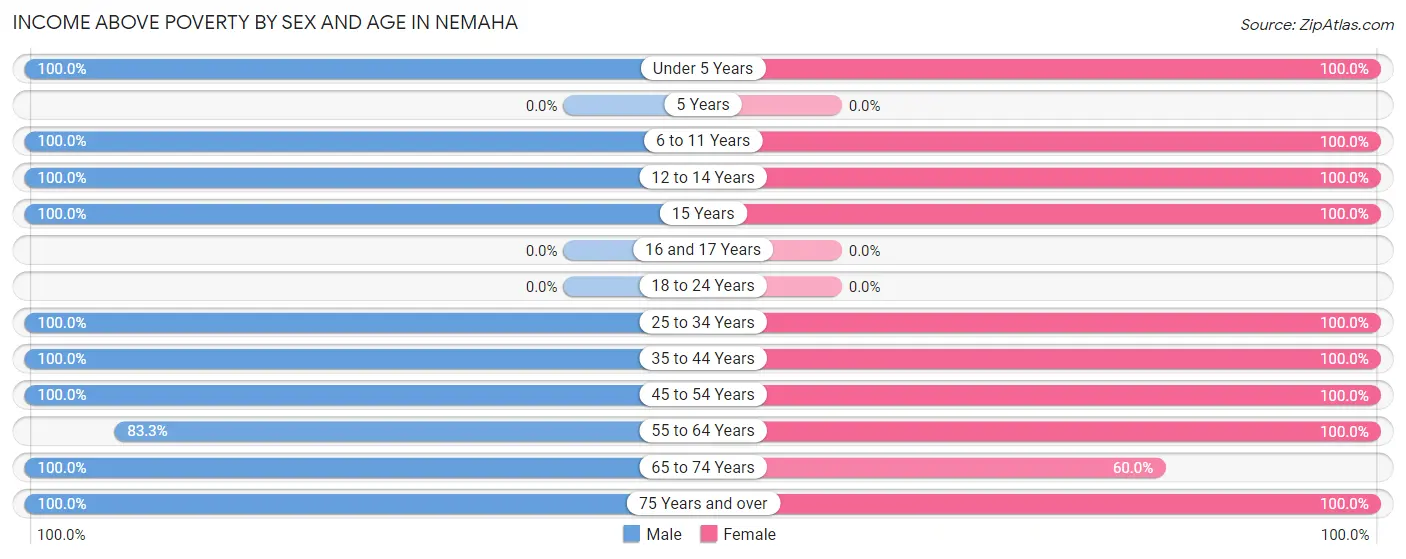
| Age Bracket | Male | Female |
| Under 5 Years | 5 (100.0%) | 3 (100.0%) |
| 5 Years | 0 (0.0%) | 0 (0.0%) |
| 6 to 11 Years | 7 (100.0%) | 11 (100.0%) |
| 12 to 14 Years | 5 (100.0%) | 2 (100.0%) |
| 15 Years | 4 (100.0%) | 4 (100.0%) |
| 16 and 17 Years | 0 (0.0%) | 0 (0.0%) |
| 18 to 24 Years | 0 (0.0%) | 0 (0.0%) |
| 25 to 34 Years | 6 (100.0%) | 10 (100.0%) |
| 35 to 44 Years | 2 (100.0%) | 5 (100.0%) |
| 45 to 54 Years | 5 (100.0%) | 5 (100.0%) |
| 55 to 64 Years | 10 (83.3%) | 3 (100.0%) |
| 65 to 74 Years | 5 (100.0%) | 3 (60.0%) |
| 75 Years and over | 1 (100.0%) | 1 (100.0%) |
| Total | 50 (96.2%) | 47 (95.9%) |
Income Below Poverty Among Married-Couple Families in Nemaha
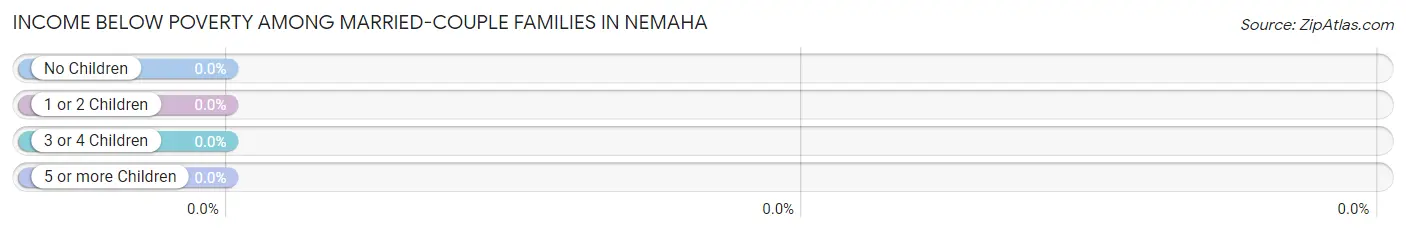
| Children | Above Poverty | Below Poverty |
| No Children | 12 (100.0%) | 0 (0.0%) |
| 1 or 2 Children | 6 (100.0%) | 0 (0.0%) |
| 3 or 4 Children | 3 (100.0%) | 0 (0.0%) |
| 5 or more Children | 1 (100.0%) | 0 (0.0%) |
| Total | 22 (100.0%) | 0 (0.0%) |
Income Below Poverty Among Single-Parent Households in Nemaha
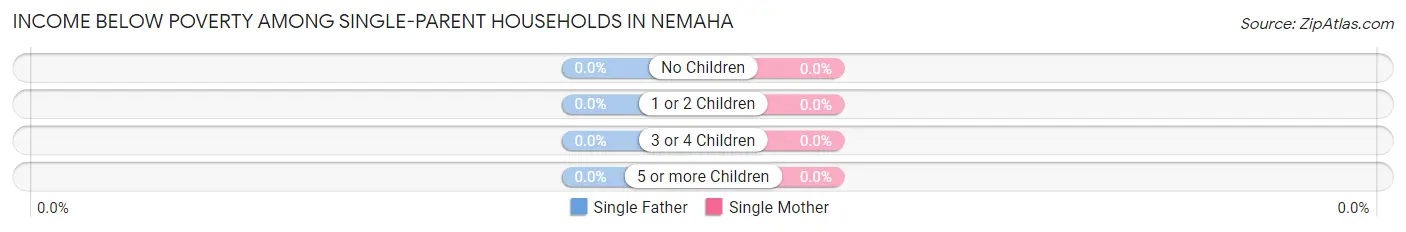
| Children | Single Father | Single Mother |
| No Children | 0 (0.0%) | 0 (0.0%) |
| 1 or 2 Children | 0 (0.0%) | 0 (0.0%) |
| 3 or 4 Children | 0 (0.0%) | 0 (0.0%) |
| 5 or more Children | 0 (0.0%) | 0 (0.0%) |
| Total | 0 (0.0%) | 0 (0.0%) |
Income Below Poverty Among Married-Couple vs Single-Parent Households in Nemaha
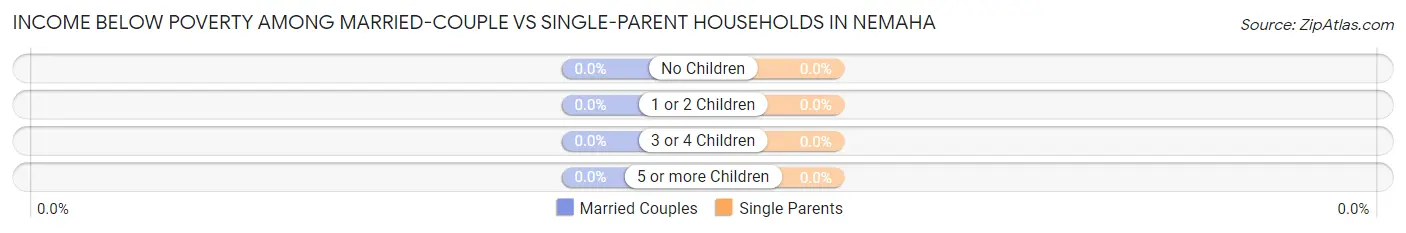
| Children | Married-Couple Families | Single-Parent Households |
| No Children | 0 (0.0%) | 0 (0.0%) |
| 1 or 2 Children | 0 (0.0%) | 0 (0.0%) |
| 3 or 4 Children | 0 (0.0%) | 0 (0.0%) |
| 5 or more Children | 0 (0.0%) | 0 (0.0%) |
| Total | 0 (0.0%) | 0 (0.0%) |
Race in Nemaha
The most populous races in Nemaha are White / Caucasian (97 | 96.0%), Hispanic or Latino (22 | 21.8%), and Asian (4 | 4.0%).
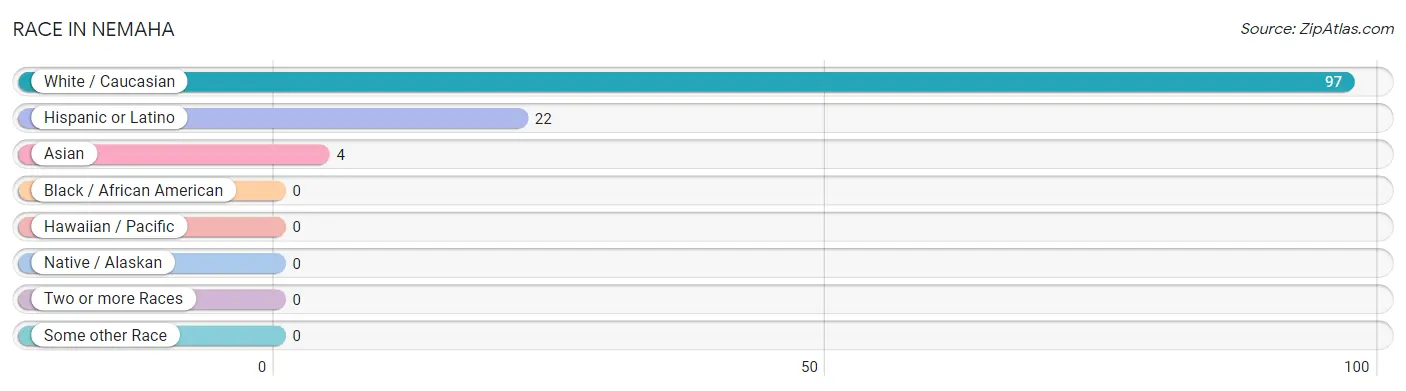
| Race | # Population | % Population |
| Asian | 4 | 4.0% |
| Black / African American | 0 | 0.0% |
| Hawaiian / Pacific | 0 | 0.0% |
| Hispanic or Latino | 22 | 21.8% |
| Native / Alaskan | 0 | 0.0% |
| White / Caucasian | 97 | 96.0% |
| Two or more Races | 0 | 0.0% |
| Some other Race | 0 | 0.0% |
| Total | 101 | 100.0% |
Ancestry in Nemaha
The most populous ancestries reported in Nemaha are German (53 | 52.5%), Irish (31 | 30.7%), Mexican (22 | 21.8%), Dutch (5 | 5.0%), and English (5 | 5.0%), together accounting for 114.9% of all Nemaha residents.
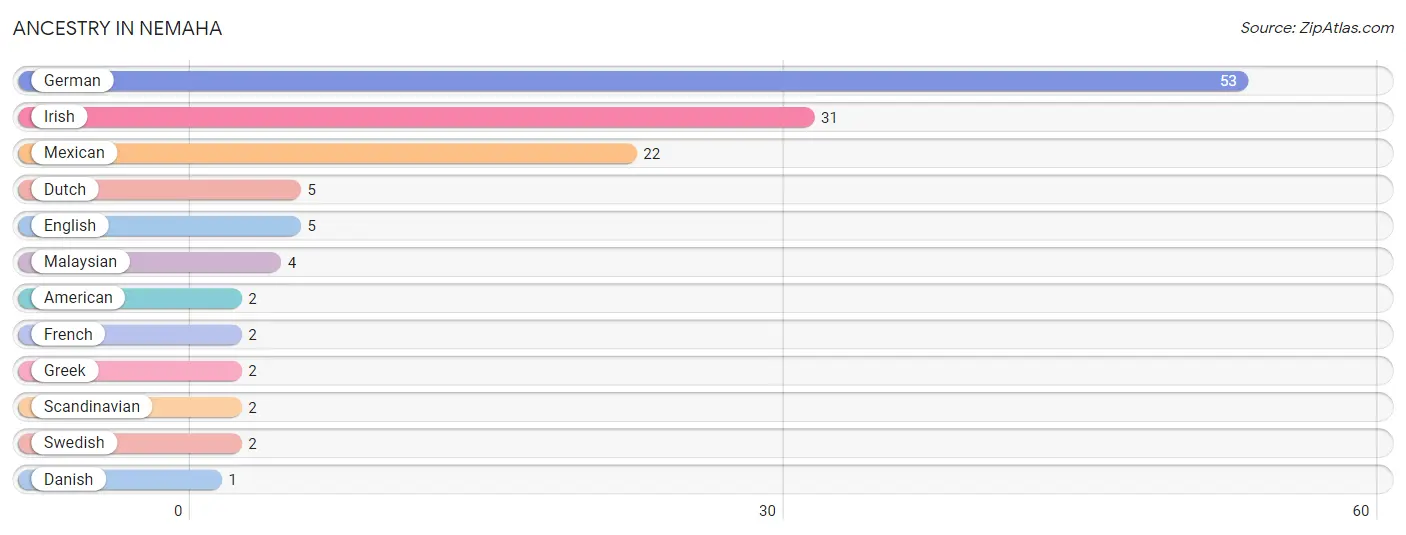
| Ancestry | # Population | % Population |
| American | 2 | 2.0% |
| Danish | 1 | 1.0% |
| Dutch | 5 | 5.0% |
| English | 5 | 5.0% |
| French | 2 | 2.0% |
| German | 53 | 52.5% |
| Greek | 2 | 2.0% |
| Irish | 31 | 30.7% |
| Malaysian | 4 | 4.0% |
| Mexican | 22 | 21.8% |
| Scandinavian | 2 | 2.0% |
| Swedish | 2 | 2.0% | View All 12 Rows |
Immigrants in Nemaha
The most numerous immigrant groups reported in Nemaha came from Central America (2 | 2.0%), Latin America (2 | 2.0%), and Mexico (2 | 2.0%), together accounting for 5.9% of all Nemaha residents.
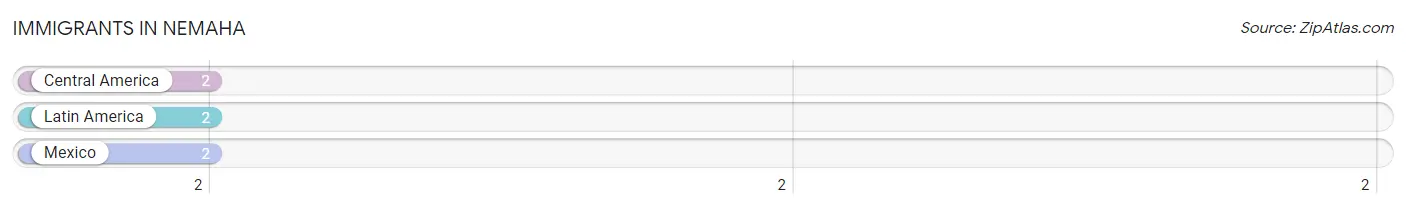
| Immigration Origin | # Population | % Population |
| Central America | 2 | 2.0% |
| Latin America | 2 | 2.0% |
| Mexico | 2 | 2.0% | View All 3 Rows |
Sex and Age in Nemaha
Sex and Age in Nemaha
The most populous age groups in Nemaha are 60 to 64 Years (7 | 13.5%) for men and 10 to 14 Years (12 | 24.5%) for women.
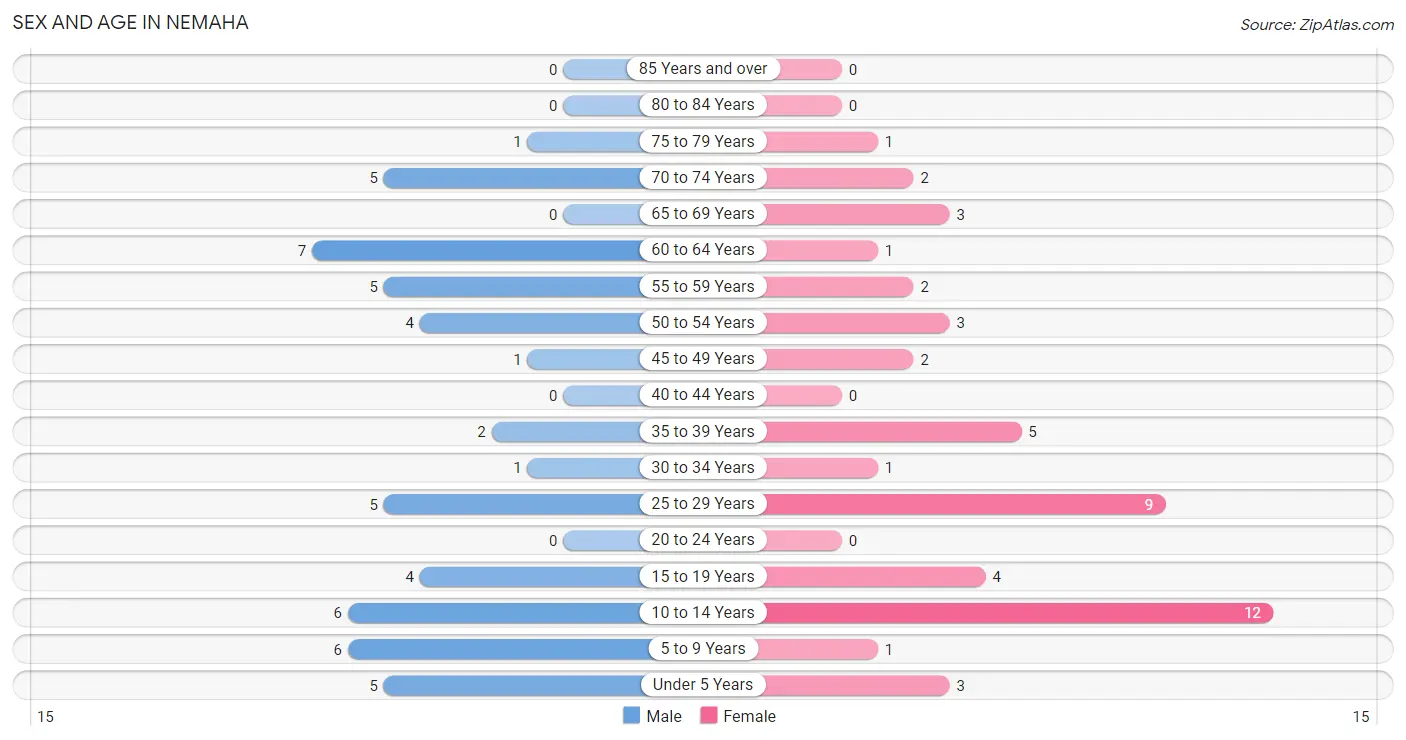
| Age Bracket | Male | Female |
| Under 5 Years | 5 (9.6%) | 3 (6.1%) |
| 5 to 9 Years | 6 (11.5%) | 1 (2.0%) |
| 10 to 14 Years | 6 (11.5%) | 12 (24.5%) |
| 15 to 19 Years | 4 (7.7%) | 4 (8.2%) |
| 20 to 24 Years | 0 (0.0%) | 0 (0.0%) |
| 25 to 29 Years | 5 (9.6%) | 9 (18.4%) |
| 30 to 34 Years | 1 (1.9%) | 1 (2.0%) |
| 35 to 39 Years | 2 (3.8%) | 5 (10.2%) |
| 40 to 44 Years | 0 (0.0%) | 0 (0.0%) |
| 45 to 49 Years | 1 (1.9%) | 2 (4.1%) |
| 50 to 54 Years | 4 (7.7%) | 3 (6.1%) |
| 55 to 59 Years | 5 (9.6%) | 2 (4.1%) |
| 60 to 64 Years | 7 (13.5%) | 1 (2.0%) |
| 65 to 69 Years | 0 (0.0%) | 3 (6.1%) |
| 70 to 74 Years | 5 (9.6%) | 2 (4.1%) |
| 75 to 79 Years | 1 (1.9%) | 1 (2.0%) |
| 80 to 84 Years | 0 (0.0%) | 0 (0.0%) |
| 85 Years and over | 0 (0.0%) | 0 (0.0%) |
| Total | 52 (100.0%) | 49 (100.0%) |
Families and Households in Nemaha
Median Family Size in Nemaha
The median family size in Nemaha is 3.30 persons per family, with married-couple families (22 | 81.5%) accounting for the largest median family size of 3.59 persons per family. On the other hand, single male/father families (4 | 14.8%) represent the smallest median family size with 2.00 persons per family.
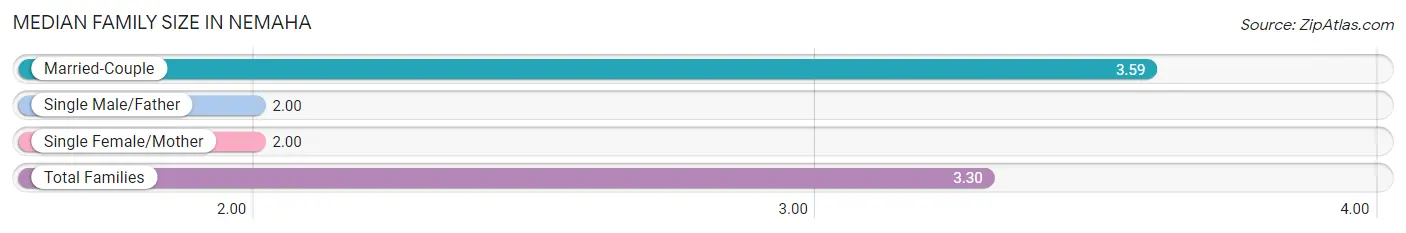
| Family Type | # Families | Family Size |
| Married-Couple | 22 (81.5%) | 3.59 |
| Single Male/Father | 4 (14.8%) | 2.00 |
| Single Female/Mother | 1 (3.7%) | 2.00 |
| Total Families | 27 (100.0%) | 3.30 |
Median Household Size in Nemaha
The median household size in Nemaha is 2.89 persons per household, with married-couple households (22 | 62.9%) accounting for the largest median household size of 3.59 persons per household. non-family households (8 | 22.9%) represent the smallest median household size with 1.50 persons per household.
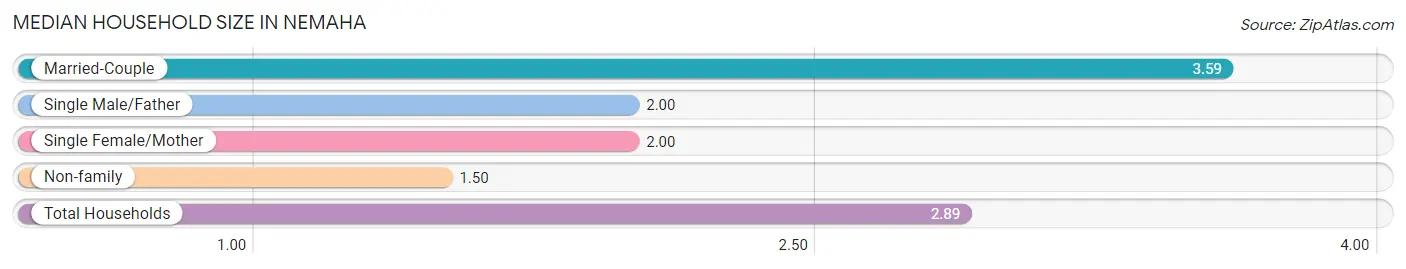
| Household Type | # Households | Household Size |
| Married-Couple | 22 (62.9%) | 3.59 |
| Single Male/Father | 4 (11.4%) | 2.00 |
| Single Female/Mother | 1 (2.9%) | 2.00 |
| Non-family | 8 (22.9%) | 1.50 |
| Total Households | 35 (100.0%) | 2.89 |
Household Size by Marriage Status in Nemaha
Out of a total of 35 households in Nemaha, 27 (77.1%) are family households, while 8 (22.9%) are nonfamily households. The most numerous type of family households are 2-person households, comprising 17, and the most common type of nonfamily households are 1-person households, comprising 6.
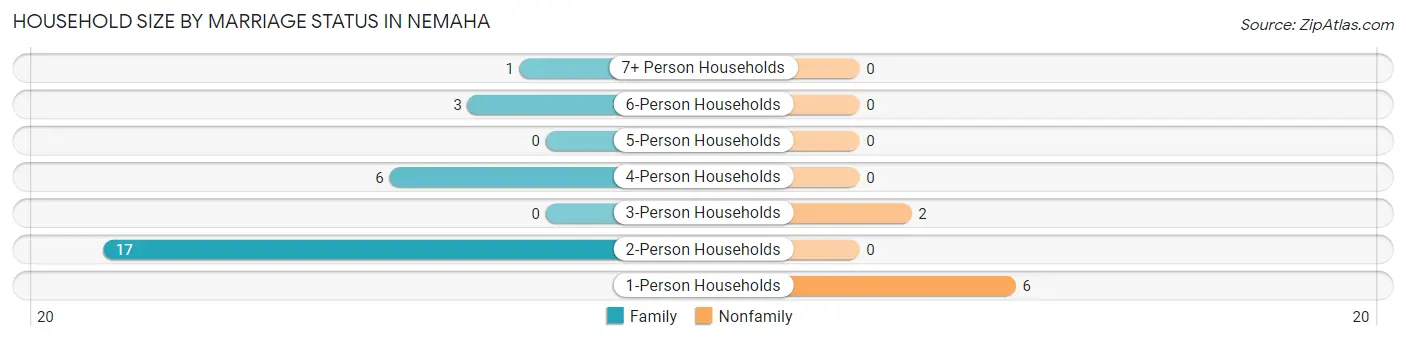
| Household Size | Family Households | Nonfamily Households |
| 1-Person Households | - | 6 (17.1%) |
| 2-Person Households | 17 (48.6%) | 0 (0.0%) |
| 3-Person Households | 0 (0.0%) | 2 (5.7%) |
| 4-Person Households | 6 (17.1%) | 0 (0.0%) |
| 5-Person Households | 0 (0.0%) | 0 (0.0%) |
| 6-Person Households | 3 (8.6%) | 0 (0.0%) |
| 7+ Person Households | 1 (2.9%) | 0 (0.0%) |
| Total | 27 (77.1%) | 8 (22.9%) |
Female Fertility in Nemaha
Fertility by Age in Nemaha
Average fertility rate in Nemaha is 95.0 births per 1,000 women. Women in the age bracket of 20 to 34 years have the highest fertility rate with 200.0 births per 1,000 women. Women in the age bracket of 20 to 34 years acount for 100.0% of all women with births.
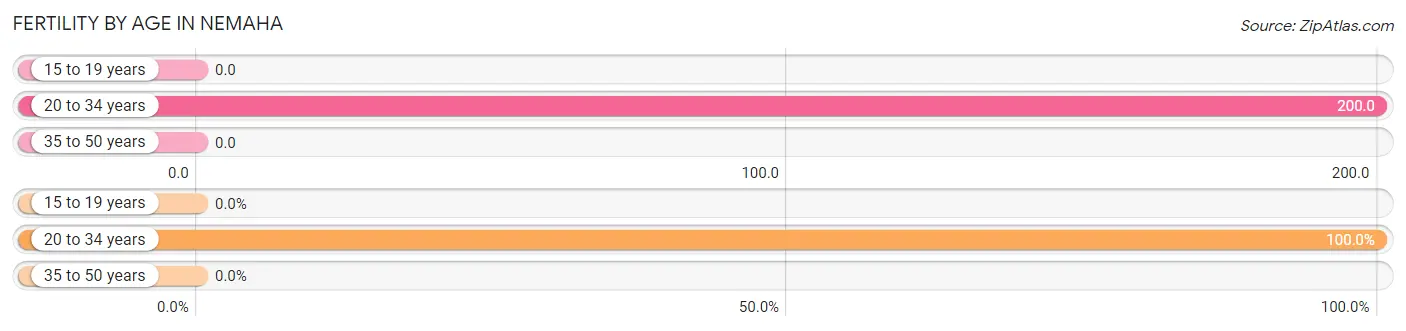
| Age Bracket | Women with Births | Births / 1,000 Women |
| 15 to 19 years | 0 (0.0%) | 0.0 |
| 20 to 34 years | 2 (100.0%) | 200.0 |
| 35 to 50 years | 0 (0.0%) | 0.0 |
| Total | 2 (100.0%) | 95.0 |
Fertility by Age by Marriage Status in Nemaha
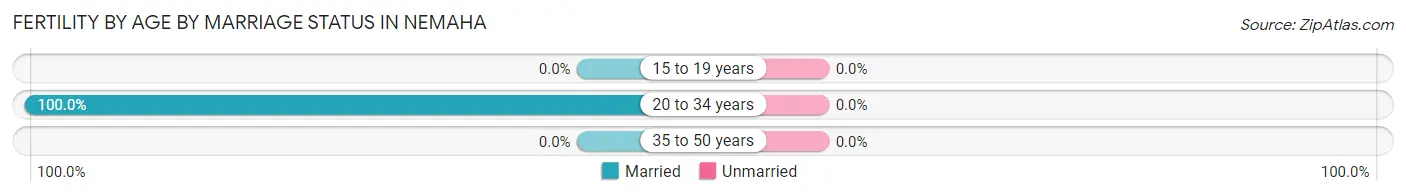
| Age Bracket | Married | Unmarried |
| 15 to 19 years | 0 (0.0%) | 0 (0.0%) |
| 20 to 34 years | 2 (100.0%) | 0 (0.0%) |
| 35 to 50 years | 0 (0.0%) | 0 (0.0%) |
| Total | 2 (100.0%) | 0 (0.0%) |
Fertility by Education in Nemaha
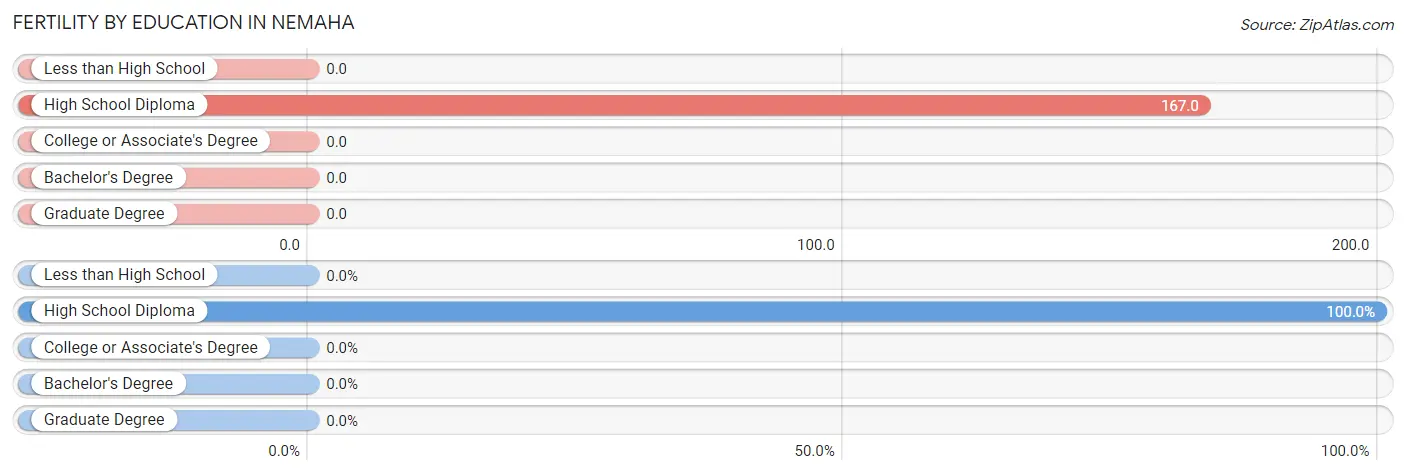
| Educational Attainment | Women with Births | Births / 1,000 Women |
| Less than High School | 0 (0.0%) | 0.0 |
| High School Diploma | 2 (100.0%) | 167.0 |
| College or Associate's Degree | 0 (0.0%) | 0.0 |
| Bachelor's Degree | 0 (0.0%) | 0.0 |
| Graduate Degree | 0 (0.0%) | 0.0 |
| Total | 2 (100.0%) | 95.0 |
Fertility by Education by Marriage Status in Nemaha
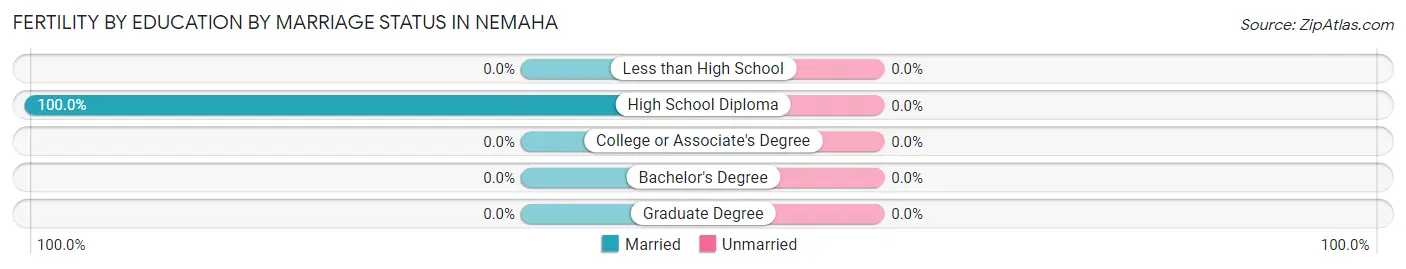
| Educational Attainment | Married | Unmarried |
| Less than High School | 0 (0.0%) | 0 (0.0%) |
| High School Diploma | 2 (100.0%) | 0 (0.0%) |
| College or Associate's Degree | 0 (0.0%) | 0 (0.0%) |
| Bachelor's Degree | 0 (0.0%) | 0 (0.0%) |
| Graduate Degree | 0 (0.0%) | 0 (0.0%) |
| Total | 2 (100.0%) | 0 (0.0%) |
Employment Characteristics in Nemaha
Employment by Class of Employer in Nemaha
Among the 35 employed individuals in Nemaha, private company employees (26 | 74.3%), self-employed (incorporated) (3 | 8.6%), and local government employees (3 | 8.6%) make up the most common classes of employment.
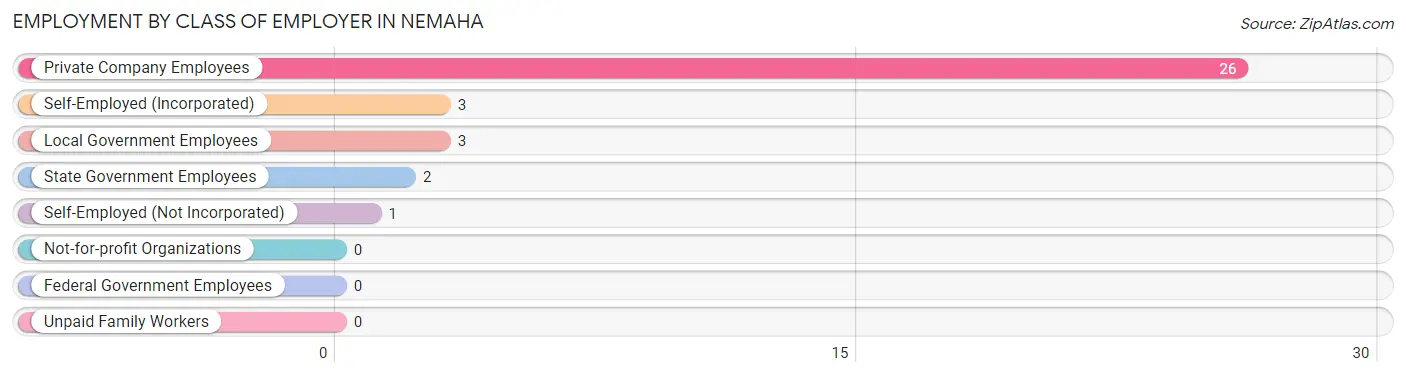
| Employer Class | # Employees | % Employees |
| Private Company Employees | 26 | 74.3% |
| Self-Employed (Incorporated) | 3 | 8.6% |
| Self-Employed (Not Incorporated) | 1 | 2.9% |
| Not-for-profit Organizations | 0 | 0.0% |
| Local Government Employees | 3 | 8.6% |
| State Government Employees | 2 | 5.7% |
| Federal Government Employees | 0 | 0.0% |
| Unpaid Family Workers | 0 | 0.0% |
| Total | 35 | 100.0% |
Employment Status by Age in Nemaha
According to the labor force statistics for Nemaha, out of the total population over 16 years of age (60), 61.7% or 37 individuals are in the labor force, with 5.4% or 2 of them unemployed. The age group with the highest labor force participation rate is 35 to 44 years, with 100.0% or 7 individuals in the labor force. Within the labor force, the 35 to 44 years age range has the highest percentage of unemployed individuals, with 28.6% or 2 of them being unemployed.
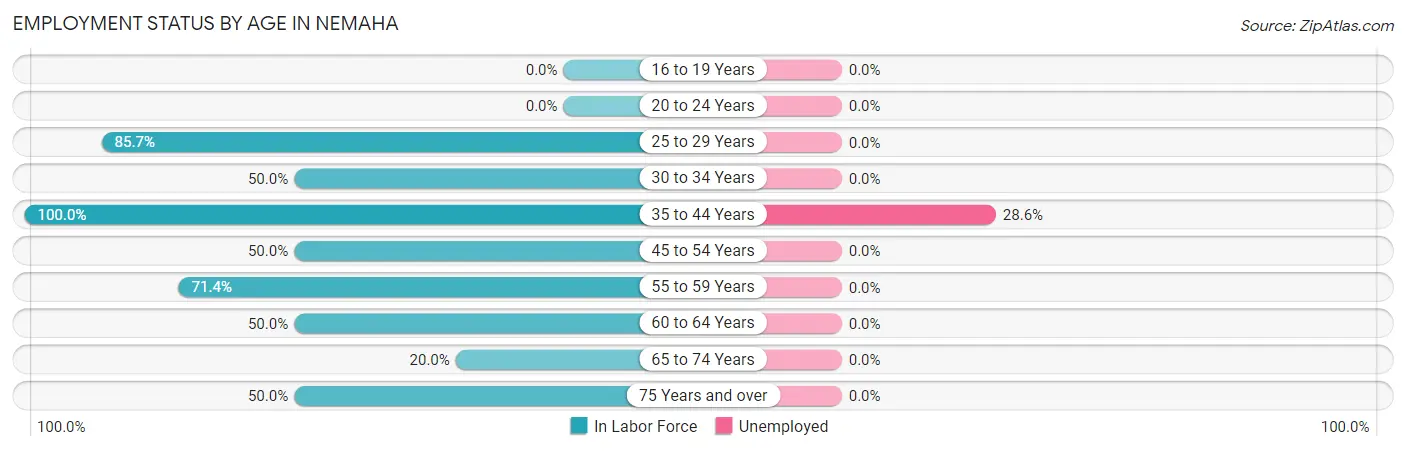
| Age Bracket | In Labor Force | Unemployed |
| 16 to 19 Years | 0 (0.0%) | 0 (0.0%) |
| 20 to 24 Years | 0 (0.0%) | 0 (0.0%) |
| 25 to 29 Years | 12 (85.7%) | 0 (0.0%) |
| 30 to 34 Years | 1 (50.0%) | 0 (0.0%) |
| 35 to 44 Years | 7 (100.0%) | 2 (28.6%) |
| 45 to 54 Years | 5 (50.0%) | 0 (0.0%) |
| 55 to 59 Years | 5 (71.4%) | 0 (0.0%) |
| 60 to 64 Years | 4 (50.0%) | 0 (0.0%) |
| 65 to 74 Years | 2 (20.0%) | 0 (0.0%) |
| 75 Years and over | 1 (50.0%) | 0 (0.0%) |
| Total | 37 (61.7%) | 2 (5.4%) |
Employment Status by Educational Attainment in Nemaha
According to labor force statistics for Nemaha, 70.8% of individuals (34) out of the total population between 25 and 64 years of age (48) are in the labor force, with 5.9% or 2 of them being unemployed. The group with the highest labor force participation rate are those with the educational attainment of less than high school, with 100.0% or 4 individuals in the labor force. Within the labor force, individuals with high school diploma education have the highest percentage of unemployment, with 11.1% or 2 of them being unemployed.
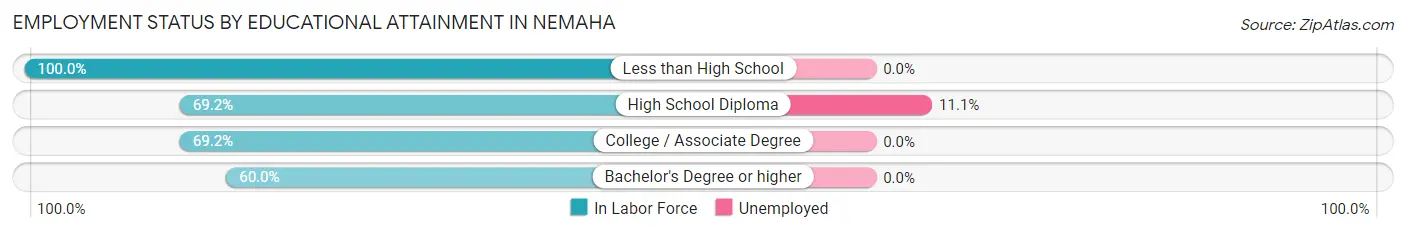
| Educational Attainment | In Labor Force | Unemployed |
| Less than High School | 4 (100.0%) | 0 (0.0%) |
| High School Diploma | 18 (69.2%) | 3 (11.1%) |
| College / Associate Degree | 9 (69.2%) | 0 (0.0%) |
| Bachelor's Degree or higher | 3 (60.0%) | 0 (0.0%) |
| Total | 34 (70.8%) | 3 (5.9%) |
Employment Occupations by Sex in Nemaha
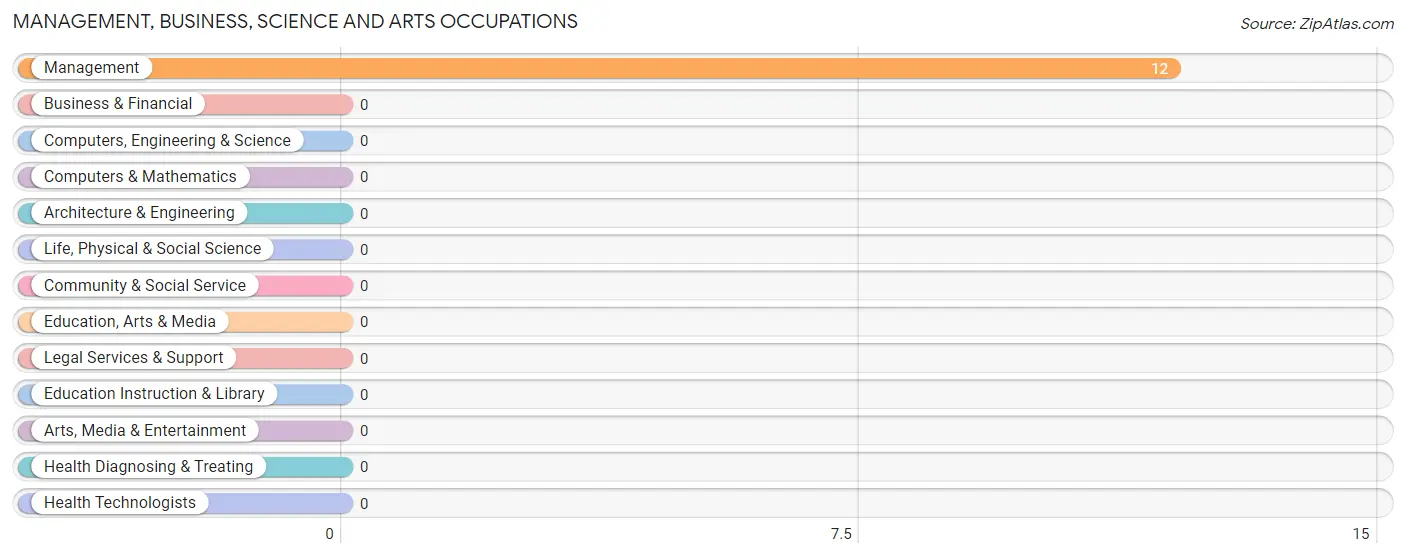
Management, Business, Science and Arts Occupations
The most common Management, Business, Science and Arts occupations in Nemaha are , and Management (12 | 34.3%).
Management, Business, Science and Arts Occupations by Sex
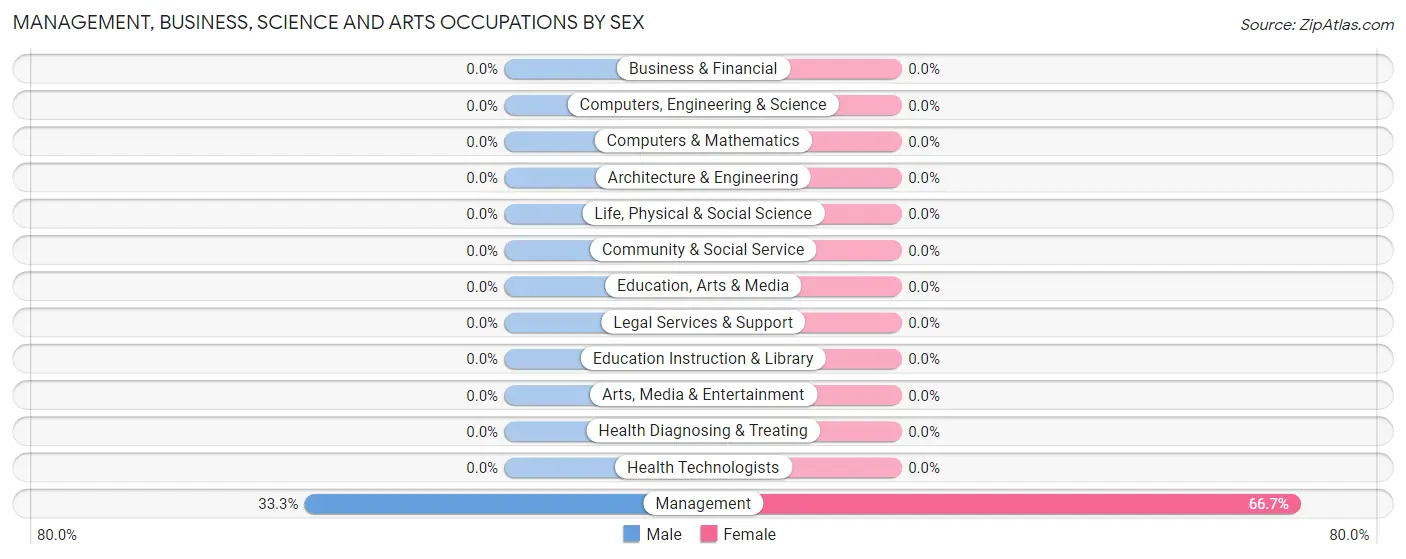
| Occupation | Male | Female |
| Management | 4 (33.3%) | 8 (66.7%) |
| Business & Financial | 0 (0.0%) | 0 (0.0%) |
| Computers, Engineering & Science | 0 (0.0%) | 0 (0.0%) |
| Computers & Mathematics | 0 (0.0%) | 0 (0.0%) |
| Architecture & Engineering | 0 (0.0%) | 0 (0.0%) |
| Life, Physical & Social Science | 0 (0.0%) | 0 (0.0%) |
| Community & Social Service | 0 (0.0%) | 0 (0.0%) |
| Education, Arts & Media | 0 (0.0%) | 0 (0.0%) |
| Legal Services & Support | 0 (0.0%) | 0 (0.0%) |
| Education Instruction & Library | 0 (0.0%) | 0 (0.0%) |
| Arts, Media & Entertainment | 0 (0.0%) | 0 (0.0%) |
| Health Diagnosing & Treating | 0 (0.0%) | 0 (0.0%) |
| Health Technologists | 0 (0.0%) | 0 (0.0%) |
| Total (Category) | 4 (33.3%) | 8 (66.7%) |
| Total (Overall) | 18 (51.4%) | 17 (48.6%) |
Services Occupations
The most common Services occupations in Nemaha are Cleaning & Maintenance (5 | 14.3%), and Healthcare Support (1 | 2.9%).
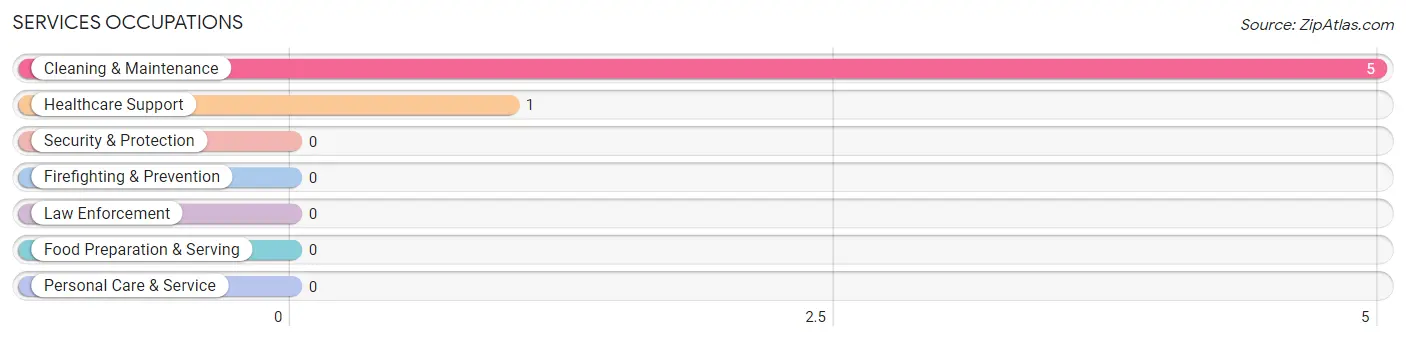
Services Occupations by Sex
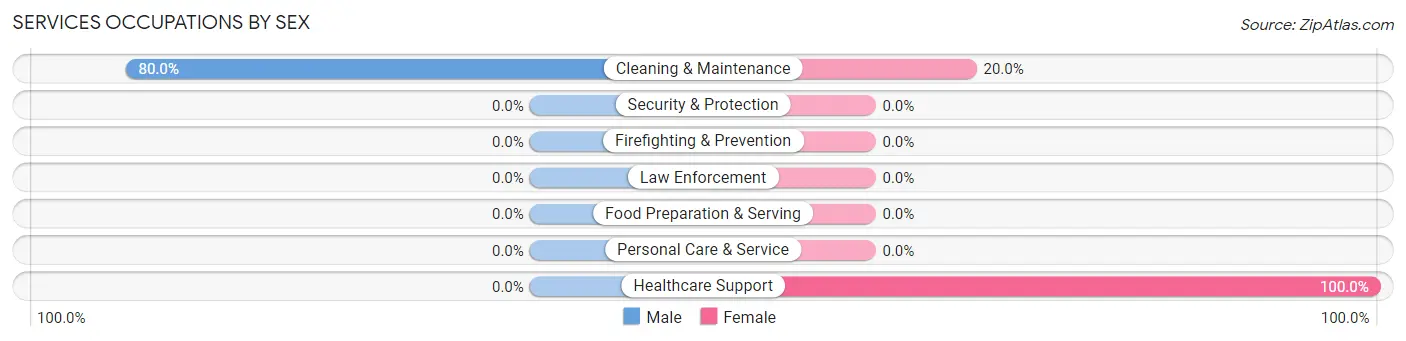
| Occupation | Male | Female |
| Healthcare Support | 0 (0.0%) | 1 (100.0%) |
| Security & Protection | 0 (0.0%) | 0 (0.0%) |
| Firefighting & Prevention | 0 (0.0%) | 0 (0.0%) |
| Law Enforcement | 0 (0.0%) | 0 (0.0%) |
| Food Preparation & Serving | 0 (0.0%) | 0 (0.0%) |
| Cleaning & Maintenance | 4 (80.0%) | 1 (20.0%) |
| Personal Care & Service | 0 (0.0%) | 0 (0.0%) |
| Total (Category) | 4 (66.7%) | 2 (33.3%) |
| Total (Overall) | 18 (51.4%) | 17 (48.6%) |
Sales and Office Occupations
The most common Sales and Office occupations in Nemaha are , and Office & Administration (8 | 22.9%).
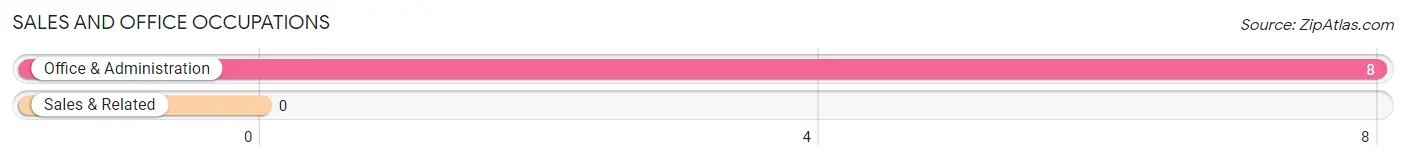
Sales and Office Occupations by Sex
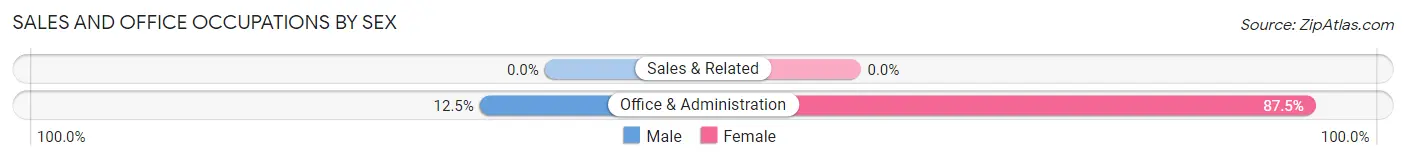
| Occupation | Male | Female |
| Sales & Related | 0 (0.0%) | 0 (0.0%) |
| Office & Administration | 1 (12.5%) | 7 (87.5%) |
| Total (Category) | 1 (12.5%) | 7 (87.5%) |
| Total (Overall) | 18 (51.4%) | 17 (48.6%) |
Natural Resources, Construction and Maintenance Occupations
The most common Natural Resources, Construction and Maintenance occupations in Nemaha are Farming, Fishing & Forestry (3 | 8.6%), and Installation, Maintenance & Repair (1 | 2.9%).
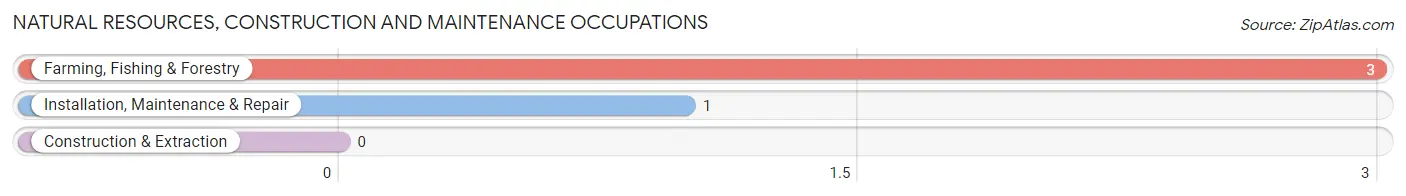
Natural Resources, Construction and Maintenance Occupations by Sex
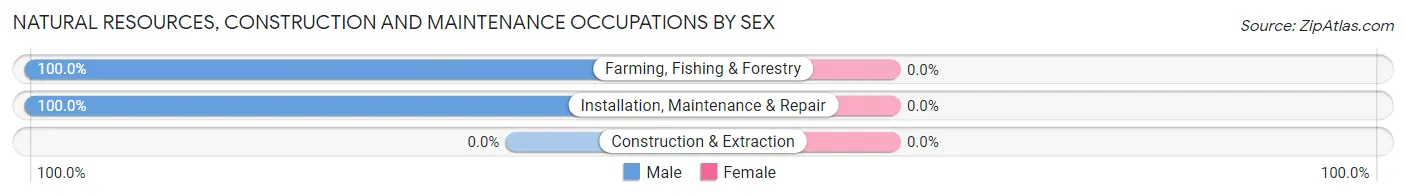
| Occupation | Male | Female |
| Farming, Fishing & Forestry | 3 (100.0%) | 0 (0.0%) |
| Construction & Extraction | 0 (0.0%) | 0 (0.0%) |
| Installation, Maintenance & Repair | 1 (100.0%) | 0 (0.0%) |
| Total (Category) | 4 (100.0%) | 0 (0.0%) |
| Total (Overall) | 18 (51.4%) | 17 (48.6%) |
Production, Transportation and Moving Occupations
The most common Production, Transportation and Moving occupations in Nemaha are Production (3 | 8.6%), and Material Moving (2 | 5.7%).
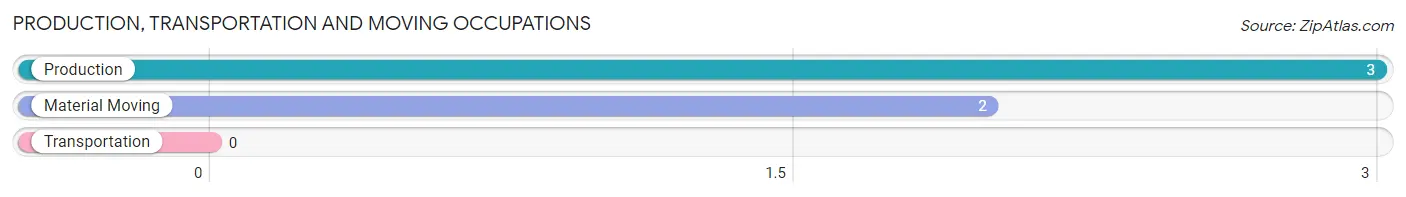
Production, Transportation and Moving Occupations by Sex
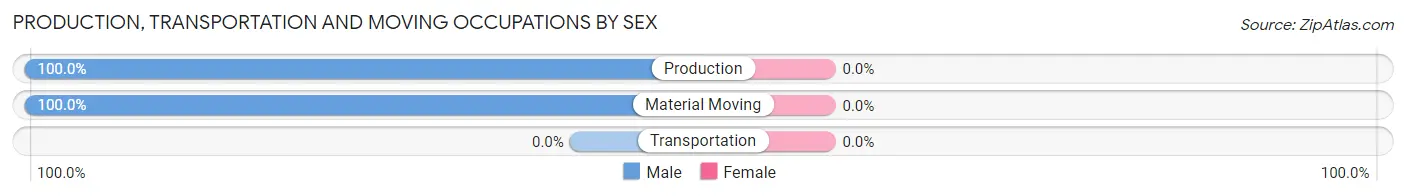
| Occupation | Male | Female |
| Production | 3 (100.0%) | 0 (0.0%) |
| Transportation | 0 (0.0%) | 0 (0.0%) |
| Material Moving | 2 (100.0%) | 0 (0.0%) |
| Total (Category) | 5 (100.0%) | 0 (0.0%) |
| Total (Overall) | 18 (51.4%) | 17 (48.6%) |
Employment Industries by Sex in Nemaha
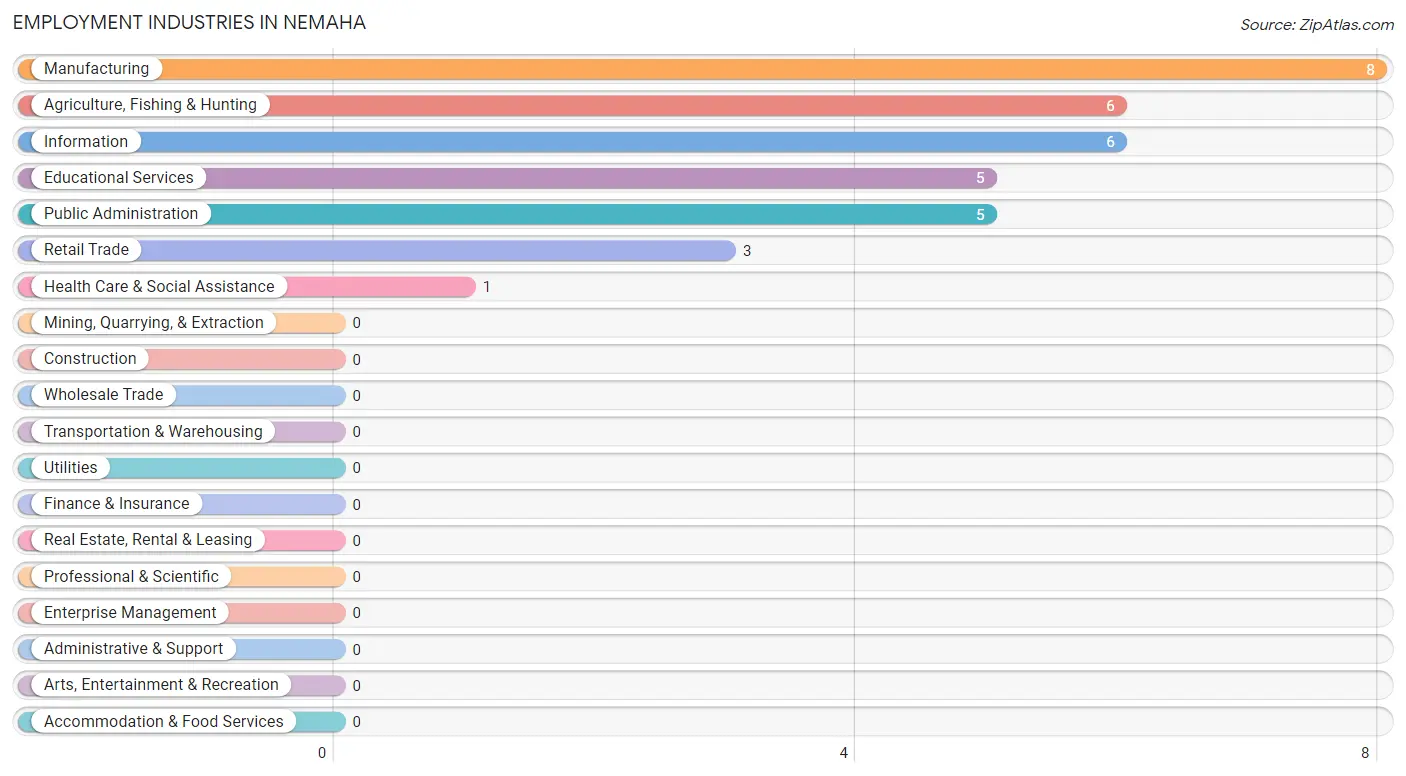
Employment Industries in Nemaha
The major employment industries in Nemaha include Manufacturing (8 | 22.9%), Agriculture, Fishing & Hunting (6 | 17.1%), Information (6 | 17.1%), Educational Services (5 | 14.3%), and Public Administration (5 | 14.3%).
Employment Industries by Sex in Nemaha
The Nemaha industries that see more men than women are Manufacturing (100.0%), Retail Trade (100.0%), and Agriculture, Fishing & Hunting (66.7%), whereas the industries that tend to have a higher number of women are Information (100.0%), Educational Services (100.0%), and Health Care & Social Assistance (100.0%).
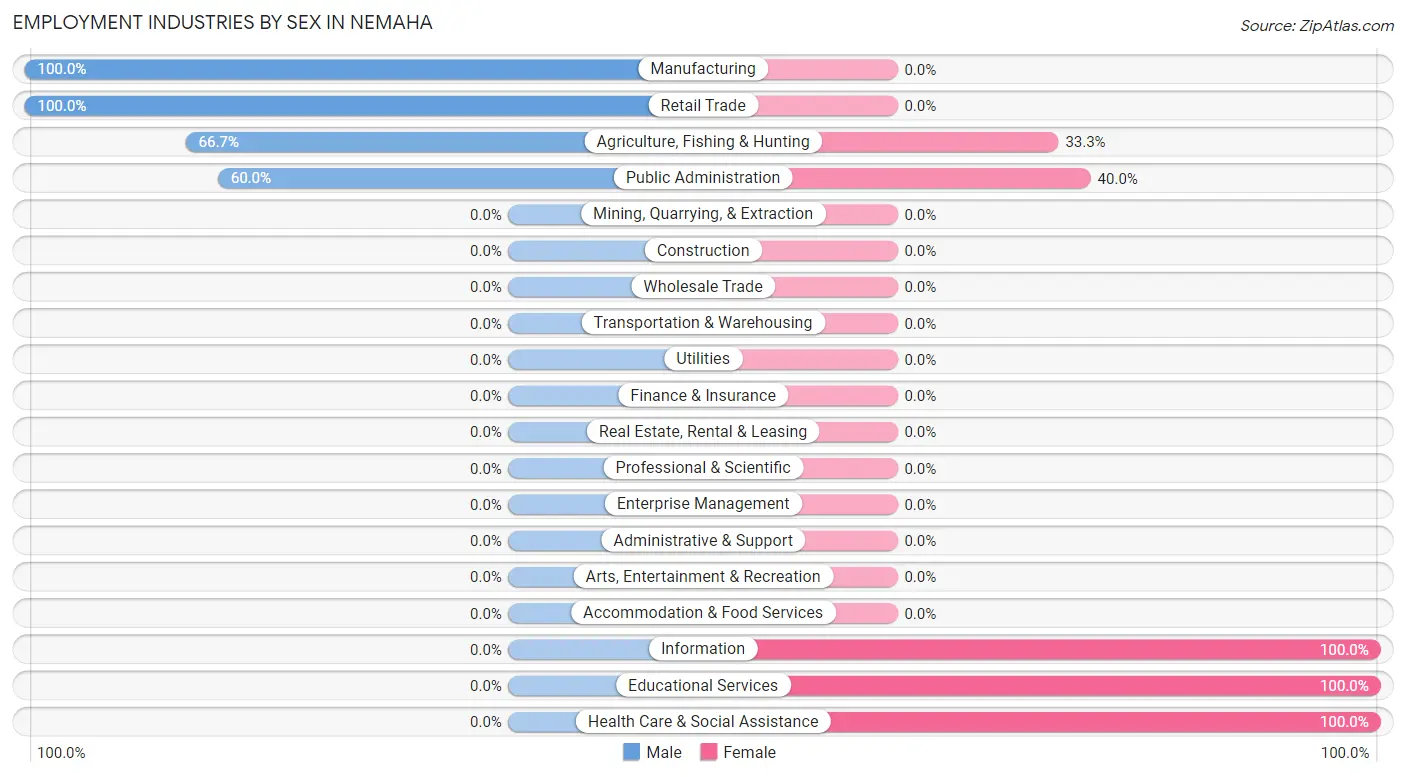
| Industry | Male | Female |
| Agriculture, Fishing & Hunting | 4 (66.7%) | 2 (33.3%) |
| Mining, Quarrying, & Extraction | 0 (0.0%) | 0 (0.0%) |
| Construction | 0 (0.0%) | 0 (0.0%) |
| Manufacturing | 8 (100.0%) | 0 (0.0%) |
| Wholesale Trade | 0 (0.0%) | 0 (0.0%) |
| Retail Trade | 3 (100.0%) | 0 (0.0%) |
| Transportation & Warehousing | 0 (0.0%) | 0 (0.0%) |
| Utilities | 0 (0.0%) | 0 (0.0%) |
| Information | 0 (0.0%) | 6 (100.0%) |
| Finance & Insurance | 0 (0.0%) | 0 (0.0%) |
| Real Estate, Rental & Leasing | 0 (0.0%) | 0 (0.0%) |
| Professional & Scientific | 0 (0.0%) | 0 (0.0%) |
| Enterprise Management | 0 (0.0%) | 0 (0.0%) |
| Administrative & Support | 0 (0.0%) | 0 (0.0%) |
| Educational Services | 0 (0.0%) | 5 (100.0%) |
| Health Care & Social Assistance | 0 (0.0%) | 1 (100.0%) |
| Arts, Entertainment & Recreation | 0 (0.0%) | 0 (0.0%) |
| Accommodation & Food Services | 0 (0.0%) | 0 (0.0%) |
| Public Administration | 3 (60.0%) | 2 (40.0%) |
| Total | 18 (51.4%) | 17 (48.6%) |
Education in Nemaha
School Enrollment in Nemaha
The most common levels of schooling among the 38 students in Nemaha are middle school (11 | 28.9%), elementary school (10 | 26.3%), and high school (9 | 23.7%).
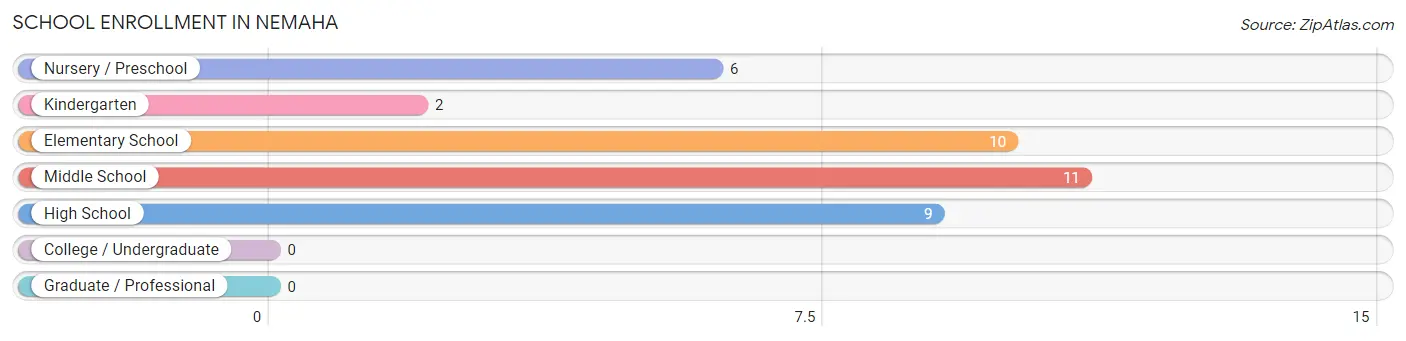
| School Level | # Students | % Students |
| Nursery / Preschool | 6 | 15.8% |
| Kindergarten | 2 | 5.3% |
| Elementary School | 10 | 26.3% |
| Middle School | 11 | 28.9% |
| High School | 9 | 23.7% |
| College / Undergraduate | 0 | 0.0% |
| Graduate / Professional | 0 | 0.0% |
| Total | 38 | 100.0% |
School Enrollment by Age by Funding Source in Nemaha
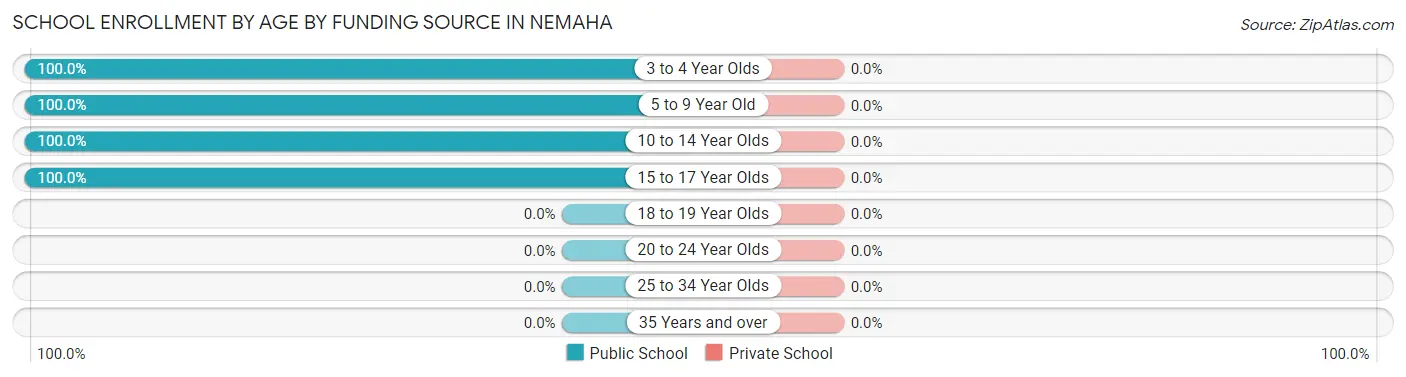
| Age Bracket | Public School | Private School |
| 3 to 4 Year Olds | 6 (100.0%) | 0 (0.0%) |
| 5 to 9 Year Old | 7 (100.0%) | 0 (0.0%) |
| 10 to 14 Year Olds | 17 (100.0%) | 0 (0.0%) |
| 15 to 17 Year Olds | 8 (100.0%) | 0 (0.0%) |
| 18 to 19 Year Olds | 0 (0.0%) | 0 (0.0%) |
| 20 to 24 Year Olds | 0 (0.0%) | 0 (0.0%) |
| 25 to 34 Year Olds | 0 (0.0%) | 0 (0.0%) |
| 35 Years and over | 0 (0.0%) | 0 (0.0%) |
| Total | 38 (100.0%) | 0 (0.0%) |
Educational Attainment by Field of Study in Nemaha
Science & technology (3 | 60.0%), and business (2 | 40.0%) are the most common fields of study among 5 individuals in Nemaha who have obtained a bachelor's degree or higher.
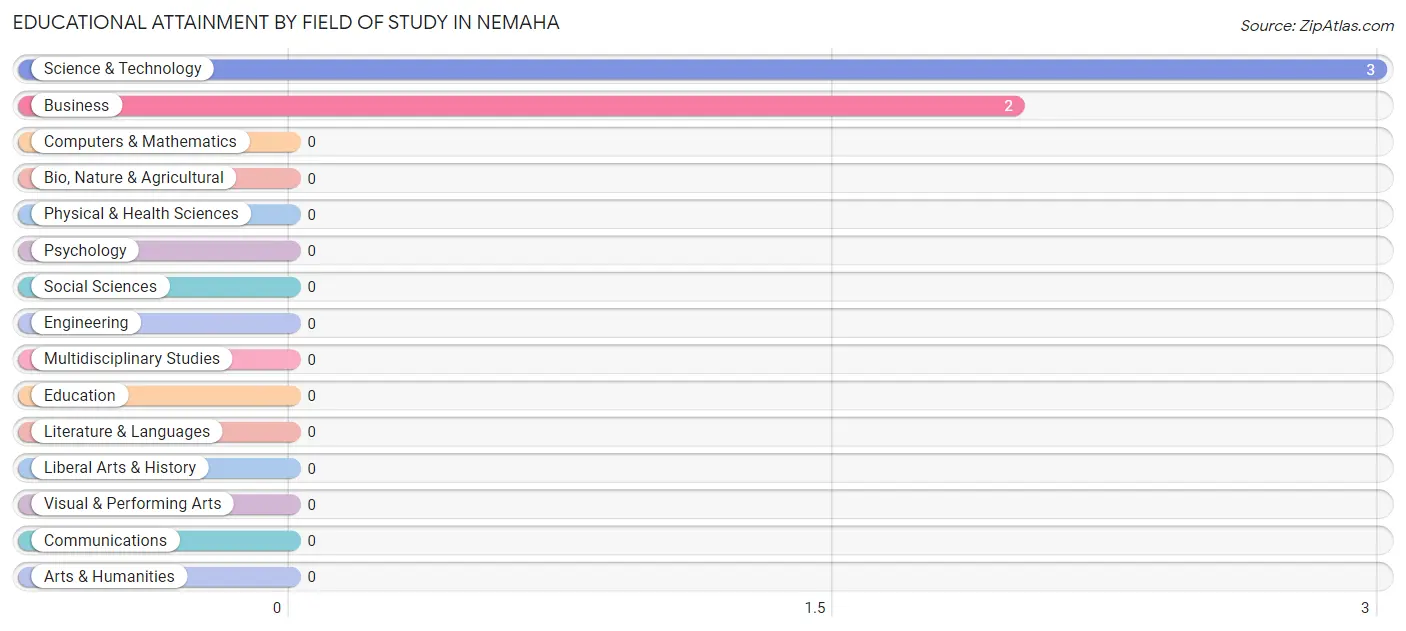
| Field of Study | # Graduates | % Graduates |
| Computers & Mathematics | 0 | 0.0% |
| Bio, Nature & Agricultural | 0 | 0.0% |
| Physical & Health Sciences | 0 | 0.0% |
| Psychology | 0 | 0.0% |
| Social Sciences | 0 | 0.0% |
| Engineering | 0 | 0.0% |
| Multidisciplinary Studies | 0 | 0.0% |
| Science & Technology | 3 | 60.0% |
| Business | 2 | 40.0% |
| Education | 0 | 0.0% |
| Literature & Languages | 0 | 0.0% |
| Liberal Arts & History | 0 | 0.0% |
| Visual & Performing Arts | 0 | 0.0% |
| Communications | 0 | 0.0% |
| Arts & Humanities | 0 | 0.0% |
| Total | 5 | 100.0% |
Transportation & Commute in Nemaha
Vehicle Availability by Sex in Nemaha
The most prevalent vehicle ownership categories in Nemaha are males with 2 vehicles (8, accounting for 44.4%) and females with 2 vehicles (1, making up 47.1%).
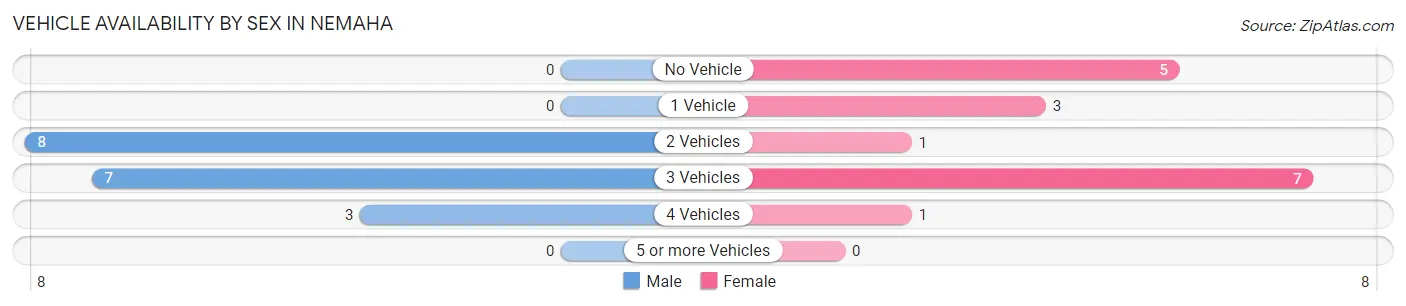
| Vehicles Available | Male | Female |
| No Vehicle | 0 (0.0%) | 5 (29.4%) |
| 1 Vehicle | 0 (0.0%) | 3 (17.6%) |
| 2 Vehicles | 8 (44.4%) | 1 (5.9%) |
| 3 Vehicles | 7 (38.9%) | 7 (41.2%) |
| 4 Vehicles | 3 (16.7%) | 1 (5.9%) |
| 5 or more Vehicles | 0 (0.0%) | 0 (0.0%) |
| Total | 18 (100.0%) | 17 (100.0%) |
Commute Time in Nemaha
The most frequently occuring commute durations in Nemaha are 20 to 24 minutes (12 commuters, 34.3%), 35 to 39 minutes (7 commuters, 20.0%), and 15 to 19 minutes (5 commuters, 14.3%).
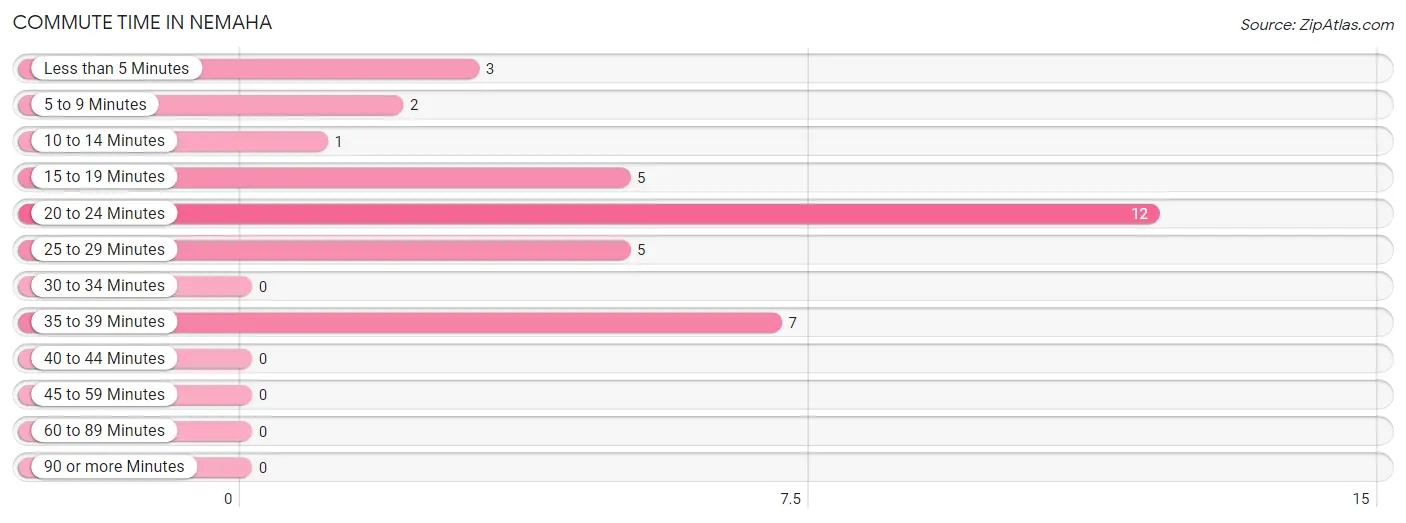
| Commute Time | # Commuters | % Commuters |
| Less than 5 Minutes | 3 | 8.6% |
| 5 to 9 Minutes | 2 | 5.7% |
| 10 to 14 Minutes | 1 | 2.9% |
| 15 to 19 Minutes | 5 | 14.3% |
| 20 to 24 Minutes | 12 | 34.3% |
| 25 to 29 Minutes | 5 | 14.3% |
| 30 to 34 Minutes | 0 | 0.0% |
| 35 to 39 Minutes | 7 | 20.0% |
| 40 to 44 Minutes | 0 | 0.0% |
| 45 to 59 Minutes | 0 | 0.0% |
| 60 to 89 Minutes | 0 | 0.0% |
| 90 or more Minutes | 0 | 0.0% |
Commute Time by Sex in Nemaha
The most common commute times in Nemaha are 20 to 24 minutes (6 commuters, 33.3%) for males and 20 to 24 minutes (6 commuters, 35.3%) for females.
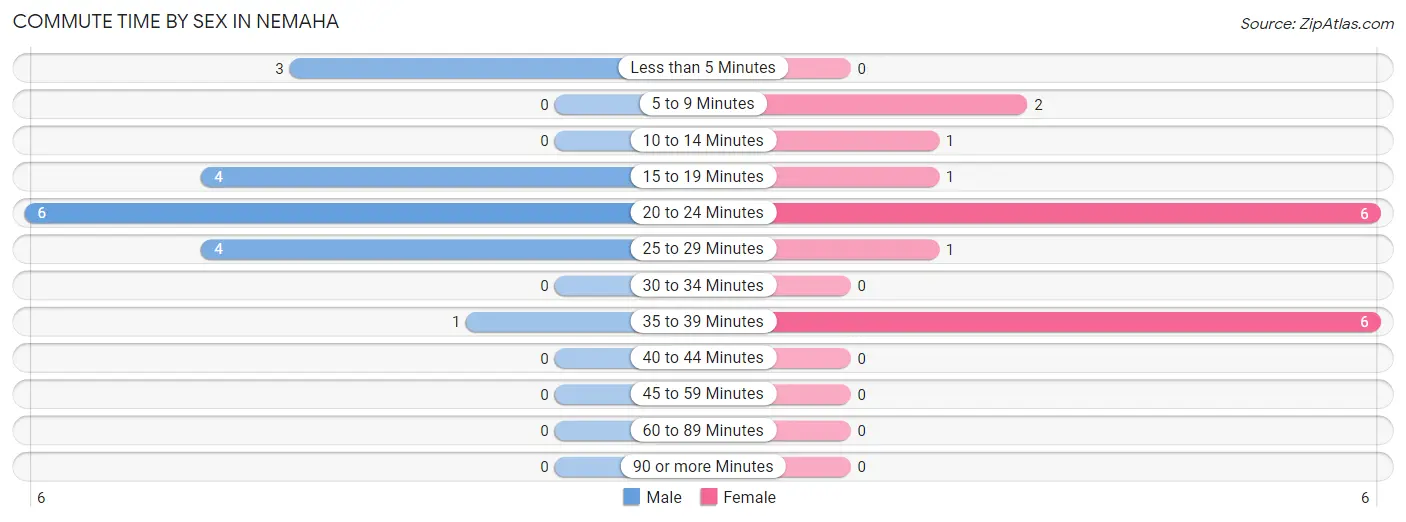
| Commute Time | Male | Female |
| Less than 5 Minutes | 3 (16.7%) | 0 (0.0%) |
| 5 to 9 Minutes | 0 (0.0%) | 2 (11.8%) |
| 10 to 14 Minutes | 0 (0.0%) | 1 (5.9%) |
| 15 to 19 Minutes | 4 (22.2%) | 1 (5.9%) |
| 20 to 24 Minutes | 6 (33.3%) | 6 (35.3%) |
| 25 to 29 Minutes | 4 (22.2%) | 1 (5.9%) |
| 30 to 34 Minutes | 0 (0.0%) | 0 (0.0%) |
| 35 to 39 Minutes | 1 (5.6%) | 6 (35.3%) |
| 40 to 44 Minutes | 0 (0.0%) | 0 (0.0%) |
| 45 to 59 Minutes | 0 (0.0%) | 0 (0.0%) |
| 60 to 89 Minutes | 0 (0.0%) | 0 (0.0%) |
| 90 or more Minutes | 0 (0.0%) | 0 (0.0%) |
Time of Departure to Work by Sex in Nemaha
The most frequent times of departure to work in Nemaha are 5:00 AM to 5:29 AM (5, 27.8%) for males and 7:30 AM to 7:59 AM (7, 41.2%) for females.
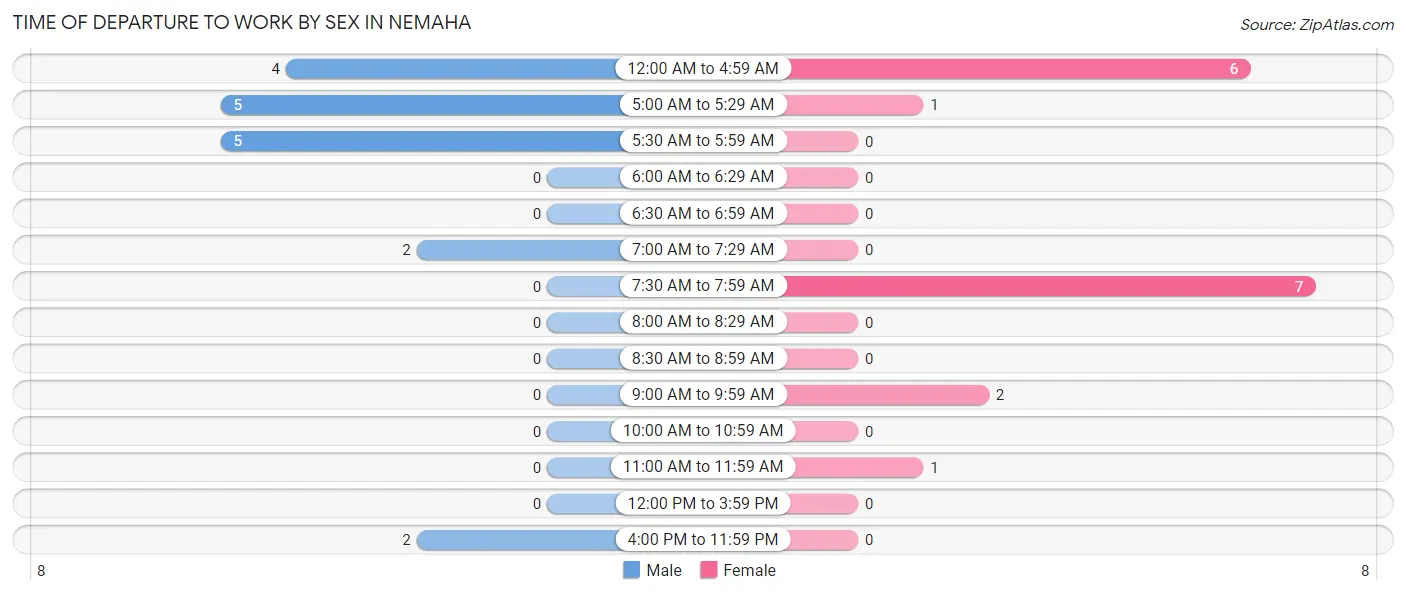
| Time of Departure | Male | Female |
| 12:00 AM to 4:59 AM | 4 (22.2%) | 6 (35.3%) |
| 5:00 AM to 5:29 AM | 5 (27.8%) | 1 (5.9%) |
| 5:30 AM to 5:59 AM | 5 (27.8%) | 0 (0.0%) |
| 6:00 AM to 6:29 AM | 0 (0.0%) | 0 (0.0%) |
| 6:30 AM to 6:59 AM | 0 (0.0%) | 0 (0.0%) |
| 7:00 AM to 7:29 AM | 2 (11.1%) | 0 (0.0%) |
| 7:30 AM to 7:59 AM | 0 (0.0%) | 7 (41.2%) |
| 8:00 AM to 8:29 AM | 0 (0.0%) | 0 (0.0%) |
| 8:30 AM to 8:59 AM | 0 (0.0%) | 0 (0.0%) |
| 9:00 AM to 9:59 AM | 0 (0.0%) | 2 (11.8%) |
| 10:00 AM to 10:59 AM | 0 (0.0%) | 0 (0.0%) |
| 11:00 AM to 11:59 AM | 0 (0.0%) | 1 (5.9%) |
| 12:00 PM to 3:59 PM | 0 (0.0%) | 0 (0.0%) |
| 4:00 PM to 11:59 PM | 2 (11.1%) | 0 (0.0%) |
| Total | 18 (100.0%) | 17 (100.0%) |
Housing Occupancy in Nemaha
Occupancy by Ownership in Nemaha
Of the total 35 dwellings in Nemaha, owner-occupied units account for 29 (82.9%), while renter-occupied units make up 6 (17.1%).
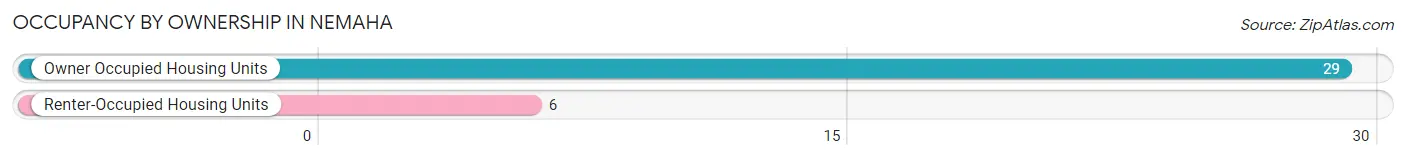
| Occupancy | # Housing Units | % Housing Units |
| Owner Occupied Housing Units | 29 | 82.9% |
| Renter-Occupied Housing Units | 6 | 17.1% |
| Total Occupied Housing Units | 35 | 100.0% |
Occupancy by Household Size in Nemaha
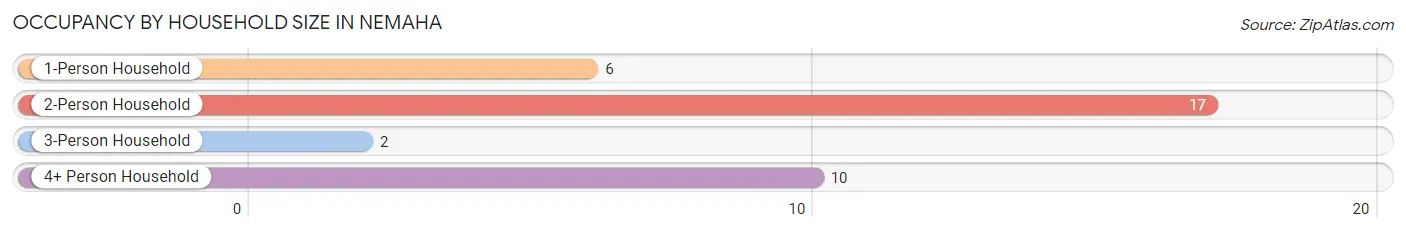
| Household Size | # Housing Units | % Housing Units |
| 1-Person Household | 6 | 17.1% |
| 2-Person Household | 17 | 48.6% |
| 3-Person Household | 2 | 5.7% |
| 4+ Person Household | 10 | 28.6% |
| Total Housing Units | 35 | 100.0% |
Occupancy by Ownership by Household Size in Nemaha
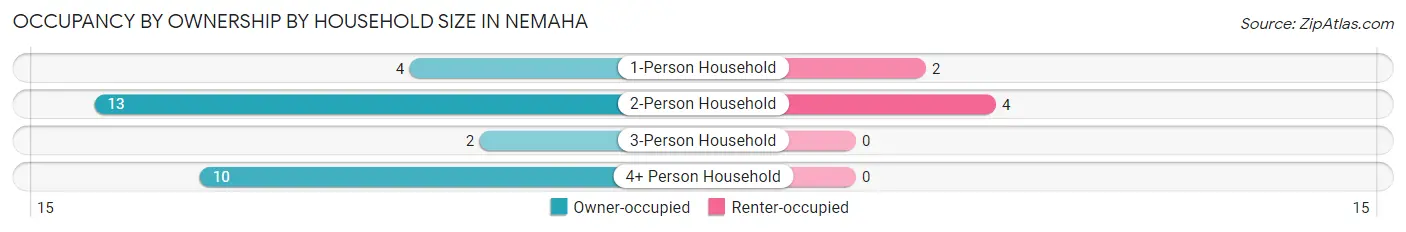
| Household Size | Owner-occupied | Renter-occupied |
| 1-Person Household | 4 (66.7%) | 2 (33.3%) |
| 2-Person Household | 13 (76.5%) | 4 (23.5%) |
| 3-Person Household | 2 (100.0%) | 0 (0.0%) |
| 4+ Person Household | 10 (100.0%) | 0 (0.0%) |
| Total Housing Units | 29 (82.9%) | 6 (17.1%) |
Occupancy by Educational Attainment in Nemaha
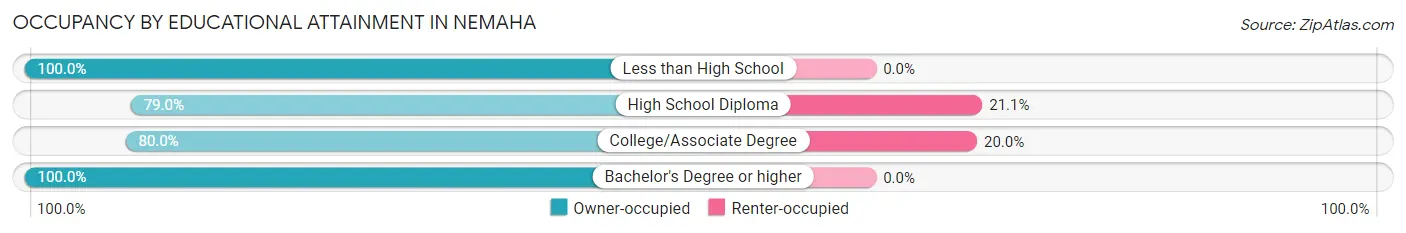
| Household Size | Owner-occupied | Renter-occupied |
| Less than High School | 4 (100.0%) | 0 (0.0%) |
| High School Diploma | 15 (78.9%) | 4 (21.0%) |
| College/Associate Degree | 8 (80.0%) | 2 (20.0%) |
| Bachelor's Degree or higher | 2 (100.0%) | 0 (0.0%) |
Occupancy by Age of Householder in Nemaha
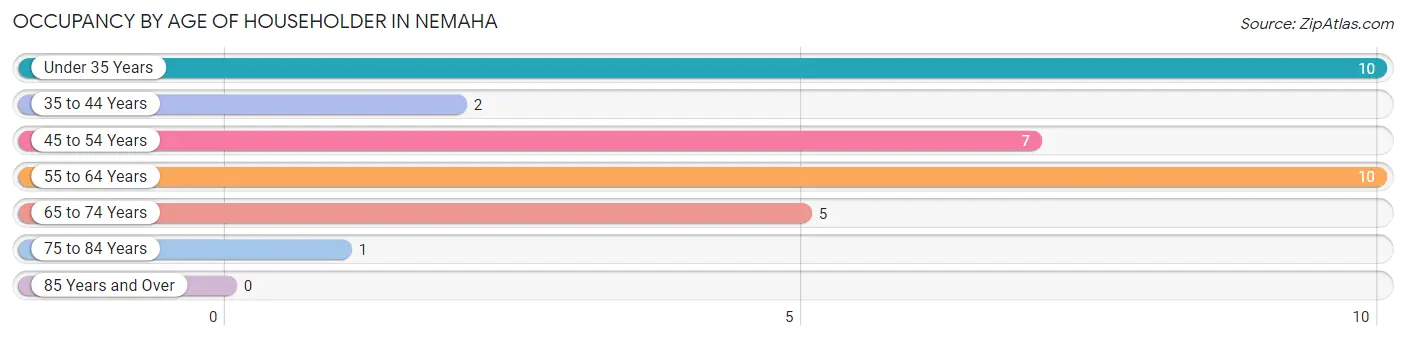
| Age Bracket | # Households | % Households |
| Under 35 Years | 10 | 28.6% |
| 35 to 44 Years | 2 | 5.7% |
| 45 to 54 Years | 7 | 20.0% |
| 55 to 64 Years | 10 | 28.6% |
| 65 to 74 Years | 5 | 14.3% |
| 75 to 84 Years | 1 | 2.9% |
| 85 Years and Over | 0 | 0.0% |
| Total | 35 | 100.0% |
Housing Finances in Nemaha
Median Income by Occupancy in Nemaha
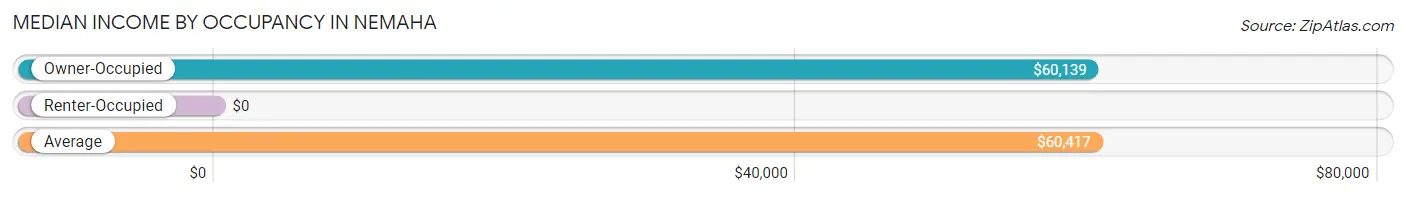
| Occupancy Type | # Households | Median Income |
| Owner-Occupied | 29 (82.9%) | $60,139 |
| Renter-Occupied | 6 (17.1%) | $0 |
| Average | 35 (100.0%) | $60,417 |
Occupancy by Householder Income Bracket in Nemaha
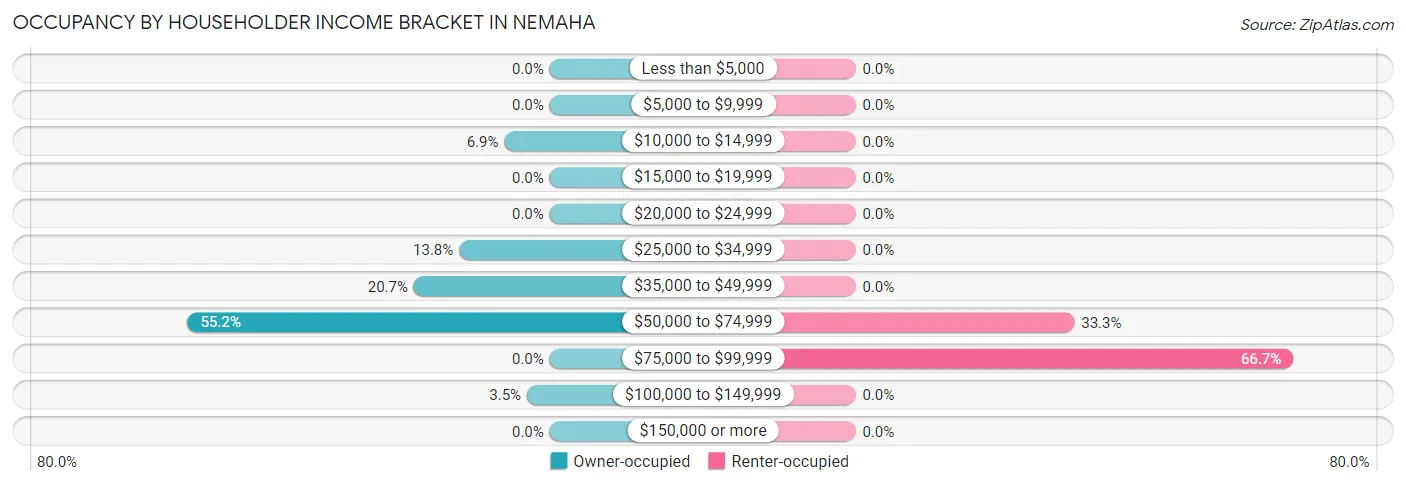
| Income Bracket | Owner-occupied | Renter-occupied |
| Less than $5,000 | 0 (0.0%) | 0 (0.0%) |
| $5,000 to $9,999 | 0 (0.0%) | 0 (0.0%) |
| $10,000 to $14,999 | 2 (6.9%) | 0 (0.0%) |
| $15,000 to $19,999 | 0 (0.0%) | 0 (0.0%) |
| $20,000 to $24,999 | 0 (0.0%) | 0 (0.0%) |
| $25,000 to $34,999 | 4 (13.8%) | 0 (0.0%) |
| $35,000 to $49,999 | 6 (20.7%) | 0 (0.0%) |
| $50,000 to $74,999 | 16 (55.2%) | 2 (33.3%) |
| $75,000 to $99,999 | 0 (0.0%) | 4 (66.7%) |
| $100,000 to $149,999 | 1 (3.5%) | 0 (0.0%) |
| $150,000 or more | 0 (0.0%) | 0 (0.0%) |
| Total | 29 (100.0%) | 6 (100.0%) |
Monthly Housing Cost Tiers in Nemaha
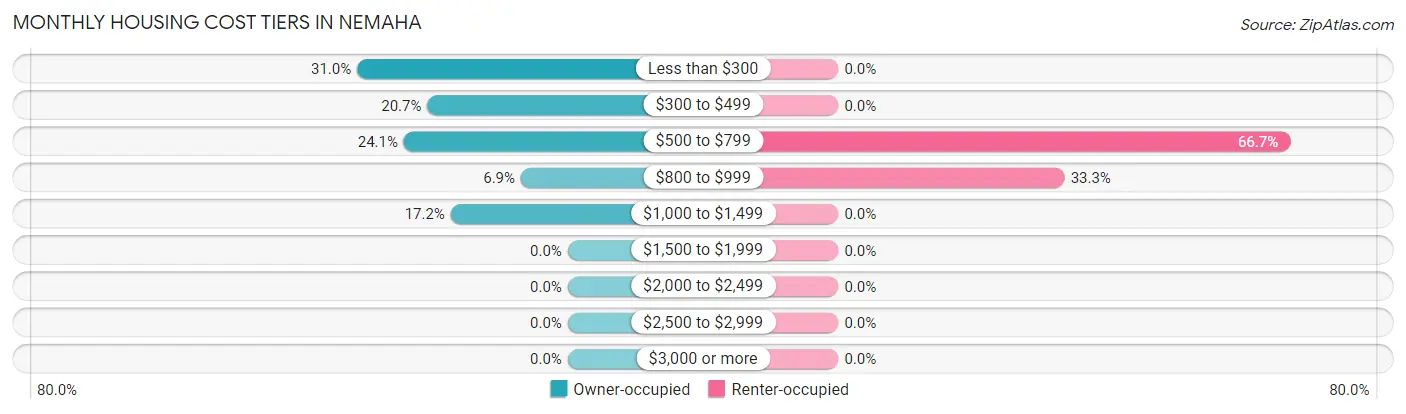
| Monthly Cost | Owner-occupied | Renter-occupied |
| Less than $300 | 9 (31.0%) | 0 (0.0%) |
| $300 to $499 | 6 (20.7%) | 0 (0.0%) |
| $500 to $799 | 7 (24.1%) | 4 (66.7%) |
| $800 to $999 | 2 (6.9%) | 2 (33.3%) |
| $1,000 to $1,499 | 5 (17.2%) | 0 (0.0%) |
| $1,500 to $1,999 | 0 (0.0%) | 0 (0.0%) |
| $2,000 to $2,499 | 0 (0.0%) | 0 (0.0%) |
| $2,500 to $2,999 | 0 (0.0%) | 0 (0.0%) |
| $3,000 or more | 0 (0.0%) | 0 (0.0%) |
| Total | 29 (100.0%) | 6 (100.0%) |
Physical Housing Characteristics in Nemaha
Housing Structures in Nemaha
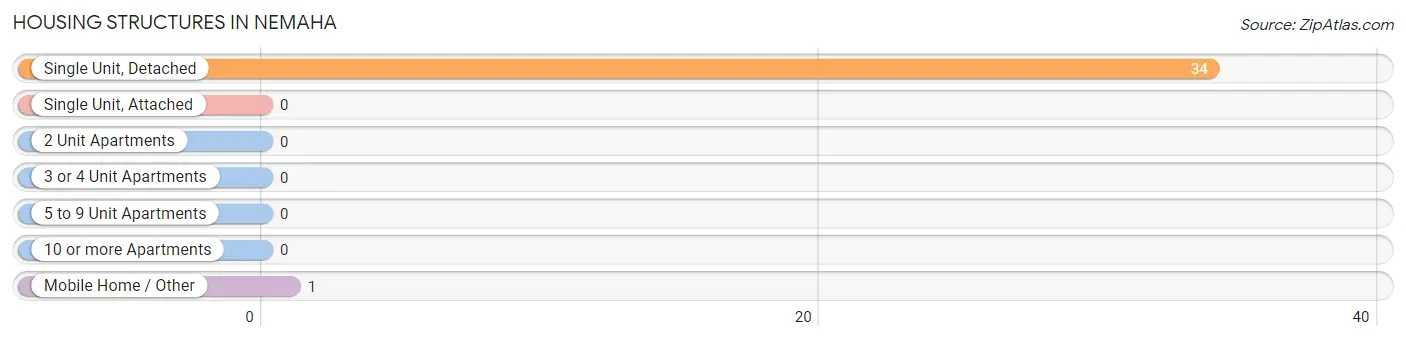
| Structure Type | # Housing Units | % Housing Units |
| Single Unit, Detached | 34 | 97.1% |
| Single Unit, Attached | 0 | 0.0% |
| 2 Unit Apartments | 0 | 0.0% |
| 3 or 4 Unit Apartments | 0 | 0.0% |
| 5 to 9 Unit Apartments | 0 | 0.0% |
| 10 or more Apartments | 0 | 0.0% |
| Mobile Home / Other | 1 | 2.9% |
| Total | 35 | 100.0% |
Housing Structures by Occupancy in Nemaha
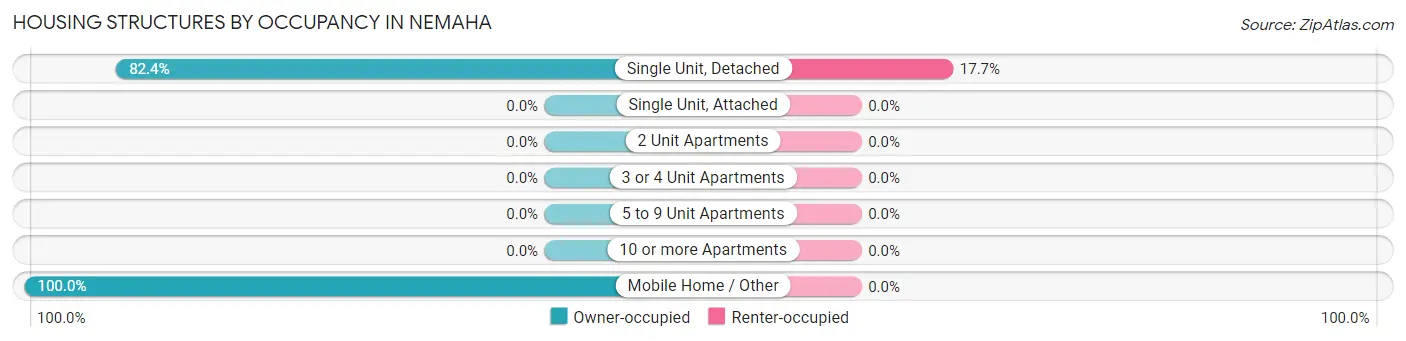
| Structure Type | Owner-occupied | Renter-occupied |
| Single Unit, Detached | 28 (82.4%) | 6 (17.6%) |
| Single Unit, Attached | 0 (0.0%) | 0 (0.0%) |
| 2 Unit Apartments | 0 (0.0%) | 0 (0.0%) |
| 3 or 4 Unit Apartments | 0 (0.0%) | 0 (0.0%) |
| 5 to 9 Unit Apartments | 0 (0.0%) | 0 (0.0%) |
| 10 or more Apartments | 0 (0.0%) | 0 (0.0%) |
| Mobile Home / Other | 1 (100.0%) | 0 (0.0%) |
| Total | 29 (82.9%) | 6 (17.1%) |
Housing Structures by Number of Rooms in Nemaha
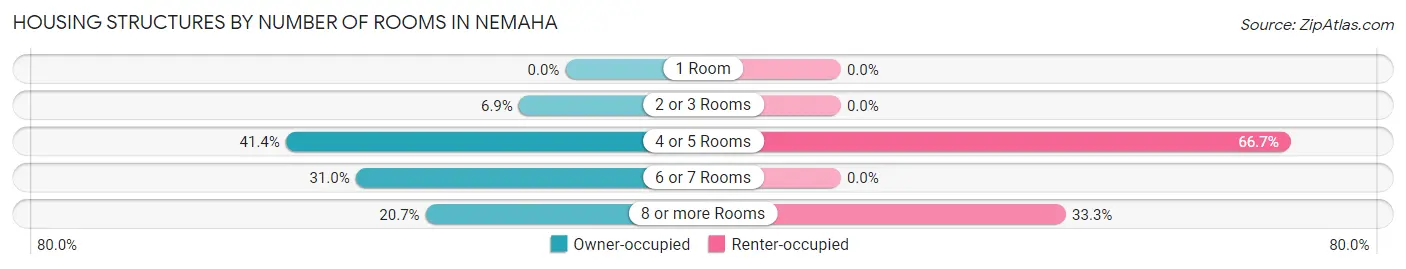
| Number of Rooms | Owner-occupied | Renter-occupied |
| 1 Room | 0 (0.0%) | 0 (0.0%) |
| 2 or 3 Rooms | 2 (6.9%) | 0 (0.0%) |
| 4 or 5 Rooms | 12 (41.4%) | 4 (66.7%) |
| 6 or 7 Rooms | 9 (31.0%) | 0 (0.0%) |
| 8 or more Rooms | 6 (20.7%) | 2 (33.3%) |
| Total | 29 (100.0%) | 6 (100.0%) |
Housing Structure by Heating Type in Nemaha
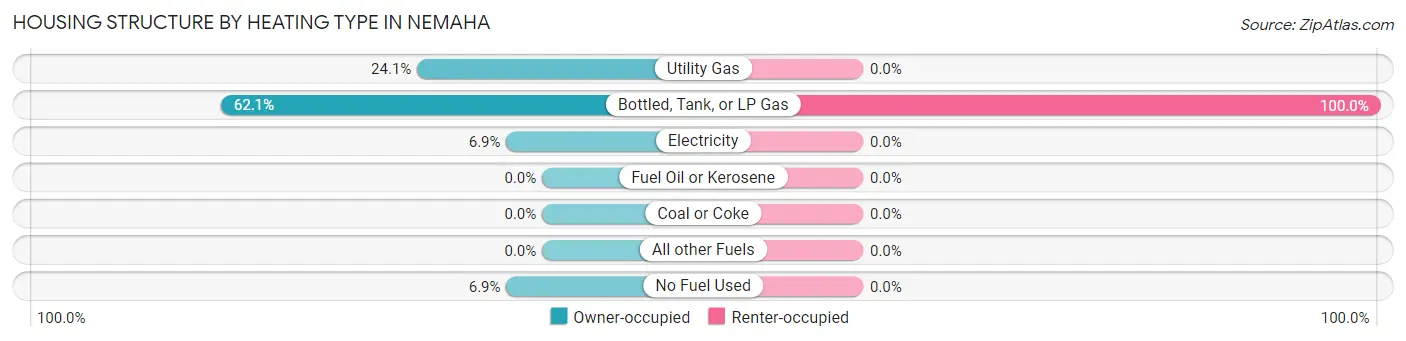
| Heating Type | Owner-occupied | Renter-occupied |
| Utility Gas | 7 (24.1%) | 0 (0.0%) |
| Bottled, Tank, or LP Gas | 18 (62.1%) | 6 (100.0%) |
| Electricity | 2 (6.9%) | 0 (0.0%) |
| Fuel Oil or Kerosene | 0 (0.0%) | 0 (0.0%) |
| Coal or Coke | 0 (0.0%) | 0 (0.0%) |
| All other Fuels | 0 (0.0%) | 0 (0.0%) |
| No Fuel Used | 2 (6.9%) | 0 (0.0%) |
| Total | 29 (100.0%) | 6 (100.0%) |
Household Vehicle Usage in Nemaha
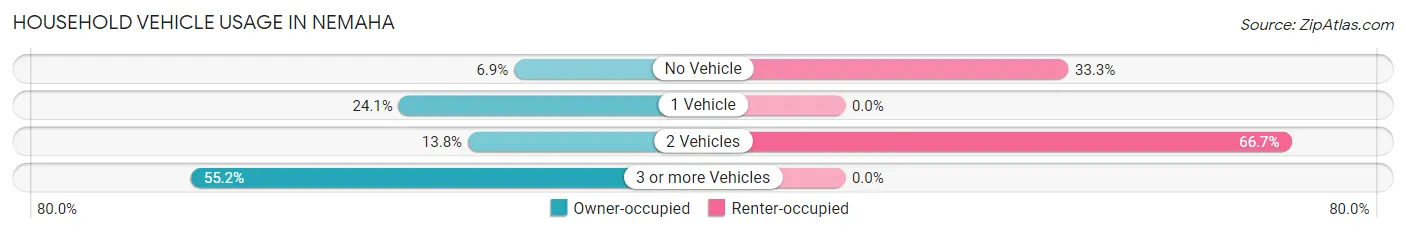
| Vehicles per Household | Owner-occupied | Renter-occupied |
| No Vehicle | 2 (6.9%) | 2 (33.3%) |
| 1 Vehicle | 7 (24.1%) | 0 (0.0%) |
| 2 Vehicles | 4 (13.8%) | 4 (66.7%) |
| 3 or more Vehicles | 16 (55.2%) | 0 (0.0%) |
| Total | 29 (100.0%) | 6 (100.0%) |
Real Estate & Mortgages in Nemaha
Real Estate and Mortgage Overview in Nemaha
| Characteristic | Without Mortgage | With Mortgage |
| Housing Units | 16 | 13 |
| Median Property Value | $43,300 | $75,800 |
| Median Household Income | $40,000 | $0 |
| Monthly Housing Costs | $250 | $0 |
| Real Estate Taxes | $500 | $0 |
Property Value by Mortgage Status in Nemaha
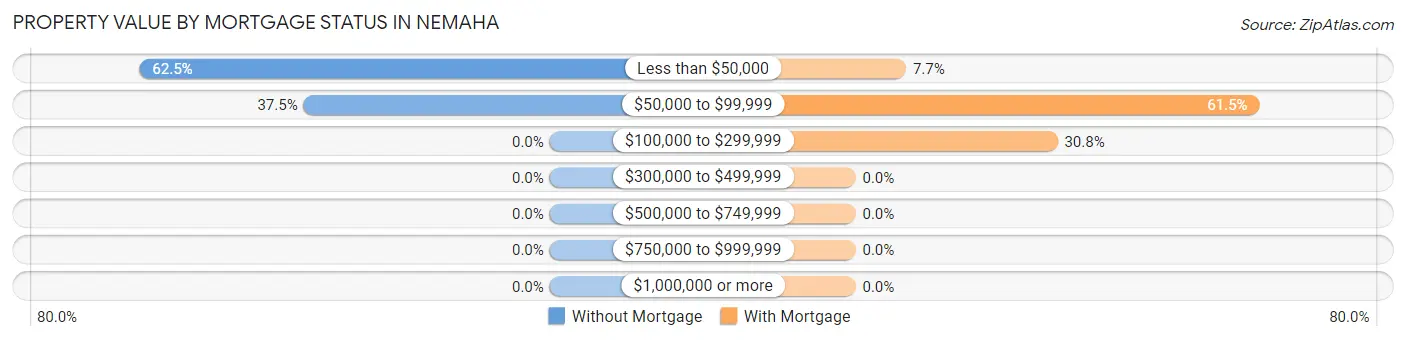
| Property Value | Without Mortgage | With Mortgage |
| Less than $50,000 | 10 (62.5%) | 1 (7.7%) |
| $50,000 to $99,999 | 6 (37.5%) | 8 (61.5%) |
| $100,000 to $299,999 | 0 (0.0%) | 4 (30.8%) |
| $300,000 to $499,999 | 0 (0.0%) | 0 (0.0%) |
| $500,000 to $749,999 | 0 (0.0%) | 0 (0.0%) |
| $750,000 to $999,999 | 0 (0.0%) | 0 (0.0%) |
| $1,000,000 or more | 0 (0.0%) | 0 (0.0%) |
| Total | 16 (100.0%) | 13 (100.0%) |
Household Income by Mortgage Status in Nemaha
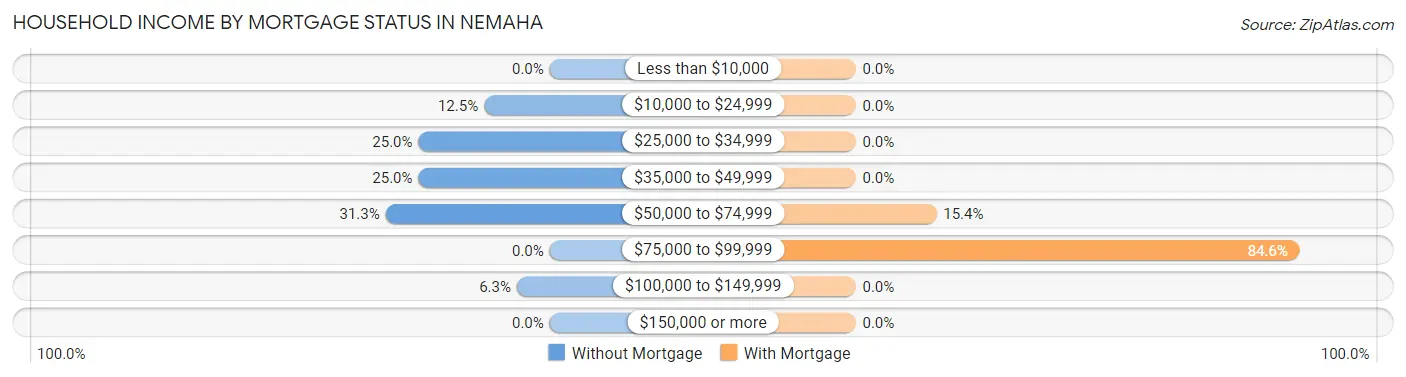
| Household Income | Without Mortgage | With Mortgage |
| Less than $10,000 | 0 (0.0%) | 0 (0.0%) |
| $10,000 to $24,999 | 2 (12.5%) | 0 (0.0%) |
| $25,000 to $34,999 | 4 (25.0%) | 0 (0.0%) |
| $35,000 to $49,999 | 4 (25.0%) | 0 (0.0%) |
| $50,000 to $74,999 | 5 (31.2%) | 2 (15.4%) |
| $75,000 to $99,999 | 0 (0.0%) | 11 (84.6%) |
| $100,000 to $149,999 | 1 (6.2%) | 0 (0.0%) |
| $150,000 or more | 0 (0.0%) | 0 (0.0%) |
| Total | 16 (100.0%) | 13 (100.0%) |
Property Value to Household Income Ratio in Nemaha
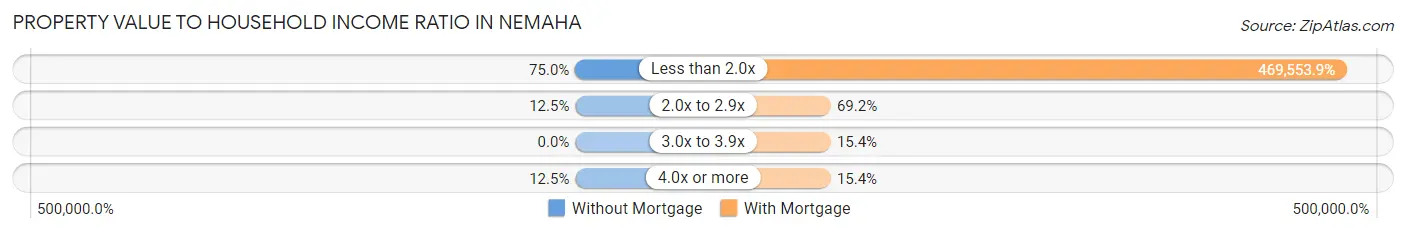
| Value-to-Income Ratio | Without Mortgage | With Mortgage |
| Less than 2.0x | 12 (75.0%) | 61,042 (469,553.8%) |
| 2.0x to 2.9x | 2 (12.5%) | 9 (69.2%) |
| 3.0x to 3.9x | 0 (0.0%) | 2 (15.4%) |
| 4.0x or more | 2 (12.5%) | 2 (15.4%) |
| Total | 16 (100.0%) | 13 (100.0%) |
Real Estate Taxes by Mortgage Status in Nemaha
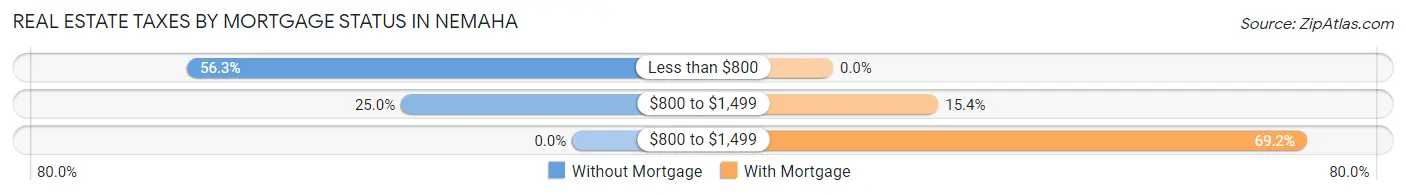
| Property Taxes | Without Mortgage | With Mortgage |
| Less than $800 | 9 (56.2%) | 0 (0.0%) |
| $800 to $1,499 | 4 (25.0%) | 2 (15.4%) |
| $800 to $1,499 | 0 (0.0%) | 9 (69.2%) |
| Total | 16 (100.0%) | 13 (100.0%) |
Health & Disability in Nemaha
Health Insurance Coverage by Age in Nemaha
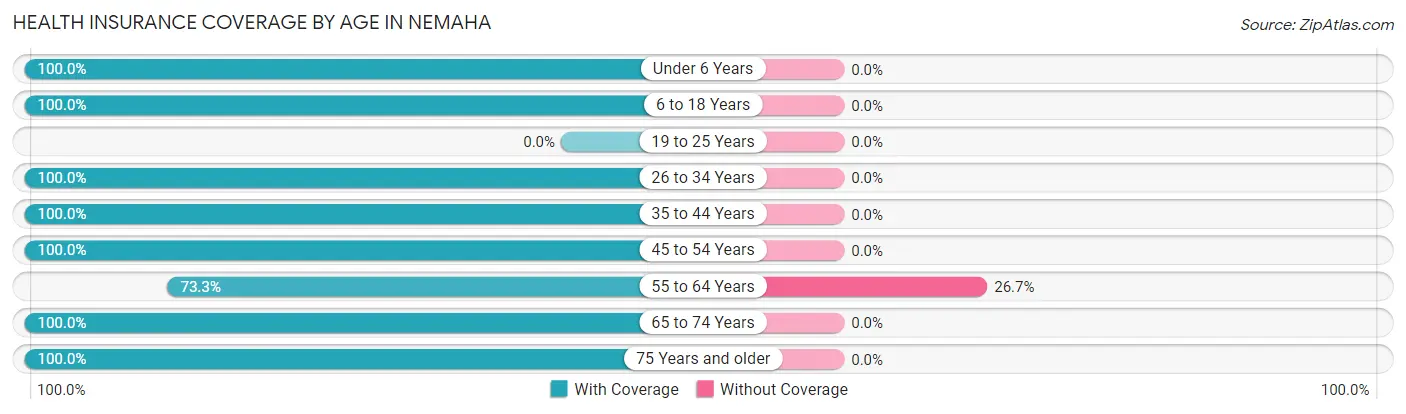
| Age Bracket | With Coverage | Without Coverage |
| Under 6 Years | 8 (100.0%) | 0 (0.0%) |
| 6 to 18 Years | 33 (100.0%) | 0 (0.0%) |
| 19 to 25 Years | 0 (0.0%) | 0 (0.0%) |
| 26 to 34 Years | 16 (100.0%) | 0 (0.0%) |
| 35 to 44 Years | 7 (100.0%) | 0 (0.0%) |
| 45 to 54 Years | 10 (100.0%) | 0 (0.0%) |
| 55 to 64 Years | 11 (73.3%) | 4 (26.7%) |
| 65 to 74 Years | 10 (100.0%) | 0 (0.0%) |
| 75 Years and older | 2 (100.0%) | 0 (0.0%) |
| Total | 97 (96.0%) | 4 (4.0%) |
Health Insurance Coverage by Citizenship Status in Nemaha
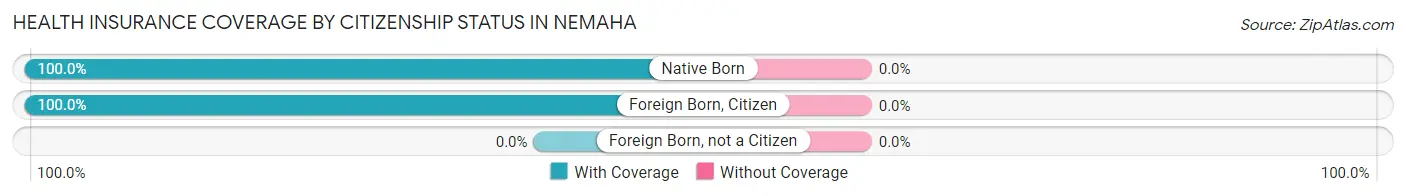
| Citizenship Status | With Coverage | Without Coverage |
| Native Born | 8 (100.0%) | 0 (0.0%) |
| Foreign Born, Citizen | 33 (100.0%) | 0 (0.0%) |
| Foreign Born, not a Citizen | 0 (0.0%) | 0 (0.0%) |
Health Insurance Coverage by Household Income in Nemaha
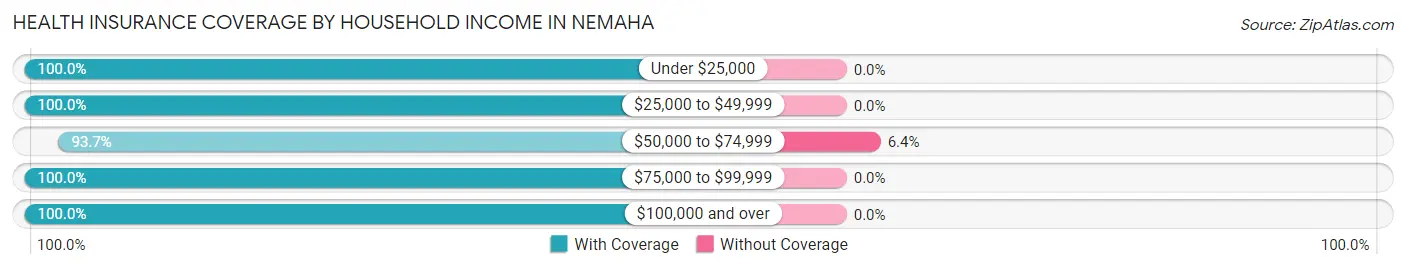
| Household Income | With Coverage | Without Coverage |
| Under $25,000 | 2 (100.0%) | 0 (0.0%) |
| $25,000 to $49,999 | 19 (100.0%) | 0 (0.0%) |
| $50,000 to $74,999 | 59 (93.6%) | 4 (6.4%) |
| $75,000 to $99,999 | 8 (100.0%) | 0 (0.0%) |
| $100,000 and over | 9 (100.0%) | 0 (0.0%) |
Public vs Private Health Insurance Coverage by Age in Nemaha
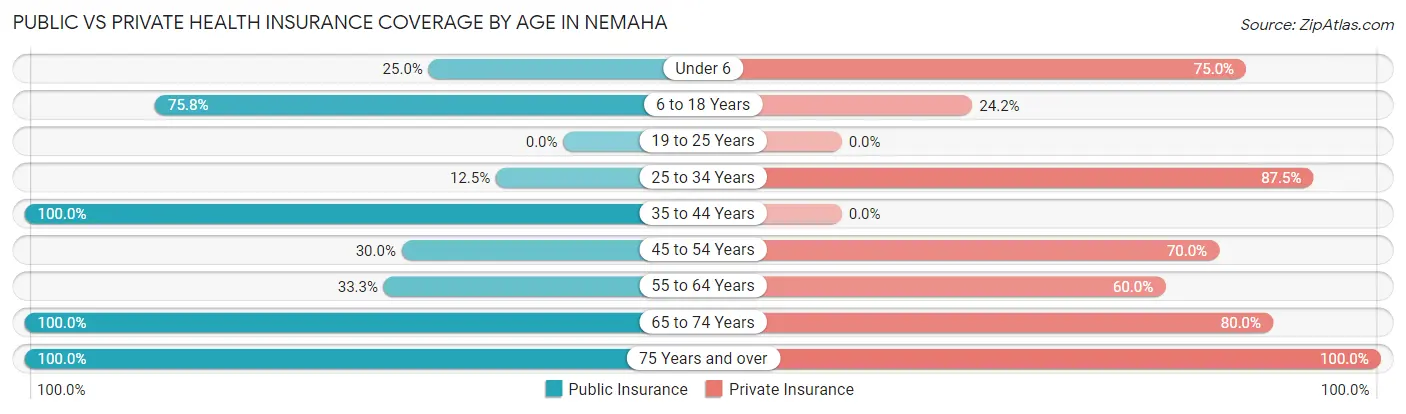
| Age Bracket | Public Insurance | Private Insurance |
| Under 6 | 2 (25.0%) | 6 (75.0%) |
| 6 to 18 Years | 25 (75.8%) | 8 (24.2%) |
| 19 to 25 Years | 0 (0.0%) | 0 (0.0%) |
| 25 to 34 Years | 2 (12.5%) | 14 (87.5%) |
| 35 to 44 Years | 7 (100.0%) | 0 (0.0%) |
| 45 to 54 Years | 3 (30.0%) | 7 (70.0%) |
| 55 to 64 Years | 5 (33.3%) | 9 (60.0%) |
| 65 to 74 Years | 10 (100.0%) | 8 (80.0%) |
| 75 Years and over | 2 (100.0%) | 2 (100.0%) |
| Total | 56 (55.4%) | 54 (53.5%) |
Disability Status by Sex by Age in Nemaha
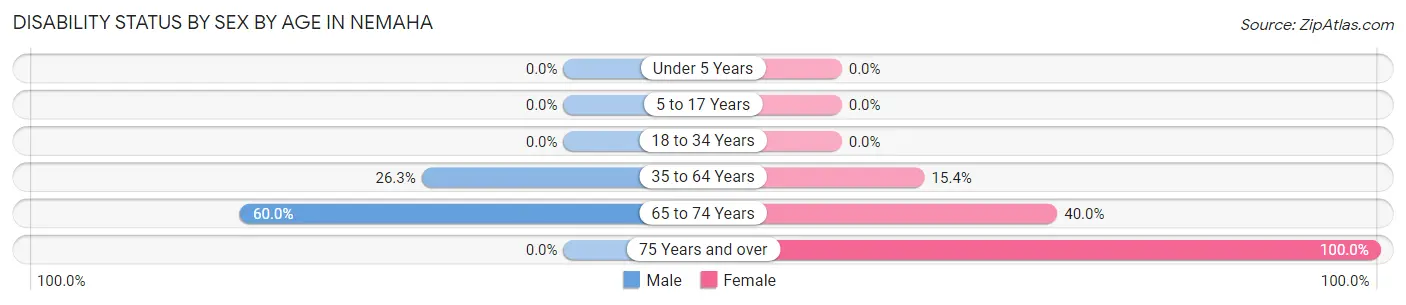
| Age Bracket | Male | Female |
| Under 5 Years | 0 (0.0%) | 0 (0.0%) |
| 5 to 17 Years | 0 (0.0%) | 0 (0.0%) |
| 18 to 34 Years | 0 (0.0%) | 0 (0.0%) |
| 35 to 64 Years | 5 (26.3%) | 2 (15.4%) |
| 65 to 74 Years | 3 (60.0%) | 2 (40.0%) |
| 75 Years and over | 0 (0.0%) | 1 (100.0%) |
Disability Class by Sex by Age in Nemaha
Disability Class: Hearing Difficulty
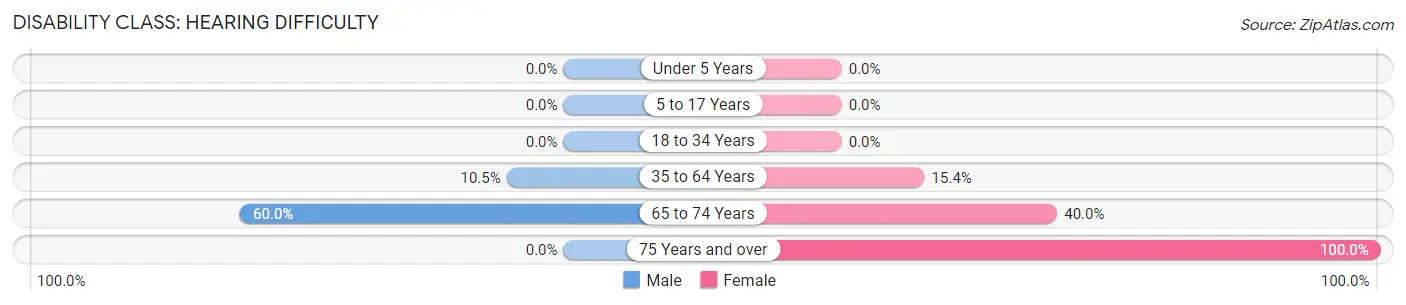
| Age Bracket | Male | Female |
| Under 5 Years | 0 (0.0%) | 0 (0.0%) |
| 5 to 17 Years | 0 (0.0%) | 0 (0.0%) |
| 18 to 34 Years | 0 (0.0%) | 0 (0.0%) |
| 35 to 64 Years | 2 (10.5%) | 2 (15.4%) |
| 65 to 74 Years | 3 (60.0%) | 2 (40.0%) |
| 75 Years and over | 0 (0.0%) | 1 (100.0%) |
Disability Class: Vision Difficulty
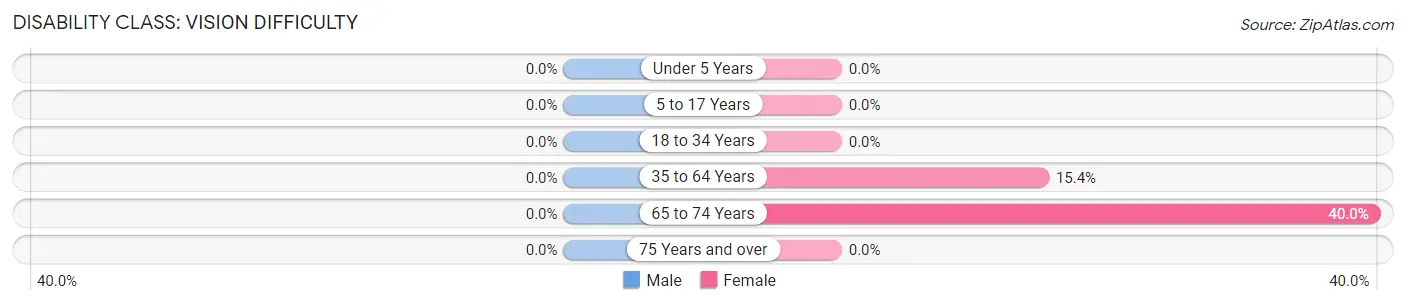
| Age Bracket | Male | Female |
| Under 5 Years | 0 (0.0%) | 0 (0.0%) |
| 5 to 17 Years | 0 (0.0%) | 0 (0.0%) |
| 18 to 34 Years | 0 (0.0%) | 0 (0.0%) |
| 35 to 64 Years | 0 (0.0%) | 2 (15.4%) |
| 65 to 74 Years | 0 (0.0%) | 2 (40.0%) |
| 75 Years and over | 0 (0.0%) | 0 (0.0%) |
Disability Class: Cognitive Difficulty
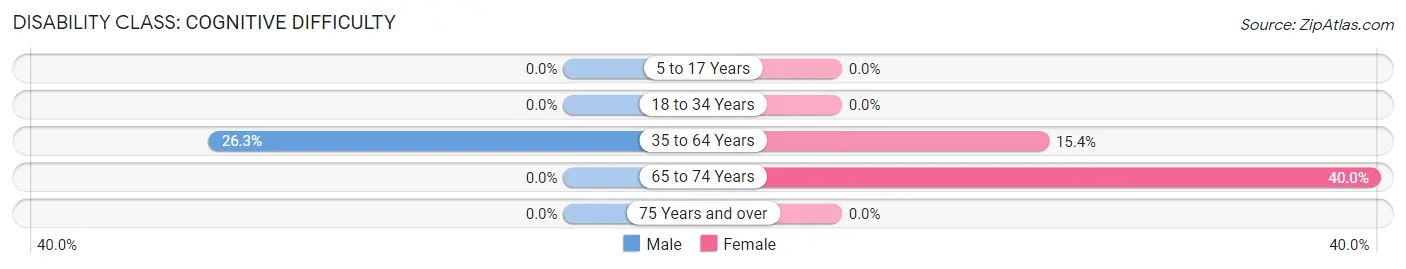
| Age Bracket | Male | Female |
| 5 to 17 Years | 0 (0.0%) | 0 (0.0%) |
| 18 to 34 Years | 0 (0.0%) | 0 (0.0%) |
| 35 to 64 Years | 5 (26.3%) | 2 (15.4%) |
| 65 to 74 Years | 0 (0.0%) | 2 (40.0%) |
| 75 Years and over | 0 (0.0%) | 0 (0.0%) |
Disability Class: Ambulatory Difficulty
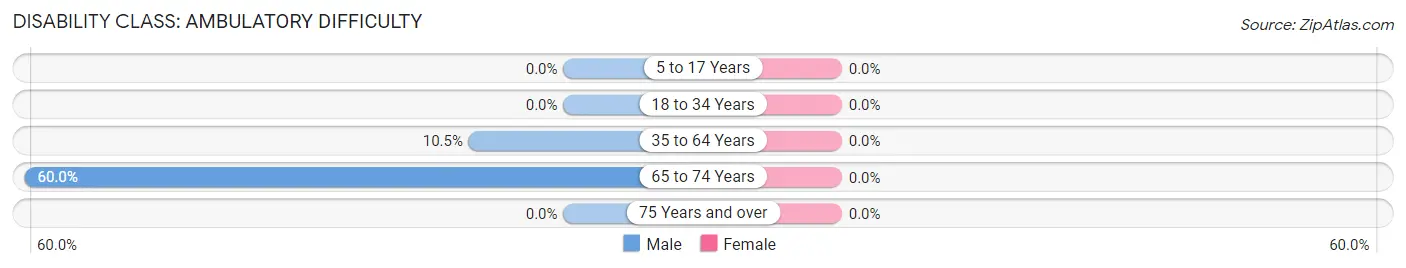
| Age Bracket | Male | Female |
| 5 to 17 Years | 0 (0.0%) | 0 (0.0%) |
| 18 to 34 Years | 0 (0.0%) | 0 (0.0%) |
| 35 to 64 Years | 2 (10.5%) | 0 (0.0%) |
| 65 to 74 Years | 3 (60.0%) | 0 (0.0%) |
| 75 Years and over | 0 (0.0%) | 0 (0.0%) |
Disability Class: Self-Care Difficulty
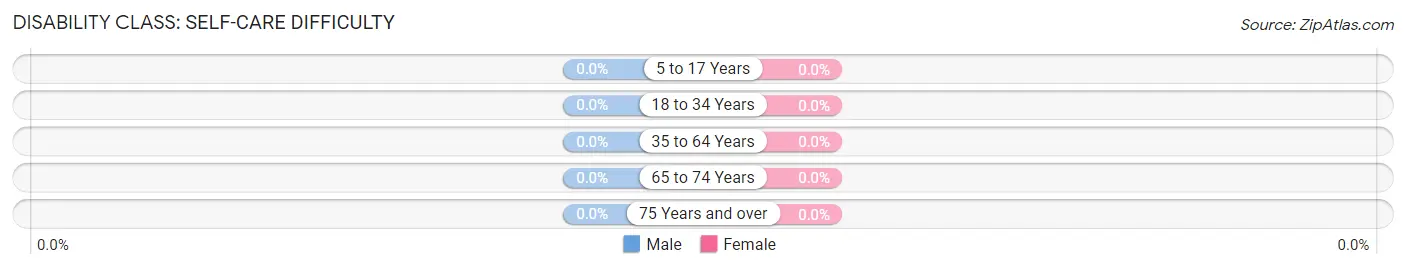
| Age Bracket | Male | Female |
| 5 to 17 Years | 0 (0.0%) | 0 (0.0%) |
| 18 to 34 Years | 0 (0.0%) | 0 (0.0%) |
| 35 to 64 Years | 0 (0.0%) | 0 (0.0%) |
| 65 to 74 Years | 0 (0.0%) | 0 (0.0%) |
| 75 Years and over | 0 (0.0%) | 0 (0.0%) |
Technology Access in Nemaha
Computing Device Access in Nemaha
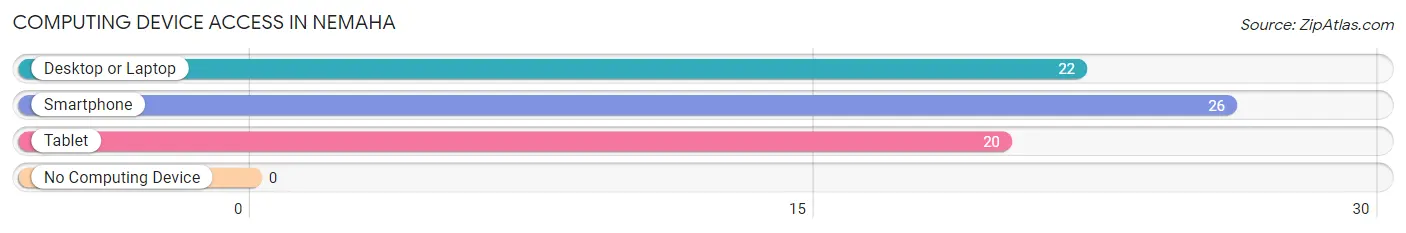
| Device Type | # Households | % Households |
| Desktop or Laptop | 22 | 62.9% |
| Smartphone | 26 | 74.3% |
| Tablet | 20 | 57.1% |
| No Computing Device | 0 | 0.0% |
| Total | 35 | 100.0% |
Internet Access in Nemaha
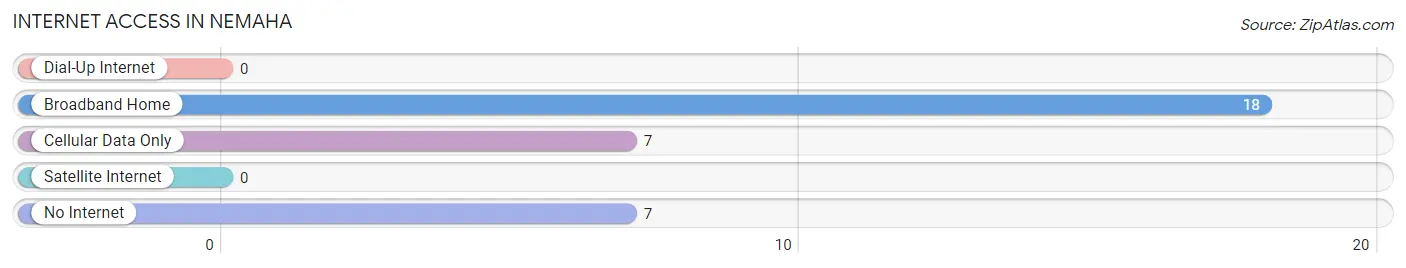
| Internet Type | # Households | % Households |
| Dial-Up Internet | 0 | 0.0% |
| Broadband Home | 18 | 51.4% |
| Cellular Data Only | 7 | 20.0% |
| Satellite Internet | 0 | 0.0% |
| No Internet | 7 | 20.0% |
| Total | 35 | 100.0% |
Nemaha Summary
Nemaha is a small town located in the state of Iowa, in the United States. It is situated in the southeastern corner of the state, in the county of Appanoose. The town has a population of just over 500 people, and is located on the banks of the Des Moines River.
History
Nemaha was founded in 1854 by a group of settlers from the nearby town of Eddyville. The town was named after the Nemaha River, which runs through the area. The town was originally a trading post, and the first post office was established in 1856.
In the late 19th century, Nemaha was a thriving agricultural community, with a population of over 1,000 people. The town was home to several businesses, including a general store, a blacksmith, a hotel, and a bank.
In the early 20th century, Nemaha experienced a period of decline, as many of its residents moved away in search of better economic opportunities. The population of the town dropped to just over 500 people by the year 2000.
Geography
Nemaha is located in the southeastern corner of Iowa, in Appanoose County. The town is situated on the banks of the Des Moines River, and is surrounded by rolling hills and farmland. The town is located approximately 30 miles from the state capital of Des Moines.
The climate in Nemaha is typical of the Midwest, with hot summers and cold winters. The average temperature in the summer is around 75 degrees Fahrenheit, and the average temperature in the winter is around 25 degrees Fahrenheit.
Economy
The economy of Nemaha is largely based on agriculture. The town is home to several farms, which produce a variety of crops, including corn, soybeans, and wheat. The town also has a small manufacturing sector, which produces a variety of products, including furniture and clothing.
The town also has a small tourism industry, with several bed and breakfasts and restaurants located in the area.
Demographics
As of the year 2000, the population of Nemaha was just over 500 people. The town is predominantly white, with a small minority population. The median household income in the town is around $35,000, and the median home value is around $90,000.
The town has a low crime rate, and is considered to be a safe place to live. The town is served by a volunteer fire department, and has a small police force.
Conclusion
Nemaha is a small town located in the southeastern corner of Iowa. The town has a population of just over 500 people, and is largely based on agriculture. The town has a low crime rate, and is considered to be a safe place to live. The town is served by a volunteer fire department, and has a small police force. The town also has a small tourism industry, with several bed and breakfasts and restaurants located in the area.
Common Questions
What is Per Capita Income in Nemaha?
Per Capita income in Nemaha is $19,150.
What is the Median Family Income in Nemaha?
Median Family Income in Nemaha is $60,417.
What is the Median Household income in Nemaha?
Median Household Income in Nemaha is $60,417.
What is Income or Wage Gap in Nemaha?
Income or Wage Gap in Nemaha is 46.9%.
Women in Nemaha earn 53.1 cents for every dollar earned by a man.
What is Inequality or Gini Index in Nemaha?
Inequality or Gini Index in Nemaha is 0.18.
What is the Total Population of Nemaha?
Total Population of Nemaha is 101.
What is the Total Male Population of Nemaha?
Total Male Population of Nemaha is 52.
What is the Total Female Population of Nemaha?
Total Female Population of Nemaha is 49.
What is the Ratio of Males per 100 Females in Nemaha?
There are 106.12 Males per 100 Females in Nemaha.
What is the Ratio of Females per 100 Males in Nemaha?
There are 94.23 Females per 100 Males in Nemaha.
What is the Median Population Age in Nemaha?
Median Population Age in Nemaha is 29.4 Years.
What is the Average Family Size in Nemaha
Average Family Size in Nemaha is 3.3 People.
What is the Average Household Size in Nemaha
Average Household Size in Nemaha is 2.9 People.
How Large is the Labor Force in Nemaha?
There are 37 People in the Labor Forcein in Nemaha.
What is the Percentage of People in the Labor Force in Nemaha?
61.7% of People are in the Labor Force in Nemaha.
What is the Unemployment Rate in Nemaha?
Unemployment Rate in Nemaha is 5.4%.