Wall Lake, IA Map & Demographics
Wall Lake Map
Wall Lake Overview
$35,514
PER CAPITA INCOME
$83,750
AVG FAMILY INCOME
$63,125
AVG HOUSEHOLD INCOME
36.4%
WAGE / INCOME GAP [ % ]
63.6¢/ $1
WAGE / INCOME GAP [ $ ]
$6,207
FAMILY INCOME DEFICIT
0.45
INEQUALITY / GINI INDEX
691
TOTAL POPULATION
357
MALE POPULATION
334
FEMALE POPULATION
106.89
MALES / 100 FEMALES
93.56
FEMALES / 100 MALES
51.9
MEDIAN AGE
2.6
AVG FAMILY SIZE
2.1
AVG HOUSEHOLD SIZE
307
LABOR FORCE [ PEOPLE ]
54.9%
PERCENT IN LABOR FORCE
4.2%
UNEMPLOYMENT RATE
Wall Lake Zip Codes
Wall Lake Area Codes
Income in Wall Lake
Income Overview in Wall Lake
Per Capita Income in Wall Lake is $35,514, while median incomes of families and households are $83,750 and $63,125 respectively.
| Characteristic | Number | Measure |
| Per Capita Income | 691 | $35,514 |
| Median Family Income | 200 | $83,750 |
| Mean Family Income | 200 | $83,890 |
| Median Household Income | 303 | $63,125 |
| Mean Household Income | 303 | $83,678 |
| Income Deficit | 200 | $6,207 |
| Wage / Income Gap (%) | 691 | 36.36% |
| Wage / Income Gap ($) | 691 | 63.64¢ per $1 |
| Gini / Inequality Index | 691 | 0.45 |
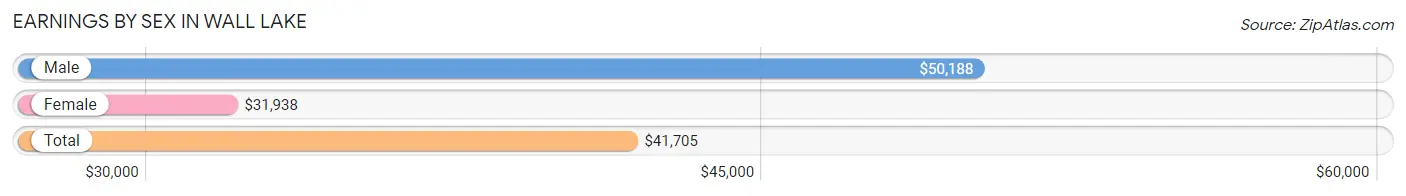
Earnings by Sex in Wall Lake
Average Earnings in Wall Lake are $41,705, $50,188 for men and $31,938 for women, a difference of 36.4%.
| Sex | Number | Average Earnings |
| Male | 177 (55.0%) | $50,188 |
| Female | 145 (45.0%) | $31,938 |
| Total | 322 (100.0%) | $41,705 |
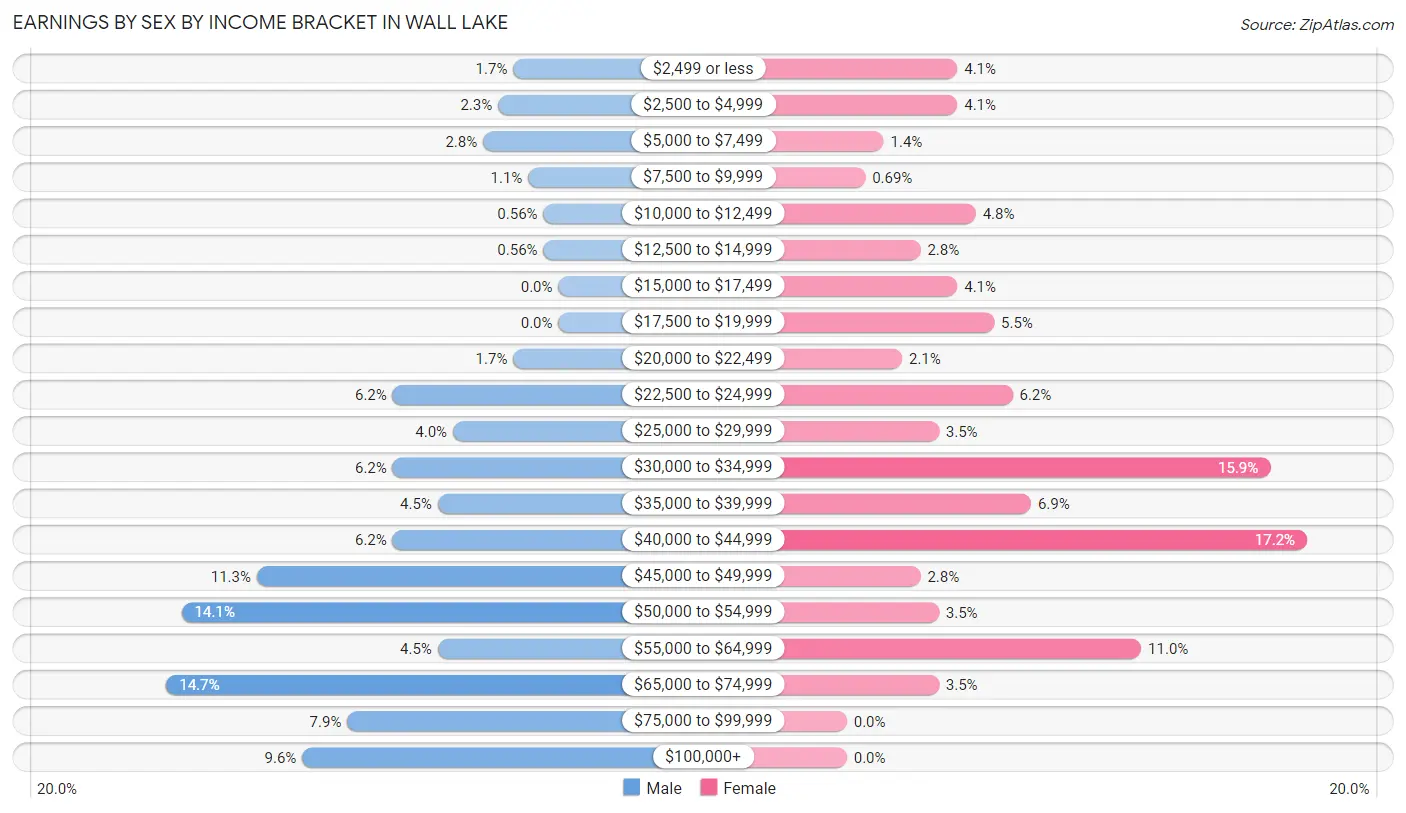
Earnings by Sex by Income Bracket in Wall Lake
The most common earnings brackets in Wall Lake are $65,000 to $74,999 for men (26 | 14.7%) and $40,000 to $44,999 for women (25 | 17.2%).
| Income | Male | Female |
| $2,499 or less | 3 (1.7%) | 6 (4.1%) |
| $2,500 to $4,999 | 4 (2.3%) | 6 (4.1%) |
| $5,000 to $7,499 | 5 (2.8%) | 2 (1.4%) |
| $7,500 to $9,999 | 2 (1.1%) | 1 (0.7%) |
| $10,000 to $12,499 | 1 (0.6%) | 7 (4.8%) |
| $12,500 to $14,999 | 1 (0.6%) | 4 (2.8%) |
| $15,000 to $17,499 | 0 (0.0%) | 6 (4.1%) |
| $17,500 to $19,999 | 0 (0.0%) | 8 (5.5%) |
| $20,000 to $22,499 | 3 (1.7%) | 3 (2.1%) |
| $22,500 to $24,999 | 11 (6.2%) | 9 (6.2%) |
| $25,000 to $29,999 | 7 (4.0%) | 5 (3.5%) |
| $30,000 to $34,999 | 11 (6.2%) | 23 (15.9%) |
| $35,000 to $39,999 | 8 (4.5%) | 10 (6.9%) |
| $40,000 to $44,999 | 11 (6.2%) | 25 (17.2%) |
| $45,000 to $49,999 | 20 (11.3%) | 4 (2.8%) |
| $50,000 to $54,999 | 25 (14.1%) | 5 (3.5%) |
| $55,000 to $64,999 | 8 (4.5%) | 16 (11.0%) |
| $65,000 to $74,999 | 26 (14.7%) | 5 (3.5%) |
| $75,000 to $99,999 | 14 (7.9%) | 0 (0.0%) |
| $100,000+ | 17 (9.6%) | 0 (0.0%) |
| Total | 177 (100.0%) | 145 (100.0%) |
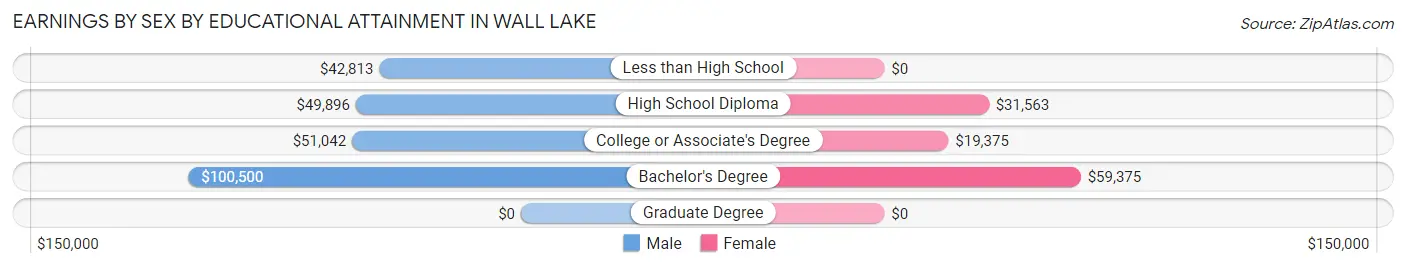
Earnings by Sex by Educational Attainment in Wall Lake
Average earnings in Wall Lake are $51,354 for men and $32,063 for women, a difference of 37.6%. Men with an educational attainment of bachelor's degree enjoy the highest average annual earnings of $100,500, while those with less than high school education earn the least with $42,813. Women with an educational attainment of bachelor's degree earn the most with the average annual earnings of $59,375, while those with college or associate's degree education have the smallest earnings of $19,375.
| Educational Attainment | Male Income | Female Income |
| Less than High School | $42,813 | $0 |
| High School Diploma | $49,896 | $31,563 |
| College or Associate's Degree | $51,042 | $19,375 |
| Bachelor's Degree | $100,500 | $59,375 |
| Graduate Degree | - | - |
| Total | $51,354 | $32,063 |
Family Income in Wall Lake
Family Income Brackets in Wall Lake
According to the Wall Lake family income data, there are 48 families falling into the $100,000 to $149,999 income range, which is the most common income bracket and makes up 24.0% of all families. Conversely, the less than $10,000 income bracket is the least frequent group with only 2 families (1.0%) belonging to this category.
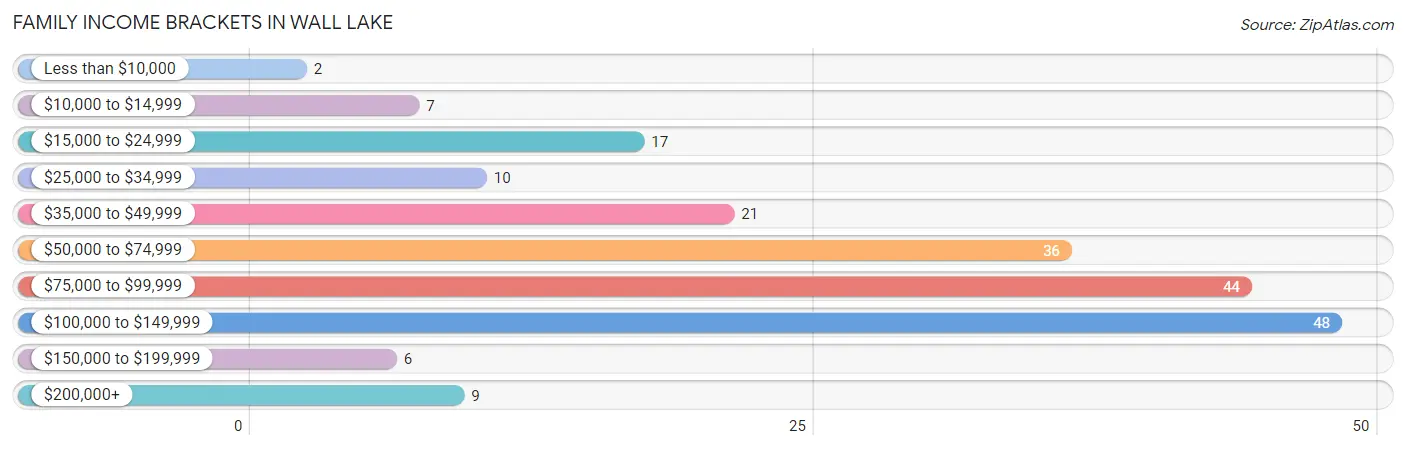
| Income Bracket | # Families | % Families |
| Less than $10,000 | 2 | 1.0% |
| $10,000 to $14,999 | 7 | 3.5% |
| $15,000 to $24,999 | 17 | 8.5% |
| $25,000 to $34,999 | 10 | 5.0% |
| $35,000 to $49,999 | 21 | 10.5% |
| $50,000 to $74,999 | 36 | 18.0% |
| $75,000 to $99,999 | 44 | 22.0% |
| $100,000 to $149,999 | 48 | 24.0% |
| $150,000 to $199,999 | 6 | 3.0% |
| $200,000+ | 9 | 4.5% |
Family Income by Famaliy Size in Wall Lake
5-person families (21 | 10.5%) account for the highest median family income in Wall Lake with $104,688 per family, while 2-person families (123 | 61.5%) have the highest median income of $40,625 per family member.
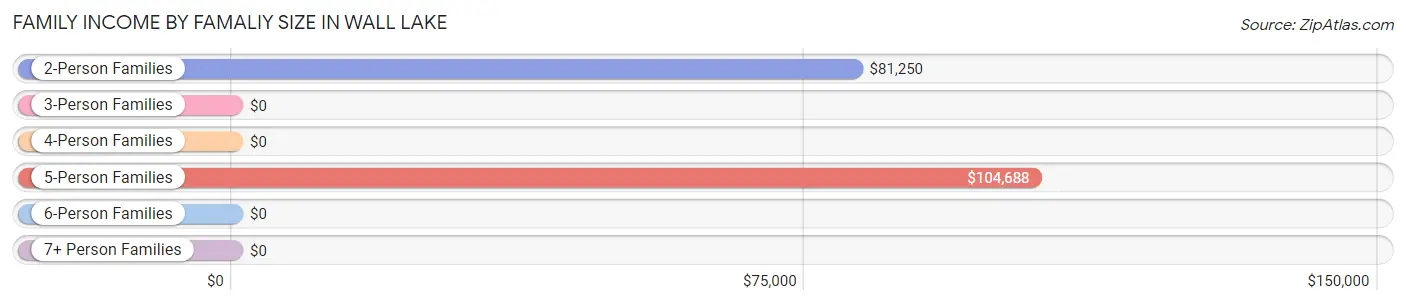
| Income Bracket | # Families | Median Income |
| 2-Person Families | 123 (61.5%) | $81,250 |
| 3-Person Families | 31 (15.5%) | $0 |
| 4-Person Families | 22 (11.0%) | $0 |
| 5-Person Families | 21 (10.5%) | $104,688 |
| 6-Person Families | 3 (1.5%) | $0 |
| 7+ Person Families | 0 (0.0%) | $0 |
| Total | 200 (100.0%) | $83,750 |
Family Income by Number of Earners in Wall Lake
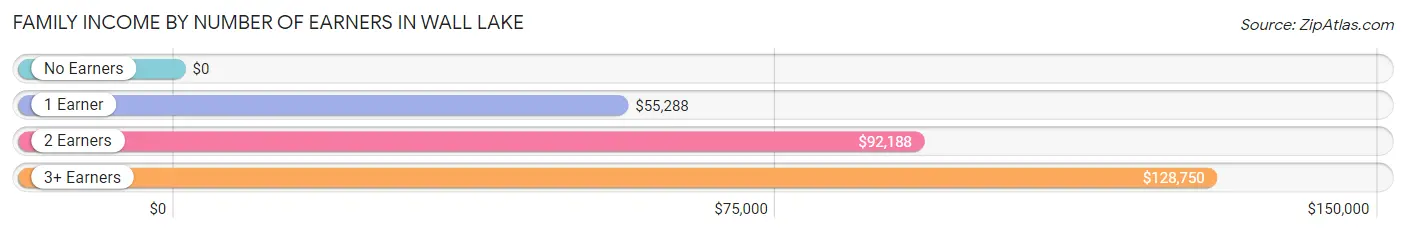
| Number of Earners | # Families | Median Income |
| No Earners | 47 (23.5%) | $0 |
| 1 Earner | 81 (40.5%) | $55,288 |
| 2 Earners | 57 (28.5%) | $92,188 |
| 3+ Earners | 15 (7.5%) | $128,750 |
| Total | 200 (100.0%) | $83,750 |
Household Income in Wall Lake
Household Income Brackets in Wall Lake
With 63 households falling in the category, the $100,000 to $149,999 income range is the most frequent in Wall Lake, accounting for 20.8% of all households. In contrast, only 5 households (1.7%) fall into the less than $10,000 income bracket, making it the least populous group.
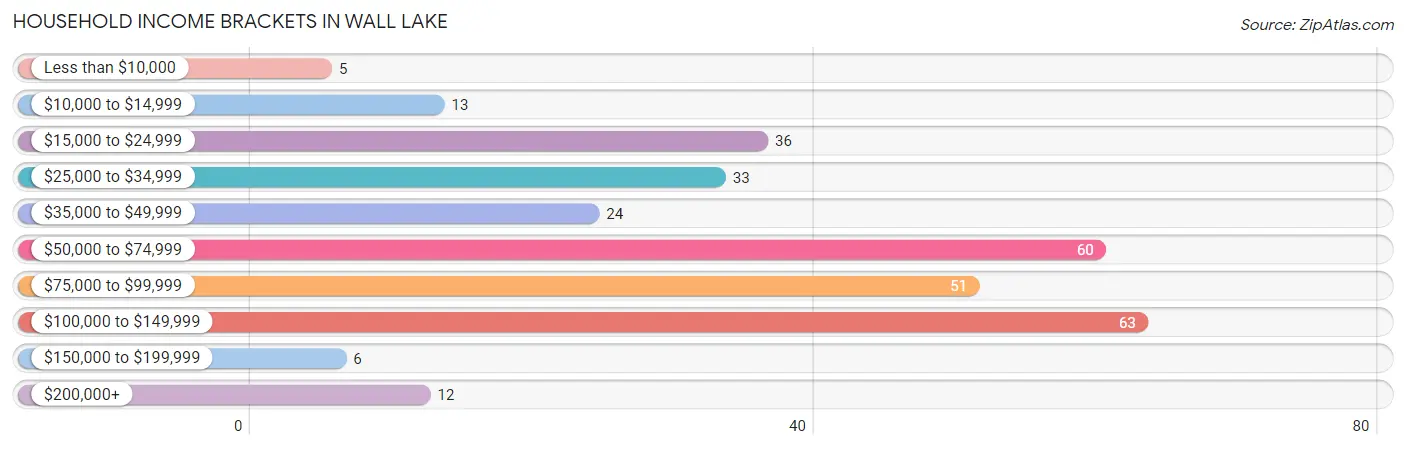
| Income Bracket | # Households | % Households |
| Less than $10,000 | 5 | 1.7% |
| $10,000 to $14,999 | 13 | 4.3% |
| $15,000 to $24,999 | 36 | 11.9% |
| $25,000 to $34,999 | 33 | 10.9% |
| $35,000 to $49,999 | 24 | 7.9% |
| $50,000 to $74,999 | 60 | 19.8% |
| $75,000 to $99,999 | 51 | 16.8% |
| $100,000 to $149,999 | 63 | 20.8% |
| $150,000 to $199,999 | 6 | 2.0% |
| $200,000+ | 12 | 4.0% |
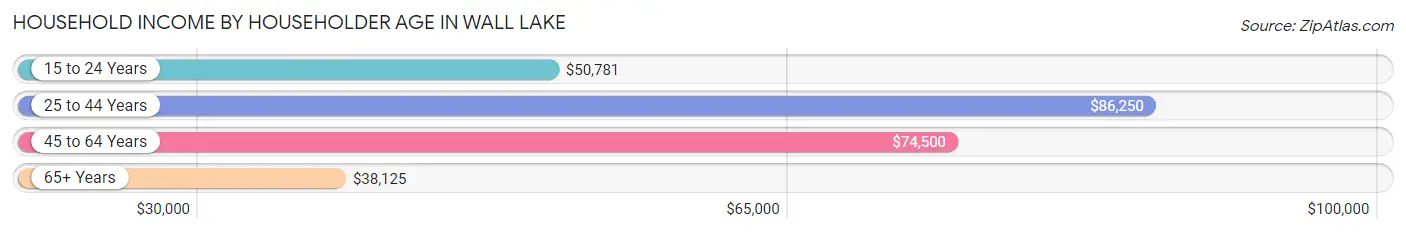
Household Income by Householder Age in Wall Lake
The median household income in Wall Lake is $63,125, with the highest median household income of $86,250 found in the 25 to 44 years age bracket for the primary householder. A total of 60 households (19.8%) fall into this category. Meanwhile, the 65+ years age bracket for the primary householder has the lowest median household income of $38,125, with 114 households (37.6%) in this group.
| Income Bracket | # Households | Median Income |
| 15 to 24 Years | 27 (8.9%) | $50,781 |
| 25 to 44 Years | 60 (19.8%) | $86,250 |
| 45 to 64 Years | 102 (33.7%) | $74,500 |
| 65+ Years | 114 (37.6%) | $38,125 |
| Total | 303 (100.0%) | $63,125 |
Poverty in Wall Lake
Income Below Poverty by Sex and Age in Wall Lake
With 6.7% poverty level for males and 9.6% for females among the residents of Wall Lake, 16 and 17 year old males and 15 year old females are the most vulnerable to poverty, with 4 males (44.4%) and 1 females (100.0%) in their respective age groups living below the poverty level.
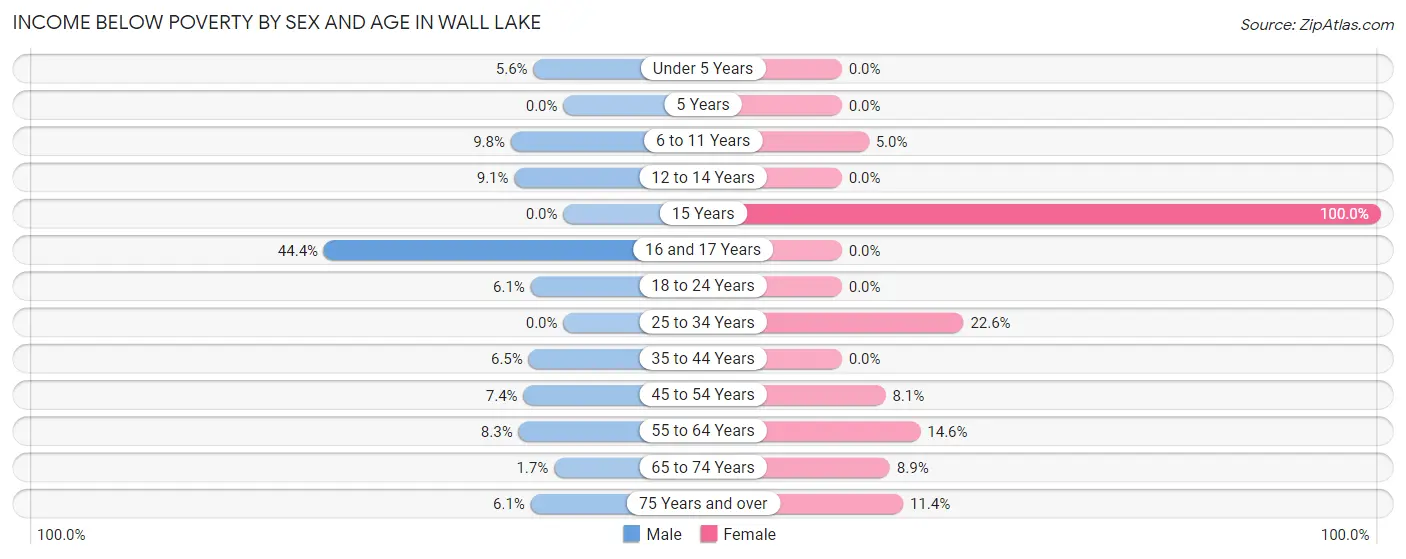
| Age Bracket | Male | Female |
| Under 5 Years | 1 (5.6%) | 0 (0.0%) |
| 5 Years | 0 (0.0%) | 0 (0.0%) |
| 6 to 11 Years | 4 (9.8%) | 1 (5.0%) |
| 12 to 14 Years | 1 (9.1%) | 0 (0.0%) |
| 15 Years | 0 (0.0%) | 1 (100.0%) |
| 16 and 17 Years | 4 (44.4%) | 0 (0.0%) |
| 18 to 24 Years | 2 (6.1%) | 0 (0.0%) |
| 25 to 34 Years | 0 (0.0%) | 7 (22.6%) |
| 35 to 44 Years | 2 (6.5%) | 0 (0.0%) |
| 45 to 54 Years | 2 (7.4%) | 3 (8.1%) |
| 55 to 64 Years | 4 (8.3%) | 7 (14.6%) |
| 65 to 74 Years | 1 (1.7%) | 5 (8.9%) |
| 75 Years and over | 2 (6.1%) | 5 (11.4%) |
| Total | 23 (6.7%) | 29 (9.6%) |
Income Above Poverty by Sex and Age in Wall Lake
According to the poverty statistics in Wall Lake, males aged 5 years and females aged under 5 years are the age groups that are most secure financially, with 100.0% of males and 100.0% of females in these age groups living above the poverty line.
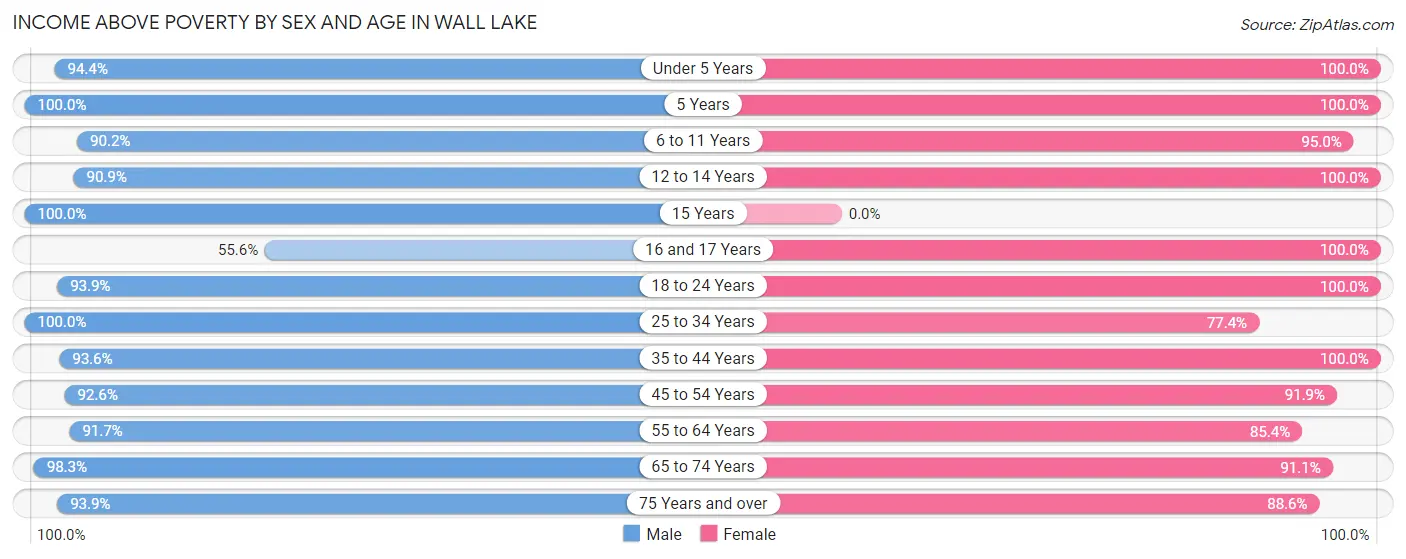
| Age Bracket | Male | Female |
| Under 5 Years | 17 (94.4%) | 14 (100.0%) |
| 5 Years | 5 (100.0%) | 2 (100.0%) |
| 6 to 11 Years | 37 (90.2%) | 19 (95.0%) |
| 12 to 14 Years | 10 (90.9%) | 19 (100.0%) |
| 15 Years | 1 (100.0%) | 0 (0.0%) |
| 16 and 17 Years | 5 (55.6%) | 4 (100.0%) |
| 18 to 24 Years | 31 (93.9%) | 12 (100.0%) |
| 25 to 34 Years | 31 (100.0%) | 24 (77.4%) |
| 35 to 44 Years | 29 (93.5%) | 15 (100.0%) |
| 45 to 54 Years | 25 (92.6%) | 34 (91.9%) |
| 55 to 64 Years | 44 (91.7%) | 41 (85.4%) |
| 65 to 74 Years | 57 (98.3%) | 51 (91.1%) |
| 75 Years and over | 31 (93.9%) | 39 (88.6%) |
| Total | 323 (93.3%) | 274 (90.4%) |
Income Below Poverty Among Married-Couple Families in Wall Lake
The poverty statistics for married-couple families in Wall Lake show that 6.5% or 10 of the total 153 families live below the poverty line. Families with 1 or 2 children have the highest poverty rate of 10.0%, comprising of 2 families. On the other hand, families with 3 or 4 children have the lowest poverty rate of 0.0%, which includes 0 families.
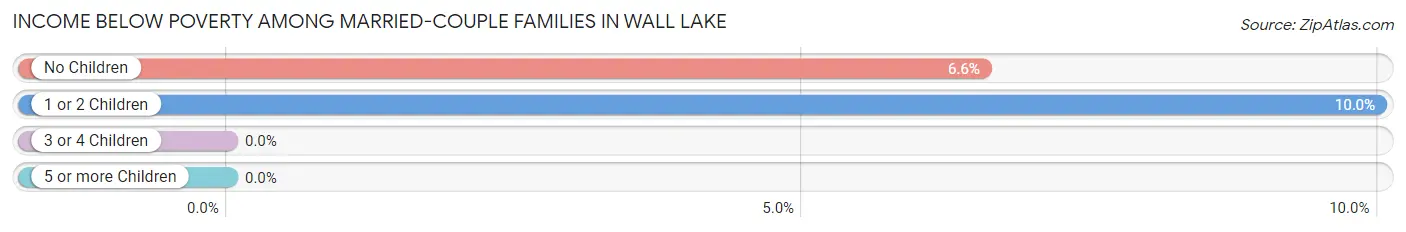
| Children | Above Poverty | Below Poverty |
| No Children | 114 (93.4%) | 8 (6.6%) |
| 1 or 2 Children | 18 (90.0%) | 2 (10.0%) |
| 3 or 4 Children | 11 (100.0%) | 0 (0.0%) |
| 5 or more Children | 0 (0.0%) | 0 (0.0%) |
| Total | 143 (93.5%) | 10 (6.5%) |
Income Below Poverty Among Single-Parent Households in Wall Lake
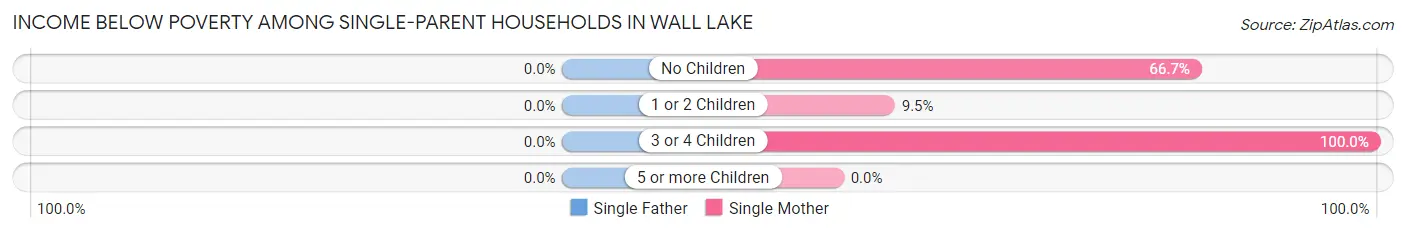
| Children | Single Father | Single Mother |
| No Children | 0 (0.0%) | 2 (66.7%) |
| 1 or 2 Children | 0 (0.0%) | 2 (9.5%) |
| 3 or 4 Children | 0 (0.0%) | 1 (100.0%) |
| 5 or more Children | 0 (0.0%) | 0 (0.0%) |
| Total | 0 (0.0%) | 5 (20.0%) |
Income Below Poverty Among Married-Couple vs Single-Parent Households in Wall Lake
The poverty data for Wall Lake shows that 10 of the married-couple family households (6.5%) and 5 of the single-parent households (10.6%) are living below the poverty level. Within the married-couple family households, those with 1 or 2 children have the highest poverty rate, with 2 households (10.0%) falling below the poverty line. Among the single-parent households, those with no children have the highest poverty rate, with 2 household (66.7%) living below poverty.
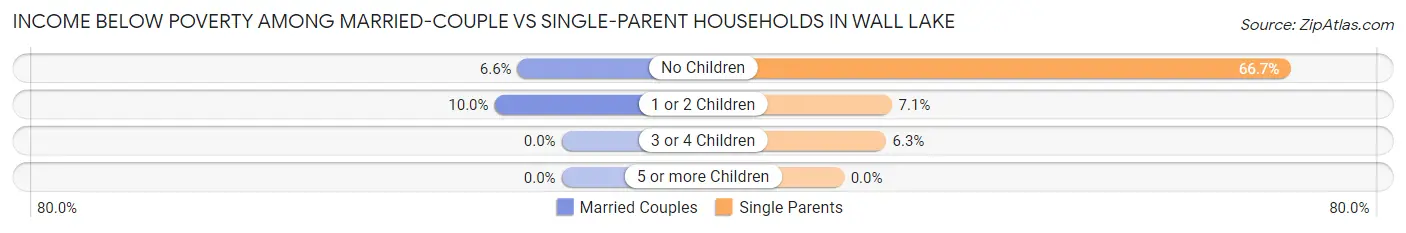
| Children | Married-Couple Families | Single-Parent Households |
| No Children | 8 (6.6%) | 2 (66.7%) |
| 1 or 2 Children | 2 (10.0%) | 2 (7.1%) |
| 3 or 4 Children | 0 (0.0%) | 1 (6.2%) |
| 5 or more Children | 0 (0.0%) | 0 (0.0%) |
| Total | 10 (6.5%) | 5 (10.6%) |
Race in Wall Lake
The most populous races in Wall Lake are White / Caucasian (668 | 96.7%), Two or more Races (12 | 1.7%), and Hispanic or Latino (11 | 1.6%).
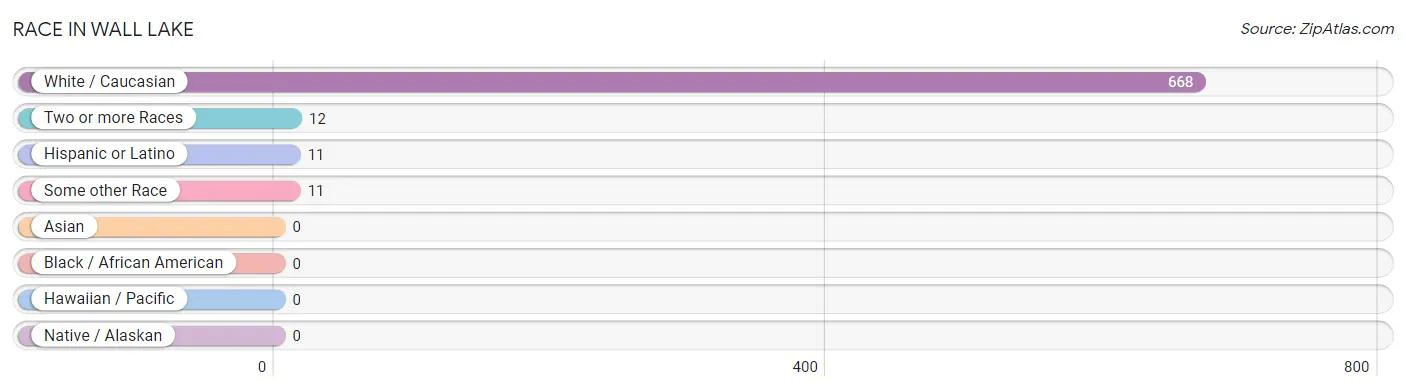
| Race | # Population | % Population |
| Asian | 0 | 0.0% |
| Black / African American | 0 | 0.0% |
| Hawaiian / Pacific | 0 | 0.0% |
| Hispanic or Latino | 11 | 1.6% |
| Native / Alaskan | 0 | 0.0% |
| White / Caucasian | 668 | 96.7% |
| Two or more Races | 12 | 1.7% |
| Some other Race | 11 | 1.6% |
| Total | 691 | 100.0% |
Ancestry in Wall Lake
The most populous ancestries reported in Wall Lake are German (291 | 42.1%), American (56 | 8.1%), Irish (55 | 8.0%), English (48 | 7.0%), and Scandinavian (21 | 3.0%), together accounting for 68.2% of all Wall Lake residents.
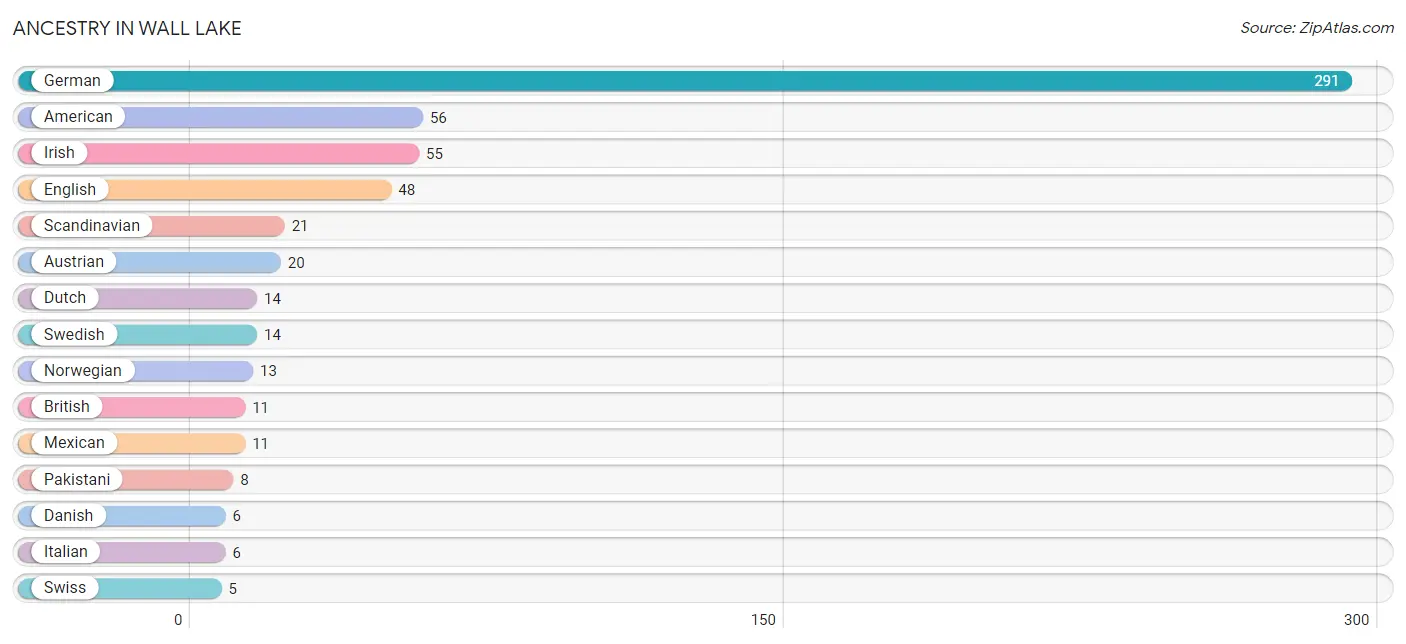
| Ancestry | # Population | % Population |
| American | 56 | 8.1% |
| Austrian | 20 | 2.9% |
| British | 11 | 1.6% |
| Cherokee | 3 | 0.4% |
| Czech | 3 | 0.4% |
| Danish | 6 | 0.9% |
| Dutch | 14 | 2.0% |
| English | 48 | 7.0% |
| French | 2 | 0.3% |
| German | 291 | 42.1% |
| Irish | 55 | 8.0% |
| Italian | 6 | 0.9% |
| Mexican | 11 | 1.6% |
| Norwegian | 13 | 1.9% |
| Pakistani | 8 | 1.2% |
| Scandinavian | 21 | 3.0% |
| Scotch-Irish | 4 | 0.6% |
| Scottish | 3 | 0.4% |
| Slavic | 3 | 0.4% |
| Swedish | 14 | 2.0% |
| Swiss | 5 | 0.7% | View All 21 Rows |
Immigrants in Wall Lake
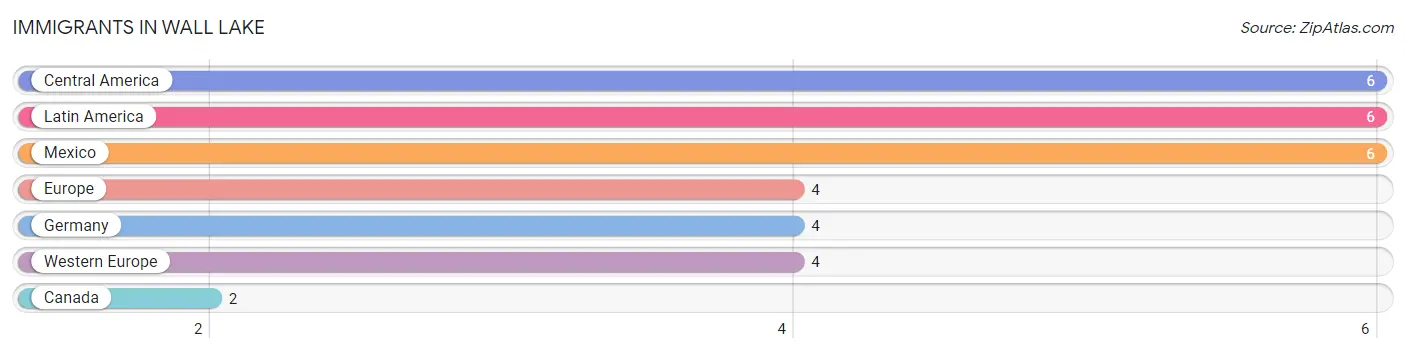
The most numerous immigrant groups reported in Wall Lake came from Central America (6 | 0.9%), Latin America (6 | 0.9%), Mexico (6 | 0.9%), Europe (4 | 0.6%), and Germany (4 | 0.6%), together accounting for 3.8% of all Wall Lake residents.
| Immigration Origin | # Population | % Population |
| Canada | 2 | 0.3% |
| Central America | 6 | 0.9% |
| Europe | 4 | 0.6% |
| Germany | 4 | 0.6% |
| Latin America | 6 | 0.9% |
| Mexico | 6 | 0.9% |
| Western Europe | 4 | 0.6% | View All 7 Rows |
Sex and Age in Wall Lake
Sex and Age in Wall Lake
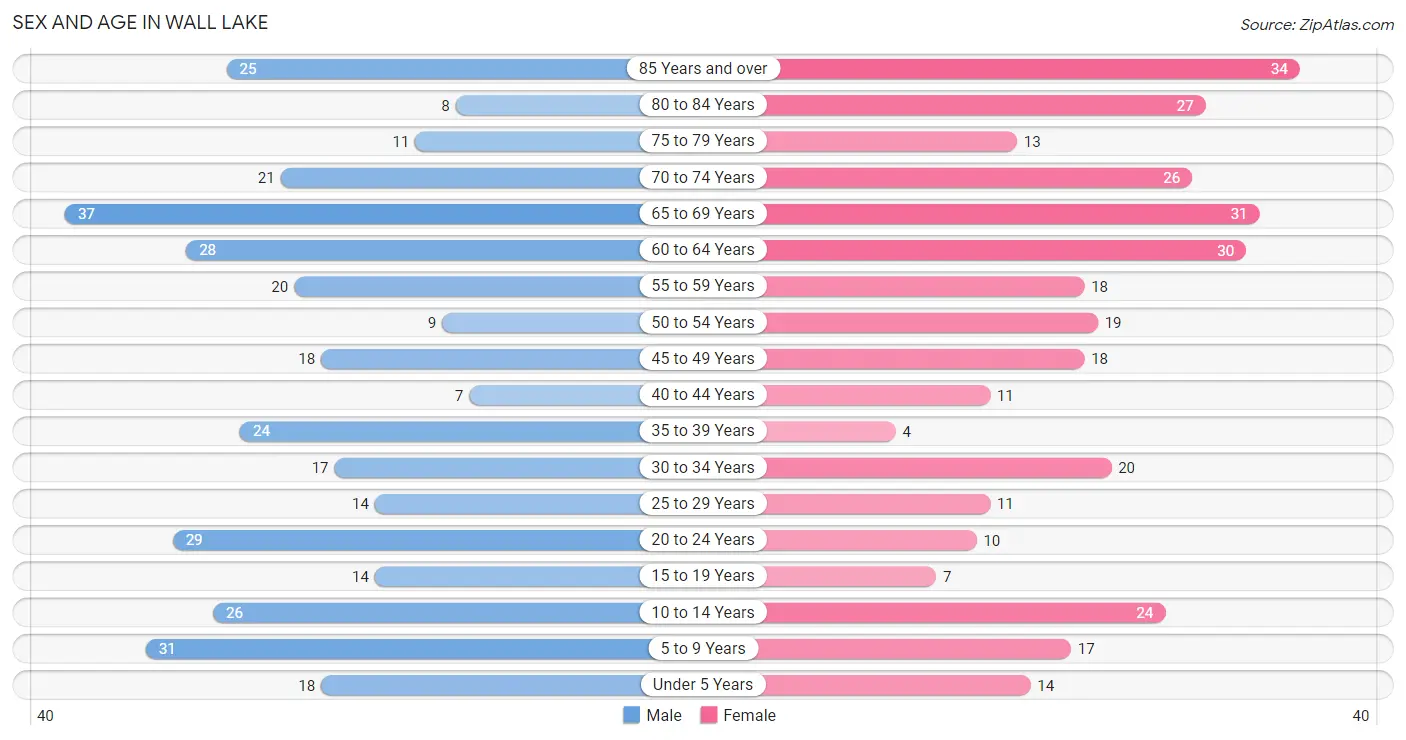
The most populous age groups in Wall Lake are 65 to 69 Years (37 | 10.4%) for men and 85 Years and over (34 | 10.2%) for women.
| Age Bracket | Male | Female |
| Under 5 Years | 18 (5.0%) | 14 (4.2%) |
| 5 to 9 Years | 31 (8.7%) | 17 (5.1%) |
| 10 to 14 Years | 26 (7.3%) | 24 (7.2%) |
| 15 to 19 Years | 14 (3.9%) | 7 (2.1%) |
| 20 to 24 Years | 29 (8.1%) | 10 (3.0%) |
| 25 to 29 Years | 14 (3.9%) | 11 (3.3%) |
| 30 to 34 Years | 17 (4.8%) | 20 (6.0%) |
| 35 to 39 Years | 24 (6.7%) | 4 (1.2%) |
| 40 to 44 Years | 7 (2.0%) | 11 (3.3%) |
| 45 to 49 Years | 18 (5.0%) | 18 (5.4%) |
| 50 to 54 Years | 9 (2.5%) | 19 (5.7%) |
| 55 to 59 Years | 20 (5.6%) | 18 (5.4%) |
| 60 to 64 Years | 28 (7.8%) | 30 (9.0%) |
| 65 to 69 Years | 37 (10.4%) | 31 (9.3%) |
| 70 to 74 Years | 21 (5.9%) | 26 (7.8%) |
| 75 to 79 Years | 11 (3.1%) | 13 (3.9%) |
| 80 to 84 Years | 8 (2.2%) | 27 (8.1%) |
| 85 Years and over | 25 (7.0%) | 34 (10.2%) |
| Total | 357 (100.0%) | 334 (100.0%) |
Families and Households in Wall Lake
Median Family Size in Wall Lake
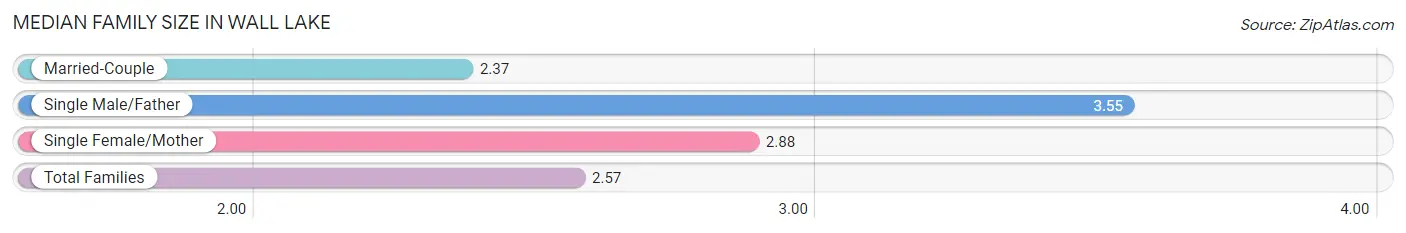
The median family size in Wall Lake is 2.57 persons per family, with single male/father families (22 | 11.0%) accounting for the largest median family size of 3.55 persons per family. On the other hand, married-couple families (153 | 76.5%) represent the smallest median family size with 2.37 persons per family.
| Family Type | # Families | Family Size |
| Married-Couple | 153 (76.5%) | 2.37 |
| Single Male/Father | 22 (11.0%) | 3.55 |
| Single Female/Mother | 25 (12.5%) | 2.88 |
| Total Families | 200 (100.0%) | 2.57 |
Median Household Size in Wall Lake
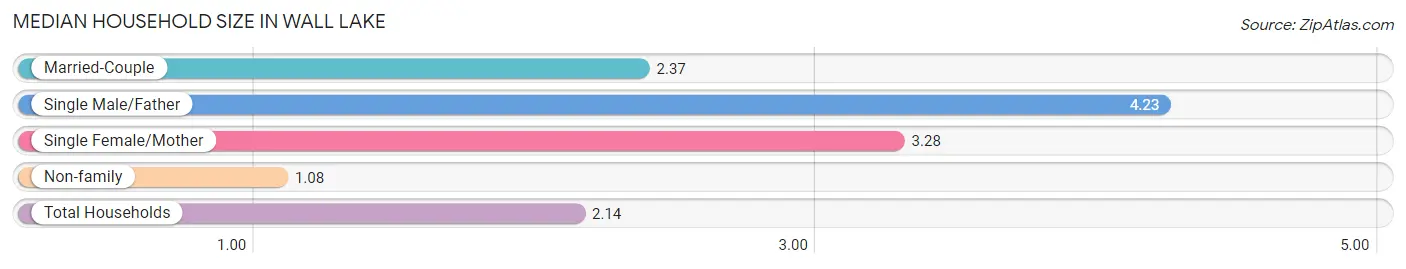
The median household size in Wall Lake is 2.14 persons per household, with single male/father households (22 | 7.3%) accounting for the largest median household size of 4.23 persons per household. non-family households (103 | 34.0%) represent the smallest median household size with 1.08 persons per household.
| Household Type | # Households | Household Size |
| Married-Couple | 153 (50.5%) | 2.37 |
| Single Male/Father | 22 (7.3%) | 4.23 |
| Single Female/Mother | 25 (8.3%) | 3.28 |
| Non-family | 103 (34.0%) | 1.08 |
| Total Households | 303 (100.0%) | 2.14 |
Household Size by Marriage Status in Wall Lake
Out of a total of 303 households in Wall Lake, 200 (66.0%) are family households, while 103 (34.0%) are nonfamily households. The most numerous type of family households are 2-person households, comprising 119, and the most common type of nonfamily households are 1-person households, comprising 92.
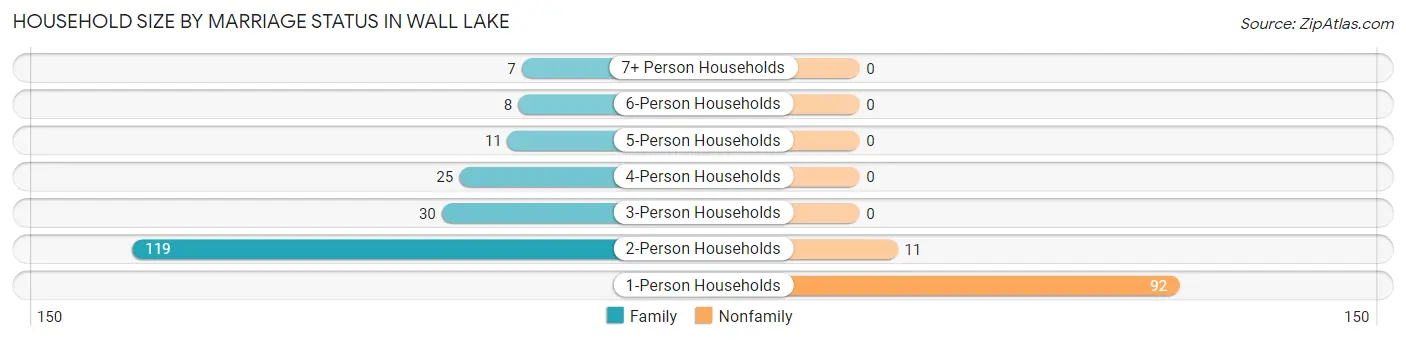
| Household Size | Family Households | Nonfamily Households |
| 1-Person Households | - | 92 (30.4%) |
| 2-Person Households | 119 (39.3%) | 11 (3.6%) |
| 3-Person Households | 30 (9.9%) | 0 (0.0%) |
| 4-Person Households | 25 (8.3%) | 0 (0.0%) |
| 5-Person Households | 11 (3.6%) | 0 (0.0%) |
| 6-Person Households | 8 (2.6%) | 0 (0.0%) |
| 7+ Person Households | 7 (2.3%) | 0 (0.0%) |
| Total | 200 (66.0%) | 103 (34.0%) |
Female Fertility in Wall Lake
Fertility by Age in Wall Lake
Average fertility rate in Wall Lake is 71.0 births per 1,000 women. Women in the age bracket of 20 to 34 years have the highest fertility rate with 146.0 births per 1,000 women. Women in the age bracket of 20 to 34 years acount for 100.0% of all women with births.
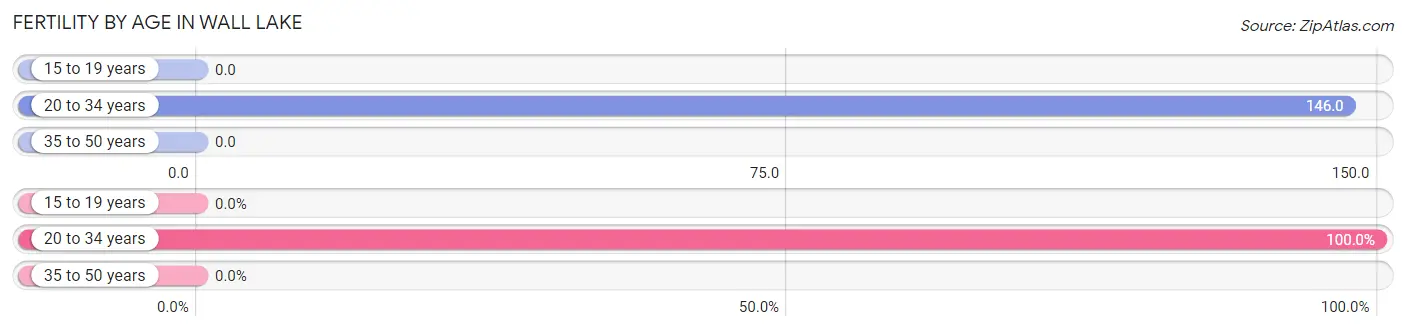
| Age Bracket | Women with Births | Births / 1,000 Women |
| 15 to 19 years | 0 (0.0%) | 0.0 |
| 20 to 34 years | 6 (100.0%) | 146.0 |
| 35 to 50 years | 0 (0.0%) | 0.0 |
| Total | 6 (100.0%) | 71.0 |
Fertility by Age by Marriage Status in Wall Lake
33.3% of women with births (6) in Wall Lake are married. The highest percentage of unmarried women with births falls into 20 to 34 years age bracket with 66.7% of them unmarried at the time of birth, while the lowest percentage of unmarried women with births belong to 20 to 34 years age bracket with 66.7% of them unmarried.
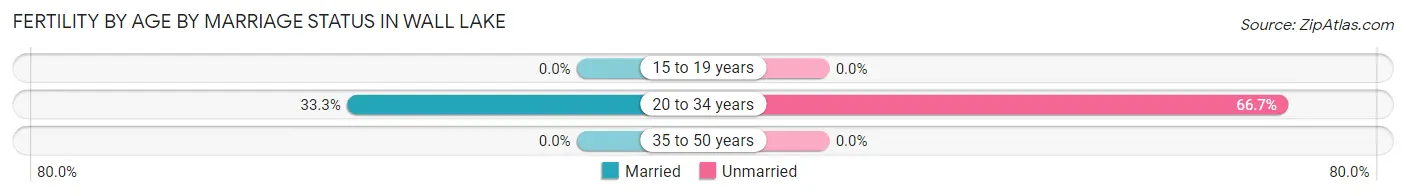
| Age Bracket | Married | Unmarried |
| 15 to 19 years | 0 (0.0%) | 0 (0.0%) |
| 20 to 34 years | 2 (33.3%) | 4 (66.7%) |
| 35 to 50 years | 0 (0.0%) | 0 (0.0%) |
| Total | 2 (33.3%) | 4 (66.7%) |
Fertility by Education in Wall Lake
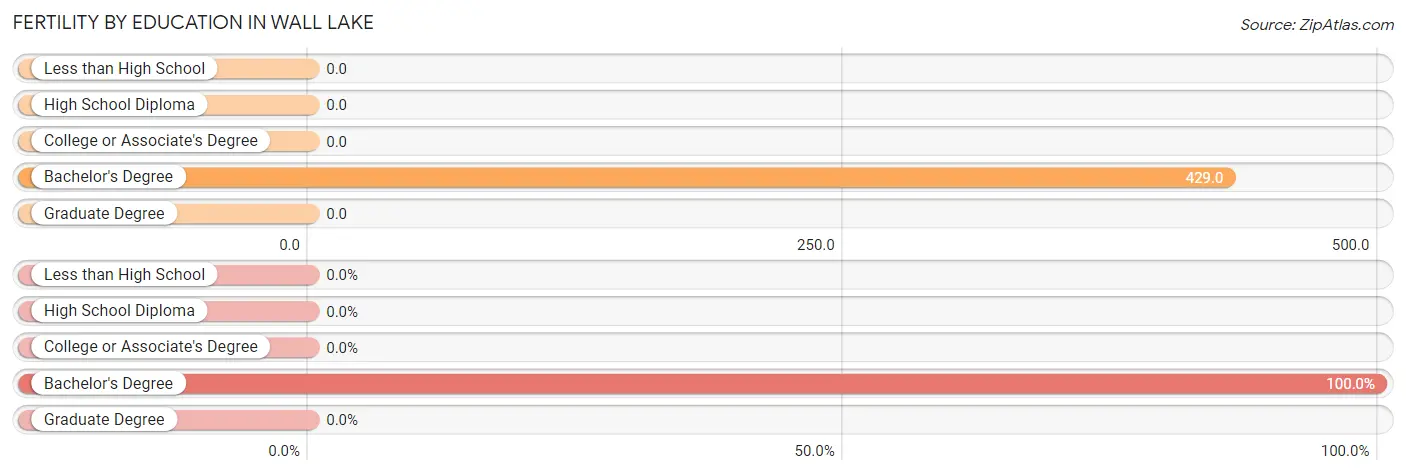
| Educational Attainment | Women with Births | Births / 1,000 Women |
| Less than High School | 0 (0.0%) | 0.0 |
| High School Diploma | 0 (0.0%) | 0.0 |
| College or Associate's Degree | 0 (0.0%) | 0.0 |
| Bachelor's Degree | 6 (100.0%) | 429.0 |
| Graduate Degree | 0 (0.0%) | 0.0 |
| Total | 6 (100.0%) | 71.0 |
Fertility by Education by Marriage Status in Wall Lake
66.7% of women with births in Wall Lake are unmarried. Women with the educational attainment of bachelor's degree are most likely to be married with 33.3% of them married at childbirth, while women with the educational attainment of bachelor's degree are least likely to be married with 66.7% of them unmarried at childbirth.
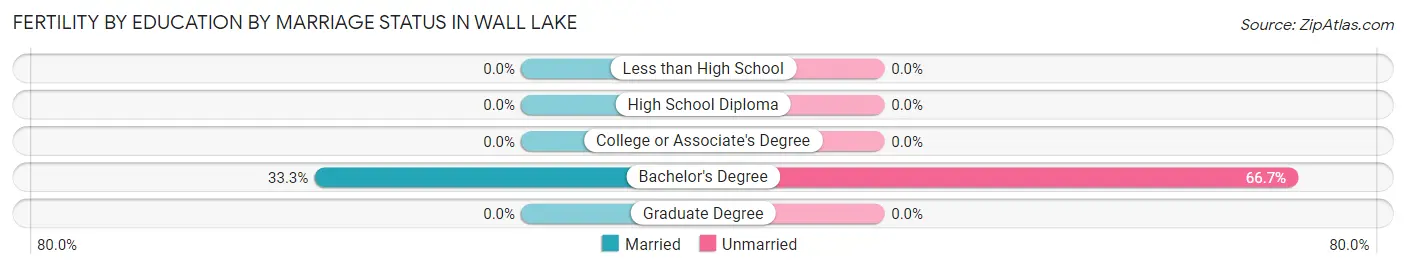
| Educational Attainment | Married | Unmarried |
| Less than High School | 0 (0.0%) | 0 (0.0%) |
| High School Diploma | 0 (0.0%) | 0 (0.0%) |
| College or Associate's Degree | 0 (0.0%) | 0 (0.0%) |
| Bachelor's Degree | 2 (33.3%) | 4 (66.7%) |
| Graduate Degree | 0 (0.0%) | 0 (0.0%) |
| Total | 2 (33.3%) | 4 (66.7%) |
Employment Characteristics in Wall Lake
Employment by Class of Employer in Wall Lake
Among the 286 employed individuals in Wall Lake, private company employees (184 | 64.3%), self-employed (not incorporated) (38 | 13.3%), and not-for-profit organizations (25 | 8.7%) make up the most common classes of employment.
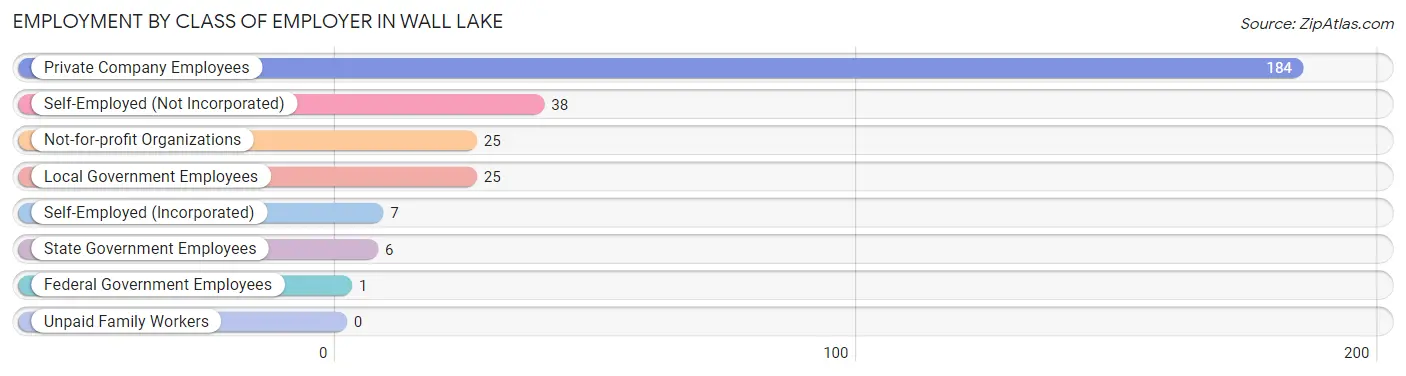
| Employer Class | # Employees | % Employees |
| Private Company Employees | 184 | 64.3% |
| Self-Employed (Incorporated) | 7 | 2.5% |
| Self-Employed (Not Incorporated) | 38 | 13.3% |
| Not-for-profit Organizations | 25 | 8.7% |
| Local Government Employees | 25 | 8.7% |
| State Government Employees | 6 | 2.1% |
| Federal Government Employees | 1 | 0.4% |
| Unpaid Family Workers | 0 | 0.0% |
| Total | 286 | 100.0% |
Employment Status by Age in Wall Lake
According to the labor force statistics for Wall Lake, out of the total population over 16 years of age (559), 54.9% or 307 individuals are in the labor force, with 4.2% or 13 of them unemployed. The age group with the highest labor force participation rate is 20 to 24 years, with 100.0% or 39 individuals in the labor force. Within the labor force, the 25 to 29 years age range has the highest percentage of unemployed individuals, with 24.0% or 6 of them being unemployed.
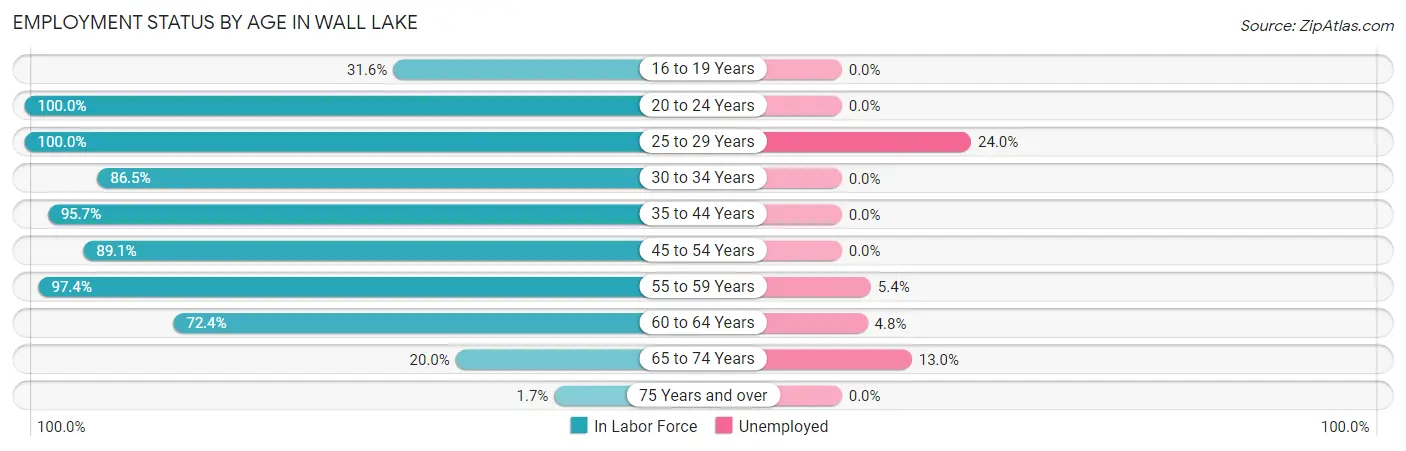
| Age Bracket | In Labor Force | Unemployed |
| 16 to 19 Years | 6 (31.6%) | 0 (0.0%) |
| 20 to 24 Years | 39 (100.0%) | 0 (0.0%) |
| 25 to 29 Years | 25 (100.0%) | 6 (24.0%) |
| 30 to 34 Years | 32 (86.5%) | 0 (0.0%) |
| 35 to 44 Years | 44 (95.7%) | 0 (0.0%) |
| 45 to 54 Years | 57 (89.1%) | 0 (0.0%) |
| 55 to 59 Years | 37 (97.4%) | 2 (5.4%) |
| 60 to 64 Years | 42 (72.4%) | 2 (4.8%) |
| 65 to 74 Years | 23 (20.0%) | 3 (13.0%) |
| 75 Years and over | 2 (1.7%) | 0 (0.0%) |
| Total | 307 (54.9%) | 13 (4.2%) |
Employment Status by Educational Attainment in Wall Lake
According to labor force statistics for Wall Lake, 88.4% of individuals (237) out of the total population between 25 and 64 years of age (268) are in the labor force, with 4.2% or 10 of them being unemployed. The group with the highest labor force participation rate are those with the educational attainment of less than high school, with 100.0% or 11 individuals in the labor force. Within the labor force, individuals with college / associate degree education have the highest percentage of unemployment, with 7.0% or 6 of them being unemployed.
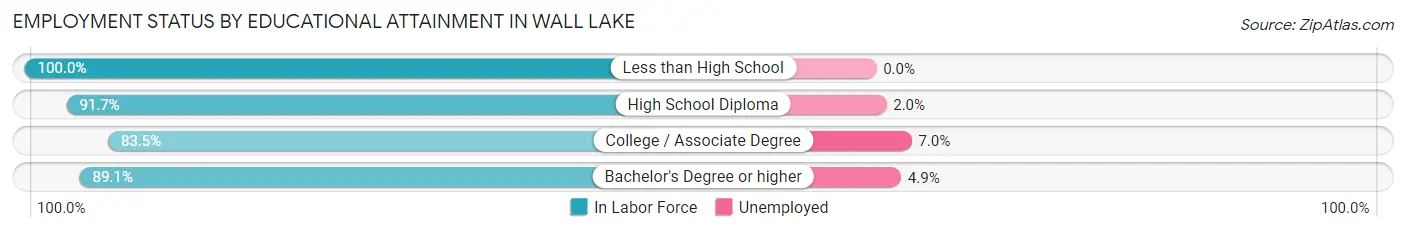
| Educational Attainment | In Labor Force | Unemployed |
| Less than High School | 11 (100.0%) | 0 (0.0%) |
| High School Diploma | 99 (91.7%) | 2 (2.0%) |
| College / Associate Degree | 86 (83.5%) | 7 (7.0%) |
| Bachelor's Degree or higher | 41 (89.1%) | 2 (4.9%) |
| Total | 237 (88.4%) | 11 (4.2%) |
Employment Occupations by Sex in Wall Lake
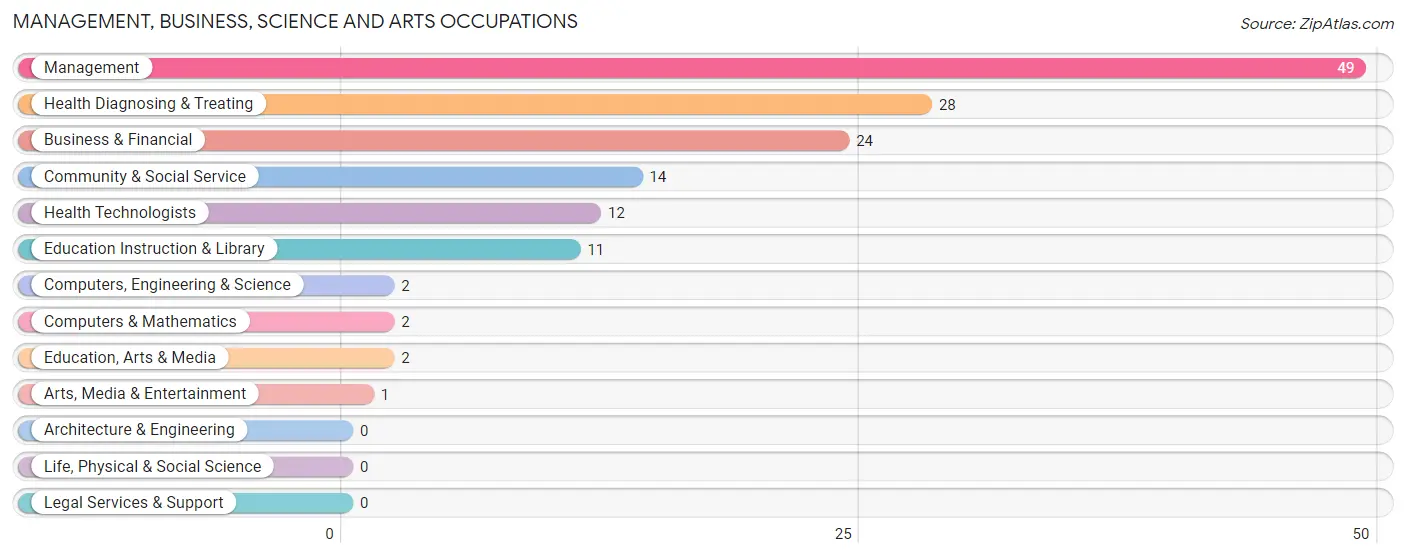
Management, Business, Science and Arts Occupations
The most common Management, Business, Science and Arts occupations in Wall Lake are Management (49 | 16.7%), Health Diagnosing & Treating (28 | 9.5%), Business & Financial (24 | 8.2%), Community & Social Service (14 | 4.8%), and Health Technologists (12 | 4.1%).
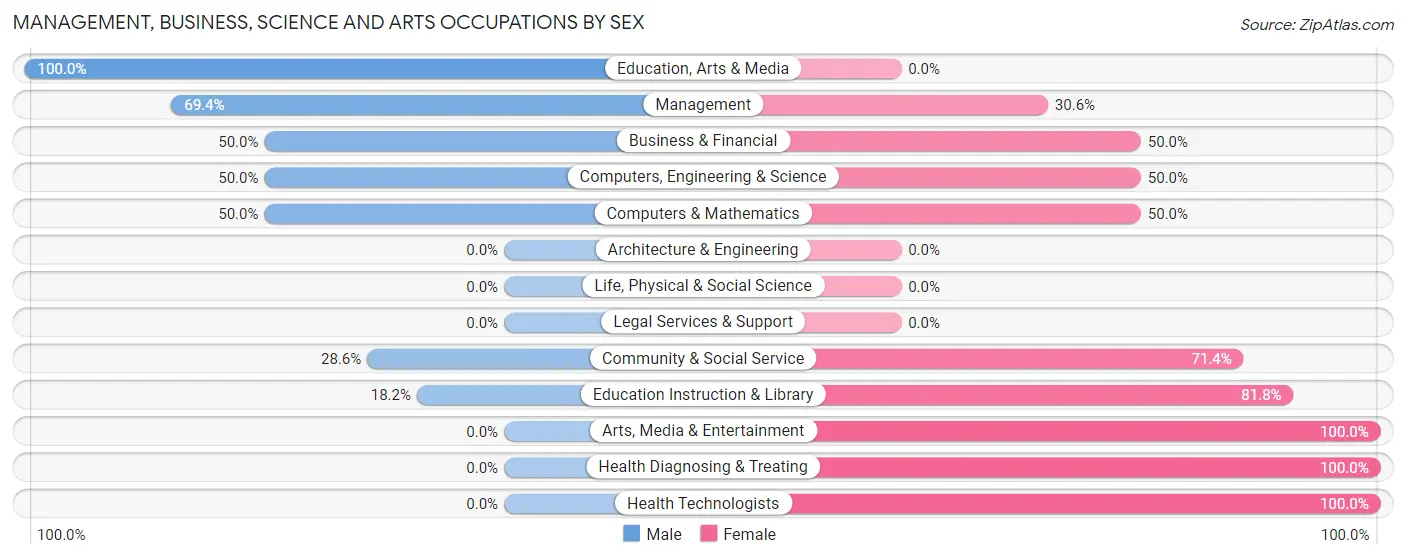
Management, Business, Science and Arts Occupations by Sex
Within the Management, Business, Science and Arts occupations in Wall Lake, the most male-oriented occupations are Education, Arts & Media (100.0%), Management (69.4%), and Business & Financial (50.0%), while the most female-oriented occupations are Arts, Media & Entertainment (100.0%), Health Diagnosing & Treating (100.0%), and Health Technologists (100.0%).
| Occupation | Male | Female |
| Management | 34 (69.4%) | 15 (30.6%) |
| Business & Financial | 12 (50.0%) | 12 (50.0%) |
| Computers, Engineering & Science | 1 (50.0%) | 1 (50.0%) |
| Computers & Mathematics | 1 (50.0%) | 1 (50.0%) |
| Architecture & Engineering | 0 (0.0%) | 0 (0.0%) |
| Life, Physical & Social Science | 0 (0.0%) | 0 (0.0%) |
| Community & Social Service | 4 (28.6%) | 10 (71.4%) |
| Education, Arts & Media | 2 (100.0%) | 0 (0.0%) |
| Legal Services & Support | 0 (0.0%) | 0 (0.0%) |
| Education Instruction & Library | 2 (18.2%) | 9 (81.8%) |
| Arts, Media & Entertainment | 0 (0.0%) | 1 (100.0%) |
| Health Diagnosing & Treating | 0 (0.0%) | 28 (100.0%) |
| Health Technologists | 0 (0.0%) | 12 (100.0%) |
| Total (Category) | 51 (43.6%) | 66 (56.4%) |
| Total (Overall) | 161 (54.8%) | 133 (45.2%) |
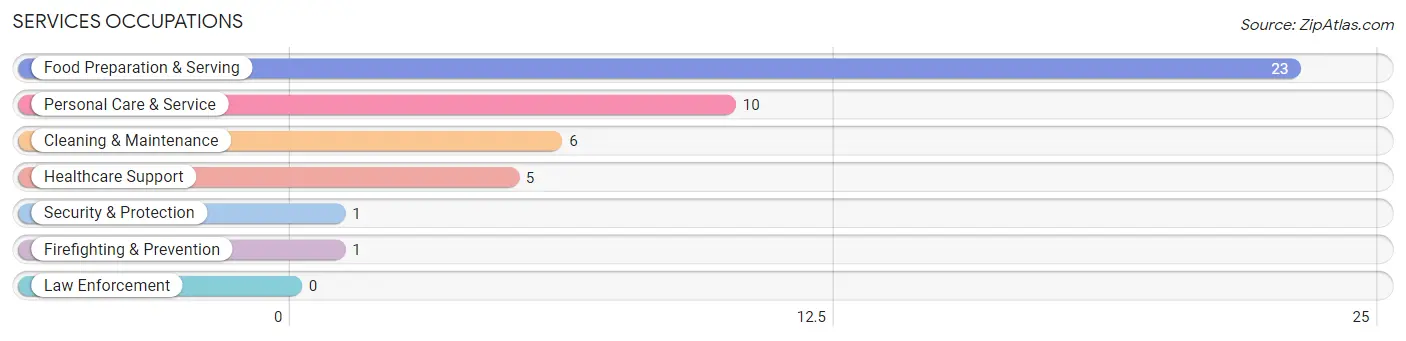
Services Occupations
The most common Services occupations in Wall Lake are Food Preparation & Serving (23 | 7.8%), Personal Care & Service (10 | 3.4%), Cleaning & Maintenance (6 | 2.0%), Healthcare Support (5 | 1.7%), and Security & Protection (1 | 0.3%).
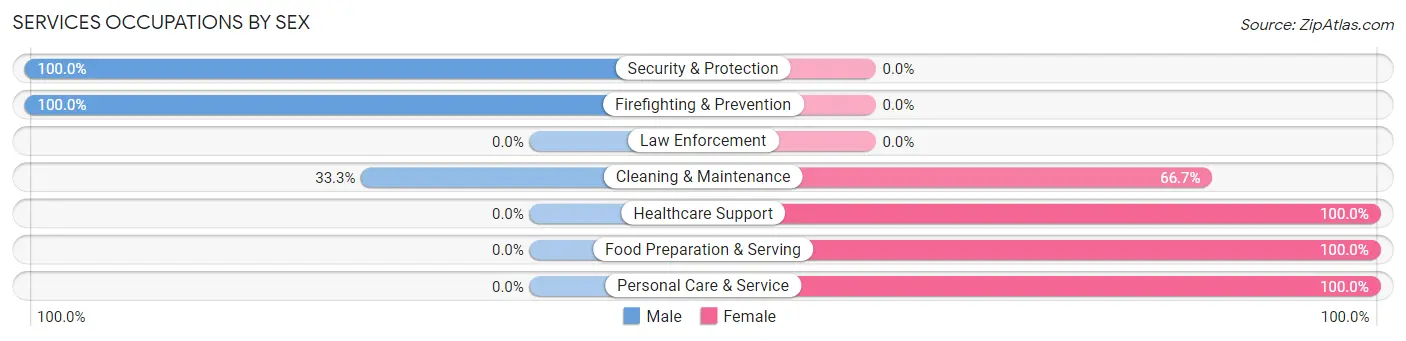
Services Occupations by Sex
Within the Services occupations in Wall Lake, the most male-oriented occupations are Security & Protection (100.0%), Firefighting & Prevention (100.0%), and Cleaning & Maintenance (33.3%), while the most female-oriented occupations are Healthcare Support (100.0%), Food Preparation & Serving (100.0%), and Personal Care & Service (100.0%).
| Occupation | Male | Female |
| Healthcare Support | 0 (0.0%) | 5 (100.0%) |
| Security & Protection | 1 (100.0%) | 0 (0.0%) |
| Firefighting & Prevention | 1 (100.0%) | 0 (0.0%) |
| Law Enforcement | 0 (0.0%) | 0 (0.0%) |
| Food Preparation & Serving | 0 (0.0%) | 23 (100.0%) |
| Cleaning & Maintenance | 2 (33.3%) | 4 (66.7%) |
| Personal Care & Service | 0 (0.0%) | 10 (100.0%) |
| Total (Category) | 3 (6.7%) | 42 (93.3%) |
| Total (Overall) | 161 (54.8%) | 133 (45.2%) |
Sales and Office Occupations
The most common Sales and Office occupations in Wall Lake are Office & Administration (36 | 12.2%), and Sales & Related (15 | 5.1%).
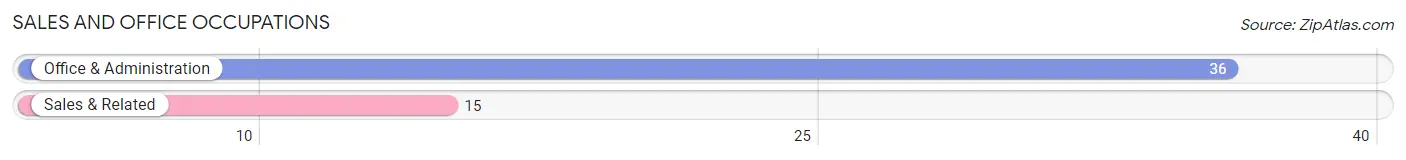
Sales and Office Occupations by Sex
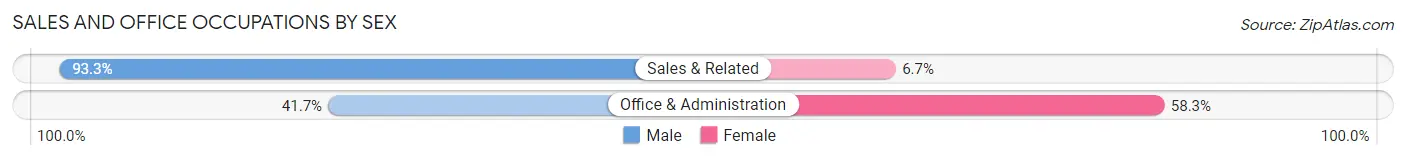
| Occupation | Male | Female |
| Sales & Related | 14 (93.3%) | 1 (6.7%) |
| Office & Administration | 15 (41.7%) | 21 (58.3%) |
| Total (Category) | 29 (56.9%) | 22 (43.1%) |
| Total (Overall) | 161 (54.8%) | 133 (45.2%) |
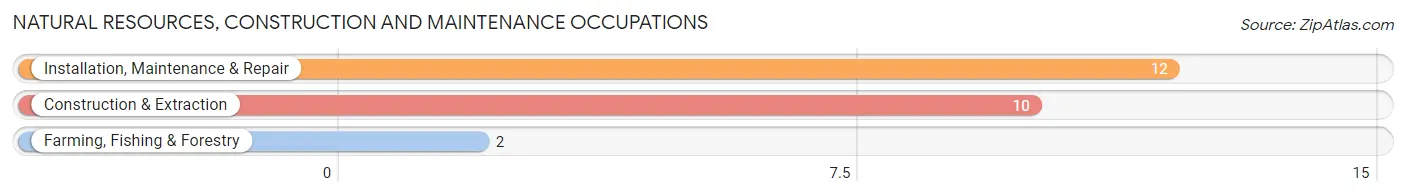
Natural Resources, Construction and Maintenance Occupations
The most common Natural Resources, Construction and Maintenance occupations in Wall Lake are Installation, Maintenance & Repair (12 | 4.1%), Construction & Extraction (10 | 3.4%), and Farming, Fishing & Forestry (2 | 0.7%).
Natural Resources, Construction and Maintenance Occupations by Sex
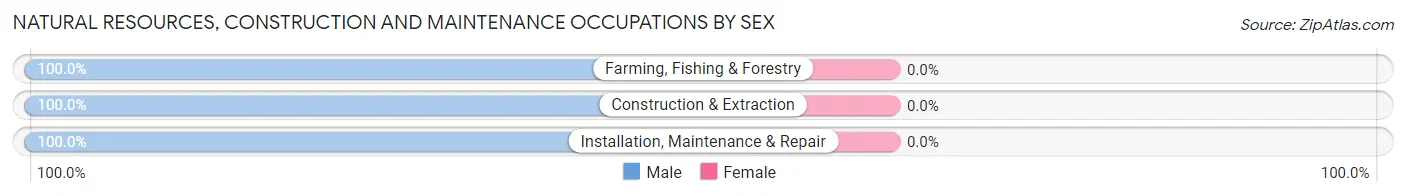
| Occupation | Male | Female |
| Farming, Fishing & Forestry | 2 (100.0%) | 0 (0.0%) |
| Construction & Extraction | 10 (100.0%) | 0 (0.0%) |
| Installation, Maintenance & Repair | 12 (100.0%) | 0 (0.0%) |
| Total (Category) | 24 (100.0%) | 0 (0.0%) |
| Total (Overall) | 161 (54.8%) | 133 (45.2%) |
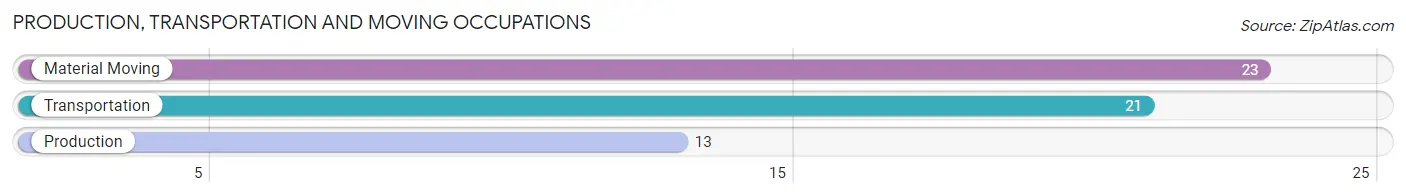
Production, Transportation and Moving Occupations
The most common Production, Transportation and Moving occupations in Wall Lake are Material Moving (23 | 7.8%), Transportation (21 | 7.1%), and Production (13 | 4.4%).
Production, Transportation and Moving Occupations by Sex
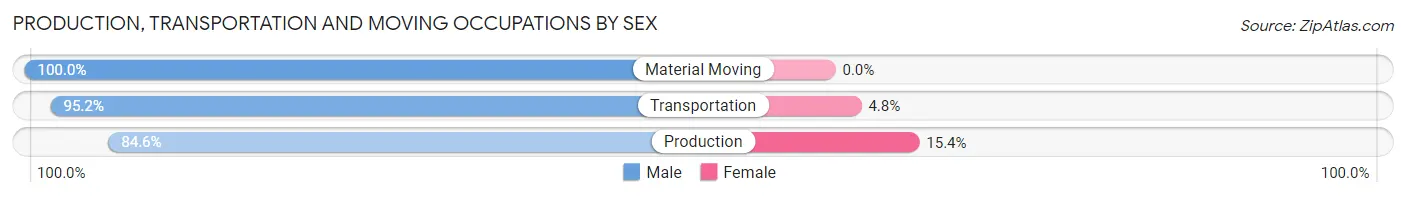
| Occupation | Male | Female |
| Production | 11 (84.6%) | 2 (15.4%) |
| Transportation | 20 (95.2%) | 1 (4.8%) |
| Material Moving | 23 (100.0%) | 0 (0.0%) |
| Total (Category) | 54 (94.7%) | 3 (5.3%) |
| Total (Overall) | 161 (54.8%) | 133 (45.2%) |
Employment Industries by Sex in Wall Lake
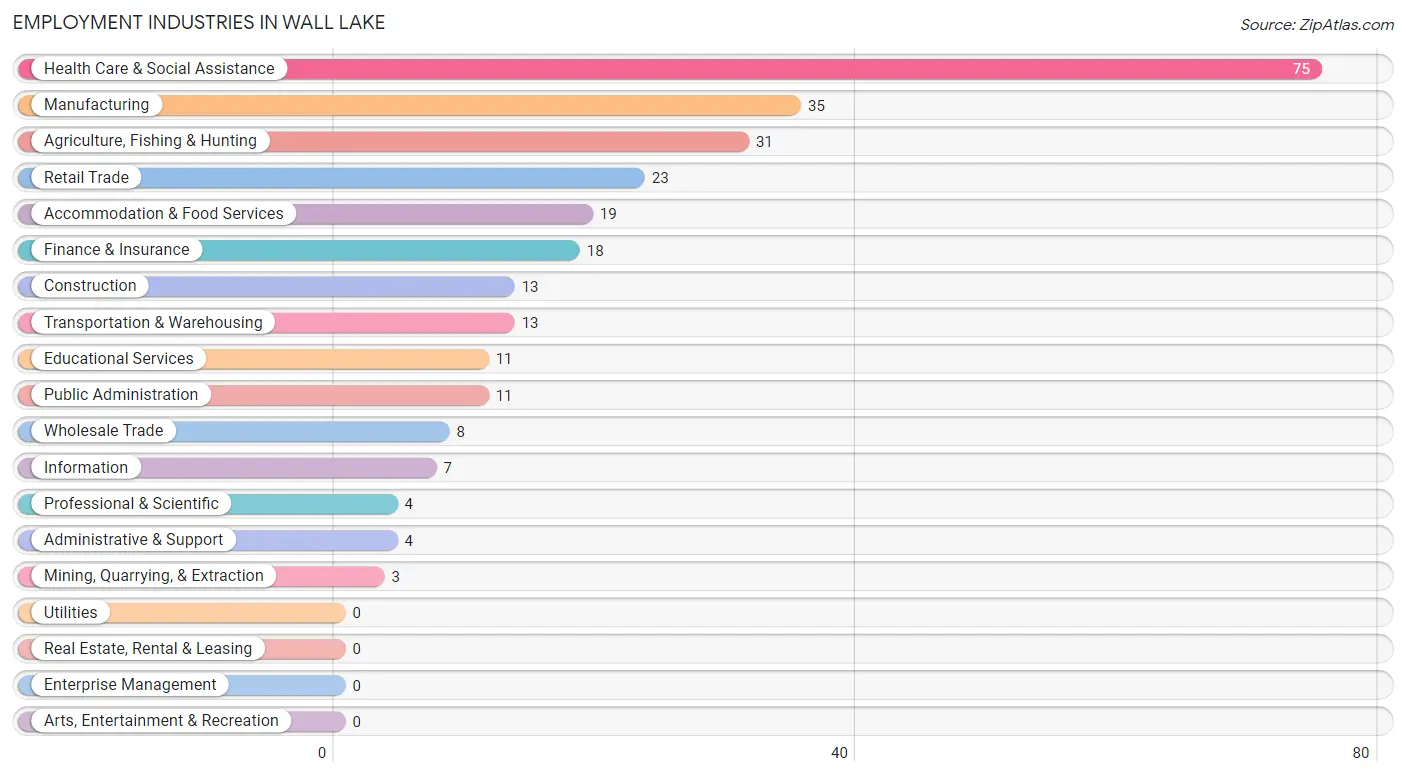
Employment Industries in Wall Lake
The major employment industries in Wall Lake include Health Care & Social Assistance (75 | 25.5%), Manufacturing (35 | 11.9%), Agriculture, Fishing & Hunting (31 | 10.5%), Retail Trade (23 | 7.8%), and Accommodation & Food Services (19 | 6.5%).
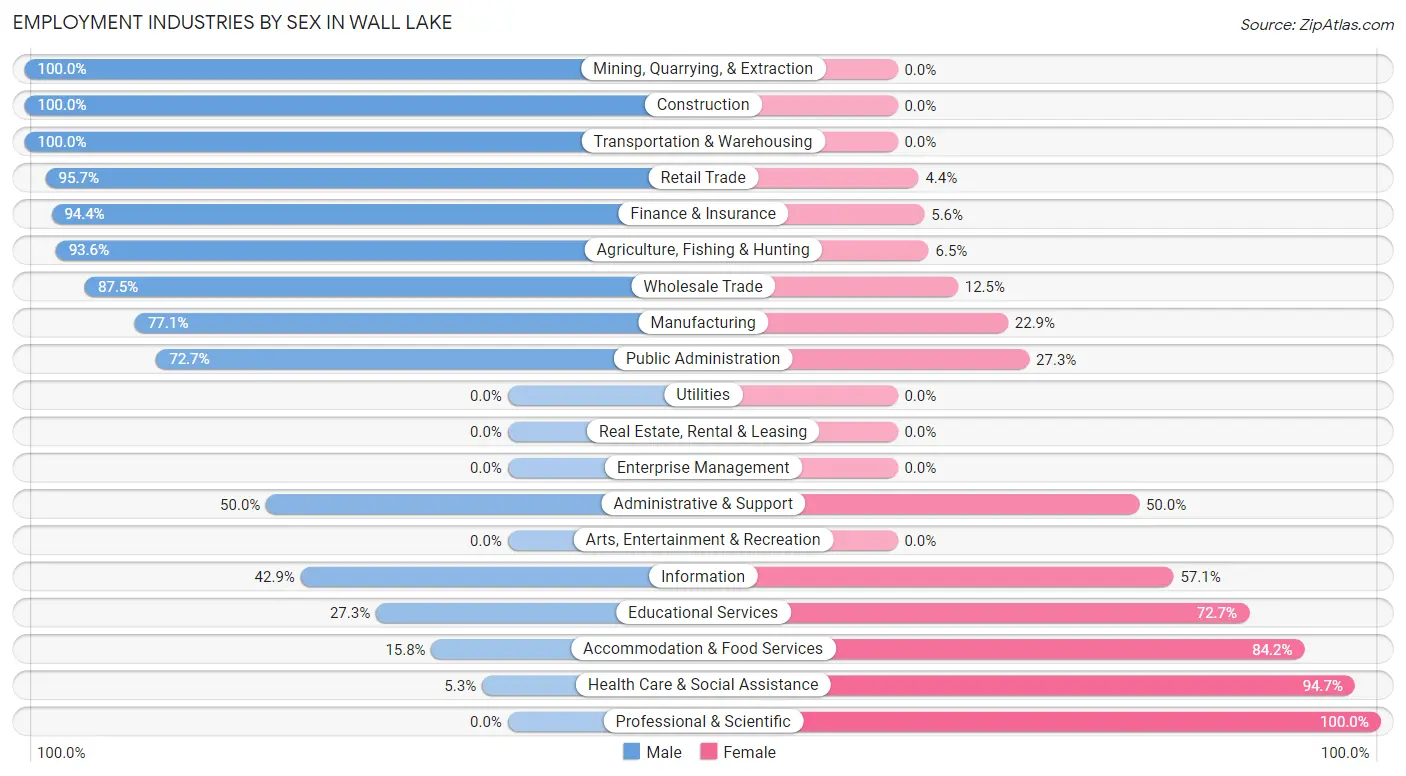
Employment Industries by Sex in Wall Lake
The Wall Lake industries that see more men than women are Mining, Quarrying, & Extraction (100.0%), Construction (100.0%), and Transportation & Warehousing (100.0%), whereas the industries that tend to have a higher number of women are Professional & Scientific (100.0%), Health Care & Social Assistance (94.7%), and Accommodation & Food Services (84.2%).
| Industry | Male | Female |
| Agriculture, Fishing & Hunting | 29 (93.5%) | 2 (6.5%) |
| Mining, Quarrying, & Extraction | 3 (100.0%) | 0 (0.0%) |
| Construction | 13 (100.0%) | 0 (0.0%) |
| Manufacturing | 27 (77.1%) | 8 (22.9%) |
| Wholesale Trade | 7 (87.5%) | 1 (12.5%) |
| Retail Trade | 22 (95.7%) | 1 (4.3%) |
| Transportation & Warehousing | 13 (100.0%) | 0 (0.0%) |
| Utilities | 0 (0.0%) | 0 (0.0%) |
| Information | 3 (42.9%) | 4 (57.1%) |
| Finance & Insurance | 17 (94.4%) | 1 (5.6%) |
| Real Estate, Rental & Leasing | 0 (0.0%) | 0 (0.0%) |
| Professional & Scientific | 0 (0.0%) | 4 (100.0%) |
| Enterprise Management | 0 (0.0%) | 0 (0.0%) |
| Administrative & Support | 2 (50.0%) | 2 (50.0%) |
| Educational Services | 3 (27.3%) | 8 (72.7%) |
| Health Care & Social Assistance | 4 (5.3%) | 71 (94.7%) |
| Arts, Entertainment & Recreation | 0 (0.0%) | 0 (0.0%) |
| Accommodation & Food Services | 3 (15.8%) | 16 (84.2%) |
| Public Administration | 8 (72.7%) | 3 (27.3%) |
| Total | 161 (54.8%) | 133 (45.2%) |
Education in Wall Lake
School Enrollment in Wall Lake
The most common levels of schooling among the 121 students in Wall Lake are elementary school (42 | 34.7%), middle school (39 | 32.2%), and high school (22 | 18.2%).
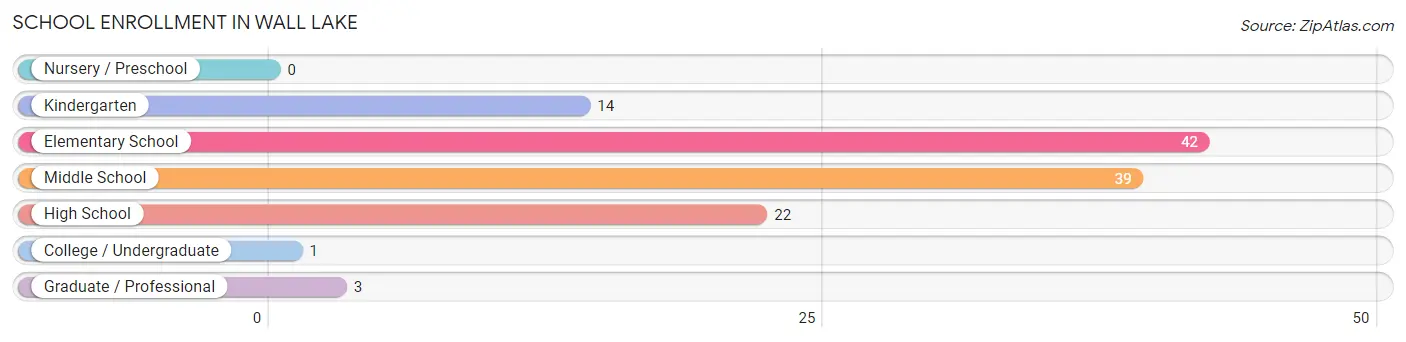
| School Level | # Students | % Students |
| Nursery / Preschool | 0 | 0.0% |
| Kindergarten | 14 | 11.6% |
| Elementary School | 42 | 34.7% |
| Middle School | 39 | 32.2% |
| High School | 22 | 18.2% |
| College / Undergraduate | 1 | 0.8% |
| Graduate / Professional | 3 | 2.5% |
| Total | 121 | 100.0% |
School Enrollment by Age by Funding Source in Wall Lake
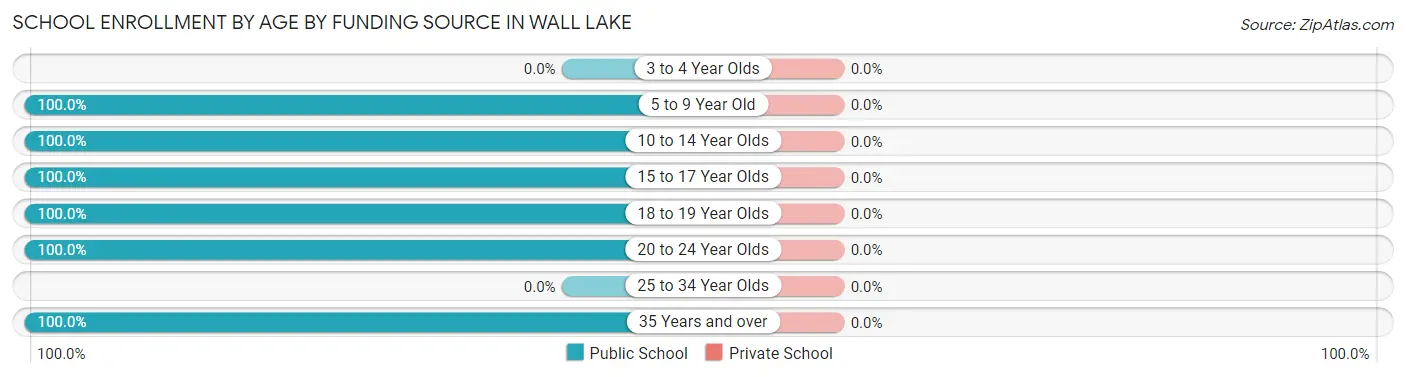
| Age Bracket | Public School | Private School |
| 3 to 4 Year Olds | 0 (0.0%) | 0 (0.0%) |
| 5 to 9 Year Old | 48 (100.0%) | 0 (0.0%) |
| 10 to 14 Year Olds | 50 (100.0%) | 0 (0.0%) |
| 15 to 17 Year Olds | 15 (100.0%) | 0 (0.0%) |
| 18 to 19 Year Olds | 4 (100.0%) | 0 (0.0%) |
| 20 to 24 Year Olds | 3 (100.0%) | 0 (0.0%) |
| 25 to 34 Year Olds | 0 (0.0%) | 0 (0.0%) |
| 35 Years and over | 1 (100.0%) | 0 (0.0%) |
| Total | 121 (100.0%) | 0 (0.0%) |
Educational Attainment by Field of Study in Wall Lake
Bio, nature & agricultural (21 | 26.6%), business (14 | 17.7%), education (13 | 16.5%), science & technology (9 | 11.4%), and communications (5 | 6.3%) are the most common fields of study among 79 individuals in Wall Lake who have obtained a bachelor's degree or higher.
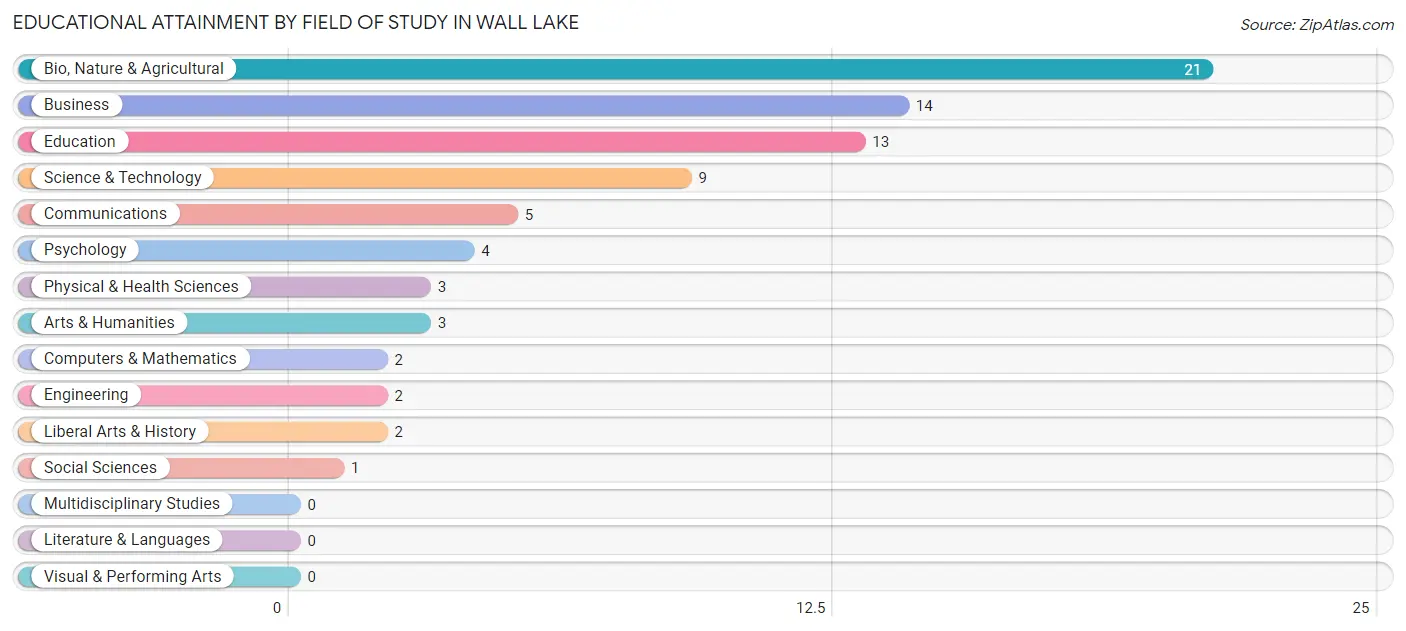
| Field of Study | # Graduates | % Graduates |
| Computers & Mathematics | 2 | 2.5% |
| Bio, Nature & Agricultural | 21 | 26.6% |
| Physical & Health Sciences | 3 | 3.8% |
| Psychology | 4 | 5.1% |
| Social Sciences | 1 | 1.3% |
| Engineering | 2 | 2.5% |
| Multidisciplinary Studies | 0 | 0.0% |
| Science & Technology | 9 | 11.4% |
| Business | 14 | 17.7% |
| Education | 13 | 16.5% |
| Literature & Languages | 0 | 0.0% |
| Liberal Arts & History | 2 | 2.5% |
| Visual & Performing Arts | 0 | 0.0% |
| Communications | 5 | 6.3% |
| Arts & Humanities | 3 | 3.8% |
| Total | 79 | 100.0% |
Transportation & Commute in Wall Lake
Vehicle Availability by Sex in Wall Lake
The most prevalent vehicle ownership categories in Wall Lake are males with 2 vehicles (72, accounting for 44.7%) and females with 2 vehicles (65, making up 57.6%).
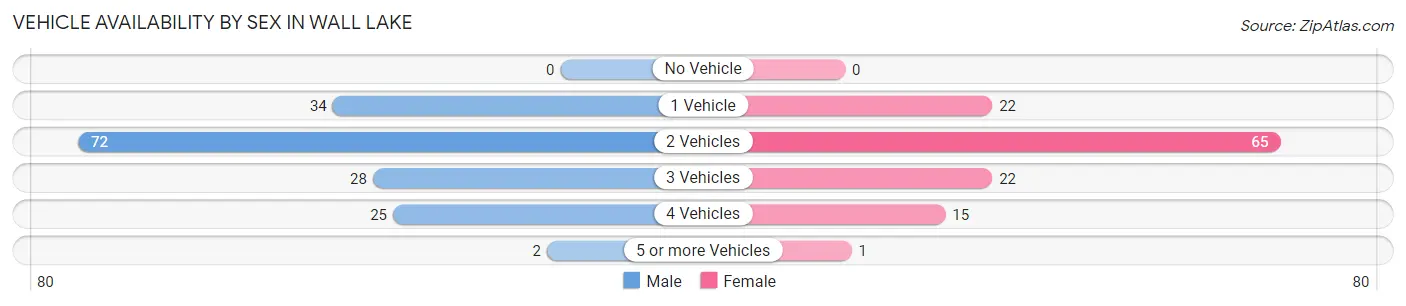
| Vehicles Available | Male | Female |
| No Vehicle | 0 (0.0%) | 0 (0.0%) |
| 1 Vehicle | 34 (21.1%) | 22 (17.6%) |
| 2 Vehicles | 72 (44.7%) | 65 (52.0%) |
| 3 Vehicles | 28 (17.4%) | 22 (17.6%) |
| 4 Vehicles | 25 (15.5%) | 15 (12.0%) |
| 5 or more Vehicles | 2 (1.2%) | 1 (0.8%) |
| Total | 161 (100.0%) | 125 (100.0%) |
Commute Time in Wall Lake
The most frequently occuring commute durations in Wall Lake are 5 to 9 minutes (71 commuters, 25.7%), less than 5 minutes (49 commuters, 17.7%), and 10 to 14 minutes (49 commuters, 17.7%).
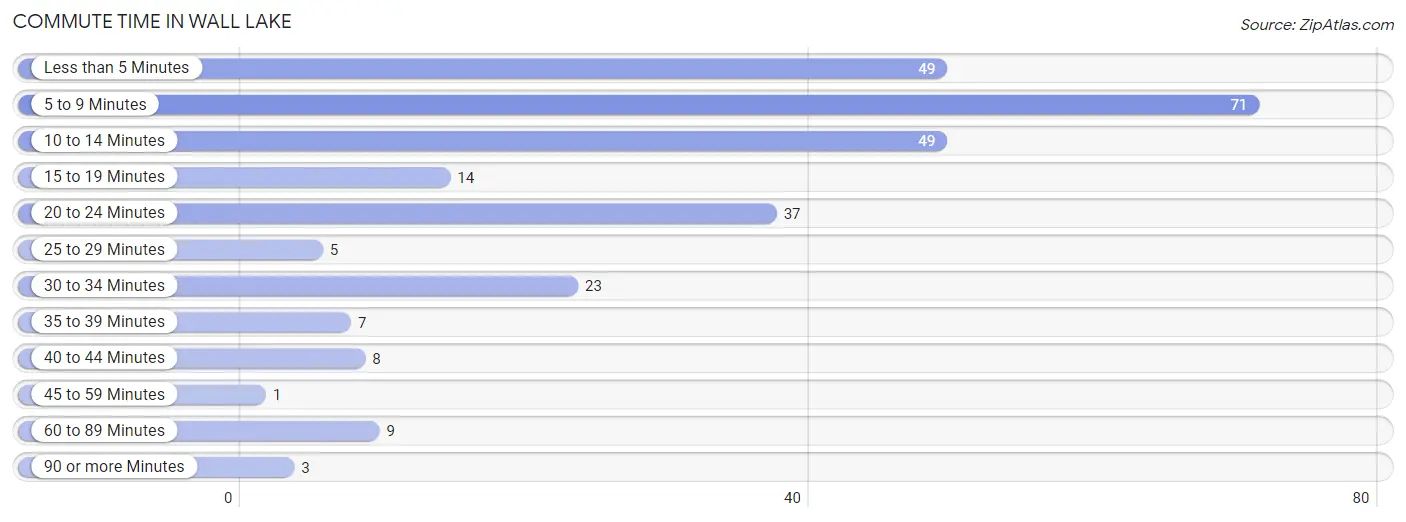
| Commute Time | # Commuters | % Commuters |
| Less than 5 Minutes | 49 | 17.7% |
| 5 to 9 Minutes | 71 | 25.7% |
| 10 to 14 Minutes | 49 | 17.7% |
| 15 to 19 Minutes | 14 | 5.1% |
| 20 to 24 Minutes | 37 | 13.4% |
| 25 to 29 Minutes | 5 | 1.8% |
| 30 to 34 Minutes | 23 | 8.3% |
| 35 to 39 Minutes | 7 | 2.5% |
| 40 to 44 Minutes | 8 | 2.9% |
| 45 to 59 Minutes | 1 | 0.4% |
| 60 to 89 Minutes | 9 | 3.3% |
| 90 or more Minutes | 3 | 1.1% |
Commute Time by Sex in Wall Lake
The most common commute times in Wall Lake are 5 to 9 minutes (36 commuters, 23.7%) for males and 5 to 9 minutes (35 commuters, 28.2%) for females.
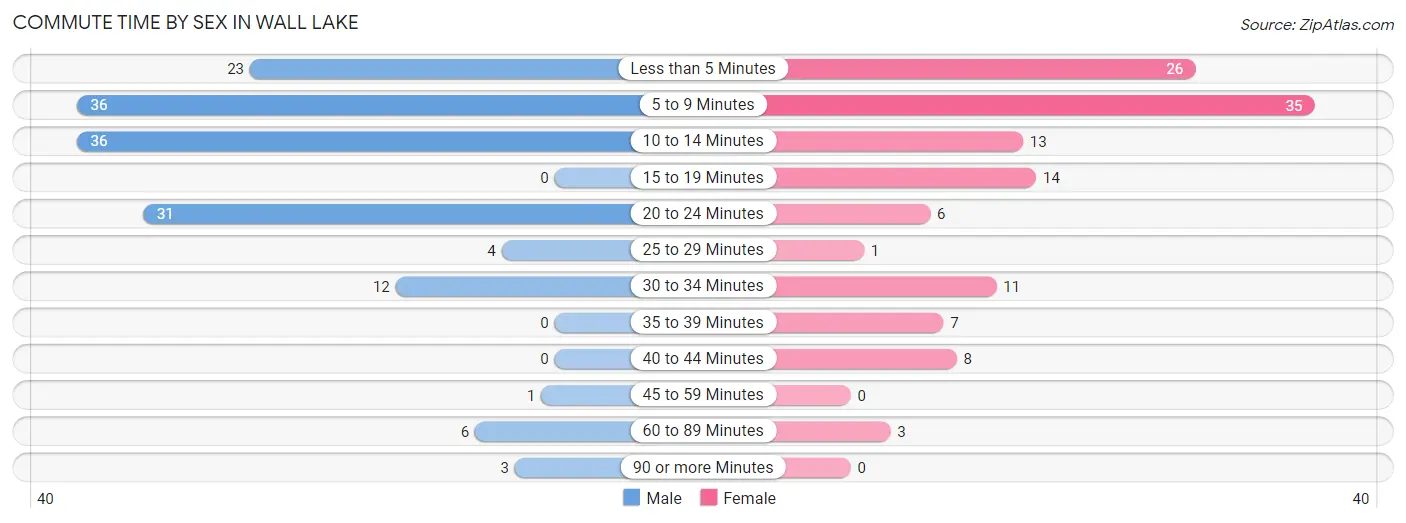
| Commute Time | Male | Female |
| Less than 5 Minutes | 23 (15.1%) | 26 (21.0%) |
| 5 to 9 Minutes | 36 (23.7%) | 35 (28.2%) |
| 10 to 14 Minutes | 36 (23.7%) | 13 (10.5%) |
| 15 to 19 Minutes | 0 (0.0%) | 14 (11.3%) |
| 20 to 24 Minutes | 31 (20.4%) | 6 (4.8%) |
| 25 to 29 Minutes | 4 (2.6%) | 1 (0.8%) |
| 30 to 34 Minutes | 12 (7.9%) | 11 (8.9%) |
| 35 to 39 Minutes | 0 (0.0%) | 7 (5.7%) |
| 40 to 44 Minutes | 0 (0.0%) | 8 (6.5%) |
| 45 to 59 Minutes | 1 (0.7%) | 0 (0.0%) |
| 60 to 89 Minutes | 6 (4.0%) | 3 (2.4%) |
| 90 or more Minutes | 3 (2.0%) | 0 (0.0%) |
Time of Departure to Work by Sex in Wall Lake
The most frequent times of departure to work in Wall Lake are 7:00 AM to 7:29 AM (45, 29.6%) for males and 7:30 AM to 7:59 AM (43, 34.7%) for females.
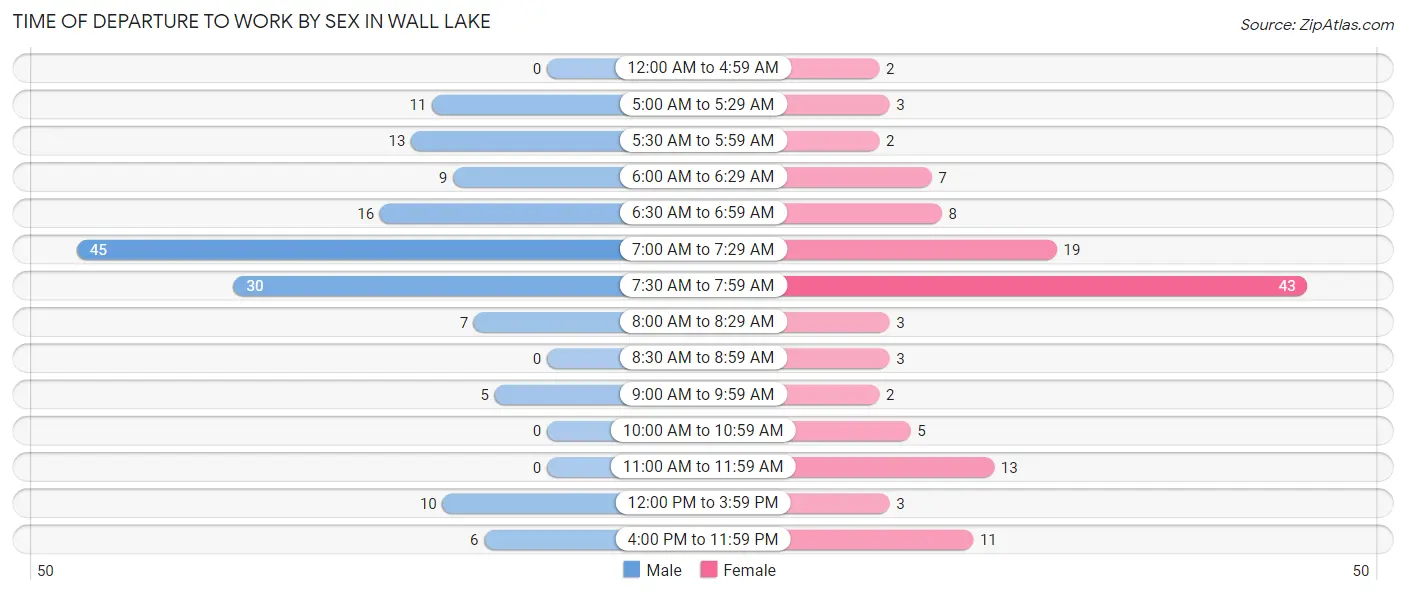
| Time of Departure | Male | Female |
| 12:00 AM to 4:59 AM | 0 (0.0%) | 2 (1.6%) |
| 5:00 AM to 5:29 AM | 11 (7.2%) | 3 (2.4%) |
| 5:30 AM to 5:59 AM | 13 (8.6%) | 2 (1.6%) |
| 6:00 AM to 6:29 AM | 9 (5.9%) | 7 (5.7%) |
| 6:30 AM to 6:59 AM | 16 (10.5%) | 8 (6.5%) |
| 7:00 AM to 7:29 AM | 45 (29.6%) | 19 (15.3%) |
| 7:30 AM to 7:59 AM | 30 (19.7%) | 43 (34.7%) |
| 8:00 AM to 8:29 AM | 7 (4.6%) | 3 (2.4%) |
| 8:30 AM to 8:59 AM | 0 (0.0%) | 3 (2.4%) |
| 9:00 AM to 9:59 AM | 5 (3.3%) | 2 (1.6%) |
| 10:00 AM to 10:59 AM | 0 (0.0%) | 5 (4.0%) |
| 11:00 AM to 11:59 AM | 0 (0.0%) | 13 (10.5%) |
| 12:00 PM to 3:59 PM | 10 (6.6%) | 3 (2.4%) |
| 4:00 PM to 11:59 PM | 6 (4.0%) | 11 (8.9%) |
| Total | 152 (100.0%) | 124 (100.0%) |
Housing Occupancy in Wall Lake
Occupancy by Ownership in Wall Lake
Of the total 303 dwellings in Wall Lake, owner-occupied units account for 246 (81.2%), while renter-occupied units make up 57 (18.8%).
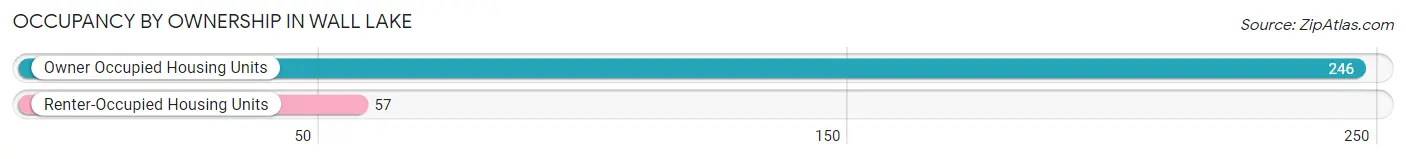
| Occupancy | # Housing Units | % Housing Units |
| Owner Occupied Housing Units | 246 | 81.2% |
| Renter-Occupied Housing Units | 57 | 18.8% |
| Total Occupied Housing Units | 303 | 100.0% |
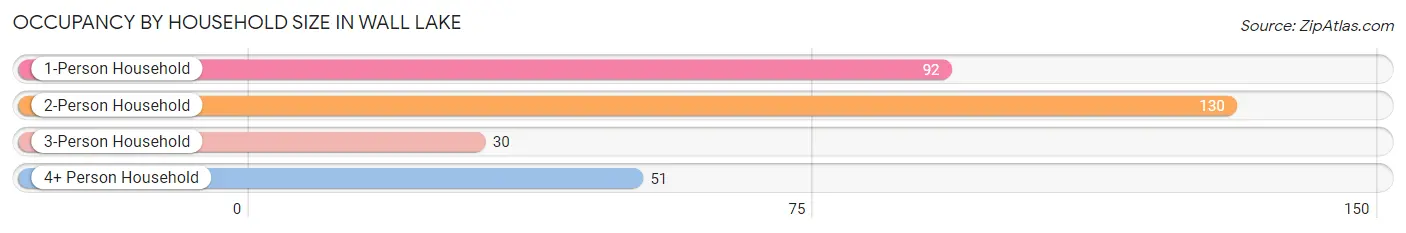
Occupancy by Household Size in Wall Lake
| Household Size | # Housing Units | % Housing Units |
| 1-Person Household | 92 | 30.4% |
| 2-Person Household | 130 | 42.9% |
| 3-Person Household | 30 | 9.9% |
| 4+ Person Household | 51 | 16.8% |
| Total Housing Units | 303 | 100.0% |
Occupancy by Ownership by Household Size in Wall Lake
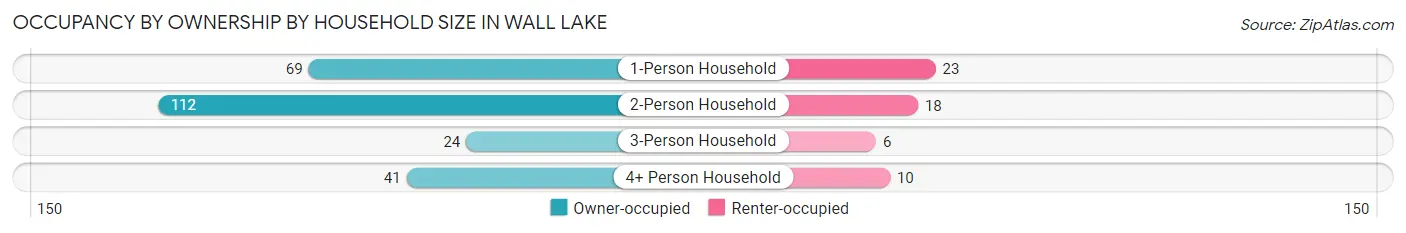
| Household Size | Owner-occupied | Renter-occupied |
| 1-Person Household | 69 (75.0%) | 23 (25.0%) |
| 2-Person Household | 112 (86.2%) | 18 (13.9%) |
| 3-Person Household | 24 (80.0%) | 6 (20.0%) |
| 4+ Person Household | 41 (80.4%) | 10 (19.6%) |
| Total Housing Units | 246 (81.2%) | 57 (18.8%) |
Occupancy by Educational Attainment in Wall Lake
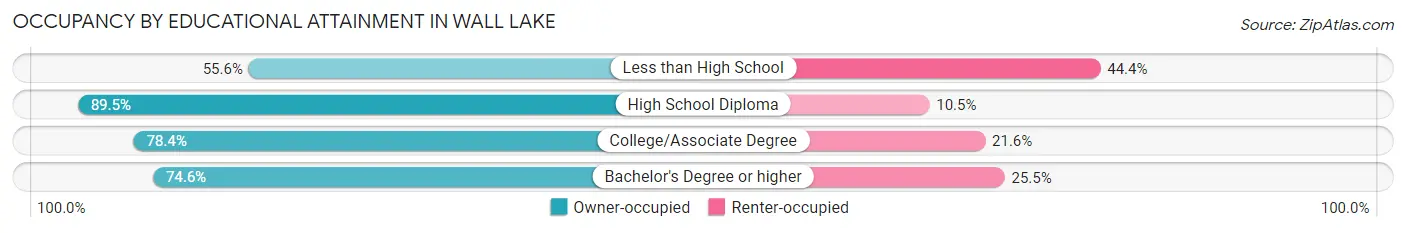
| Household Size | Owner-occupied | Renter-occupied |
| Less than High School | 5 (55.6%) | 4 (44.4%) |
| High School Diploma | 102 (89.5%) | 12 (10.5%) |
| College/Associate Degree | 98 (78.4%) | 27 (21.6%) |
| Bachelor's Degree or higher | 41 (74.6%) | 14 (25.5%) |
Occupancy by Age of Householder in Wall Lake
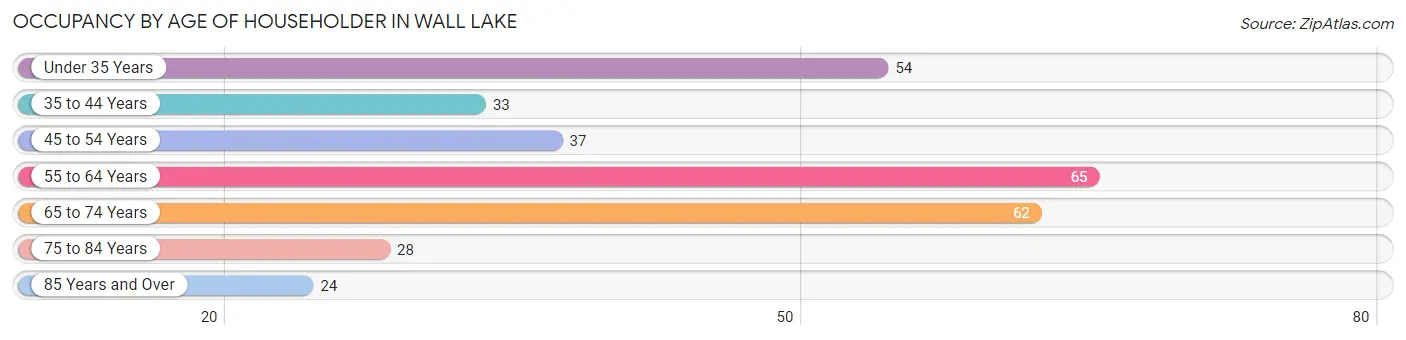
| Age Bracket | # Households | % Households |
| Under 35 Years | 54 | 17.8% |
| 35 to 44 Years | 33 | 10.9% |
| 45 to 54 Years | 37 | 12.2% |
| 55 to 64 Years | 65 | 21.4% |
| 65 to 74 Years | 62 | 20.5% |
| 75 to 84 Years | 28 | 9.2% |
| 85 Years and Over | 24 | 7.9% |
| Total | 303 | 100.0% |
Housing Finances in Wall Lake
Median Income by Occupancy in Wall Lake
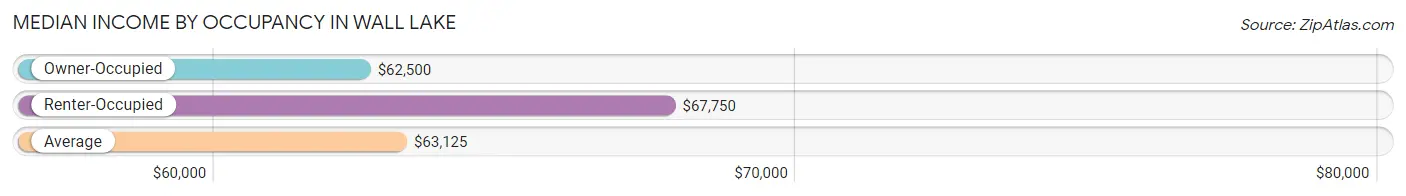
| Occupancy Type | # Households | Median Income |
| Owner-Occupied | 246 (81.2%) | $62,500 |
| Renter-Occupied | 57 (18.8%) | $67,750 |
| Average | 303 (100.0%) | $63,125 |
Occupancy by Householder Income Bracket in Wall Lake
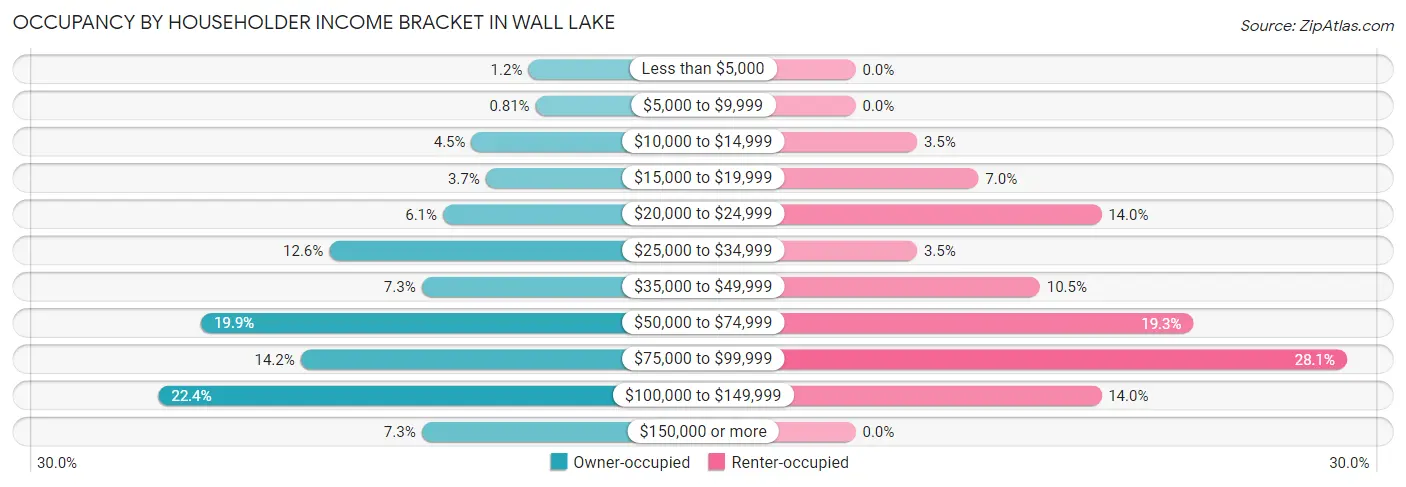
| Income Bracket | Owner-occupied | Renter-occupied |
| Less than $5,000 | 3 (1.2%) | 0 (0.0%) |
| $5,000 to $9,999 | 2 (0.8%) | 0 (0.0%) |
| $10,000 to $14,999 | 11 (4.5%) | 2 (3.5%) |
| $15,000 to $19,999 | 9 (3.7%) | 4 (7.0%) |
| $20,000 to $24,999 | 15 (6.1%) | 8 (14.0%) |
| $25,000 to $34,999 | 31 (12.6%) | 2 (3.5%) |
| $35,000 to $49,999 | 18 (7.3%) | 6 (10.5%) |
| $50,000 to $74,999 | 49 (19.9%) | 11 (19.3%) |
| $75,000 to $99,999 | 35 (14.2%) | 16 (28.1%) |
| $100,000 to $149,999 | 55 (22.4%) | 8 (14.0%) |
| $150,000 or more | 18 (7.3%) | 0 (0.0%) |
| Total | 246 (100.0%) | 57 (100.0%) |
Monthly Housing Cost Tiers in Wall Lake
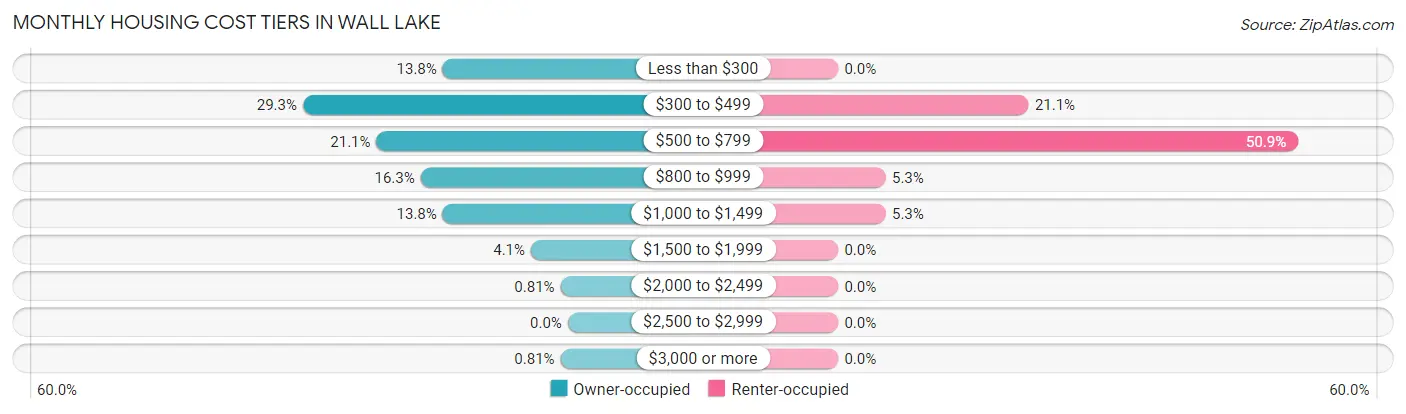
| Monthly Cost | Owner-occupied | Renter-occupied |
| Less than $300 | 34 (13.8%) | 0 (0.0%) |
| $300 to $499 | 72 (29.3%) | 12 (21.0%) |
| $500 to $799 | 52 (21.1%) | 29 (50.9%) |
| $800 to $999 | 40 (16.3%) | 3 (5.3%) |
| $1,000 to $1,499 | 34 (13.8%) | 3 (5.3%) |
| $1,500 to $1,999 | 10 (4.1%) | 0 (0.0%) |
| $2,000 to $2,499 | 2 (0.8%) | 0 (0.0%) |
| $2,500 to $2,999 | 0 (0.0%) | 0 (0.0%) |
| $3,000 or more | 2 (0.8%) | 0 (0.0%) |
| Total | 246 (100.0%) | 57 (100.0%) |
Physical Housing Characteristics in Wall Lake
Housing Structures in Wall Lake
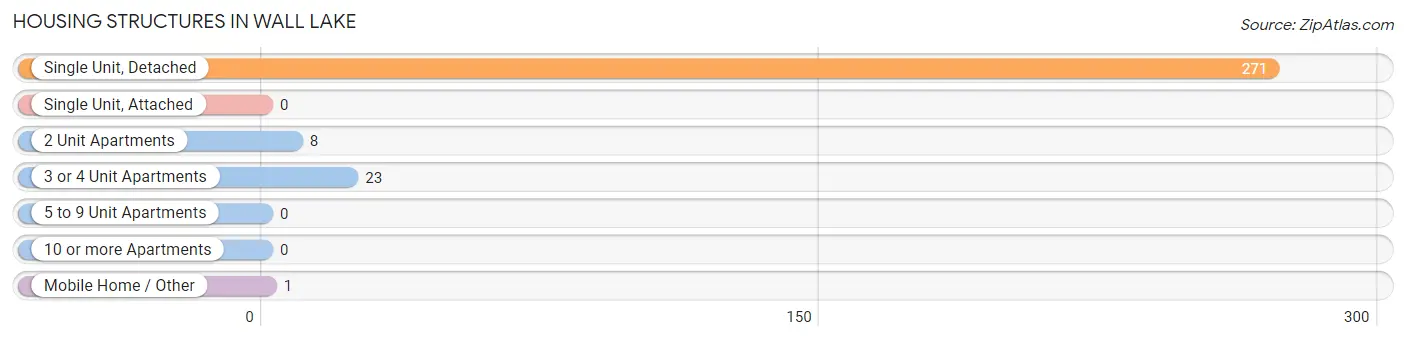
| Structure Type | # Housing Units | % Housing Units |
| Single Unit, Detached | 271 | 89.4% |
| Single Unit, Attached | 0 | 0.0% |
| 2 Unit Apartments | 8 | 2.6% |
| 3 or 4 Unit Apartments | 23 | 7.6% |
| 5 to 9 Unit Apartments | 0 | 0.0% |
| 10 or more Apartments | 0 | 0.0% |
| Mobile Home / Other | 1 | 0.3% |
| Total | 303 | 100.0% |
Housing Structures by Occupancy in Wall Lake
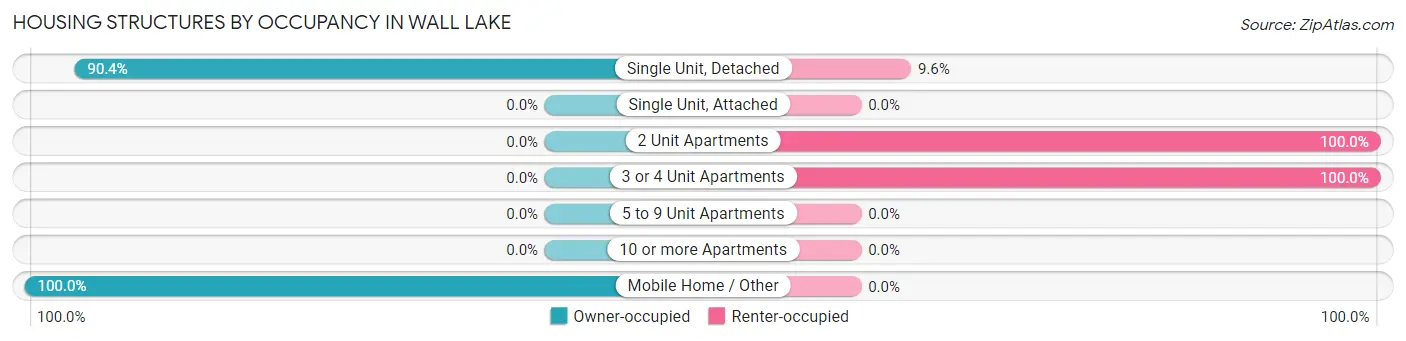
| Structure Type | Owner-occupied | Renter-occupied |
| Single Unit, Detached | 245 (90.4%) | 26 (9.6%) |
| Single Unit, Attached | 0 (0.0%) | 0 (0.0%) |
| 2 Unit Apartments | 0 (0.0%) | 8 (100.0%) |
| 3 or 4 Unit Apartments | 0 (0.0%) | 23 (100.0%) |
| 5 to 9 Unit Apartments | 0 (0.0%) | 0 (0.0%) |
| 10 or more Apartments | 0 (0.0%) | 0 (0.0%) |
| Mobile Home / Other | 1 (100.0%) | 0 (0.0%) |
| Total | 246 (81.2%) | 57 (18.8%) |
Housing Structures by Number of Rooms in Wall Lake
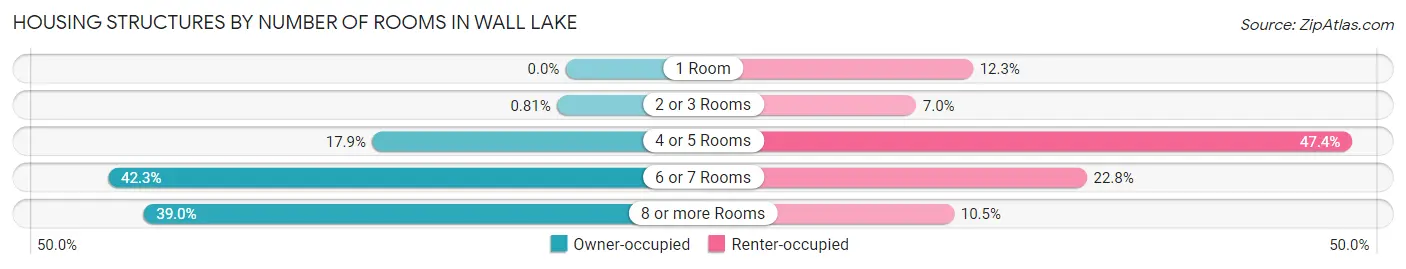
| Number of Rooms | Owner-occupied | Renter-occupied |
| 1 Room | 0 (0.0%) | 7 (12.3%) |
| 2 or 3 Rooms | 2 (0.8%) | 4 (7.0%) |
| 4 or 5 Rooms | 44 (17.9%) | 27 (47.4%) |
| 6 or 7 Rooms | 104 (42.3%) | 13 (22.8%) |
| 8 or more Rooms | 96 (39.0%) | 6 (10.5%) |
| Total | 246 (100.0%) | 57 (100.0%) |
Housing Structure by Heating Type in Wall Lake
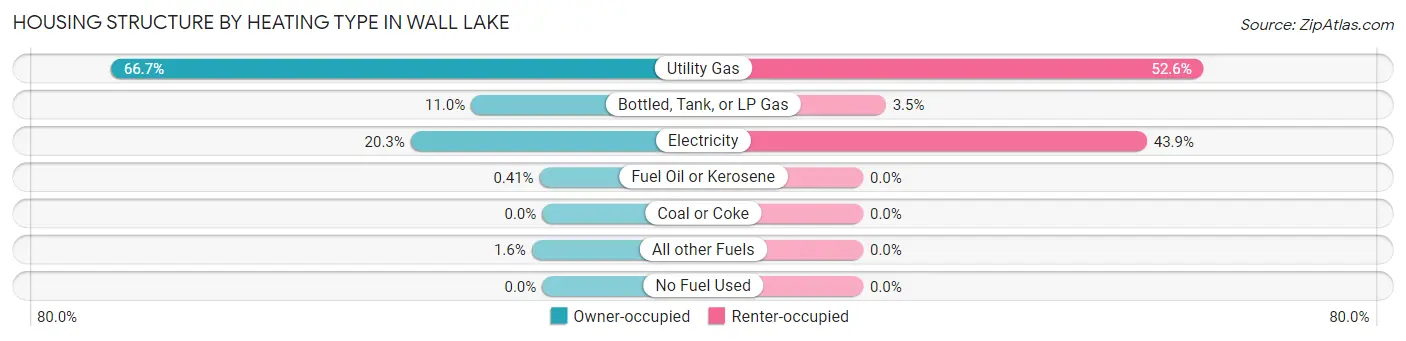
| Heating Type | Owner-occupied | Renter-occupied |
| Utility Gas | 164 (66.7%) | 30 (52.6%) |
| Bottled, Tank, or LP Gas | 27 (11.0%) | 2 (3.5%) |
| Electricity | 50 (20.3%) | 25 (43.9%) |
| Fuel Oil or Kerosene | 1 (0.4%) | 0 (0.0%) |
| Coal or Coke | 0 (0.0%) | 0 (0.0%) |
| All other Fuels | 4 (1.6%) | 0 (0.0%) |
| No Fuel Used | 0 (0.0%) | 0 (0.0%) |
| Total | 246 (100.0%) | 57 (100.0%) |
Household Vehicle Usage in Wall Lake
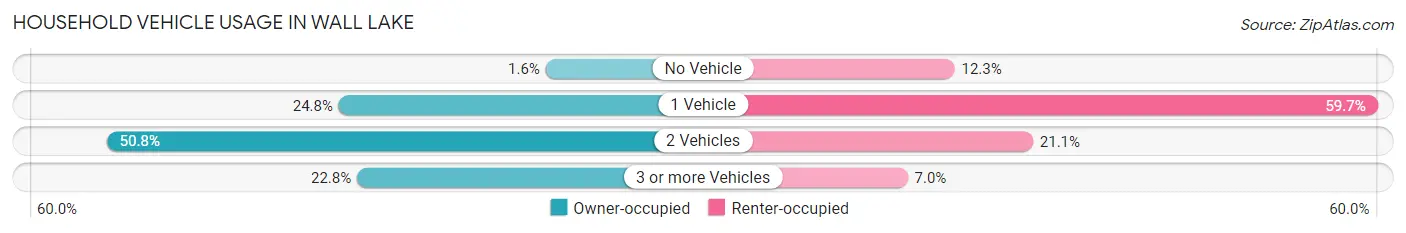
| Vehicles per Household | Owner-occupied | Renter-occupied |
| No Vehicle | 4 (1.6%) | 7 (12.3%) |
| 1 Vehicle | 61 (24.8%) | 34 (59.7%) |
| 2 Vehicles | 125 (50.8%) | 12 (21.0%) |
| 3 or more Vehicles | 56 (22.8%) | 4 (7.0%) |
| Total | 246 (100.0%) | 57 (100.0%) |
Real Estate & Mortgages in Wall Lake
Real Estate and Mortgage Overview in Wall Lake
| Characteristic | Without Mortgage | With Mortgage |
| Housing Units | 147 | 99 |
| Median Property Value | $116,400 | $115,100 |
| Median Household Income | $55,368 | $3 |
| Monthly Housing Costs | $381 | $2 |
| Real Estate Taxes | $904 | $0 |
Property Value by Mortgage Status in Wall Lake
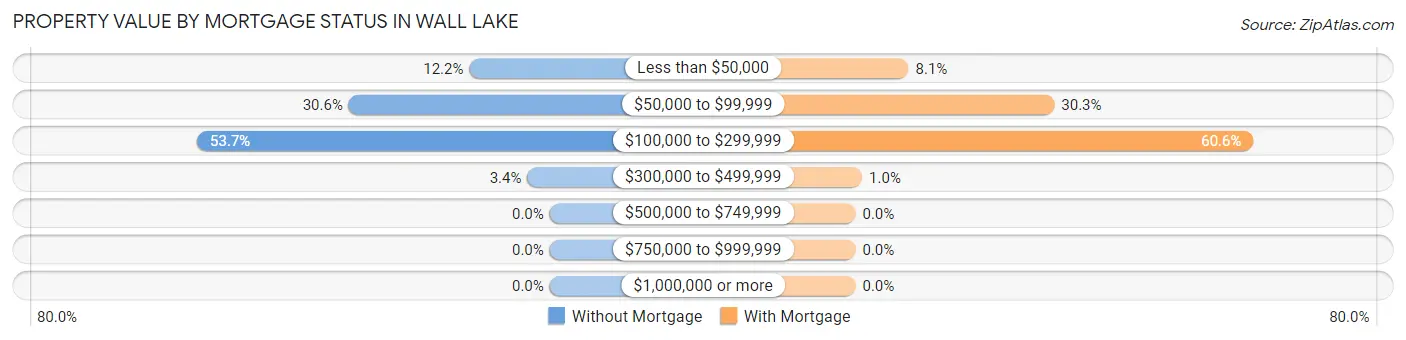
| Property Value | Without Mortgage | With Mortgage |
| Less than $50,000 | 18 (12.2%) | 8 (8.1%) |
| $50,000 to $99,999 | 45 (30.6%) | 30 (30.3%) |
| $100,000 to $299,999 | 79 (53.7%) | 60 (60.6%) |
| $300,000 to $499,999 | 5 (3.4%) | 1 (1.0%) |
| $500,000 to $749,999 | 0 (0.0%) | 0 (0.0%) |
| $750,000 to $999,999 | 0 (0.0%) | 0 (0.0%) |
| $1,000,000 or more | 0 (0.0%) | 0 (0.0%) |
| Total | 147 (100.0%) | 99 (100.0%) |
Household Income by Mortgage Status in Wall Lake
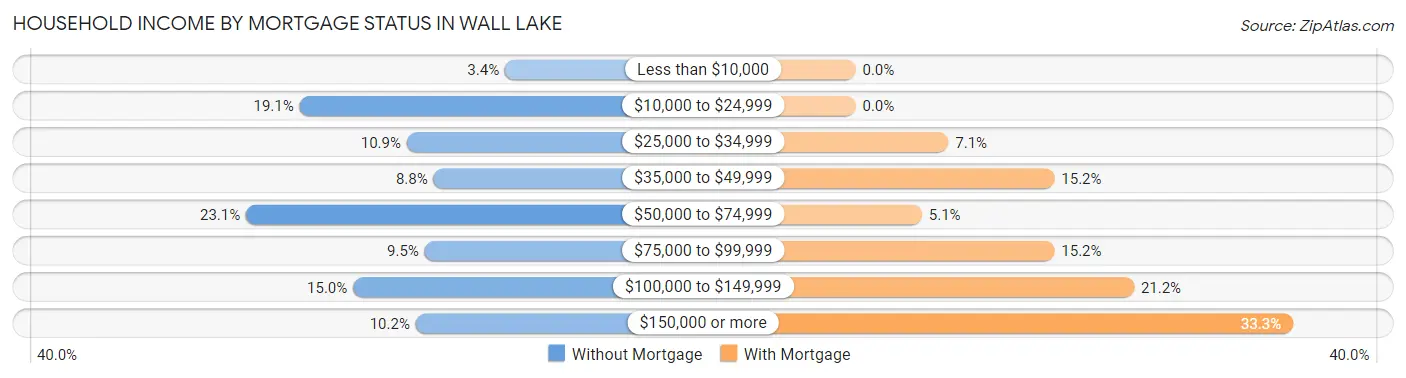
| Household Income | Without Mortgage | With Mortgage |
| Less than $10,000 | 5 (3.4%) | 0 (0.0%) |
| $10,000 to $24,999 | 28 (19.1%) | 0 (0.0%) |
| $25,000 to $34,999 | 16 (10.9%) | 7 (7.1%) |
| $35,000 to $49,999 | 13 (8.8%) | 15 (15.1%) |
| $50,000 to $74,999 | 34 (23.1%) | 5 (5.1%) |
| $75,000 to $99,999 | 14 (9.5%) | 15 (15.1%) |
| $100,000 to $149,999 | 22 (15.0%) | 21 (21.2%) |
| $150,000 or more | 15 (10.2%) | 33 (33.3%) |
| Total | 147 (100.0%) | 99 (100.0%) |
Property Value to Household Income Ratio in Wall Lake
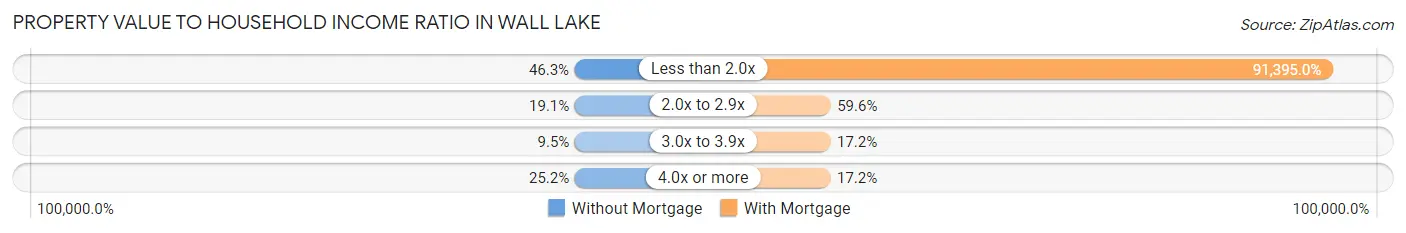
| Value-to-Income Ratio | Without Mortgage | With Mortgage |
| Less than 2.0x | 68 (46.3%) | 90,481 (91,394.9%) |
| 2.0x to 2.9x | 28 (19.1%) | 59 (59.6%) |
| 3.0x to 3.9x | 14 (9.5%) | 17 (17.2%) |
| 4.0x or more | 37 (25.2%) | 17 (17.2%) |
| Total | 147 (100.0%) | 99 (100.0%) |
Real Estate Taxes by Mortgage Status in Wall Lake
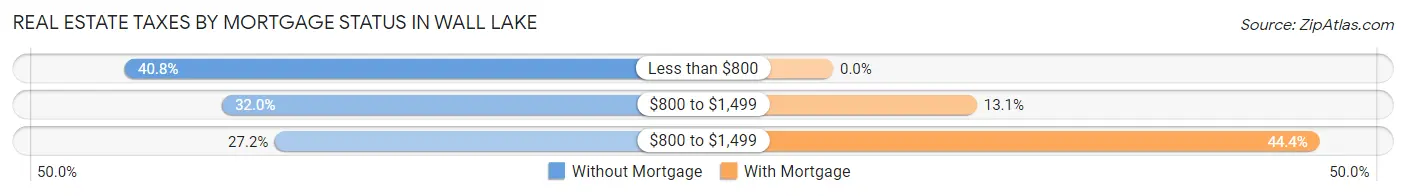
| Property Taxes | Without Mortgage | With Mortgage |
| Less than $800 | 60 (40.8%) | 0 (0.0%) |
| $800 to $1,499 | 47 (32.0%) | 13 (13.1%) |
| $800 to $1,499 | 40 (27.2%) | 44 (44.4%) |
| Total | 147 (100.0%) | 99 (100.0%) |
Health & Disability in Wall Lake
Health Insurance Coverage by Age in Wall Lake
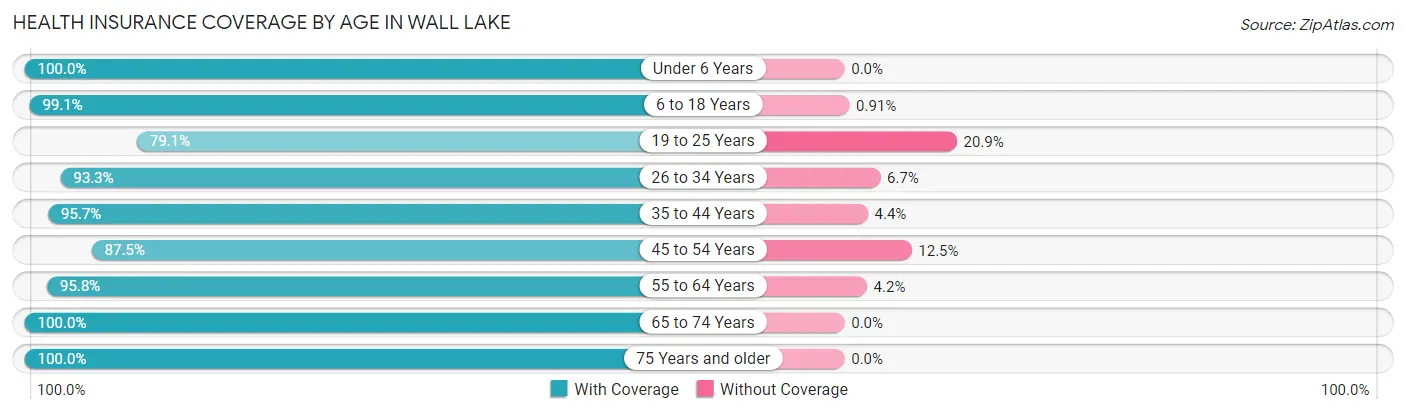
| Age Bracket | With Coverage | Without Coverage |
| Under 6 Years | 39 (100.0%) | 0 (0.0%) |
| 6 to 18 Years | 109 (99.1%) | 1 (0.9%) |
| 19 to 25 Years | 34 (79.1%) | 9 (20.9%) |
| 26 to 34 Years | 56 (93.3%) | 4 (6.7%) |
| 35 to 44 Years | 44 (95.7%) | 2 (4.3%) |
| 45 to 54 Years | 56 (87.5%) | 8 (12.5%) |
| 55 to 64 Years | 92 (95.8%) | 4 (4.2%) |
| 65 to 74 Years | 114 (100.0%) | 0 (0.0%) |
| 75 Years and older | 77 (100.0%) | 0 (0.0%) |
| Total | 621 (95.7%) | 28 (4.3%) |
Health Insurance Coverage by Citizenship Status in Wall Lake
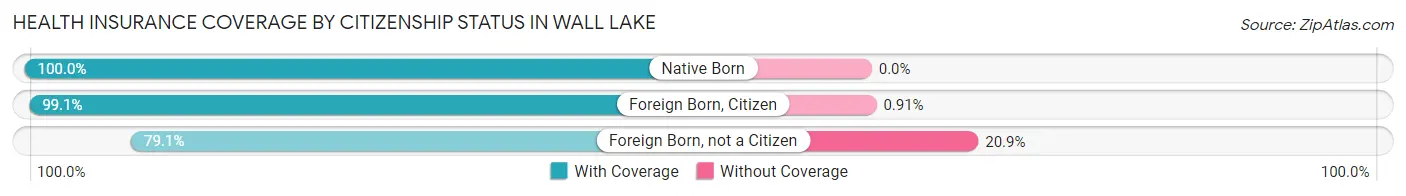
| Citizenship Status | With Coverage | Without Coverage |
| Native Born | 39 (100.0%) | 0 (0.0%) |
| Foreign Born, Citizen | 109 (99.1%) | 1 (0.9%) |
| Foreign Born, not a Citizen | 34 (79.1%) | 9 (20.9%) |
Health Insurance Coverage by Household Income in Wall Lake
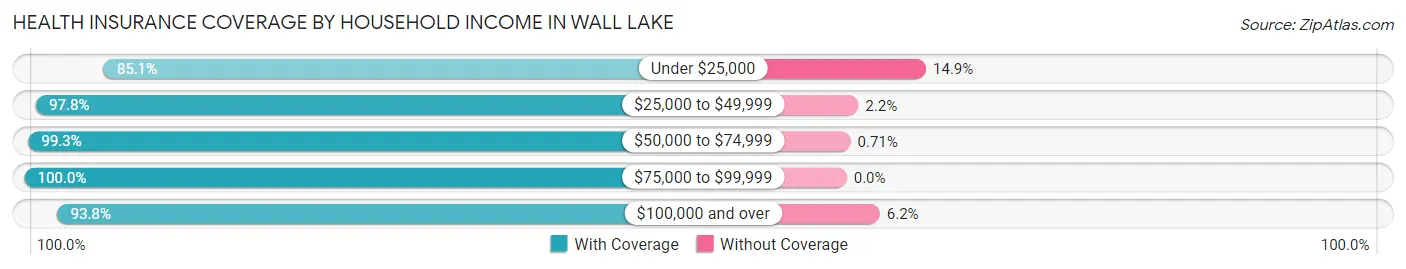
| Household Income | With Coverage | Without Coverage |
| Under $25,000 | 63 (85.1%) | 11 (14.9%) |
| $25,000 to $49,999 | 90 (97.8%) | 2 (2.2%) |
| $50,000 to $74,999 | 140 (99.3%) | 1 (0.7%) |
| $75,000 to $99,999 | 116 (100.0%) | 0 (0.0%) |
| $100,000 and over | 212 (93.8%) | 14 (6.2%) |
Public vs Private Health Insurance Coverage by Age in Wall Lake
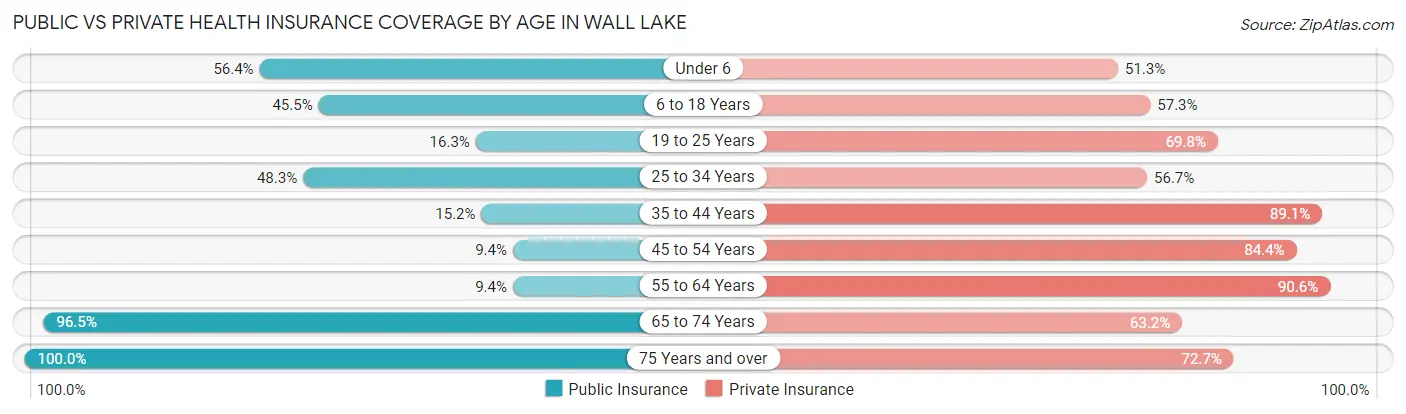
| Age Bracket | Public Insurance | Private Insurance |
| Under 6 | 22 (56.4%) | 20 (51.3%) |
| 6 to 18 Years | 50 (45.5%) | 63 (57.3%) |
| 19 to 25 Years | 7 (16.3%) | 30 (69.8%) |
| 25 to 34 Years | 29 (48.3%) | 34 (56.7%) |
| 35 to 44 Years | 7 (15.2%) | 41 (89.1%) |
| 45 to 54 Years | 6 (9.4%) | 54 (84.4%) |
| 55 to 64 Years | 9 (9.4%) | 87 (90.6%) |
| 65 to 74 Years | 110 (96.5%) | 72 (63.2%) |
| 75 Years and over | 77 (100.0%) | 56 (72.7%) |
| Total | 317 (48.8%) | 457 (70.4%) |
Disability Status by Sex by Age in Wall Lake
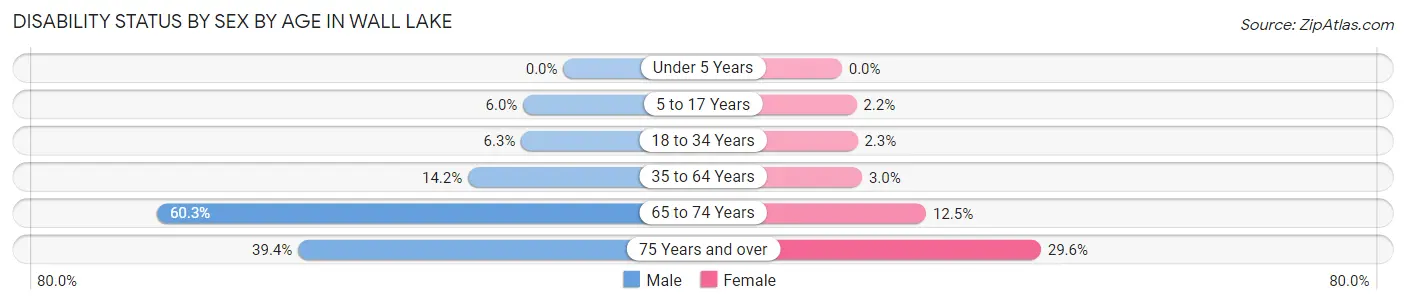
| Age Bracket | Male | Female |
| Under 5 Years | 0 (0.0%) | 0 (0.0%) |
| 5 to 17 Years | 4 (6.0%) | 1 (2.2%) |
| 18 to 34 Years | 4 (6.2%) | 1 (2.3%) |
| 35 to 64 Years | 15 (14.1%) | 3 (3.0%) |
| 65 to 74 Years | 35 (60.3%) | 7 (12.5%) |
| 75 Years and over | 13 (39.4%) | 13 (29.5%) |
Disability Class by Sex by Age in Wall Lake
Disability Class: Hearing Difficulty
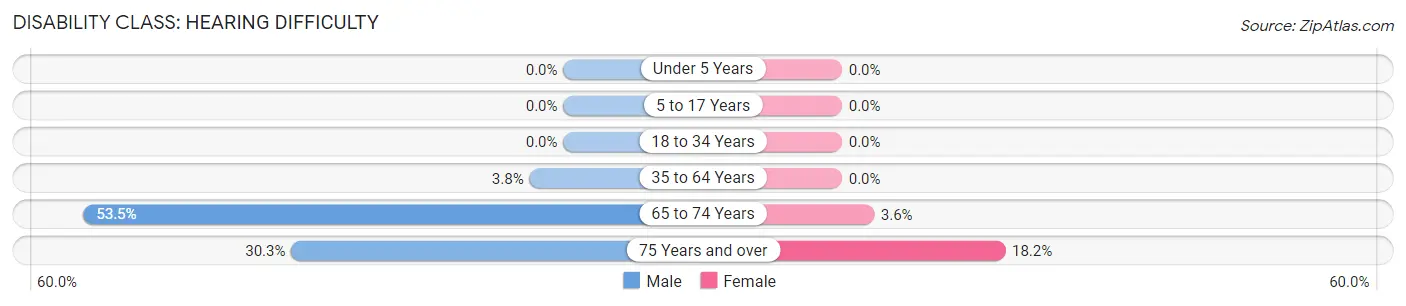
| Age Bracket | Male | Female |
| Under 5 Years | 0 (0.0%) | 0 (0.0%) |
| 5 to 17 Years | 0 (0.0%) | 0 (0.0%) |
| 18 to 34 Years | 0 (0.0%) | 0 (0.0%) |
| 35 to 64 Years | 4 (3.8%) | 0 (0.0%) |
| 65 to 74 Years | 31 (53.4%) | 2 (3.6%) |
| 75 Years and over | 10 (30.3%) | 8 (18.2%) |
Disability Class: Vision Difficulty
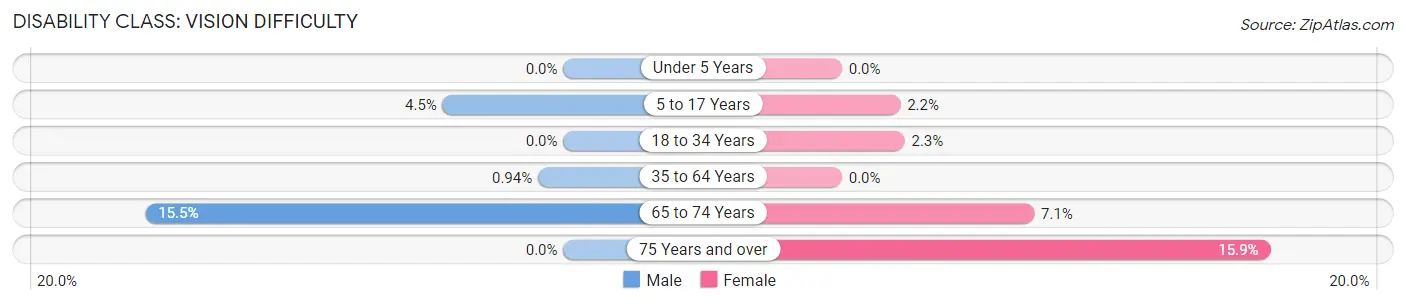
| Age Bracket | Male | Female |
| Under 5 Years | 0 (0.0%) | 0 (0.0%) |
| 5 to 17 Years | 3 (4.5%) | 1 (2.2%) |
| 18 to 34 Years | 0 (0.0%) | 1 (2.3%) |
| 35 to 64 Years | 1 (0.9%) | 0 (0.0%) |
| 65 to 74 Years | 9 (15.5%) | 4 (7.1%) |
| 75 Years and over | 0 (0.0%) | 7 (15.9%) |
Disability Class: Cognitive Difficulty
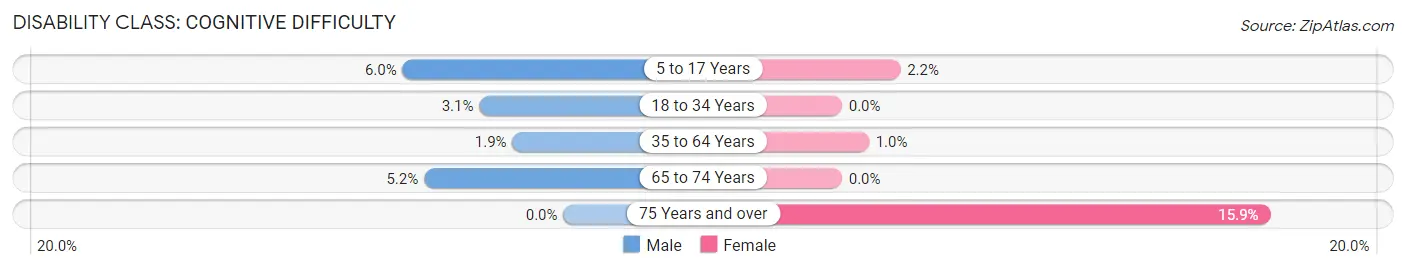
| Age Bracket | Male | Female |
| 5 to 17 Years | 4 (6.0%) | 1 (2.2%) |
| 18 to 34 Years | 2 (3.1%) | 0 (0.0%) |
| 35 to 64 Years | 2 (1.9%) | 1 (1.0%) |
| 65 to 74 Years | 3 (5.2%) | 0 (0.0%) |
| 75 Years and over | 0 (0.0%) | 7 (15.9%) |
Disability Class: Ambulatory Difficulty
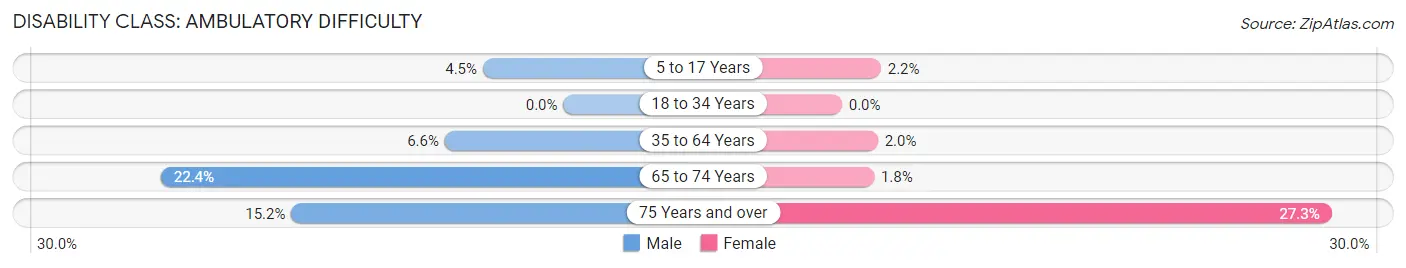
| Age Bracket | Male | Female |
| 5 to 17 Years | 3 (4.5%) | 1 (2.2%) |
| 18 to 34 Years | 0 (0.0%) | 0 (0.0%) |
| 35 to 64 Years | 7 (6.6%) | 2 (2.0%) |
| 65 to 74 Years | 13 (22.4%) | 1 (1.8%) |
| 75 Years and over | 5 (15.1%) | 12 (27.3%) |
Disability Class: Self-Care Difficulty
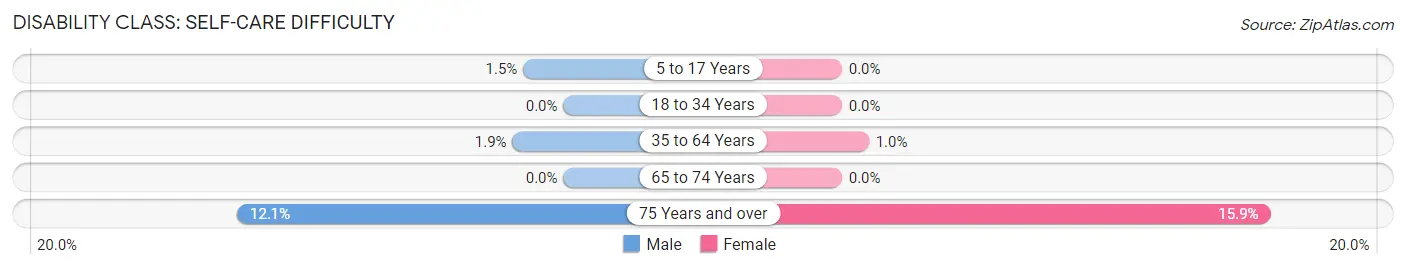
| Age Bracket | Male | Female |
| 5 to 17 Years | 1 (1.5%) | 0 (0.0%) |
| 18 to 34 Years | 0 (0.0%) | 0 (0.0%) |
| 35 to 64 Years | 2 (1.9%) | 1 (1.0%) |
| 65 to 74 Years | 0 (0.0%) | 0 (0.0%) |
| 75 Years and over | 4 (12.1%) | 7 (15.9%) |
Technology Access in Wall Lake
Computing Device Access in Wall Lake
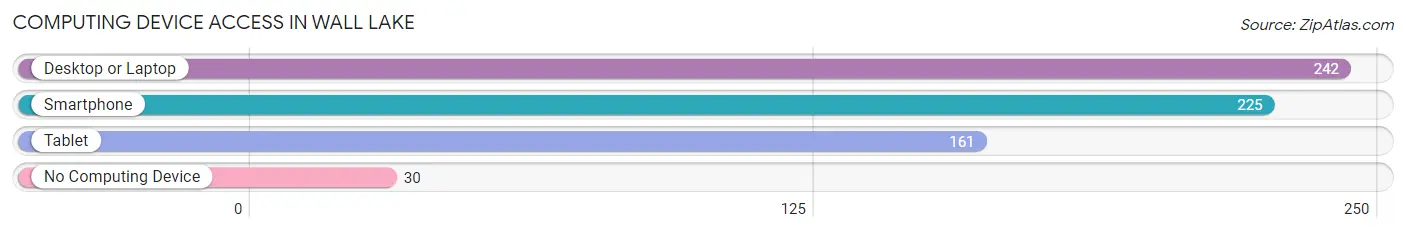
| Device Type | # Households | % Households |
| Desktop or Laptop | 242 | 79.9% |
| Smartphone | 225 | 74.3% |
| Tablet | 161 | 53.1% |
| No Computing Device | 30 | 9.9% |
| Total | 303 | 100.0% |
Internet Access in Wall Lake
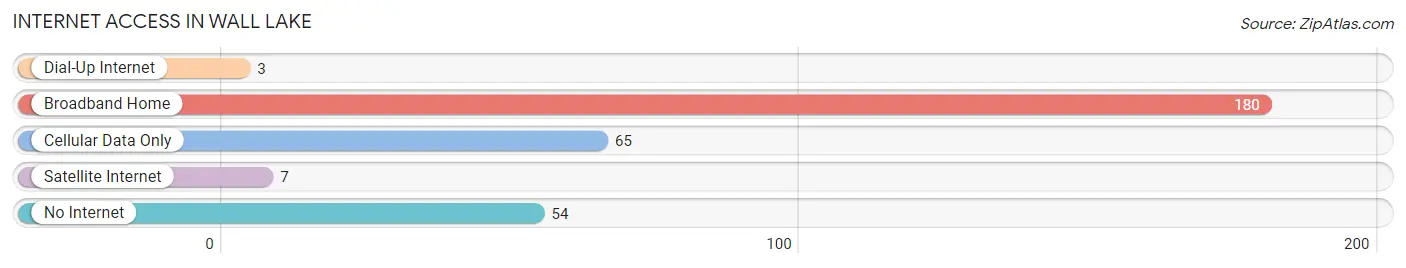
| Internet Type | # Households | % Households |
| Dial-Up Internet | 3 | 1.0% |
| Broadband Home | 180 | 59.4% |
| Cellular Data Only | 65 | 21.4% |
| Satellite Internet | 7 | 2.3% |
| No Internet | 54 | 17.8% |
| Total | 303 | 100.0% |
Wall Lake Summary
Wall Lake is a small city located in Sac County, Iowa, United States. It is situated on the western shore of Wall Lake, a natural lake in the area. The city has a population of approximately 500 people and is part of the Sioux City, IA–NE–SD Metropolitan Statistical Area.
History
The area around Wall Lake was first settled in the late 1800s by German immigrants. The city was officially incorporated in 1891 and was named after the lake. The lake was named after a local Native American chief, Chief Wall.
The city was initially a farming community, but in the early 1900s, the economy shifted to tourism. The lake was a popular destination for fishing and boating, and the city was home to several resorts.
In the 1950s, the city began to experience a decline in population as people moved away to larger cities. The city was able to maintain its population due to the influx of retirees who moved to the area.
Geography
Wall Lake is located in Sac County, Iowa, United States. It is situated on the western shore of Wall Lake, a natural lake in the area. The city has a total area of 0.7 square miles, all of which is land.
The city is located in the Loess Hills region of Iowa, which is characterized by rolling hills and deep ravines. The area is known for its rich soil and is home to a variety of wildlife.
Economy
The economy of Wall Lake is largely based on tourism. The city is home to several resorts and campgrounds, which attract visitors from all over the region. The lake is a popular destination for fishing and boating, and the city is home to several marinas.
The city is also home to several small businesses, including restaurants, retail stores, and service providers. The city is also home to a few manufacturing companies, which produce a variety of products.
Demographics
As of the 2010 census, the population of Wall Lake was 498. The racial makeup of the city was 97.2% White, 0.2% African American, 0.2% Native American, 0.4% Asian, 0.2% from other races, and 1.9% from two or more races. Hispanic or Latino of any race were 1.2% of the population.
The median household income in Wall Lake was $41,250, and the median family income was $48,750. The per capita income for the city was $20,945. About 8.2% of families and 10.2% of the population were below the poverty line, including 14.3% of those under age 18 and 6.3% of those age 65 or over.
Common Questions
What is Per Capita Income in Wall Lake?
Per Capita income in Wall Lake is $35,514.
What is the Median Family Income in Wall Lake?
Median Family Income in Wall Lake is $83,750.
What is the Median Household income in Wall Lake?
Median Household Income in Wall Lake is $63,125.
What is Income or Wage Gap in Wall Lake?
Income or Wage Gap in Wall Lake is 36.4%.
Women in Wall Lake earn 63.6 cents for every dollar earned by a man.
What is Family Income Deficit in Wall Lake?
Family Income Deficit in Wall Lake is $6,207.
Families that are below poverty line in Wall Lake earn $6,207 less on average than the poverty threshold level.
What is Inequality or Gini Index in Wall Lake?
Inequality or Gini Index in Wall Lake is 0.45.
What is the Total Population of Wall Lake?
Total Population of Wall Lake is 691.
What is the Total Male Population of Wall Lake?
Total Male Population of Wall Lake is 357.
What is the Total Female Population of Wall Lake?
Total Female Population of Wall Lake is 334.
What is the Ratio of Males per 100 Females in Wall Lake?
There are 106.89 Males per 100 Females in Wall Lake.
What is the Ratio of Females per 100 Males in Wall Lake?
There are 93.56 Females per 100 Males in Wall Lake.
What is the Median Population Age in Wall Lake?
Median Population Age in Wall Lake is 51.9 Years.
What is the Average Family Size in Wall Lake
Average Family Size in Wall Lake is 2.6 People.
What is the Average Household Size in Wall Lake
Average Household Size in Wall Lake is 2.1 People.
How Large is the Labor Force in Wall Lake?
There are 307 People in the Labor Forcein in Wall Lake.
What is the Percentage of People in the Labor Force in Wall Lake?
54.9% of People are in the Labor Force in Wall Lake.
What is the Unemployment Rate in Wall Lake?
Unemployment Rate in Wall Lake is 4.2%.