Wiota, IA Map & Demographics
Wiota Map
Wiota Overview
$42,870
PER CAPITA INCOME
$74,063
AVG FAMILY INCOME
$73,403
AVG HOUSEHOLD INCOME
50.9%
WAGE / INCOME GAP [ % ]
49.1¢/ $1
WAGE / INCOME GAP [ $ ]
0.29
INEQUALITY / GINI INDEX
84
TOTAL POPULATION
44
MALE POPULATION
40
FEMALE POPULATION
110.00
MALES / 100 FEMALES
90.91
FEMALES / 100 MALES
70.0
MEDIAN AGE
2.1
AVG FAMILY SIZE
1.7
AVG HOUSEHOLD SIZE
34
LABOR FORCE [ PEOPLE ]
40.5%
PERCENT IN LABOR FORCE
Wiota Zip Codes
Wiota Area Codes
Income in Wiota
Income Overview in Wiota
Per Capita Income in Wiota is $42,870, while median incomes of families and households are $74,063 and $73,403 respectively.
| Characteristic | Number | Measure |
| Per Capita Income | 84 | $42,870 |
| Median Family Income | 32 | $74,063 |
| Mean Family Income | 32 | $84,922 |
| Median Household Income | 49 | $73,403 |
| Mean Household Income | 49 | $72,857 |
| Income Deficit | 32 | $0 |
| Wage / Income Gap (%) | 84 | 50.89% |
| Wage / Income Gap ($) | 84 | 49.11¢ per $1 |
| Gini / Inequality Index | 84 | 0.29 |
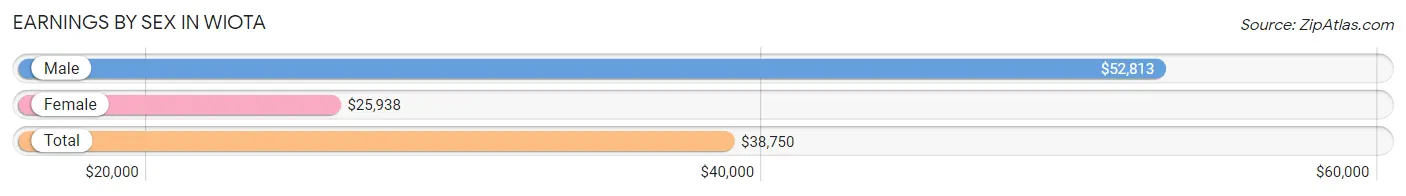
Earnings by Sex in Wiota
Average Earnings in Wiota are $38,750, $52,813 for men and $25,938 for women, a difference of 50.9%.
| Sex | Number | Average Earnings |
| Male | 21 (55.3%) | $52,813 |
| Female | 17 (44.7%) | $25,938 |
| Total | 38 (100.0%) | $38,750 |
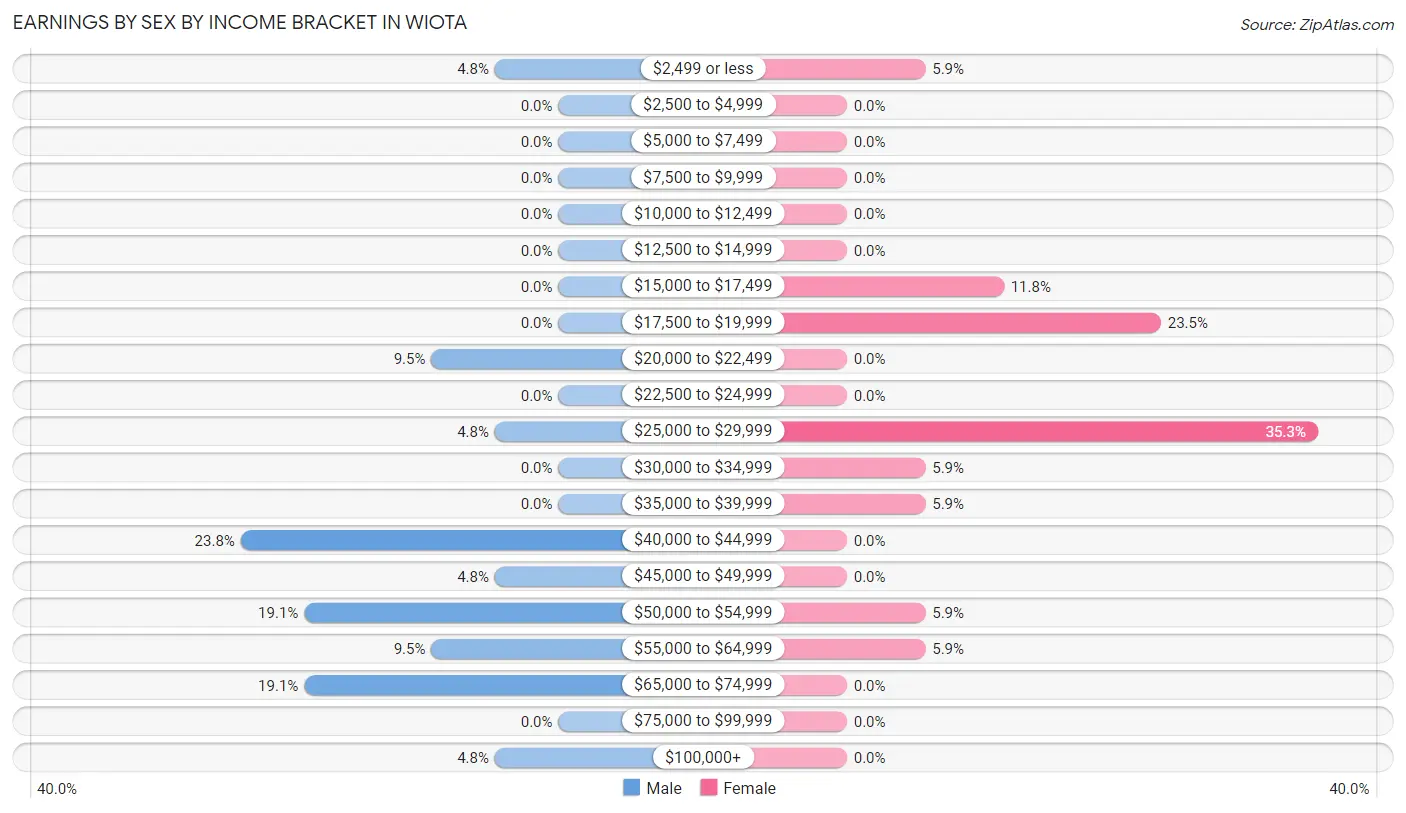
Earnings by Sex by Income Bracket in Wiota
The most common earnings brackets in Wiota are $40,000 to $44,999 for men (5 | 23.8%) and $25,000 to $29,999 for women (6 | 35.3%).
| Income | Male | Female |
| $2,499 or less | 1 (4.8%) | 1 (5.9%) |
| $2,500 to $4,999 | 0 (0.0%) | 0 (0.0%) |
| $5,000 to $7,499 | 0 (0.0%) | 0 (0.0%) |
| $7,500 to $9,999 | 0 (0.0%) | 0 (0.0%) |
| $10,000 to $12,499 | 0 (0.0%) | 0 (0.0%) |
| $12,500 to $14,999 | 0 (0.0%) | 0 (0.0%) |
| $15,000 to $17,499 | 0 (0.0%) | 2 (11.8%) |
| $17,500 to $19,999 | 0 (0.0%) | 4 (23.5%) |
| $20,000 to $22,499 | 2 (9.5%) | 0 (0.0%) |
| $22,500 to $24,999 | 0 (0.0%) | 0 (0.0%) |
| $25,000 to $29,999 | 1 (4.8%) | 6 (35.3%) |
| $30,000 to $34,999 | 0 (0.0%) | 1 (5.9%) |
| $35,000 to $39,999 | 0 (0.0%) | 1 (5.9%) |
| $40,000 to $44,999 | 5 (23.8%) | 0 (0.0%) |
| $45,000 to $49,999 | 1 (4.8%) | 0 (0.0%) |
| $50,000 to $54,999 | 4 (19.1%) | 1 (5.9%) |
| $55,000 to $64,999 | 2 (9.5%) | 1 (5.9%) |
| $65,000 to $74,999 | 4 (19.1%) | 0 (0.0%) |
| $75,000 to $99,999 | 0 (0.0%) | 0 (0.0%) |
| $100,000+ | 1 (4.8%) | 0 (0.0%) |
| Total | 21 (100.0%) | 17 (100.0%) |
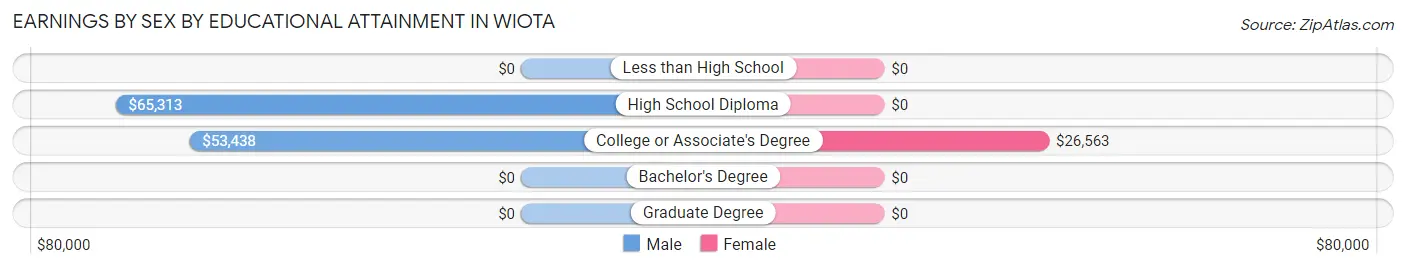
Earnings by Sex by Educational Attainment in Wiota
Average earnings in Wiota are $53,125 for men and $25,938 for women, a difference of 51.2%. Men with an educational attainment of high school diploma enjoy the highest average annual earnings of $65,313, while those with college or associate's degree education earn the least with $53,438. Women with an educational attainment of college or associate's degree earn the most with the average annual earnings of $26,563, while those with college or associate's degree education have the smallest earnings of $26,563.
| Educational Attainment | Male Income | Female Income |
| Less than High School | - | - |
| High School Diploma | $65,313 | $0 |
| College or Associate's Degree | $53,438 | $26,563 |
| Bachelor's Degree | - | - |
| Graduate Degree | - | - |
| Total | $53,125 | $25,938 |
Family Income in Wiota
Family Income Brackets in Wiota
According to the Wiota family income data, there are 20 families falling into the $50,000 to $74,999 income range, which is the most common income bracket and makes up 62.5% of all families.
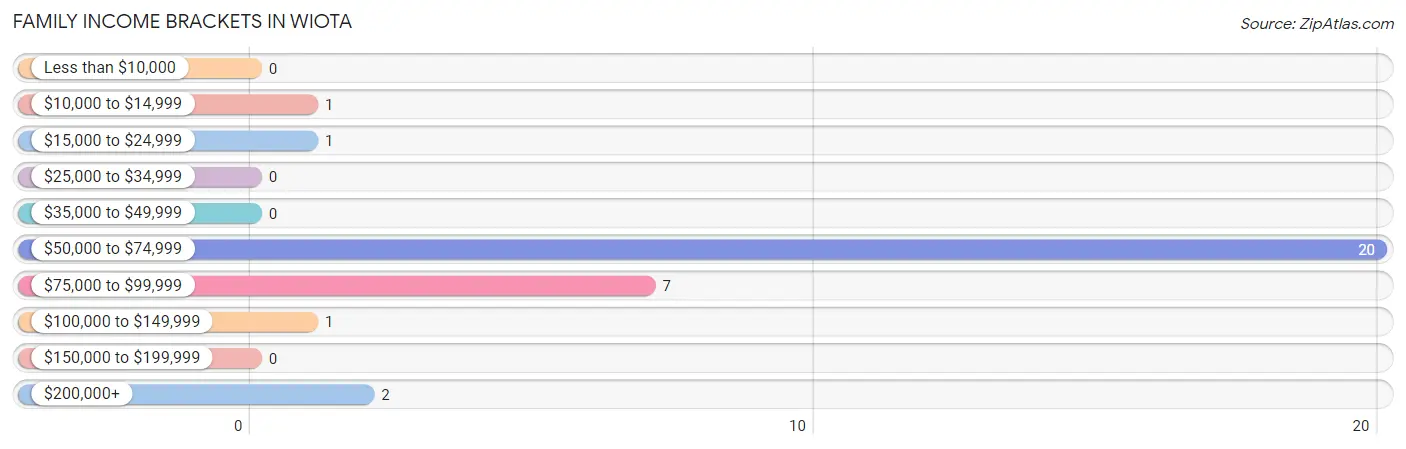
| Income Bracket | # Families | % Families |
| Less than $10,000 | 0 | 0.0% |
| $10,000 to $14,999 | 1 | 3.1% |
| $15,000 to $24,999 | 1 | 3.1% |
| $25,000 to $34,999 | 0 | 0.0% |
| $35,000 to $49,999 | 0 | 0.0% |
| $50,000 to $74,999 | 20 | 62.5% |
| $75,000 to $99,999 | 7 | 21.9% |
| $100,000 to $149,999 | 1 | 3.1% |
| $150,000 to $199,999 | 0 | 0.0% |
| $200,000+ | 2 | 6.3% |
Family Income by Famaliy Size in Wiota
2-person families (31 | 96.9%) account for the highest median family income in Wiota with $73,984 per family, while 2-person families (31 | 96.9%) have the highest median income of $36,992 per family member.
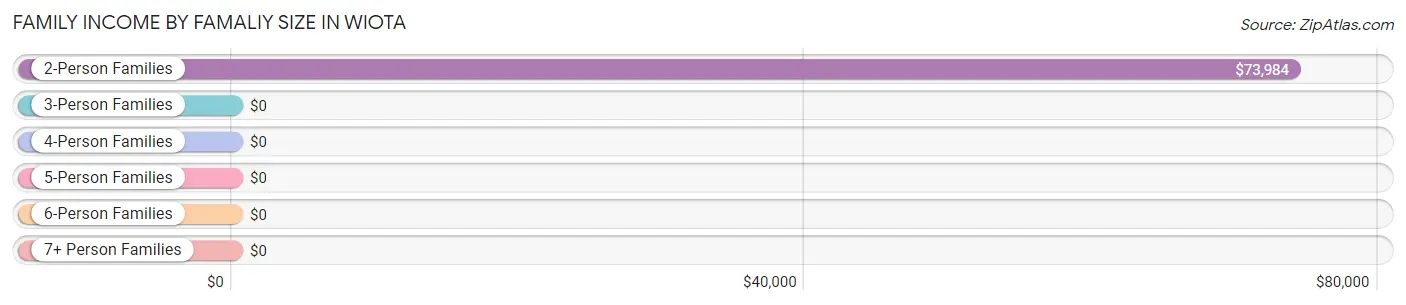
| Income Bracket | # Families | Median Income |
| 2-Person Families | 31 (96.9%) | $73,984 |
| 3-Person Families | 0 (0.0%) | $0 |
| 4-Person Families | 1 (3.1%) | $0 |
| 5-Person Families | 0 (0.0%) | $0 |
| 6-Person Families | 0 (0.0%) | $0 |
| 7+ Person Families | 0 (0.0%) | $0 |
| Total | 32 (100.0%) | $74,063 |
Family Income by Number of Earners in Wiota
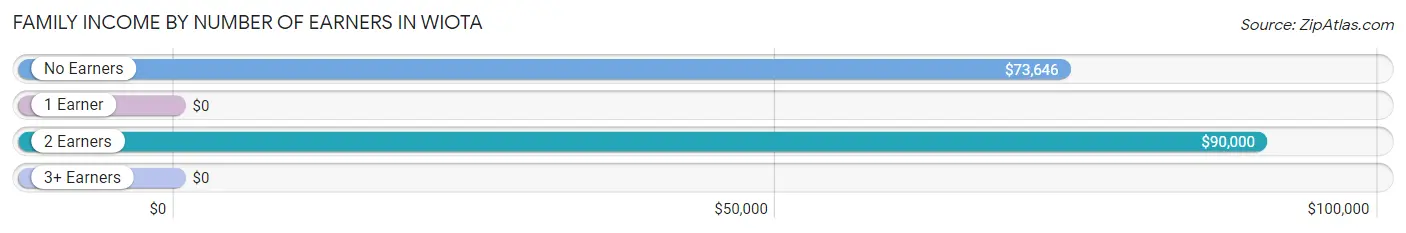
| Number of Earners | # Families | Median Income |
| No Earners | 17 (53.1%) | $73,646 |
| 1 Earner | 4 (12.5%) | $0 |
| 2 Earners | 10 (31.2%) | $90,000 |
| 3+ Earners | 1 (3.1%) | $0 |
| Total | 32 (100.0%) | $74,063 |
Household Income in Wiota
Household Income Brackets in Wiota
With 23 households falling in the category, the $50,000 to $74,999 income range is the most frequent in Wiota, accounting for 46.9% of all households.
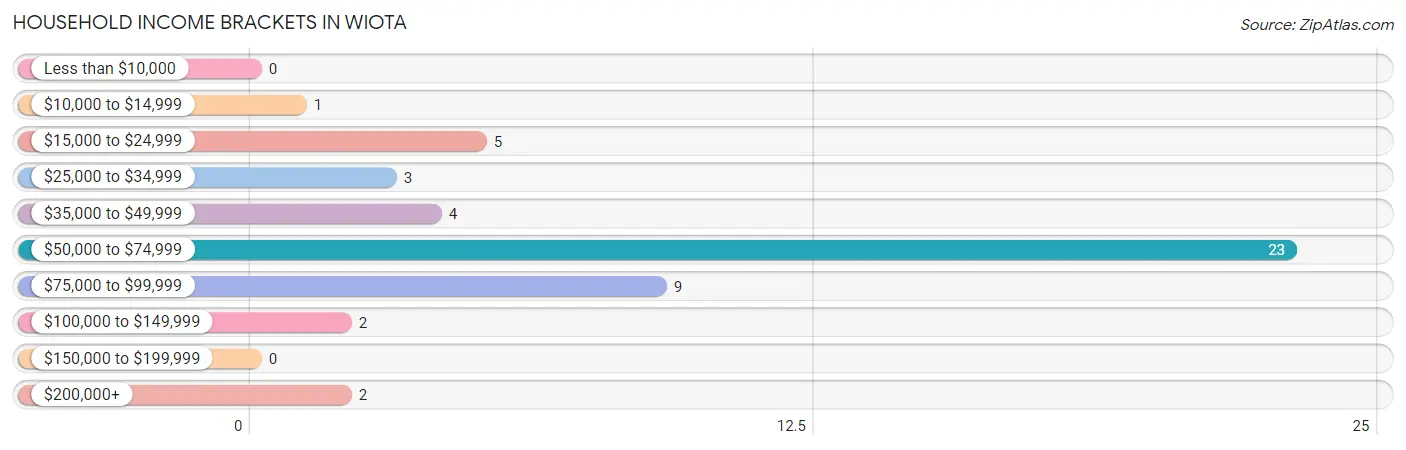
| Income Bracket | # Households | % Households |
| Less than $10,000 | 0 | 0.0% |
| $10,000 to $14,999 | 1 | 2.0% |
| $15,000 to $24,999 | 5 | 10.2% |
| $25,000 to $34,999 | 3 | 6.1% |
| $35,000 to $49,999 | 4 | 8.2% |
| $50,000 to $74,999 | 23 | 46.9% |
| $75,000 to $99,999 | 9 | 18.4% |
| $100,000 to $149,999 | 2 | 4.1% |
| $150,000 to $199,999 | 0 | 0.0% |
| $200,000+ | 2 | 4.1% |
Household Income by Householder Age in Wiota
The median household income in Wiota is $73,403, with the highest median household income of $76,250 found in the 45 to 64 years age bracket for the primary householder. A total of 14 households (28.6%) fall into this category.
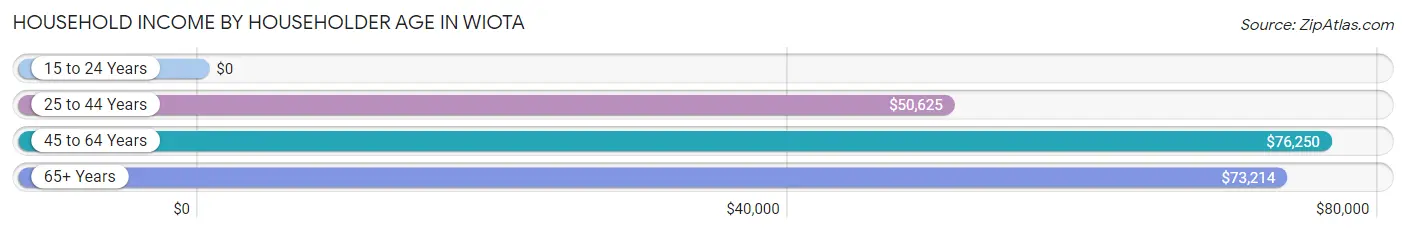
| Income Bracket | # Households | Median Income |
| 15 to 24 Years | 0 (0.0%) | $0 |
| 25 to 44 Years | 5 (10.2%) | $50,625 |
| 45 to 64 Years | 14 (28.6%) | $76,250 |
| 65+ Years | 30 (61.2%) | $73,214 |
| Total | 49 (100.0%) | $73,403 |
Poverty in Wiota
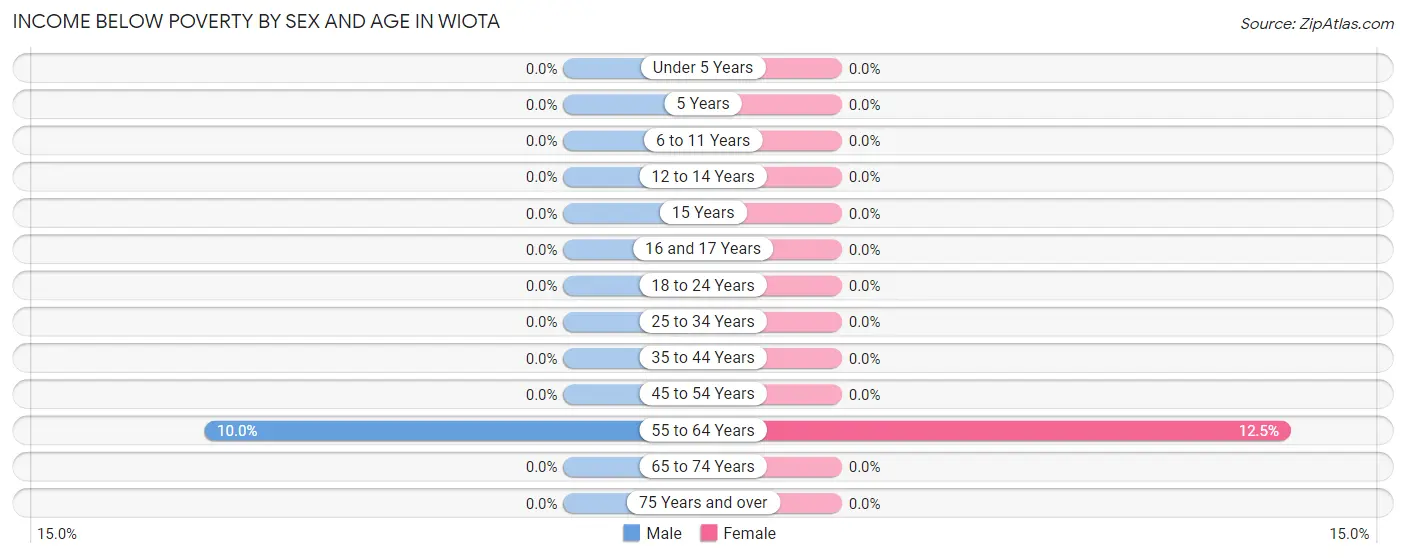
Income Below Poverty by Sex and Age in Wiota
With 2.3% poverty level for males and 2.5% for females among the residents of Wiota, 55 to 64 year old males and 55 to 64 year old females are the most vulnerable to poverty, with 1 males (10.0%) and 1 females (12.5%) in their respective age groups living below the poverty level.
| Age Bracket | Male | Female |
| Under 5 Years | 0 (0.0%) | 0 (0.0%) |
| 5 Years | 0 (0.0%) | 0 (0.0%) |
| 6 to 11 Years | 0 (0.0%) | 0 (0.0%) |
| 12 to 14 Years | 0 (0.0%) | 0 (0.0%) |
| 15 Years | 0 (0.0%) | 0 (0.0%) |
| 16 and 17 Years | 0 (0.0%) | 0 (0.0%) |
| 18 to 24 Years | 0 (0.0%) | 0 (0.0%) |
| 25 to 34 Years | 0 (0.0%) | 0 (0.0%) |
| 35 to 44 Years | 0 (0.0%) | 0 (0.0%) |
| 45 to 54 Years | 0 (0.0%) | 0 (0.0%) |
| 55 to 64 Years | 1 (10.0%) | 1 (12.5%) |
| 65 to 74 Years | 0 (0.0%) | 0 (0.0%) |
| 75 Years and over | 0 (0.0%) | 0 (0.0%) |
| Total | 1 (2.3%) | 1 (2.5%) |
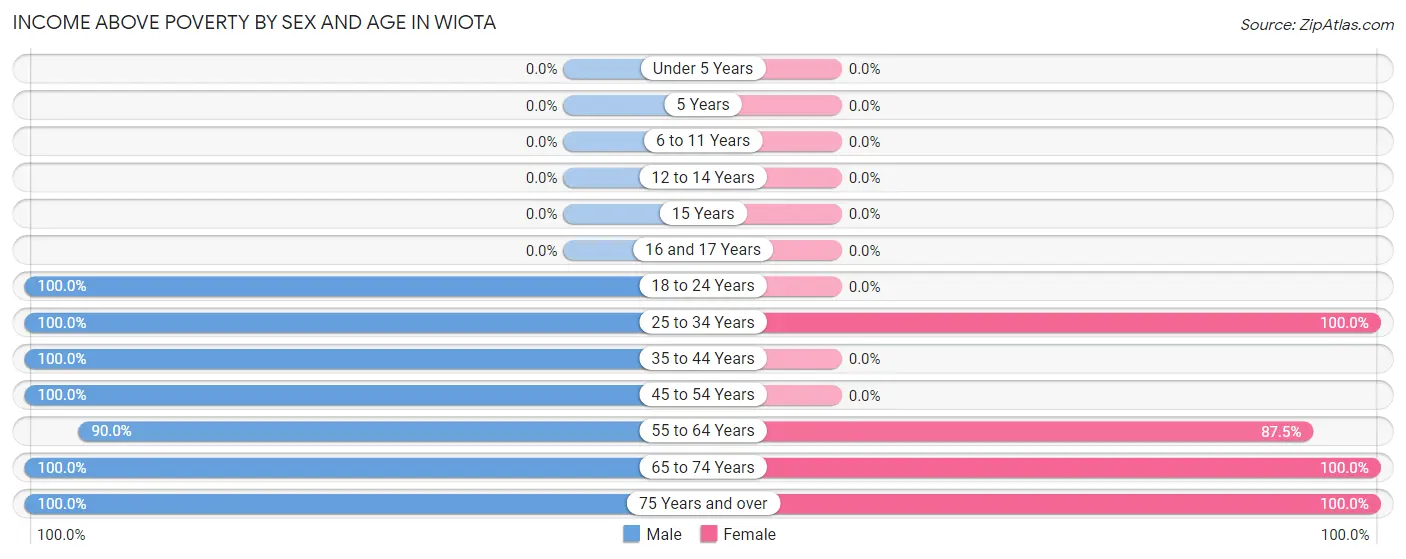
Income Above Poverty by Sex and Age in Wiota
According to the poverty statistics in Wiota, males aged 18 to 24 years and females aged 25 to 34 years are the age groups that are most secure financially, with 100.0% of males and 100.0% of females in these age groups living above the poverty line.
| Age Bracket | Male | Female |
| Under 5 Years | 0 (0.0%) | 0 (0.0%) |
| 5 Years | 0 (0.0%) | 0 (0.0%) |
| 6 to 11 Years | 0 (0.0%) | 0 (0.0%) |
| 12 to 14 Years | 0 (0.0%) | 0 (0.0%) |
| 15 Years | 0 (0.0%) | 0 (0.0%) |
| 16 and 17 Years | 0 (0.0%) | 0 (0.0%) |
| 18 to 24 Years | 1 (100.0%) | 0 (0.0%) |
| 25 to 34 Years | 2 (100.0%) | 5 (100.0%) |
| 35 to 44 Years | 2 (100.0%) | 0 (0.0%) |
| 45 to 54 Years | 4 (100.0%) | 0 (0.0%) |
| 55 to 64 Years | 9 (90.0%) | 7 (87.5%) |
| 65 to 74 Years | 10 (100.0%) | 7 (100.0%) |
| 75 Years and over | 15 (100.0%) | 20 (100.0%) |
| Total | 43 (97.7%) | 39 (97.5%) |
Income Below Poverty Among Married-Couple Families in Wiota
The poverty statistics for married-couple families in Wiota show that 3.1% or 1 of the total 32 families live below the poverty line. Families with no children have the highest poverty rate of 3.1%, comprising of 1 families. On the other hand, families with no children have the lowest poverty rate of 3.1%, which includes 1 families.
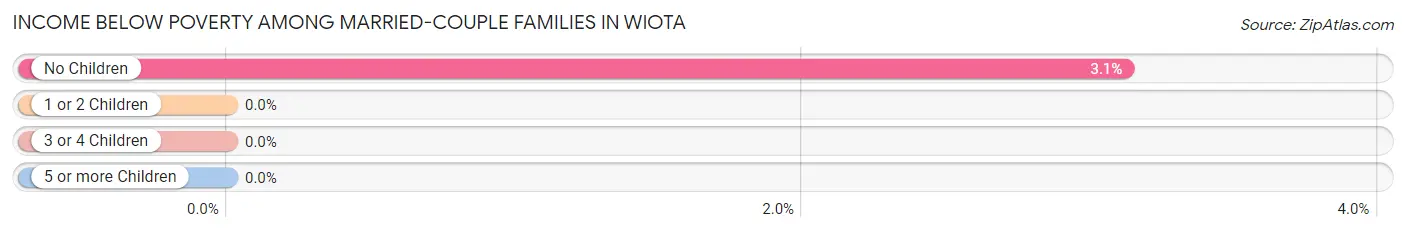
| Children | Above Poverty | Below Poverty |
| No Children | 31 (96.9%) | 1 (3.1%) |
| 1 or 2 Children | 0 (0.0%) | 0 (0.0%) |
| 3 or 4 Children | 0 (0.0%) | 0 (0.0%) |
| 5 or more Children | 0 (0.0%) | 0 (0.0%) |
| Total | 31 (96.9%) | 1 (3.1%) |
Income Below Poverty Among Single-Parent Households in Wiota
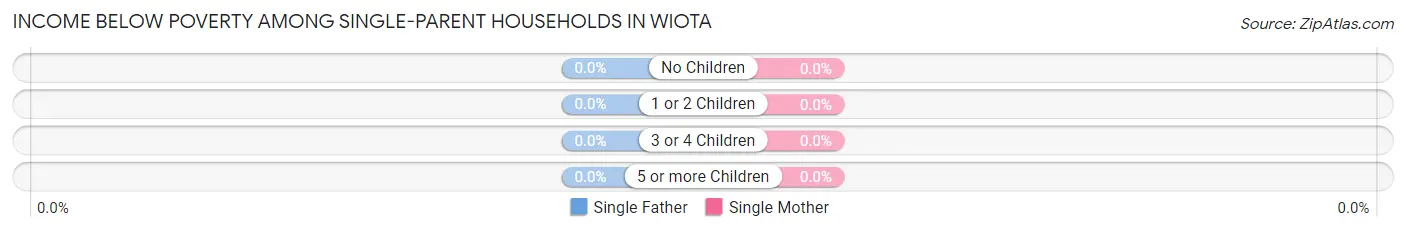
| Children | Single Father | Single Mother |
| No Children | 0 (0.0%) | 0 (0.0%) |
| 1 or 2 Children | 0 (0.0%) | 0 (0.0%) |
| 3 or 4 Children | 0 (0.0%) | 0 (0.0%) |
| 5 or more Children | 0 (0.0%) | 0 (0.0%) |
| Total | 0 (0.0%) | 0 (0.0%) |
Income Below Poverty Among Married-Couple vs Single-Parent Households in Wiota
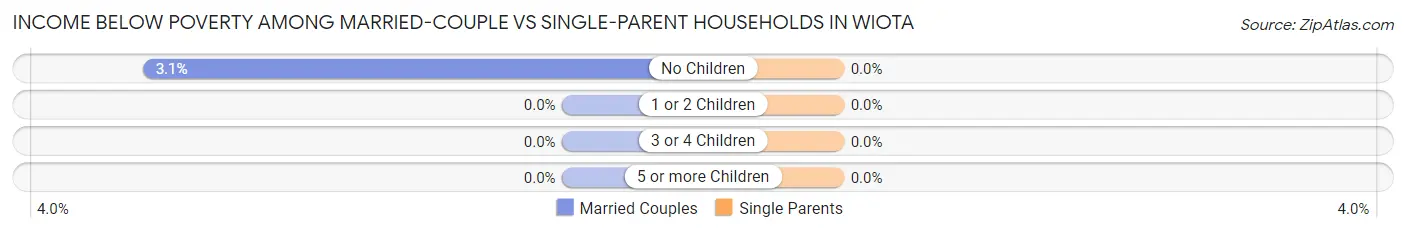
| Children | Married-Couple Families | Single-Parent Households |
| No Children | 1 (3.1%) | 0 (0.0%) |
| 1 or 2 Children | 0 (0.0%) | 0 (0.0%) |
| 3 or 4 Children | 0 (0.0%) | 0 (0.0%) |
| 5 or more Children | 0 (0.0%) | 0 (0.0%) |
| Total | 1 (3.1%) | 0 (0.0%) |
Race in Wiota
The most populous races in Wiota are , and White / Caucasian (84 | 100.0%).
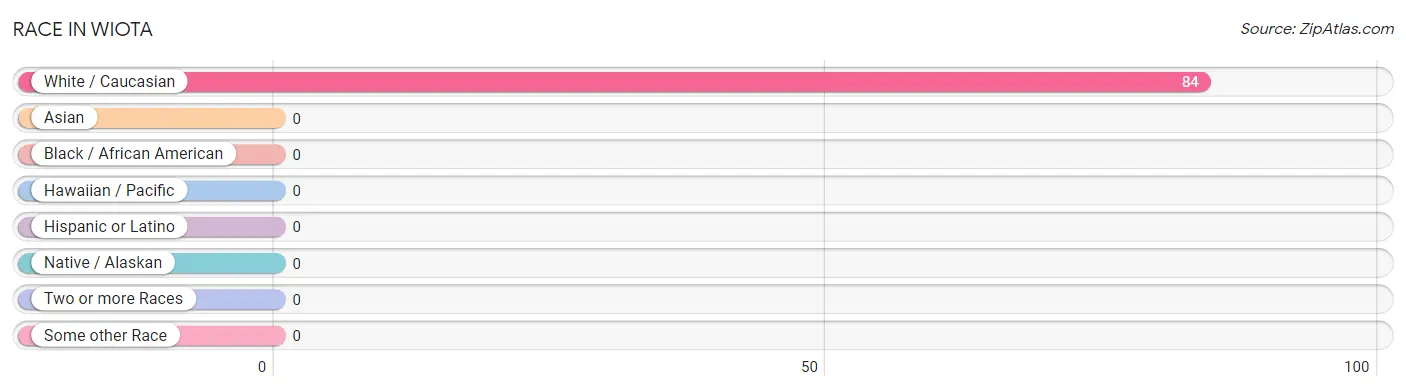
| Race | # Population | % Population |
| Asian | 0 | 0.0% |
| Black / African American | 0 | 0.0% |
| Hawaiian / Pacific | 0 | 0.0% |
| Hispanic or Latino | 0 | 0.0% |
| Native / Alaskan | 0 | 0.0% |
| White / Caucasian | 84 | 100.0% |
| Two or more Races | 0 | 0.0% |
| Some other Race | 0 | 0.0% |
| Total | 84 | 100.0% |
Ancestry in Wiota
The most populous ancestries reported in Wiota are German (30 | 35.7%), Irish (17 | 20.2%), American (8 | 9.5%), Danish (8 | 9.5%), and English (8 | 9.5%), together accounting for 84.5% of all Wiota residents.
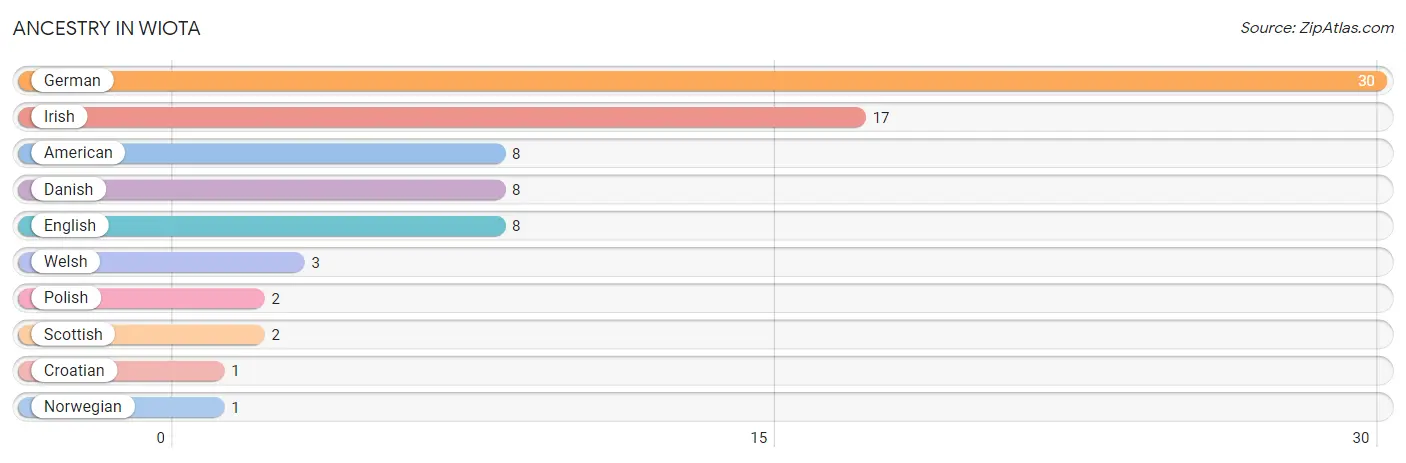
| Ancestry | # Population | % Population |
| American | 8 | 9.5% |
| Croatian | 1 | 1.2% |
| Danish | 8 | 9.5% |
| English | 8 | 9.5% |
| German | 30 | 35.7% |
| Irish | 17 | 20.2% |
| Norwegian | 1 | 1.2% |
| Polish | 2 | 2.4% |
| Scottish | 2 | 2.4% |
| Welsh | 3 | 3.6% | View All 10 Rows |
Immigrants in Wiota

| Immigration Origin | # Population | % Population | View All 0 Rows |
Sex and Age in Wiota
Sex and Age in Wiota
The most populous age groups in Wiota are 75 to 79 Years (13 | 29.5%) for men and 75 to 79 Years (18 | 45.0%) for women.
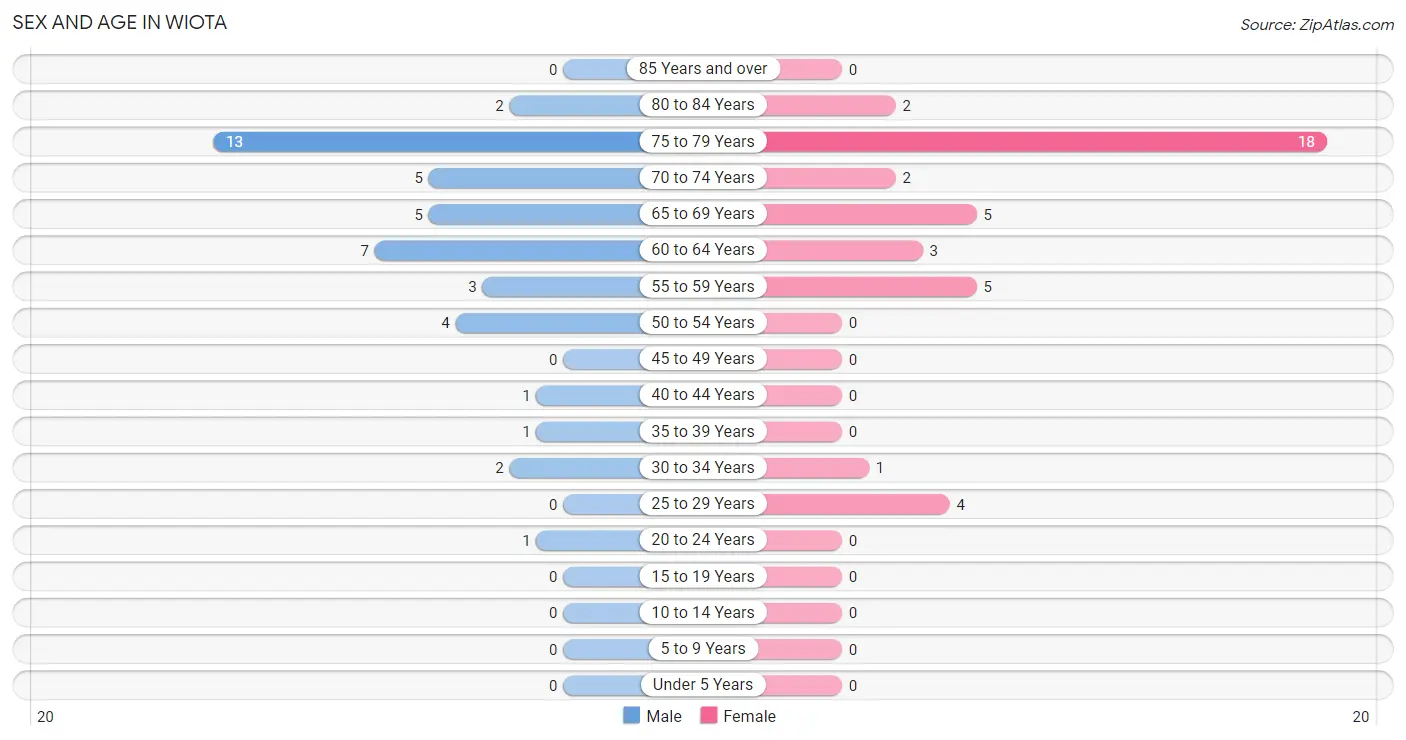
| Age Bracket | Male | Female |
| Under 5 Years | 0 (0.0%) | 0 (0.0%) |
| 5 to 9 Years | 0 (0.0%) | 0 (0.0%) |
| 10 to 14 Years | 0 (0.0%) | 0 (0.0%) |
| 15 to 19 Years | 0 (0.0%) | 0 (0.0%) |
| 20 to 24 Years | 1 (2.3%) | 0 (0.0%) |
| 25 to 29 Years | 0 (0.0%) | 4 (10.0%) |
| 30 to 34 Years | 2 (4.5%) | 1 (2.5%) |
| 35 to 39 Years | 1 (2.3%) | 0 (0.0%) |
| 40 to 44 Years | 1 (2.3%) | 0 (0.0%) |
| 45 to 49 Years | 0 (0.0%) | 0 (0.0%) |
| 50 to 54 Years | 4 (9.1%) | 0 (0.0%) |
| 55 to 59 Years | 3 (6.8%) | 5 (12.5%) |
| 60 to 64 Years | 7 (15.9%) | 3 (7.5%) |
| 65 to 69 Years | 5 (11.4%) | 5 (12.5%) |
| 70 to 74 Years | 5 (11.4%) | 2 (5.0%) |
| 75 to 79 Years | 13 (29.5%) | 18 (45.0%) |
| 80 to 84 Years | 2 (4.5%) | 2 (5.0%) |
| 85 Years and over | 0 (0.0%) | 0 (0.0%) |
| Total | 44 (100.0%) | 40 (100.0%) |
Families and Households in Wiota
Median Family Size in Wiota
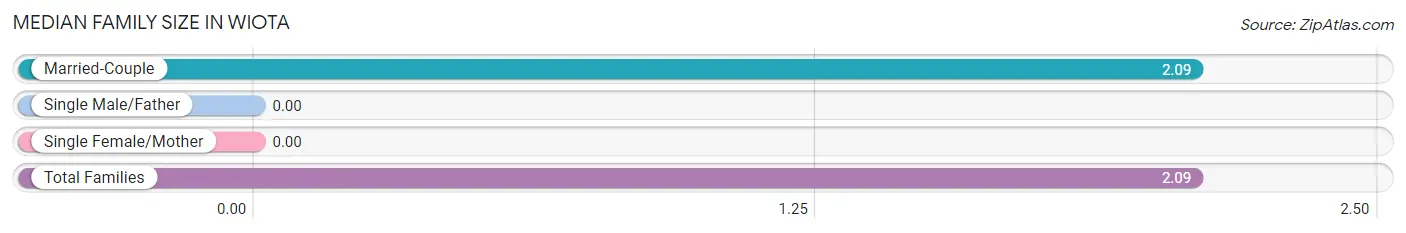
| Family Type | # Families | Family Size |
| Married-Couple | 32 (100.0%) | 2.09 |
| Single Male/Father | 0 (0.0%) | - |
| Single Female/Mother | 0 (0.0%) | - |
| Total Families | 32 (100.0%) | 2.09 |
Median Household Size in Wiota
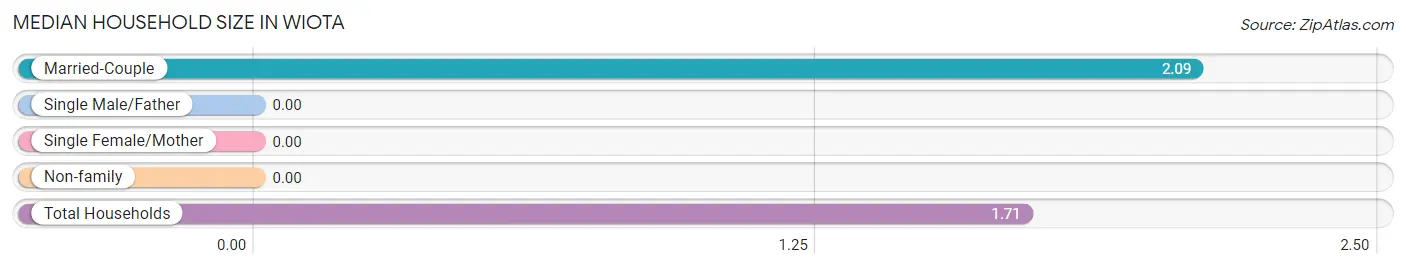
| Household Type | # Households | Household Size |
| Married-Couple | 32 (65.3%) | 2.09 |
| Single Male/Father | 0 (0.0%) | - |
| Single Female/Mother | 0 (0.0%) | - |
| Non-family | 17 (34.7%) | - |
| Total Households | 49 (100.0%) | 1.71 |
Household Size by Marriage Status in Wiota
Out of a total of 49 households in Wiota, 32 (65.3%) are family households, while 17 (34.7%) are nonfamily households. The most numerous type of family households are 2-person households, comprising 31, and the most common type of nonfamily households are 1-person households, comprising 17.
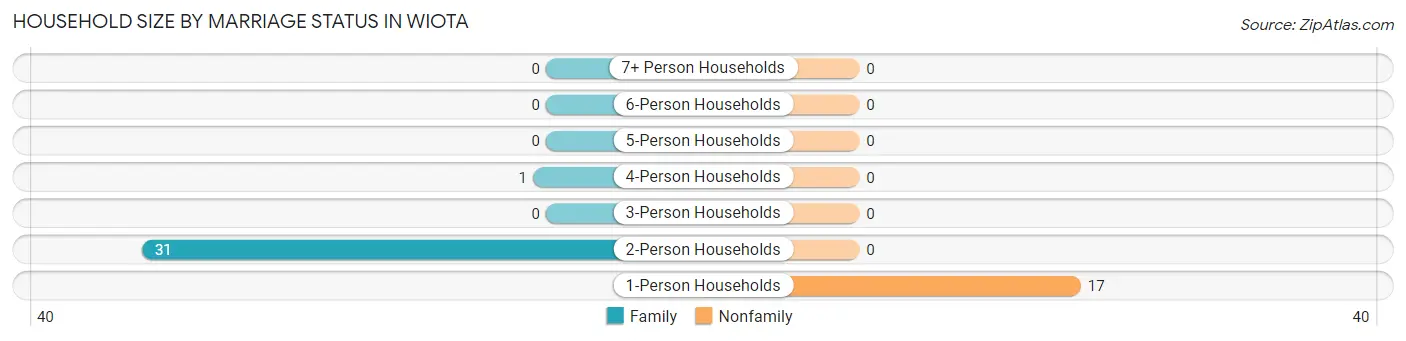
| Household Size | Family Households | Nonfamily Households |
| 1-Person Households | - | 17 (34.7%) |
| 2-Person Households | 31 (63.3%) | 0 (0.0%) |
| 3-Person Households | 0 (0.0%) | 0 (0.0%) |
| 4-Person Households | 1 (2.0%) | 0 (0.0%) |
| 5-Person Households | 0 (0.0%) | 0 (0.0%) |
| 6-Person Households | 0 (0.0%) | 0 (0.0%) |
| 7+ Person Households | 0 (0.0%) | 0 (0.0%) |
| Total | 32 (65.3%) | 17 (34.7%) |
Female Fertility in Wiota
Fertility by Age in Wiota
| Age Bracket | Women with Births | Births / 1,000 Women |
| 15 to 19 years | 0 (0.0%) | 0.0 |
| 20 to 34 years | 0 (0.0%) | 0.0 |
| 35 to 50 years | 0 (0.0%) | 0.0 |
| Total | 0 (0.0%) | 0.0 |
Fertility by Age by Marriage Status in Wiota
| Age Bracket | Married | Unmarried |
| 15 to 19 years | 0 (0.0%) | 0 (0.0%) |
| 20 to 34 years | 0 (0.0%) | 0 (0.0%) |
| 35 to 50 years | 0 (0.0%) | 0 (0.0%) |
| Total | 0 (0.0%) | 0 (0.0%) |
Fertility by Education in Wiota
| Educational Attainment | Women with Births | Births / 1,000 Women |
| Less than High School | 0 (0.0%) | 0.0 |
| High School Diploma | 0 (0.0%) | 0.0 |
| College or Associate's Degree | 0 (0.0%) | 0.0 |
| Bachelor's Degree | 0 (0.0%) | 0.0 |
| Graduate Degree | 0 (0.0%) | 0.0 |
| Total | 0 (0.0%) | 0.0 |
Fertility by Education by Marriage Status in Wiota
| Educational Attainment | Married | Unmarried |
| Less than High School | 0 (0.0%) | 0 (0.0%) |
| High School Diploma | 0 (0.0%) | 0 (0.0%) |
| College or Associate's Degree | 0 (0.0%) | 0 (0.0%) |
| Bachelor's Degree | 0 (0.0%) | 0 (0.0%) |
| Graduate Degree | 0 (0.0%) | 0 (0.0%) |
| Total | 0 (0.0%) | 0 (0.0%) |
Employment Characteristics in Wiota
Employment by Class of Employer in Wiota
Among the 34 employed individuals in Wiota, private company employees (27 | 79.4%), self-employed (not incorporated) (4 | 11.8%), and self-employed (incorporated) (2 | 5.9%) make up the most common classes of employment.
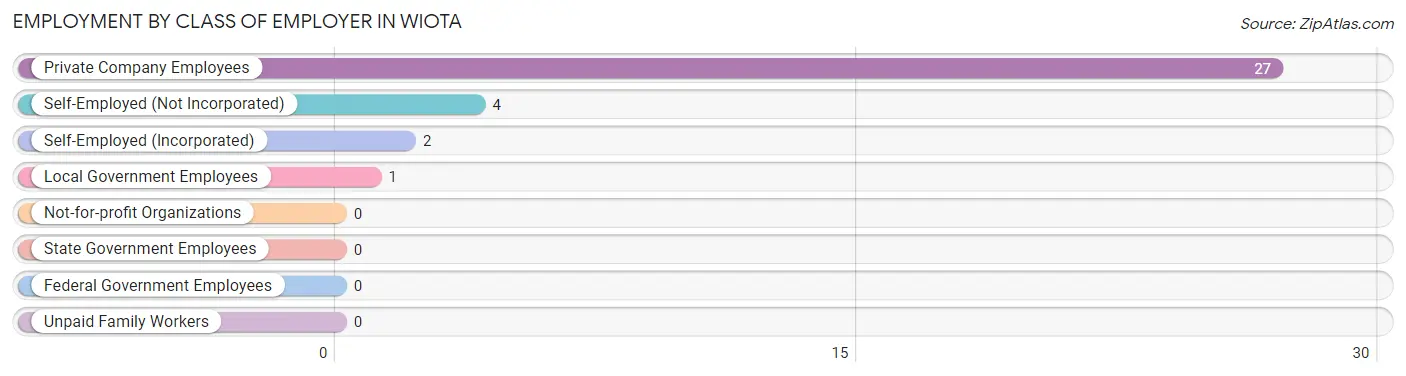
| Employer Class | # Employees | % Employees |
| Private Company Employees | 27 | 79.4% |
| Self-Employed (Incorporated) | 2 | 5.9% |
| Self-Employed (Not Incorporated) | 4 | 11.8% |
| Not-for-profit Organizations | 0 | 0.0% |
| Local Government Employees | 1 | 2.9% |
| State Government Employees | 0 | 0.0% |
| Federal Government Employees | 0 | 0.0% |
| Unpaid Family Workers | 0 | 0.0% |
| Total | 34 | 100.0% |
Employment Status by Age in Wiota
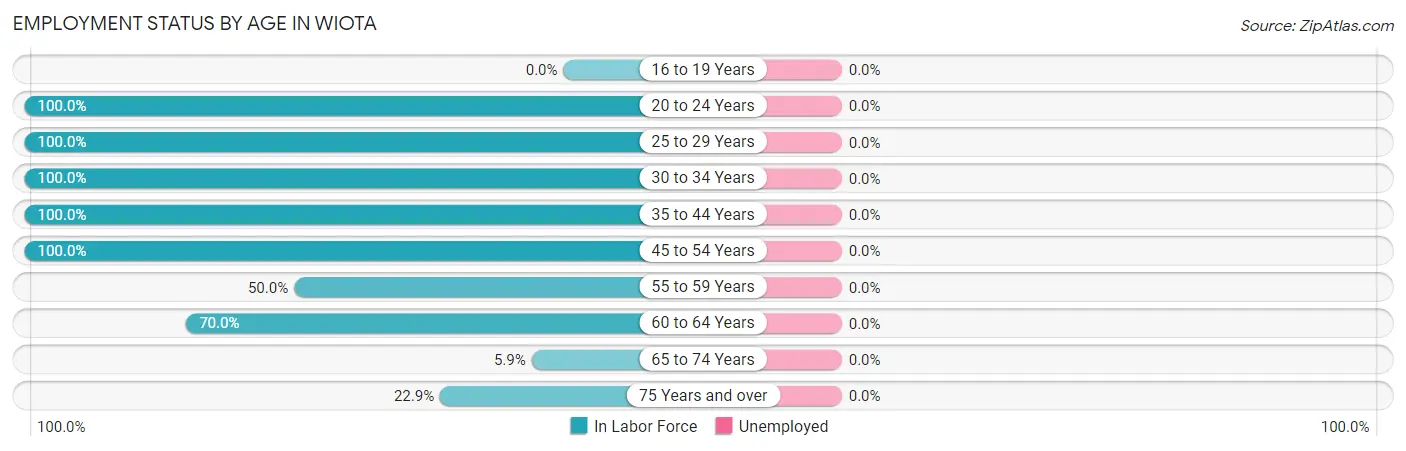
| Age Bracket | In Labor Force | Unemployed |
| 16 to 19 Years | 0 (0.0%) | 0 (0.0%) |
| 20 to 24 Years | 1 (100.0%) | 0 (0.0%) |
| 25 to 29 Years | 4 (100.0%) | 0 (0.0%) |
| 30 to 34 Years | 3 (100.0%) | 0 (0.0%) |
| 35 to 44 Years | 2 (100.0%) | 0 (0.0%) |
| 45 to 54 Years | 4 (100.0%) | 0 (0.0%) |
| 55 to 59 Years | 4 (50.0%) | 0 (0.0%) |
| 60 to 64 Years | 7 (70.0%) | 0 (0.0%) |
| 65 to 74 Years | 1 (5.9%) | 0 (0.0%) |
| 75 Years and over | 8 (22.9%) | 0 (0.0%) |
| Total | 34 (40.5%) | 0 (0.0%) |
Employment Status by Educational Attainment in Wiota
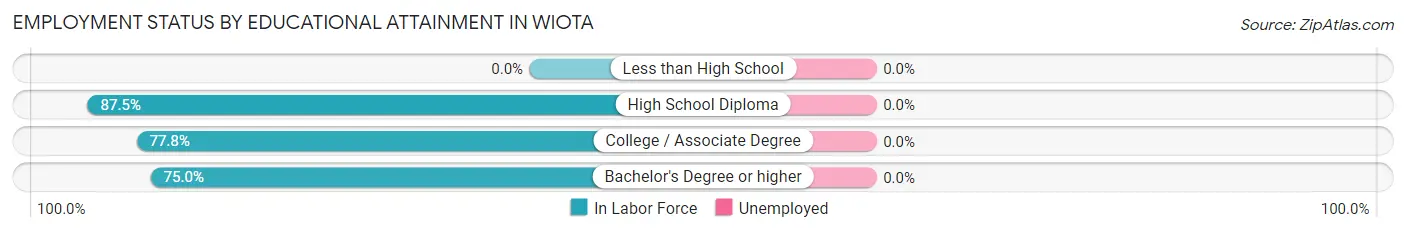
| Educational Attainment | In Labor Force | Unemployed |
| Less than High School | 0 (0.0%) | 0 (0.0%) |
| High School Diploma | 7 (87.5%) | 0 (0.0%) |
| College / Associate Degree | 14 (77.8%) | 0 (0.0%) |
| Bachelor's Degree or higher | 3 (75.0%) | 0 (0.0%) |
| Total | 24 (77.4%) | 0 (0.0%) |
Employment Occupations by Sex in Wiota
Management, Business, Science and Arts Occupations
The most common Management, Business, Science and Arts occupations in Wiota are Business & Financial (2 | 5.9%), Management (1 | 2.9%), Computers, Engineering & Science (1 | 2.9%), Architecture & Engineering (1 | 2.9%), and Health Diagnosing & Treating (1 | 2.9%).
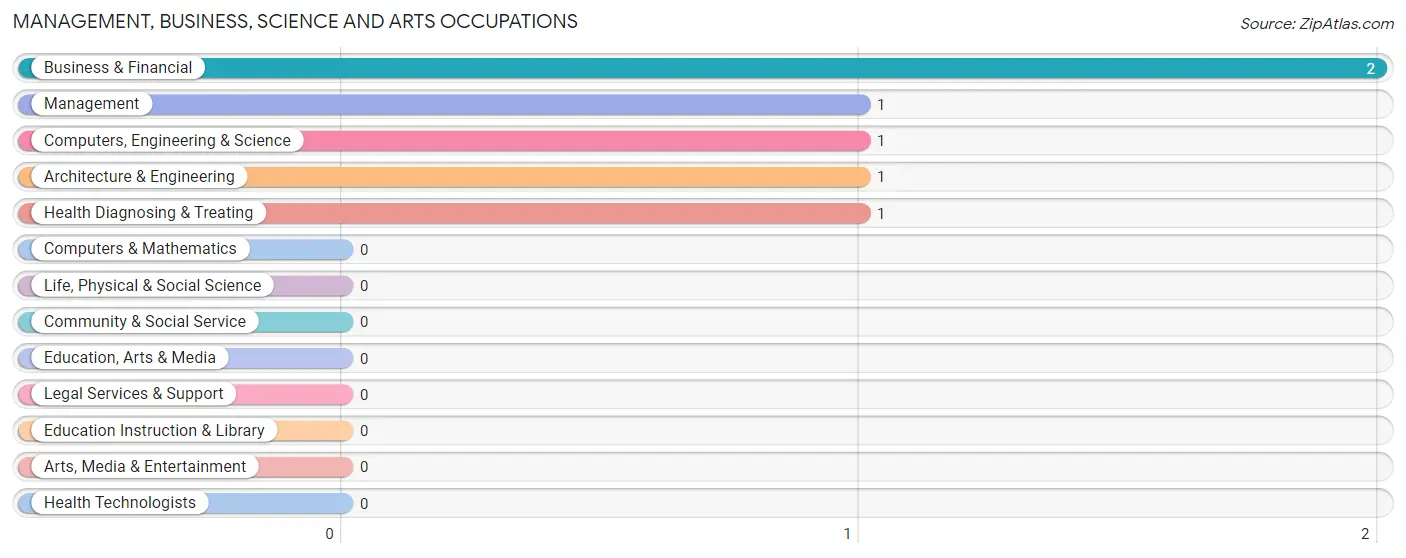
Management, Business, Science and Arts Occupations by Sex
Within the Management, Business, Science and Arts occupations in Wiota, the most male-oriented occupations are Computers, Engineering & Science (100.0%), Architecture & Engineering (100.0%), and Health Diagnosing & Treating (100.0%), while the most female-oriented occupations are Management (100.0%), and Business & Financial (50.0%).
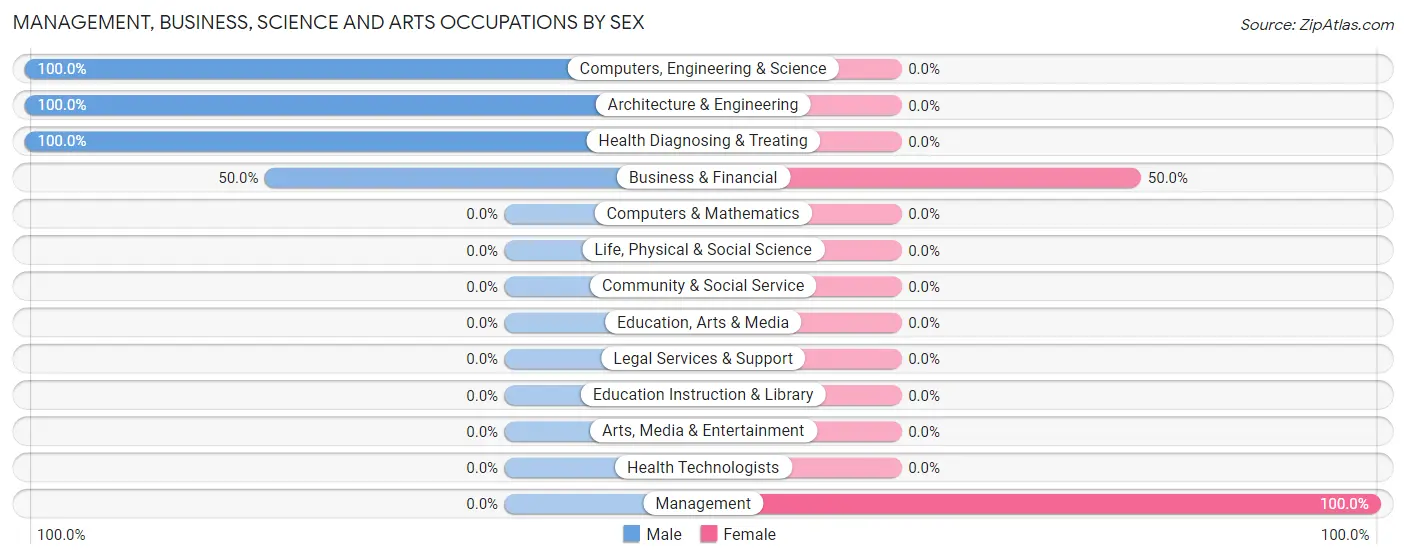
| Occupation | Male | Female |
| Management | 0 (0.0%) | 1 (100.0%) |
| Business & Financial | 1 (50.0%) | 1 (50.0%) |
| Computers, Engineering & Science | 1 (100.0%) | 0 (0.0%) |
| Computers & Mathematics | 0 (0.0%) | 0 (0.0%) |
| Architecture & Engineering | 1 (100.0%) | 0 (0.0%) |
| Life, Physical & Social Science | 0 (0.0%) | 0 (0.0%) |
| Community & Social Service | 0 (0.0%) | 0 (0.0%) |
| Education, Arts & Media | 0 (0.0%) | 0 (0.0%) |
| Legal Services & Support | 0 (0.0%) | 0 (0.0%) |
| Education Instruction & Library | 0 (0.0%) | 0 (0.0%) |
| Arts, Media & Entertainment | 0 (0.0%) | 0 (0.0%) |
| Health Diagnosing & Treating | 1 (100.0%) | 0 (0.0%) |
| Health Technologists | 0 (0.0%) | 0 (0.0%) |
| Total (Category) | 3 (60.0%) | 2 (40.0%) |
| Total (Overall) | 19 (55.9%) | 15 (44.1%) |
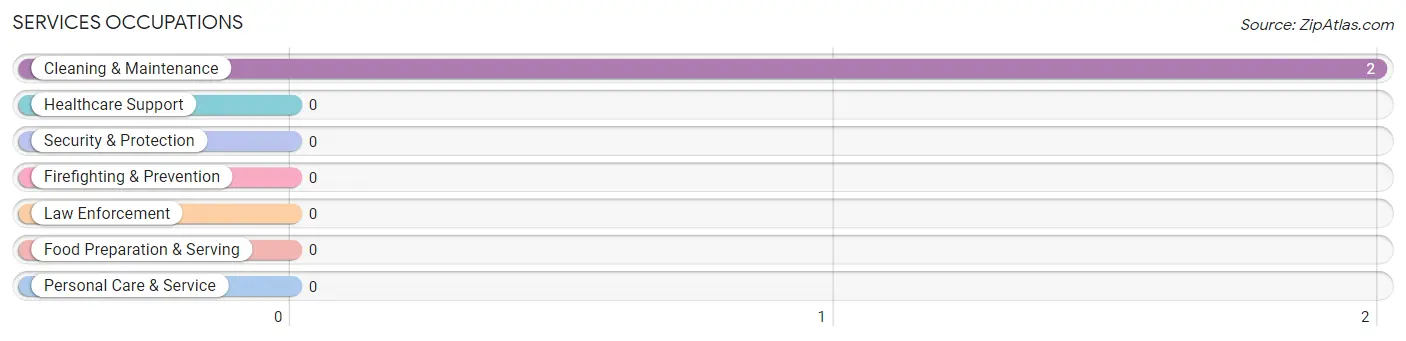
Services Occupations
The most common Services occupations in Wiota are , and Cleaning & Maintenance (2 | 5.9%).
Services Occupations by Sex
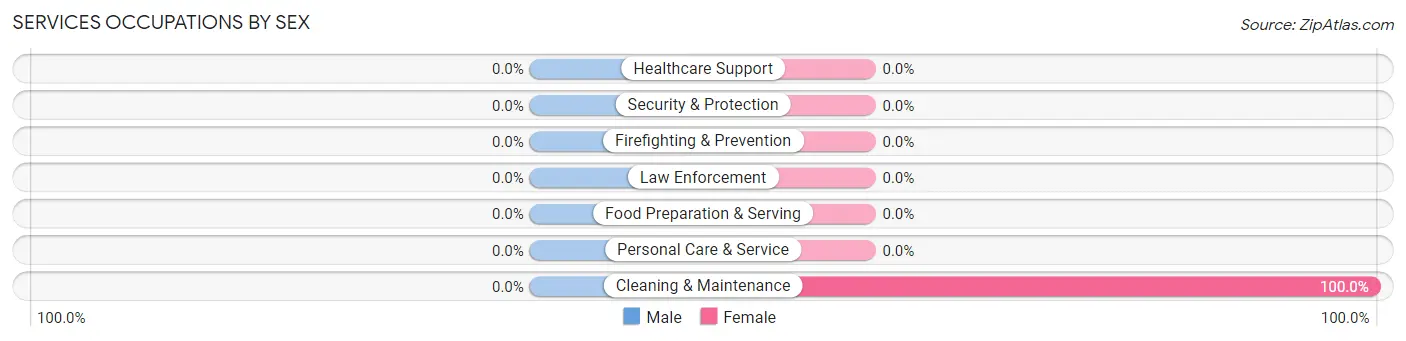
| Occupation | Male | Female |
| Healthcare Support | 0 (0.0%) | 0 (0.0%) |
| Security & Protection | 0 (0.0%) | 0 (0.0%) |
| Firefighting & Prevention | 0 (0.0%) | 0 (0.0%) |
| Law Enforcement | 0 (0.0%) | 0 (0.0%) |
| Food Preparation & Serving | 0 (0.0%) | 0 (0.0%) |
| Cleaning & Maintenance | 0 (0.0%) | 2 (100.0%) |
| Personal Care & Service | 0 (0.0%) | 0 (0.0%) |
| Total (Category) | 0 (0.0%) | 2 (100.0%) |
| Total (Overall) | 19 (55.9%) | 15 (44.1%) |
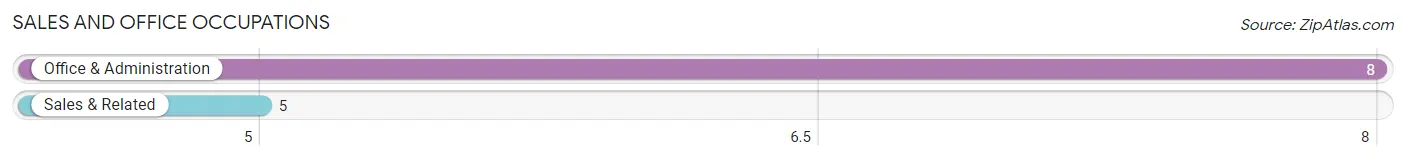
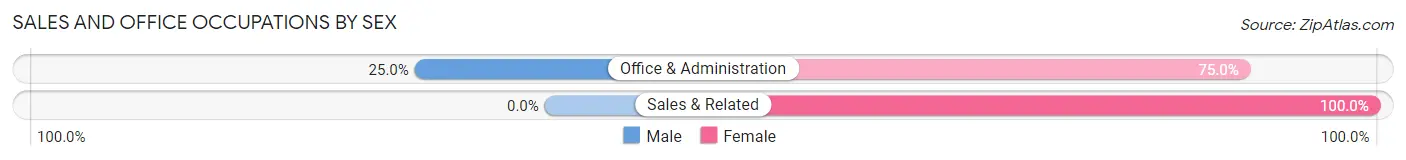
Sales and Office Occupations
The most common Sales and Office occupations in Wiota are Office & Administration (8 | 23.5%), and Sales & Related (5 | 14.7%).
Sales and Office Occupations by Sex
| Occupation | Male | Female |
| Sales & Related | 0 (0.0%) | 5 (100.0%) |
| Office & Administration | 2 (25.0%) | 6 (75.0%) |
| Total (Category) | 2 (15.4%) | 11 (84.6%) |
| Total (Overall) | 19 (55.9%) | 15 (44.1%) |
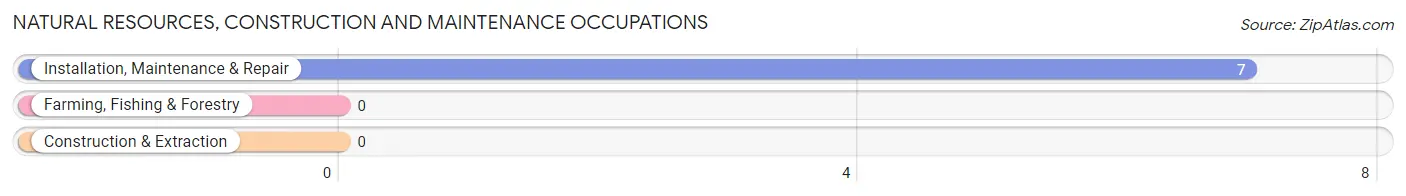
Natural Resources, Construction and Maintenance Occupations
The most common Natural Resources, Construction and Maintenance occupations in Wiota are , and Installation, Maintenance & Repair (7 | 20.6%).
Natural Resources, Construction and Maintenance Occupations by Sex
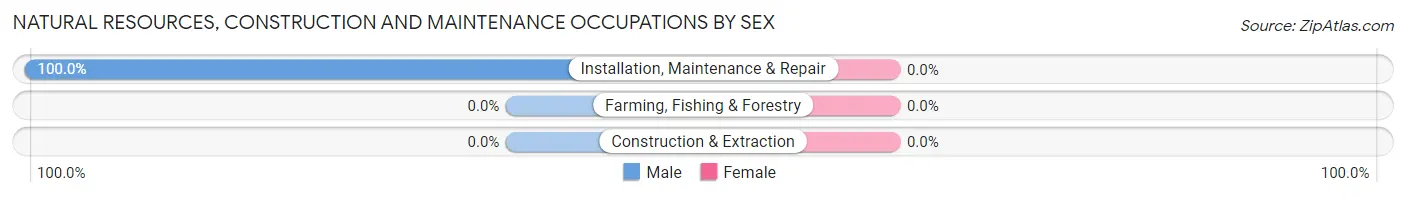
| Occupation | Male | Female |
| Farming, Fishing & Forestry | 0 (0.0%) | 0 (0.0%) |
| Construction & Extraction | 0 (0.0%) | 0 (0.0%) |
| Installation, Maintenance & Repair | 7 (100.0%) | 0 (0.0%) |
| Total (Category) | 7 (100.0%) | 0 (0.0%) |
| Total (Overall) | 19 (55.9%) | 15 (44.1%) |
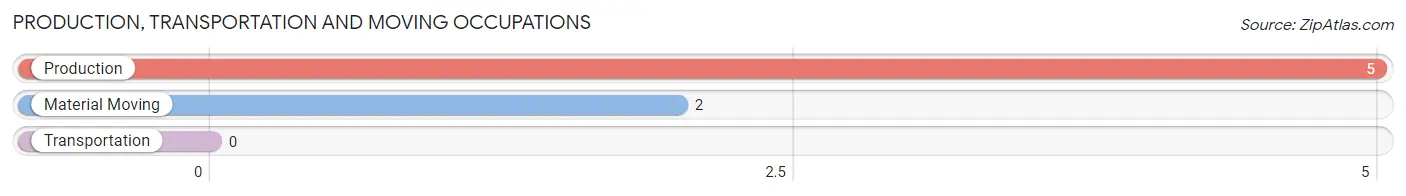
Production, Transportation and Moving Occupations
The most common Production, Transportation and Moving occupations in Wiota are Production (5 | 14.7%), and Material Moving (2 | 5.9%).
Production, Transportation and Moving Occupations by Sex
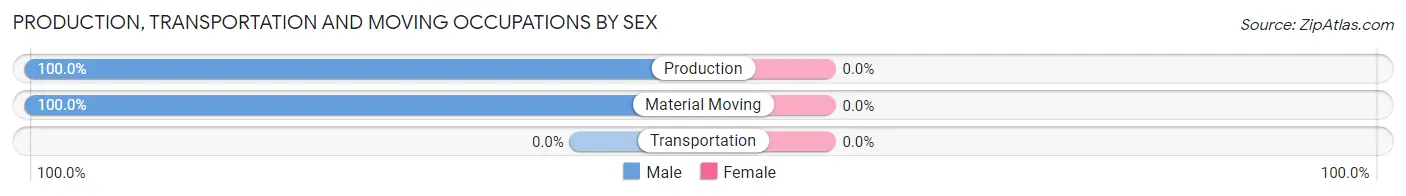
| Occupation | Male | Female |
| Production | 5 (100.0%) | 0 (0.0%) |
| Transportation | 0 (0.0%) | 0 (0.0%) |
| Material Moving | 2 (100.0%) | 0 (0.0%) |
| Total (Category) | 7 (100.0%) | 0 (0.0%) |
| Total (Overall) | 19 (55.9%) | 15 (44.1%) |
Employment Industries by Sex in Wiota
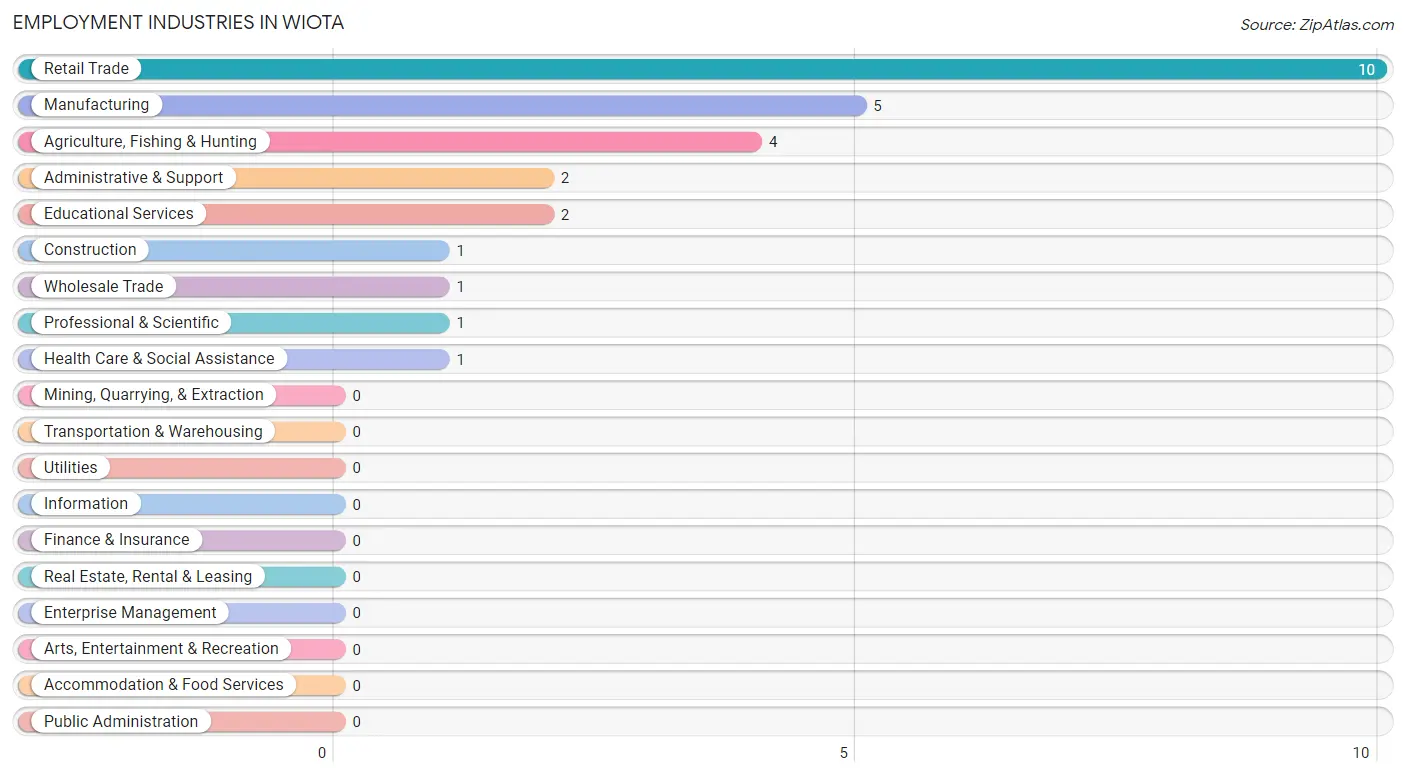
Employment Industries in Wiota
The major employment industries in Wiota include Retail Trade (10 | 29.4%), Manufacturing (5 | 14.7%), Agriculture, Fishing & Hunting (4 | 11.8%), Administrative & Support (2 | 5.9%), and Educational Services (2 | 5.9%).
Employment Industries by Sex in Wiota
The Wiota industries that see more men than women are Agriculture, Fishing & Hunting (100.0%), Construction (100.0%), and Manufacturing (100.0%), whereas the industries that tend to have a higher number of women are Wholesale Trade (100.0%), Professional & Scientific (100.0%), and Administrative & Support (100.0%).
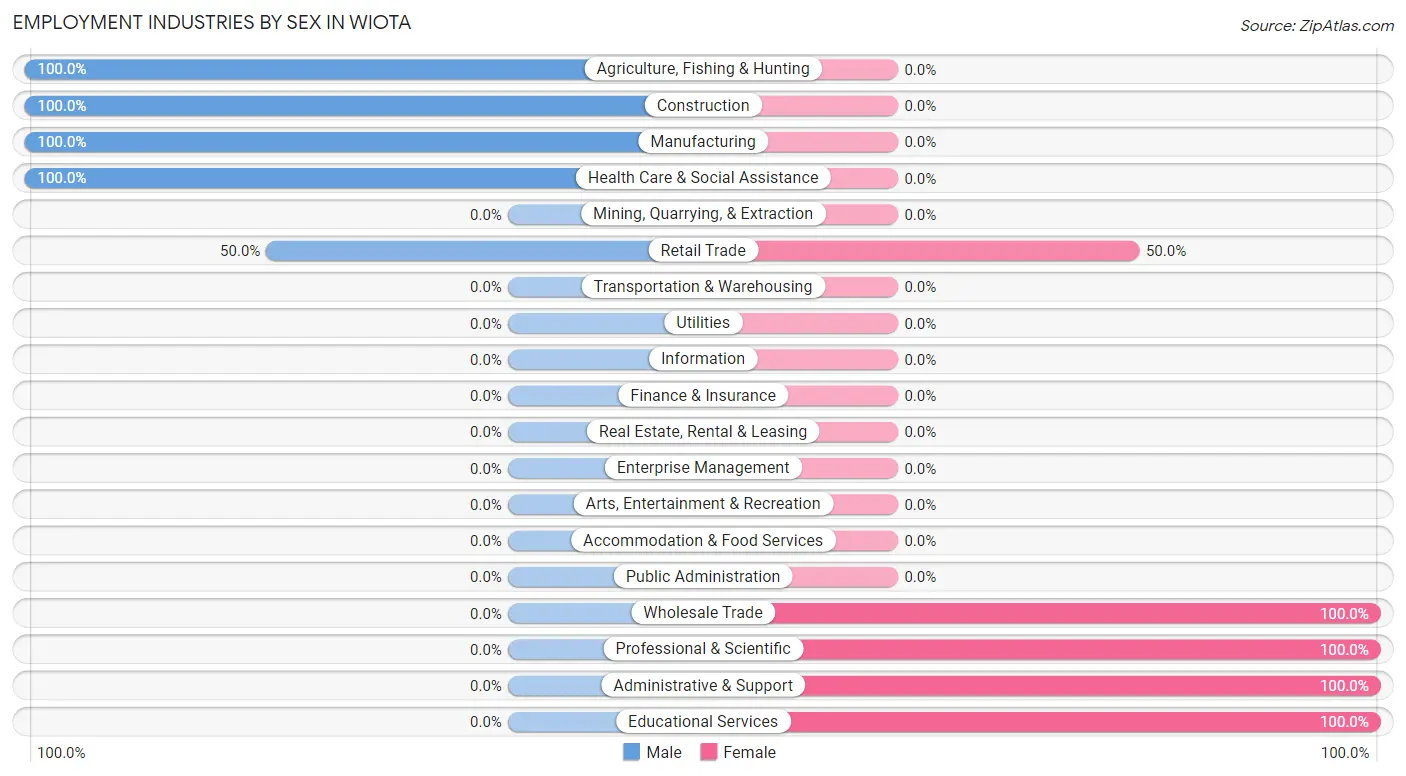
| Industry | Male | Female |
| Agriculture, Fishing & Hunting | 4 (100.0%) | 0 (0.0%) |
| Mining, Quarrying, & Extraction | 0 (0.0%) | 0 (0.0%) |
| Construction | 1 (100.0%) | 0 (0.0%) |
| Manufacturing | 5 (100.0%) | 0 (0.0%) |
| Wholesale Trade | 0 (0.0%) | 1 (100.0%) |
| Retail Trade | 5 (50.0%) | 5 (50.0%) |
| Transportation & Warehousing | 0 (0.0%) | 0 (0.0%) |
| Utilities | 0 (0.0%) | 0 (0.0%) |
| Information | 0 (0.0%) | 0 (0.0%) |
| Finance & Insurance | 0 (0.0%) | 0 (0.0%) |
| Real Estate, Rental & Leasing | 0 (0.0%) | 0 (0.0%) |
| Professional & Scientific | 0 (0.0%) | 1 (100.0%) |
| Enterprise Management | 0 (0.0%) | 0 (0.0%) |
| Administrative & Support | 0 (0.0%) | 2 (100.0%) |
| Educational Services | 0 (0.0%) | 2 (100.0%) |
| Health Care & Social Assistance | 1 (100.0%) | 0 (0.0%) |
| Arts, Entertainment & Recreation | 0 (0.0%) | 0 (0.0%) |
| Accommodation & Food Services | 0 (0.0%) | 0 (0.0%) |
| Public Administration | 0 (0.0%) | 0 (0.0%) |
| Total | 19 (55.9%) | 15 (44.1%) |
Education in Wiota
School Enrollment in Wiota
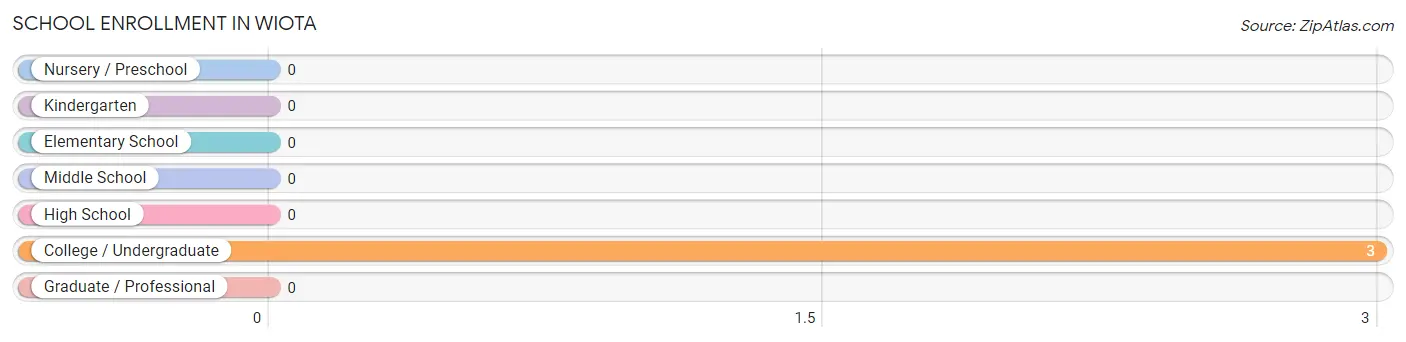
| School Level | # Students | % Students |
| Nursery / Preschool | 0 | 0.0% |
| Kindergarten | 0 | 0.0% |
| Elementary School | 0 | 0.0% |
| Middle School | 0 | 0.0% |
| High School | 0 | 0.0% |
| College / Undergraduate | 3 | 100.0% |
| Graduate / Professional | 0 | 0.0% |
| Total | 3 | 100.0% |
School Enrollment by Age by Funding Source in Wiota
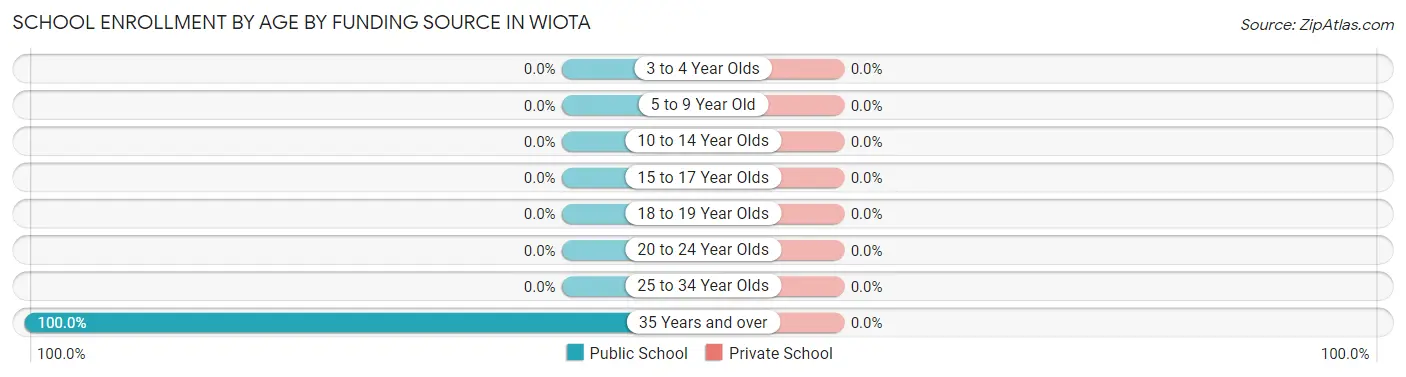
| Age Bracket | Public School | Private School |
| 3 to 4 Year Olds | 0 (0.0%) | 0 (0.0%) |
| 5 to 9 Year Old | 0 (0.0%) | 0 (0.0%) |
| 10 to 14 Year Olds | 0 (0.0%) | 0 (0.0%) |
| 15 to 17 Year Olds | 0 (0.0%) | 0 (0.0%) |
| 18 to 19 Year Olds | 0 (0.0%) | 0 (0.0%) |
| 20 to 24 Year Olds | 0 (0.0%) | 0 (0.0%) |
| 25 to 34 Year Olds | 0 (0.0%) | 0 (0.0%) |
| 35 Years and over | 3 (100.0%) | 0 (0.0%) |
| Total | 3 (100.0%) | 0 (0.0%) |
Educational Attainment by Field of Study in Wiota
Science & technology (4 | 36.4%), engineering (3 | 27.3%), visual & performing arts (2 | 18.2%), bio, nature & agricultural (1 | 9.1%), and liberal arts & history (1 | 9.1%) are the most common fields of study among 11 individuals in Wiota who have obtained a bachelor's degree or higher.
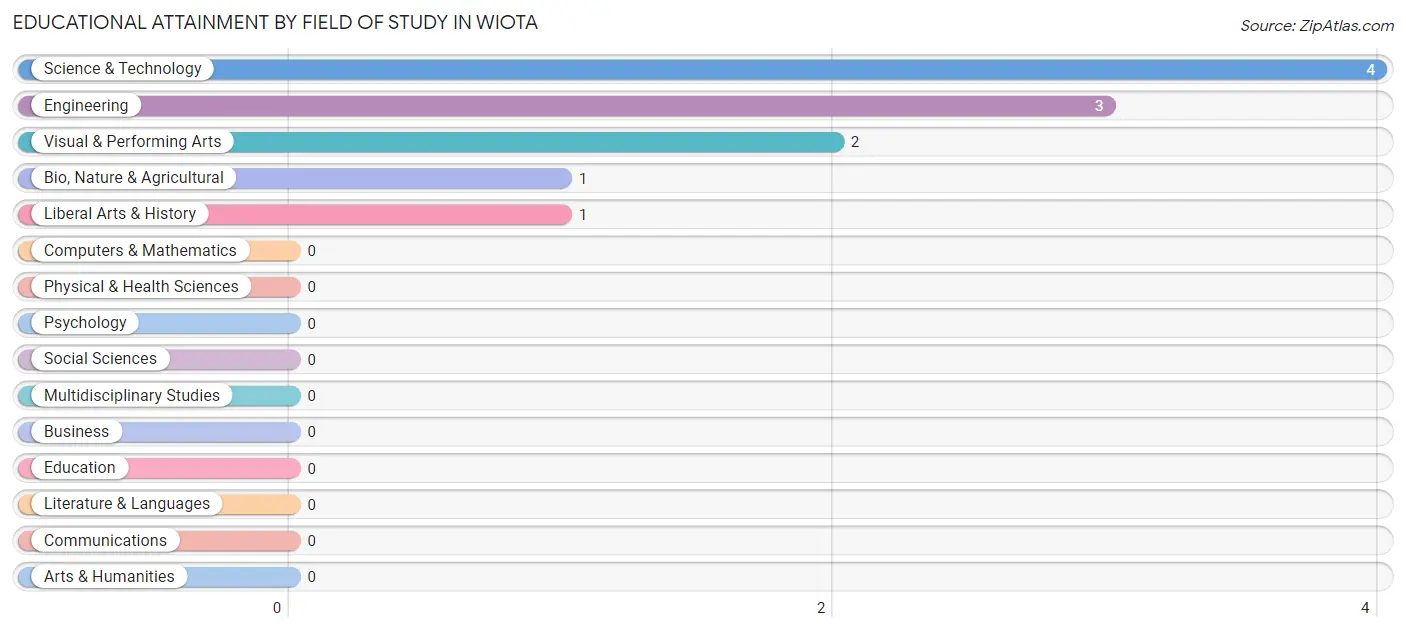
| Field of Study | # Graduates | % Graduates |
| Computers & Mathematics | 0 | 0.0% |
| Bio, Nature & Agricultural | 1 | 9.1% |
| Physical & Health Sciences | 0 | 0.0% |
| Psychology | 0 | 0.0% |
| Social Sciences | 0 | 0.0% |
| Engineering | 3 | 27.3% |
| Multidisciplinary Studies | 0 | 0.0% |
| Science & Technology | 4 | 36.4% |
| Business | 0 | 0.0% |
| Education | 0 | 0.0% |
| Literature & Languages | 0 | 0.0% |
| Liberal Arts & History | 1 | 9.1% |
| Visual & Performing Arts | 2 | 18.2% |
| Communications | 0 | 0.0% |
| Arts & Humanities | 0 | 0.0% |
| Total | 11 | 100.0% |
Transportation & Commute in Wiota
Vehicle Availability by Sex in Wiota
The most prevalent vehicle ownership categories in Wiota are males with 3 vehicles (7, accounting for 36.8%) and females with 3 vehicles (2, making up 46.7%).
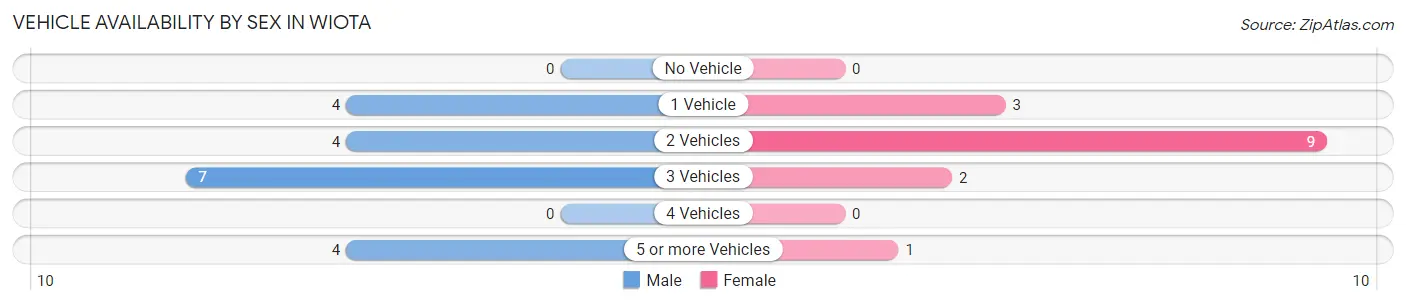
| Vehicles Available | Male | Female |
| No Vehicle | 0 (0.0%) | 0 (0.0%) |
| 1 Vehicle | 4 (21.0%) | 3 (20.0%) |
| 2 Vehicles | 4 (21.0%) | 9 (60.0%) |
| 3 Vehicles | 7 (36.8%) | 2 (13.3%) |
| 4 Vehicles | 0 (0.0%) | 0 (0.0%) |
| 5 or more Vehicles | 4 (21.0%) | 1 (6.7%) |
| Total | 19 (100.0%) | 15 (100.0%) |
Commute Time in Wiota
The most frequently occuring commute durations in Wiota are 5 to 9 minutes (9 commuters, 26.5%), 10 to 14 minutes (9 commuters, 26.5%), and 15 to 19 minutes (8 commuters, 23.5%).
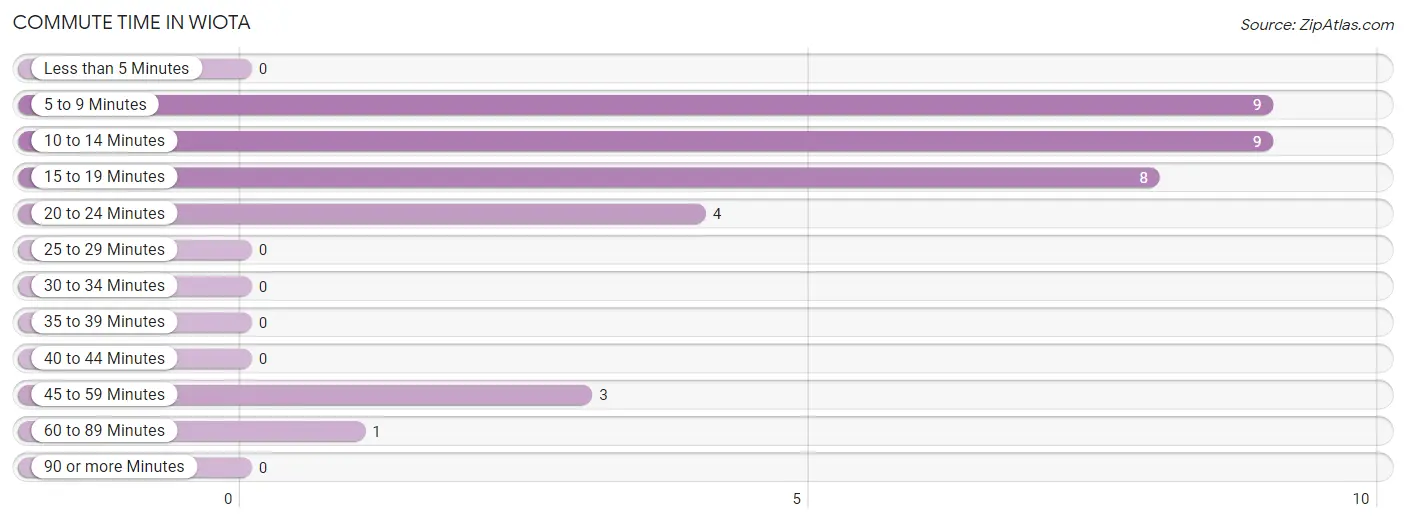
| Commute Time | # Commuters | % Commuters |
| Less than 5 Minutes | 0 | 0.0% |
| 5 to 9 Minutes | 9 | 26.5% |
| 10 to 14 Minutes | 9 | 26.5% |
| 15 to 19 Minutes | 8 | 23.5% |
| 20 to 24 Minutes | 4 | 11.8% |
| 25 to 29 Minutes | 0 | 0.0% |
| 30 to 34 Minutes | 0 | 0.0% |
| 35 to 39 Minutes | 0 | 0.0% |
| 40 to 44 Minutes | 0 | 0.0% |
| 45 to 59 Minutes | 3 | 8.8% |
| 60 to 89 Minutes | 1 | 2.9% |
| 90 or more Minutes | 0 | 0.0% |
Commute Time by Sex in Wiota
The most common commute times in Wiota are 5 to 9 minutes (7 commuters, 36.8%) for males and 15 to 19 minutes (6 commuters, 40.0%) for females.
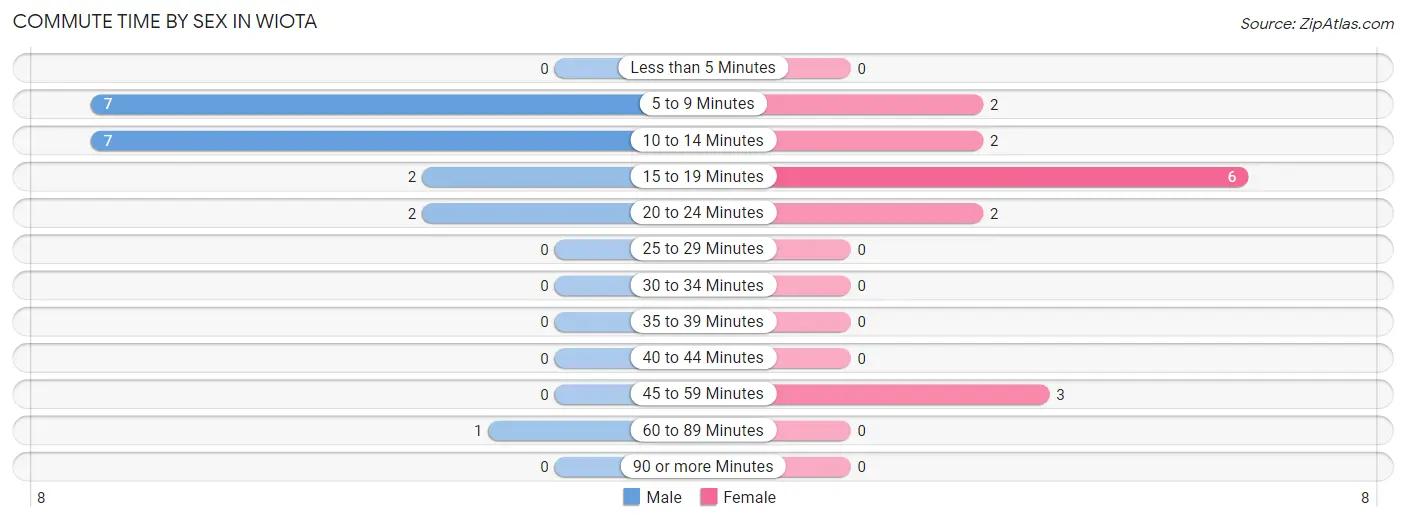
| Commute Time | Male | Female |
| Less than 5 Minutes | 0 (0.0%) | 0 (0.0%) |
| 5 to 9 Minutes | 7 (36.8%) | 2 (13.3%) |
| 10 to 14 Minutes | 7 (36.8%) | 2 (13.3%) |
| 15 to 19 Minutes | 2 (10.5%) | 6 (40.0%) |
| 20 to 24 Minutes | 2 (10.5%) | 2 (13.3%) |
| 25 to 29 Minutes | 0 (0.0%) | 0 (0.0%) |
| 30 to 34 Minutes | 0 (0.0%) | 0 (0.0%) |
| 35 to 39 Minutes | 0 (0.0%) | 0 (0.0%) |
| 40 to 44 Minutes | 0 (0.0%) | 0 (0.0%) |
| 45 to 59 Minutes | 0 (0.0%) | 3 (20.0%) |
| 60 to 89 Minutes | 1 (5.3%) | 0 (0.0%) |
| 90 or more Minutes | 0 (0.0%) | 0 (0.0%) |
Time of Departure to Work by Sex in Wiota
The most frequent times of departure to work in Wiota are 7:00 AM to 7:29 AM (5, 26.3%) for males and 6:00 AM to 6:29 AM (4, 26.7%) for females.
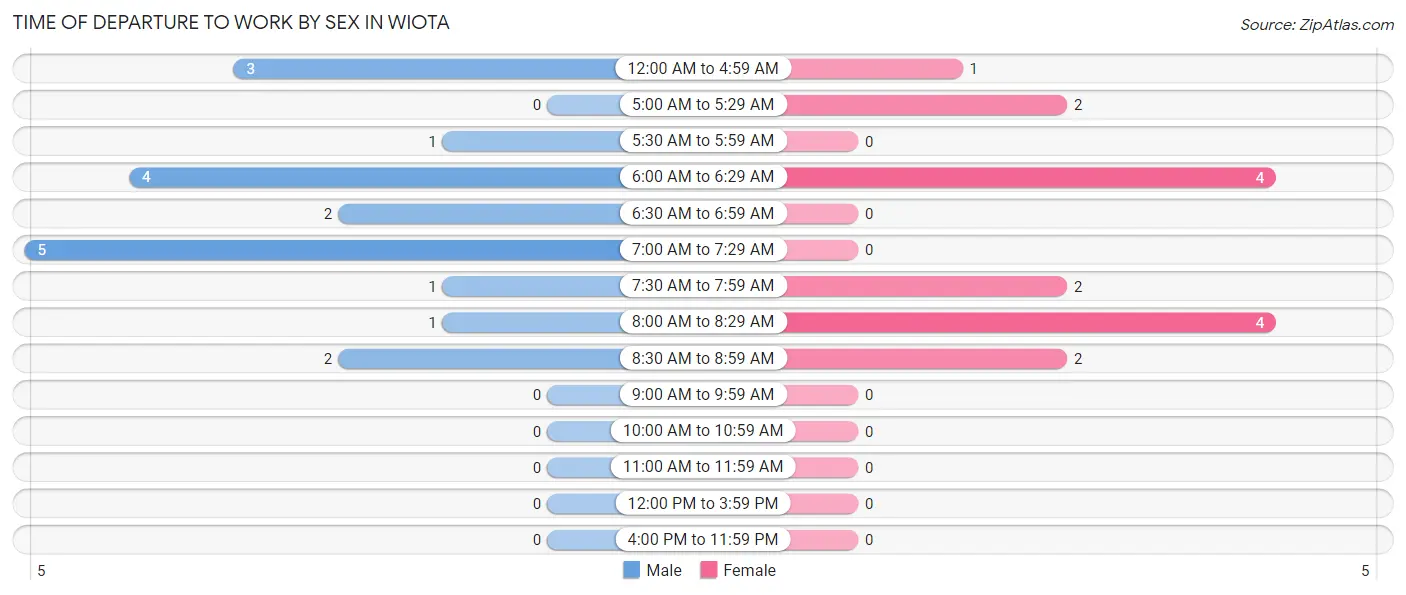
| Time of Departure | Male | Female |
| 12:00 AM to 4:59 AM | 3 (15.8%) | 1 (6.7%) |
| 5:00 AM to 5:29 AM | 0 (0.0%) | 2 (13.3%) |
| 5:30 AM to 5:59 AM | 1 (5.3%) | 0 (0.0%) |
| 6:00 AM to 6:29 AM | 4 (21.0%) | 4 (26.7%) |
| 6:30 AM to 6:59 AM | 2 (10.5%) | 0 (0.0%) |
| 7:00 AM to 7:29 AM | 5 (26.3%) | 0 (0.0%) |
| 7:30 AM to 7:59 AM | 1 (5.3%) | 2 (13.3%) |
| 8:00 AM to 8:29 AM | 1 (5.3%) | 4 (26.7%) |
| 8:30 AM to 8:59 AM | 2 (10.5%) | 2 (13.3%) |
| 9:00 AM to 9:59 AM | 0 (0.0%) | 0 (0.0%) |
| 10:00 AM to 10:59 AM | 0 (0.0%) | 0 (0.0%) |
| 11:00 AM to 11:59 AM | 0 (0.0%) | 0 (0.0%) |
| 12:00 PM to 3:59 PM | 0 (0.0%) | 0 (0.0%) |
| 4:00 PM to 11:59 PM | 0 (0.0%) | 0 (0.0%) |
| Total | 19 (100.0%) | 15 (100.0%) |
Housing Occupancy in Wiota
Occupancy by Ownership in Wiota
Of the total 49 dwellings in Wiota, owner-occupied units account for 45 (91.8%), while renter-occupied units make up 4 (8.2%).
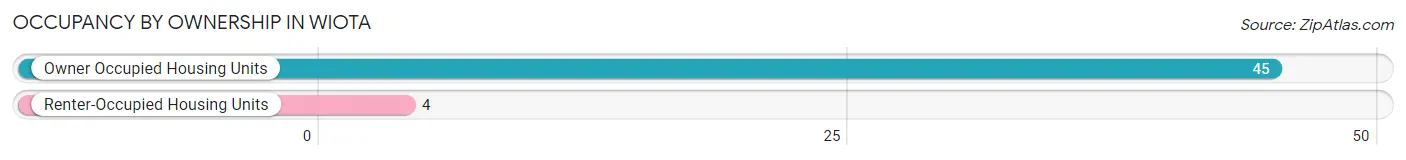
| Occupancy | # Housing Units | % Housing Units |
| Owner Occupied Housing Units | 45 | 91.8% |
| Renter-Occupied Housing Units | 4 | 8.2% |
| Total Occupied Housing Units | 49 | 100.0% |
Occupancy by Household Size in Wiota
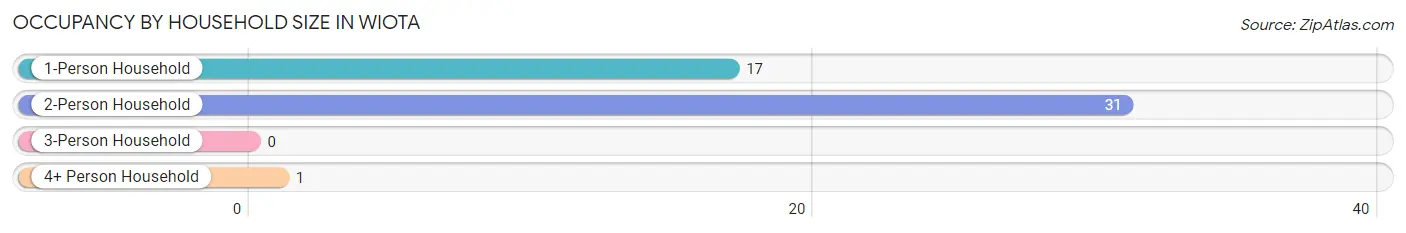
| Household Size | # Housing Units | % Housing Units |
| 1-Person Household | 17 | 34.7% |
| 2-Person Household | 31 | 63.3% |
| 3-Person Household | 0 | 0.0% |
| 4+ Person Household | 1 | 2.0% |
| Total Housing Units | 49 | 100.0% |
Occupancy by Ownership by Household Size in Wiota
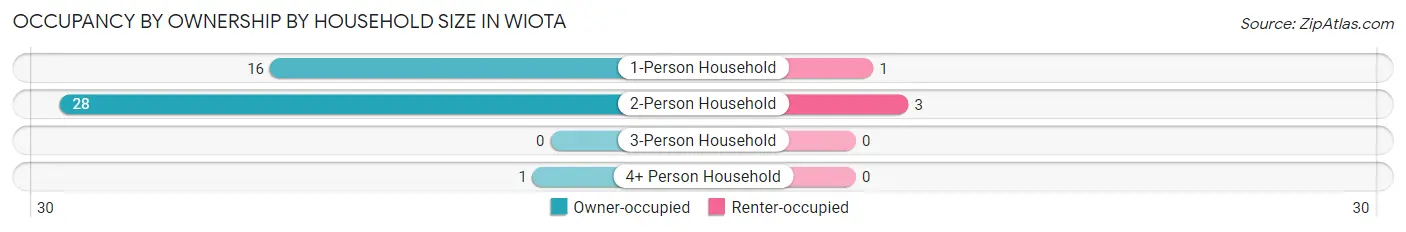
| Household Size | Owner-occupied | Renter-occupied |
| 1-Person Household | 16 (94.1%) | 1 (5.9%) |
| 2-Person Household | 28 (90.3%) | 3 (9.7%) |
| 3-Person Household | 0 (0.0%) | 0 (0.0%) |
| 4+ Person Household | 1 (100.0%) | 0 (0.0%) |
| Total Housing Units | 45 (91.8%) | 4 (8.2%) |
Occupancy by Educational Attainment in Wiota
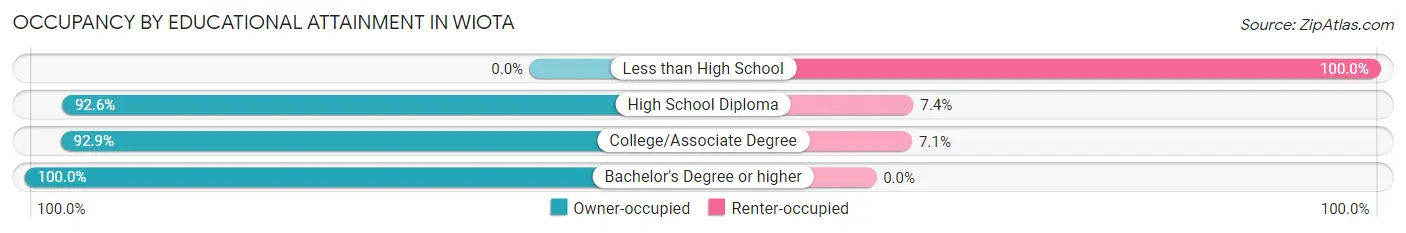
| Household Size | Owner-occupied | Renter-occupied |
| Less than High School | 0 (0.0%) | 1 (100.0%) |
| High School Diploma | 25 (92.6%) | 2 (7.4%) |
| College/Associate Degree | 13 (92.9%) | 1 (7.1%) |
| Bachelor's Degree or higher | 7 (100.0%) | 0 (0.0%) |
Occupancy by Age of Householder in Wiota
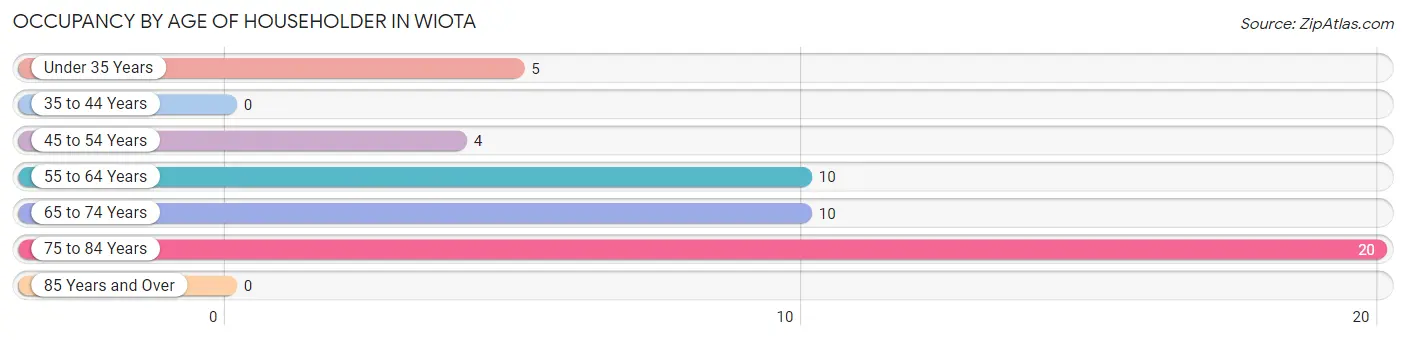
| Age Bracket | # Households | % Households |
| Under 35 Years | 5 | 10.2% |
| 35 to 44 Years | 0 | 0.0% |
| 45 to 54 Years | 4 | 8.2% |
| 55 to 64 Years | 10 | 20.4% |
| 65 to 74 Years | 10 | 20.4% |
| 75 to 84 Years | 20 | 40.8% |
| 85 Years and Over | 0 | 0.0% |
| Total | 49 | 100.0% |
Housing Finances in Wiota
Median Income by Occupancy in Wiota
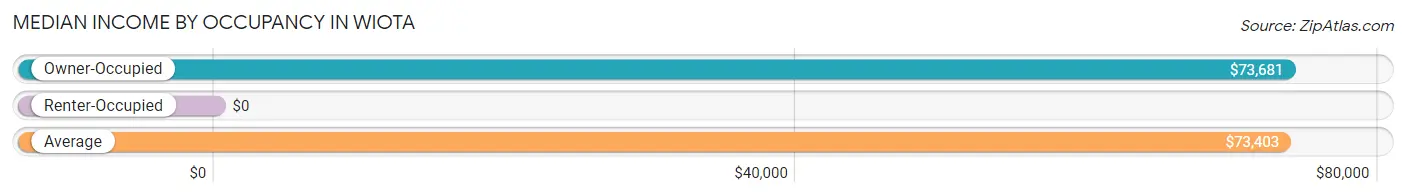
| Occupancy Type | # Households | Median Income |
| Owner-Occupied | 45 (91.8%) | $73,681 |
| Renter-Occupied | 4 (8.2%) | $0 |
| Average | 49 (100.0%) | $73,403 |
Occupancy by Householder Income Bracket in Wiota
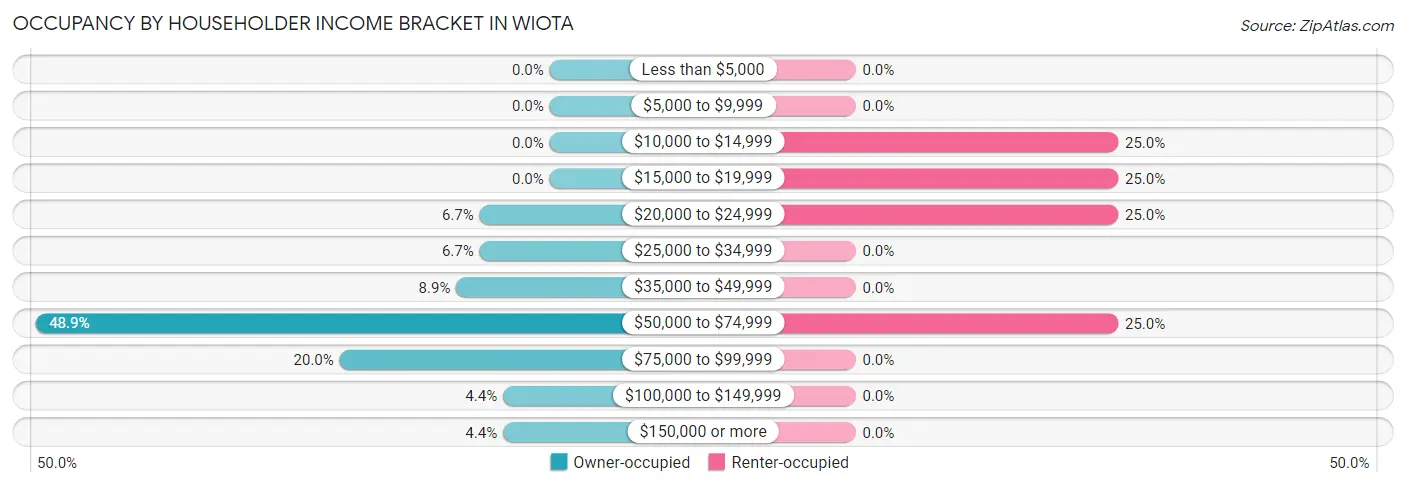
| Income Bracket | Owner-occupied | Renter-occupied |
| Less than $5,000 | 0 (0.0%) | 0 (0.0%) |
| $5,000 to $9,999 | 0 (0.0%) | 0 (0.0%) |
| $10,000 to $14,999 | 0 (0.0%) | 1 (25.0%) |
| $15,000 to $19,999 | 0 (0.0%) | 1 (25.0%) |
| $20,000 to $24,999 | 3 (6.7%) | 1 (25.0%) |
| $25,000 to $34,999 | 3 (6.7%) | 0 (0.0%) |
| $35,000 to $49,999 | 4 (8.9%) | 0 (0.0%) |
| $50,000 to $74,999 | 22 (48.9%) | 1 (25.0%) |
| $75,000 to $99,999 | 9 (20.0%) | 0 (0.0%) |
| $100,000 to $149,999 | 2 (4.4%) | 0 (0.0%) |
| $150,000 or more | 2 (4.4%) | 0 (0.0%) |
| Total | 45 (100.0%) | 4 (100.0%) |
Monthly Housing Cost Tiers in Wiota
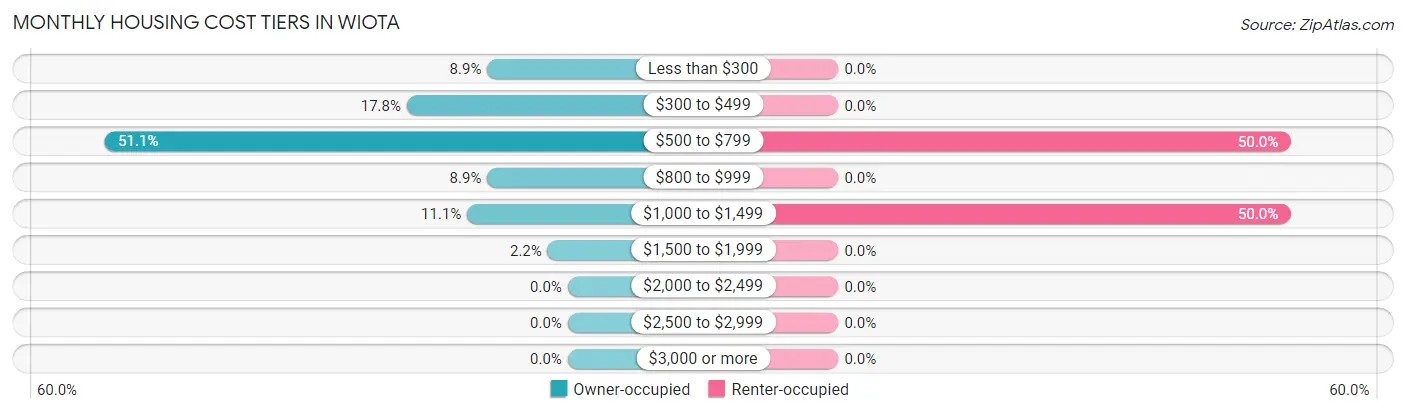
| Monthly Cost | Owner-occupied | Renter-occupied |
| Less than $300 | 4 (8.9%) | 0 (0.0%) |
| $300 to $499 | 8 (17.8%) | 0 (0.0%) |
| $500 to $799 | 23 (51.1%) | 2 (50.0%) |
| $800 to $999 | 4 (8.9%) | 0 (0.0%) |
| $1,000 to $1,499 | 5 (11.1%) | 2 (50.0%) |
| $1,500 to $1,999 | 1 (2.2%) | 0 (0.0%) |
| $2,000 to $2,499 | 0 (0.0%) | 0 (0.0%) |
| $2,500 to $2,999 | 0 (0.0%) | 0 (0.0%) |
| $3,000 or more | 0 (0.0%) | 0 (0.0%) |
| Total | 45 (100.0%) | 4 (100.0%) |
Physical Housing Characteristics in Wiota
Housing Structures in Wiota
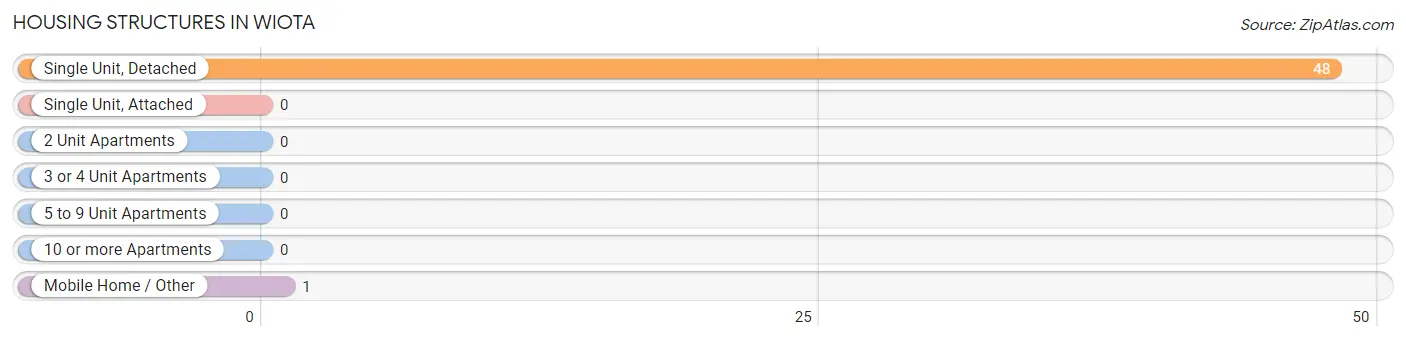
| Structure Type | # Housing Units | % Housing Units |
| Single Unit, Detached | 48 | 98.0% |
| Single Unit, Attached | 0 | 0.0% |
| 2 Unit Apartments | 0 | 0.0% |
| 3 or 4 Unit Apartments | 0 | 0.0% |
| 5 to 9 Unit Apartments | 0 | 0.0% |
| 10 or more Apartments | 0 | 0.0% |
| Mobile Home / Other | 1 | 2.0% |
| Total | 49 | 100.0% |
Housing Structures by Occupancy in Wiota
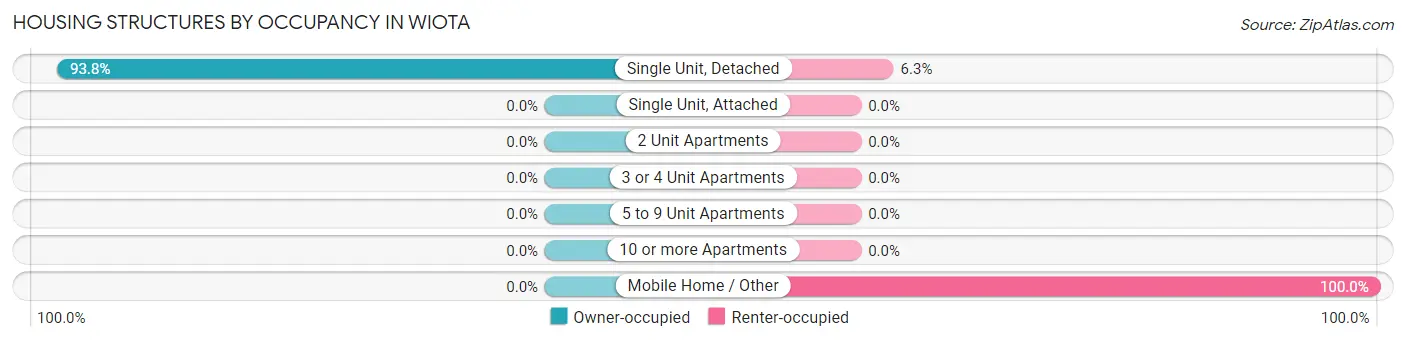
| Structure Type | Owner-occupied | Renter-occupied |
| Single Unit, Detached | 45 (93.8%) | 3 (6.2%) |
| Single Unit, Attached | 0 (0.0%) | 0 (0.0%) |
| 2 Unit Apartments | 0 (0.0%) | 0 (0.0%) |
| 3 or 4 Unit Apartments | 0 (0.0%) | 0 (0.0%) |
| 5 to 9 Unit Apartments | 0 (0.0%) | 0 (0.0%) |
| 10 or more Apartments | 0 (0.0%) | 0 (0.0%) |
| Mobile Home / Other | 0 (0.0%) | 1 (100.0%) |
| Total | 45 (91.8%) | 4 (8.2%) |
Housing Structures by Number of Rooms in Wiota
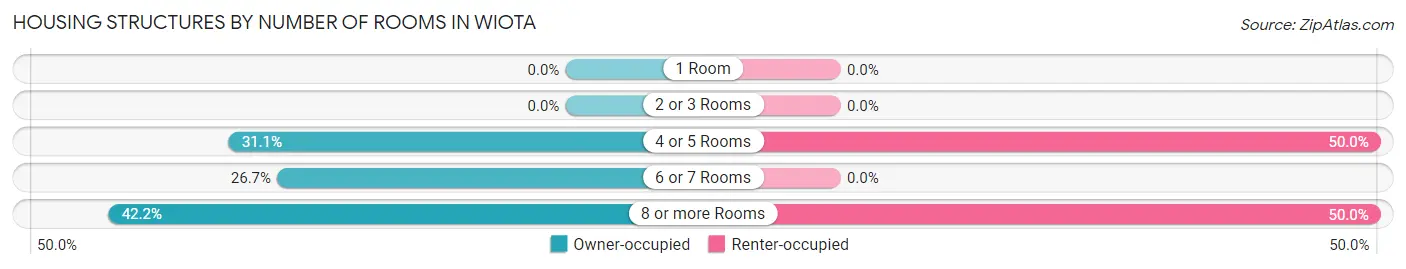
| Number of Rooms | Owner-occupied | Renter-occupied |
| 1 Room | 0 (0.0%) | 0 (0.0%) |
| 2 or 3 Rooms | 0 (0.0%) | 0 (0.0%) |
| 4 or 5 Rooms | 14 (31.1%) | 2 (50.0%) |
| 6 or 7 Rooms | 12 (26.7%) | 0 (0.0%) |
| 8 or more Rooms | 19 (42.2%) | 2 (50.0%) |
| Total | 45 (100.0%) | 4 (100.0%) |
Housing Structure by Heating Type in Wiota
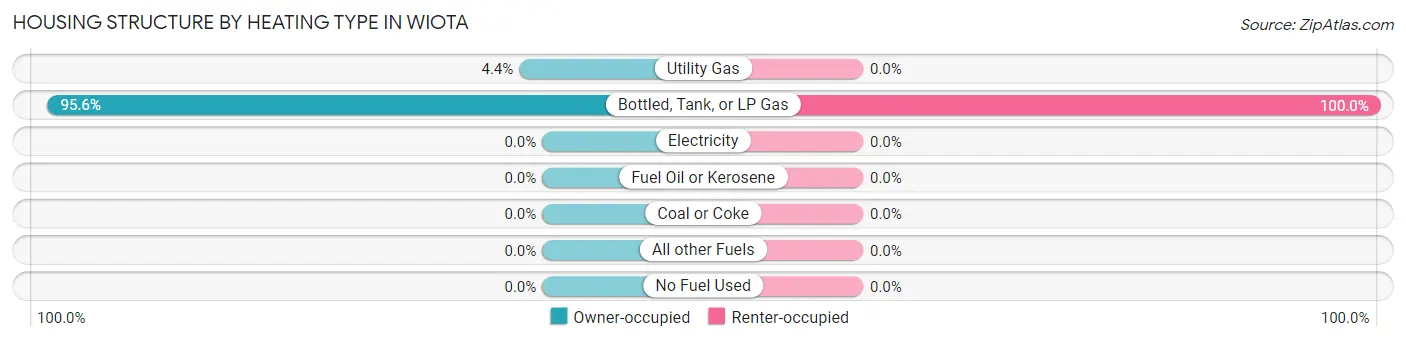
| Heating Type | Owner-occupied | Renter-occupied |
| Utility Gas | 2 (4.4%) | 0 (0.0%) |
| Bottled, Tank, or LP Gas | 43 (95.6%) | 4 (100.0%) |
| Electricity | 0 (0.0%) | 0 (0.0%) |
| Fuel Oil or Kerosene | 0 (0.0%) | 0 (0.0%) |
| Coal or Coke | 0 (0.0%) | 0 (0.0%) |
| All other Fuels | 0 (0.0%) | 0 (0.0%) |
| No Fuel Used | 0 (0.0%) | 0 (0.0%) |
| Total | 45 (100.0%) | 4 (100.0%) |
Household Vehicle Usage in Wiota
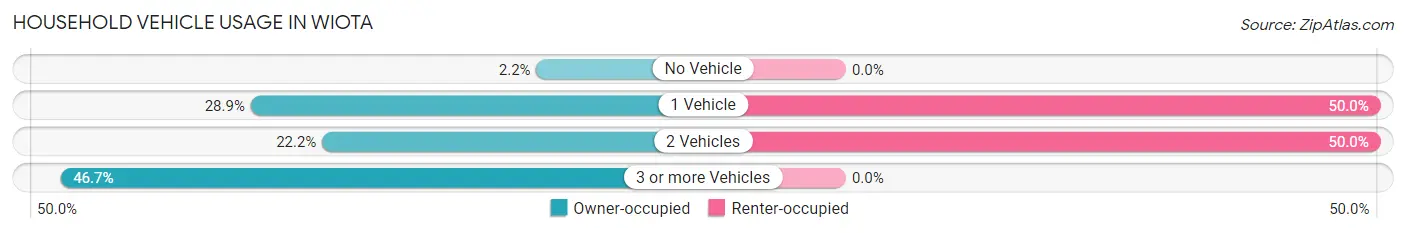
| Vehicles per Household | Owner-occupied | Renter-occupied |
| No Vehicle | 1 (2.2%) | 0 (0.0%) |
| 1 Vehicle | 13 (28.9%) | 2 (50.0%) |
| 2 Vehicles | 10 (22.2%) | 2 (50.0%) |
| 3 or more Vehicles | 21 (46.7%) | 0 (0.0%) |
| Total | 45 (100.0%) | 4 (100.0%) |
Real Estate & Mortgages in Wiota
Real Estate and Mortgage Overview in Wiota
| Characteristic | Without Mortgage | With Mortgage |
| Housing Units | 35 | 10 |
| Median Property Value | $126,000 | $68,300 |
| Median Household Income | $74,018 | $0 |
| Monthly Housing Costs | $622 | $0 |
| Real Estate Taxes | $1,183 | $0 |
Property Value by Mortgage Status in Wiota
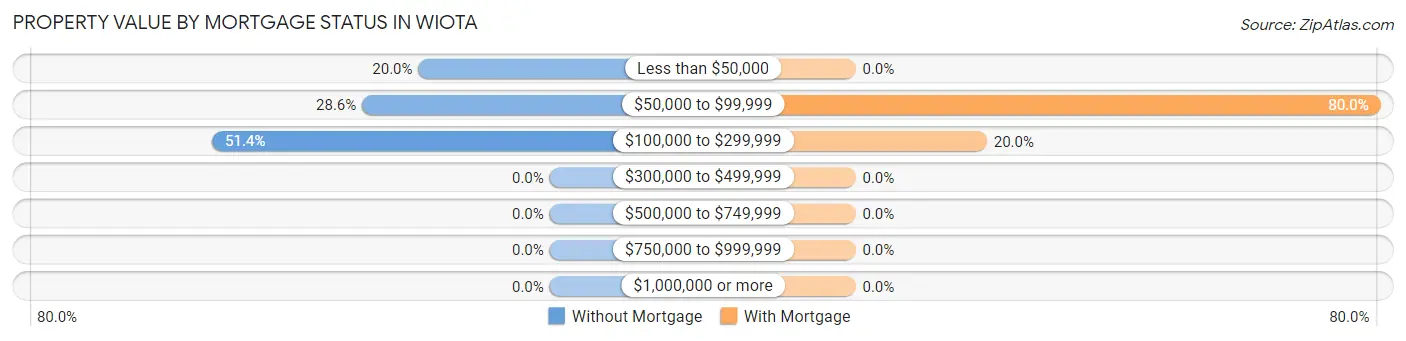
| Property Value | Without Mortgage | With Mortgage |
| Less than $50,000 | 7 (20.0%) | 0 (0.0%) |
| $50,000 to $99,999 | 10 (28.6%) | 8 (80.0%) |
| $100,000 to $299,999 | 18 (51.4%) | 2 (20.0%) |
| $300,000 to $499,999 | 0 (0.0%) | 0 (0.0%) |
| $500,000 to $749,999 | 0 (0.0%) | 0 (0.0%) |
| $750,000 to $999,999 | 0 (0.0%) | 0 (0.0%) |
| $1,000,000 or more | 0 (0.0%) | 0 (0.0%) |
| Total | 35 (100.0%) | 10 (100.0%) |
Household Income by Mortgage Status in Wiota
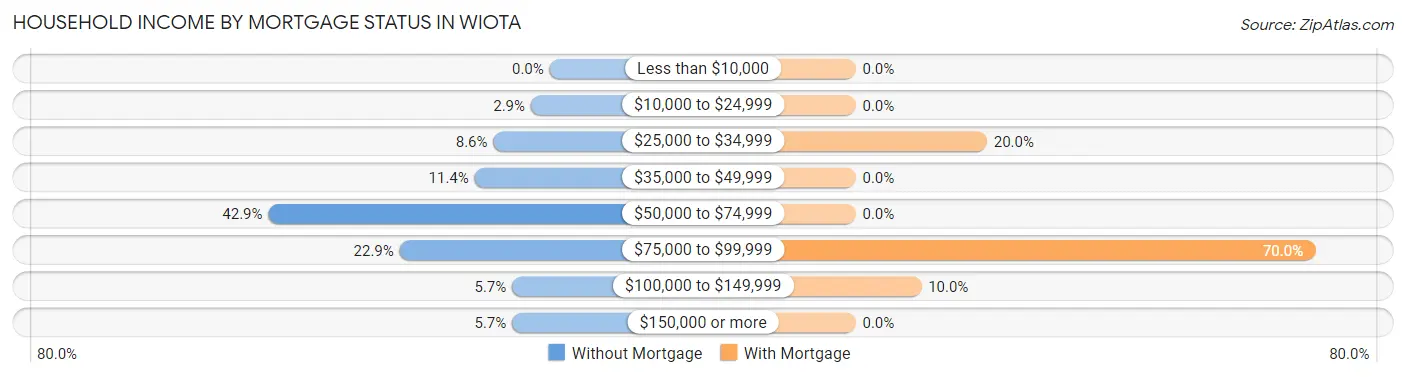
| Household Income | Without Mortgage | With Mortgage |
| Less than $10,000 | 0 (0.0%) | 0 (0.0%) |
| $10,000 to $24,999 | 1 (2.9%) | 0 (0.0%) |
| $25,000 to $34,999 | 3 (8.6%) | 2 (20.0%) |
| $35,000 to $49,999 | 4 (11.4%) | 0 (0.0%) |
| $50,000 to $74,999 | 15 (42.9%) | 0 (0.0%) |
| $75,000 to $99,999 | 8 (22.9%) | 7 (70.0%) |
| $100,000 to $149,999 | 2 (5.7%) | 1 (10.0%) |
| $150,000 or more | 2 (5.7%) | 0 (0.0%) |
| Total | 35 (100.0%) | 10 (100.0%) |
Property Value to Household Income Ratio in Wiota
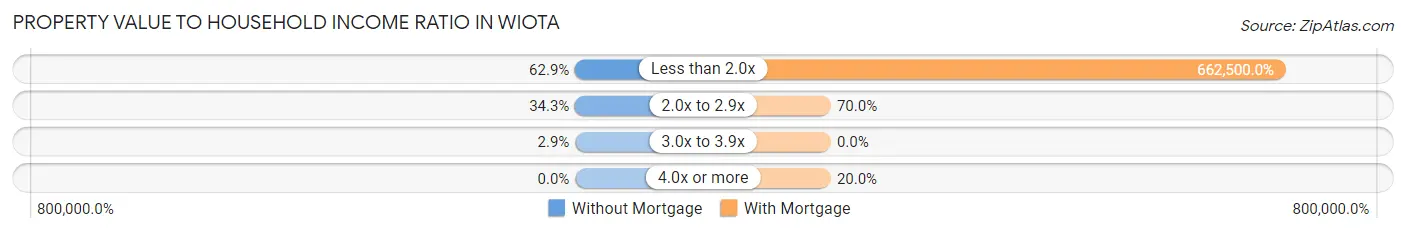
| Value-to-Income Ratio | Without Mortgage | With Mortgage |
| Less than 2.0x | 22 (62.9%) | 66,250 (662,500.0%) |
| 2.0x to 2.9x | 12 (34.3%) | 7 (70.0%) |
| 3.0x to 3.9x | 1 (2.9%) | 0 (0.0%) |
| 4.0x or more | 0 (0.0%) | 2 (20.0%) |
| Total | 35 (100.0%) | 10 (100.0%) |
Real Estate Taxes by Mortgage Status in Wiota
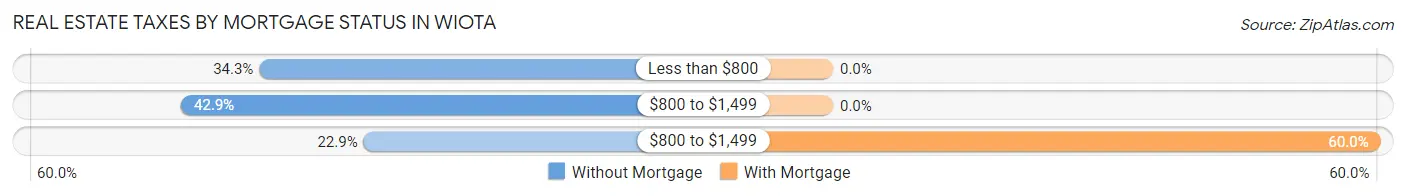
| Property Taxes | Without Mortgage | With Mortgage |
| Less than $800 | 12 (34.3%) | 0 (0.0%) |
| $800 to $1,499 | 15 (42.9%) | 0 (0.0%) |
| $800 to $1,499 | 8 (22.9%) | 6 (60.0%) |
| Total | 35 (100.0%) | 10 (100.0%) |
Health & Disability in Wiota
Health Insurance Coverage by Age in Wiota
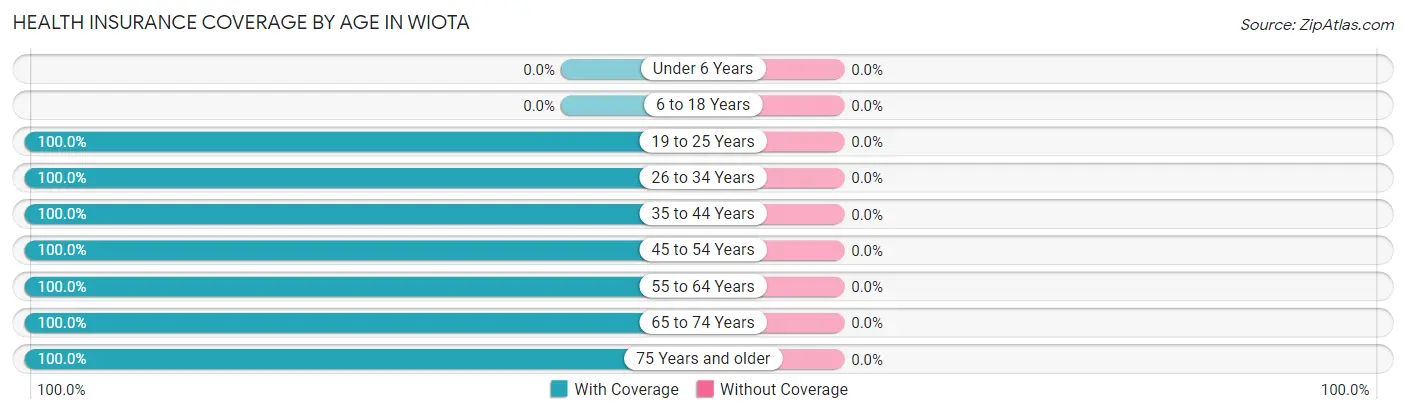
| Age Bracket | With Coverage | Without Coverage |
| Under 6 Years | 0 (0.0%) | 0 (0.0%) |
| 6 to 18 Years | 0 (0.0%) | 0 (0.0%) |
| 19 to 25 Years | 1 (100.0%) | 0 (0.0%) |
| 26 to 34 Years | 7 (100.0%) | 0 (0.0%) |
| 35 to 44 Years | 2 (100.0%) | 0 (0.0%) |
| 45 to 54 Years | 4 (100.0%) | 0 (0.0%) |
| 55 to 64 Years | 18 (100.0%) | 0 (0.0%) |
| 65 to 74 Years | 17 (100.0%) | 0 (0.0%) |
| 75 Years and older | 35 (100.0%) | 0 (0.0%) |
| Total | 84 (100.0%) | 0 (0.0%) |
Health Insurance Coverage by Citizenship Status in Wiota
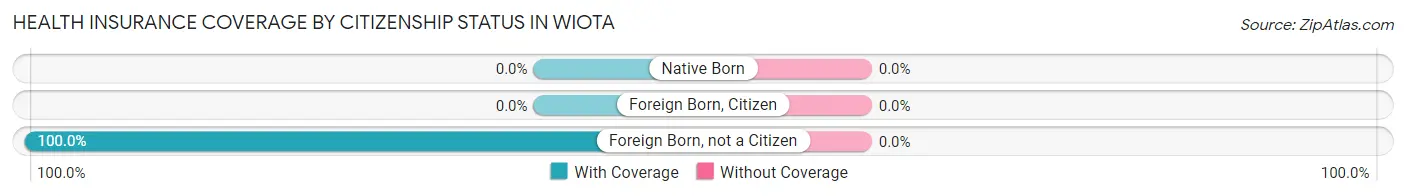
| Citizenship Status | With Coverage | Without Coverage |
| Native Born | 0 (0.0%) | 0 (0.0%) |
| Foreign Born, Citizen | 0 (0.0%) | 0 (0.0%) |
| Foreign Born, not a Citizen | 1 (100.0%) | 0 (0.0%) |
Health Insurance Coverage by Household Income in Wiota
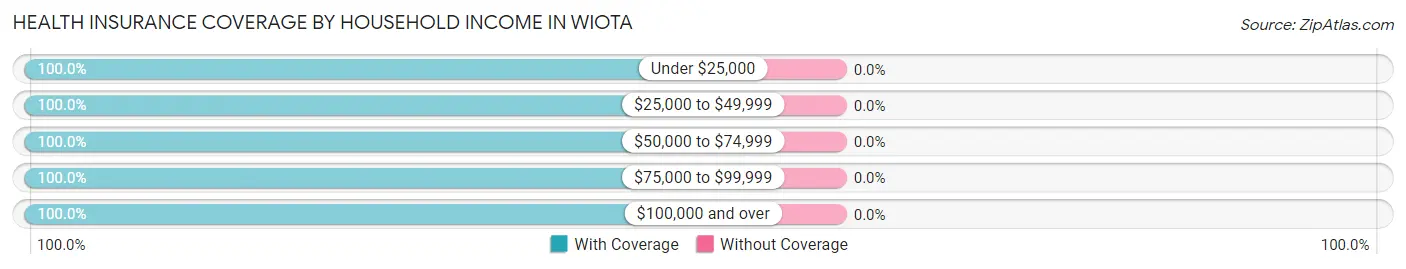
| Household Income | With Coverage | Without Coverage |
| Under $25,000 | 8 (100.0%) | 0 (0.0%) |
| $25,000 to $49,999 | 7 (100.0%) | 0 (0.0%) |
| $50,000 to $74,999 | 42 (100.0%) | 0 (0.0%) |
| $75,000 to $99,999 | 17 (100.0%) | 0 (0.0%) |
| $100,000 and over | 10 (100.0%) | 0 (0.0%) |
Public vs Private Health Insurance Coverage by Age in Wiota
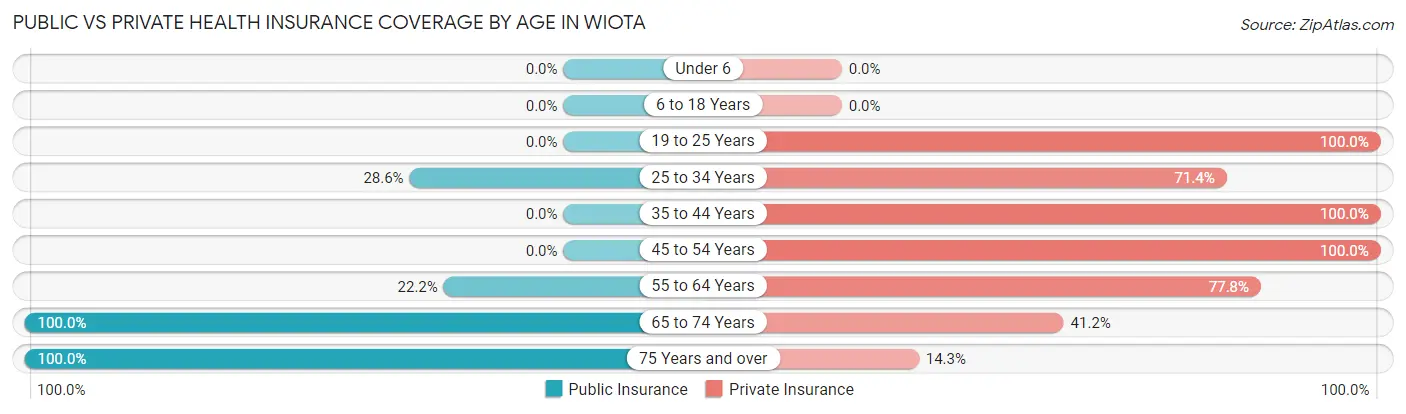
| Age Bracket | Public Insurance | Private Insurance |
| Under 6 | 0 (0.0%) | 0 (0.0%) |
| 6 to 18 Years | 0 (0.0%) | 0 (0.0%) |
| 19 to 25 Years | 0 (0.0%) | 1 (100.0%) |
| 25 to 34 Years | 2 (28.6%) | 5 (71.4%) |
| 35 to 44 Years | 0 (0.0%) | 2 (100.0%) |
| 45 to 54 Years | 0 (0.0%) | 4 (100.0%) |
| 55 to 64 Years | 4 (22.2%) | 14 (77.8%) |
| 65 to 74 Years | 17 (100.0%) | 7 (41.2%) |
| 75 Years and over | 35 (100.0%) | 5 (14.3%) |
| Total | 58 (69.1%) | 38 (45.2%) |
Disability Status by Sex by Age in Wiota
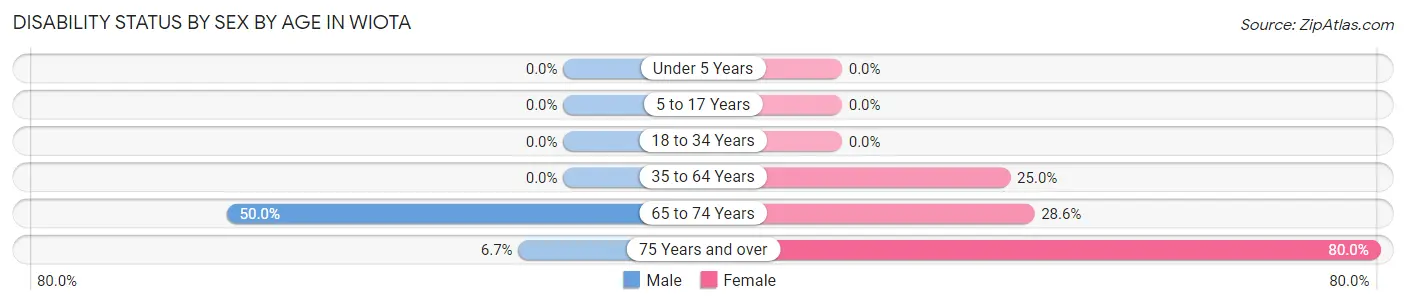
| Age Bracket | Male | Female |
| Under 5 Years | 0 (0.0%) | 0 (0.0%) |
| 5 to 17 Years | 0 (0.0%) | 0 (0.0%) |
| 18 to 34 Years | 0 (0.0%) | 0 (0.0%) |
| 35 to 64 Years | 0 (0.0%) | 2 (25.0%) |
| 65 to 74 Years | 5 (50.0%) | 2 (28.6%) |
| 75 Years and over | 1 (6.7%) | 16 (80.0%) |
Disability Class by Sex by Age in Wiota
Disability Class: Hearing Difficulty
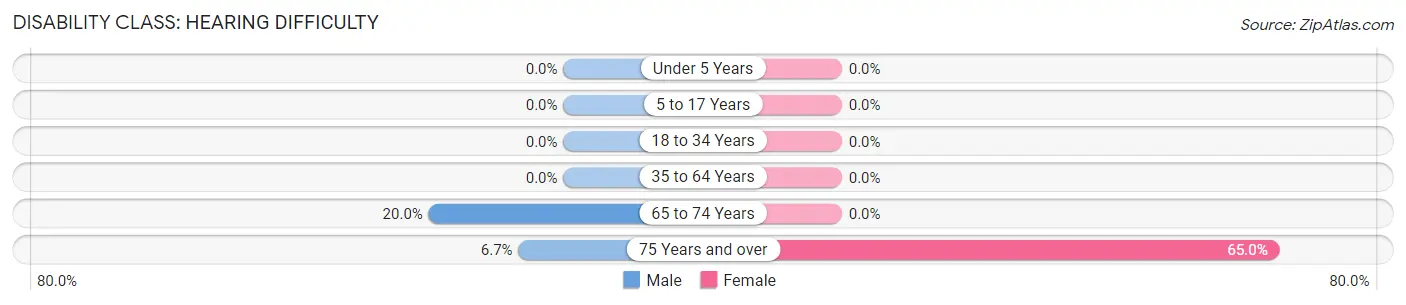
| Age Bracket | Male | Female |
| Under 5 Years | 0 (0.0%) | 0 (0.0%) |
| 5 to 17 Years | 0 (0.0%) | 0 (0.0%) |
| 18 to 34 Years | 0 (0.0%) | 0 (0.0%) |
| 35 to 64 Years | 0 (0.0%) | 0 (0.0%) |
| 65 to 74 Years | 2 (20.0%) | 0 (0.0%) |
| 75 Years and over | 1 (6.7%) | 13 (65.0%) |
Disability Class: Vision Difficulty
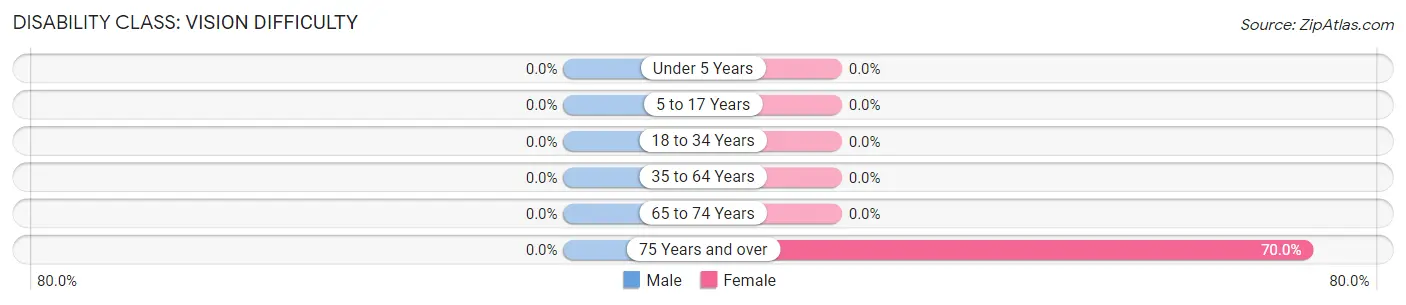
| Age Bracket | Male | Female |
| Under 5 Years | 0 (0.0%) | 0 (0.0%) |
| 5 to 17 Years | 0 (0.0%) | 0 (0.0%) |
| 18 to 34 Years | 0 (0.0%) | 0 (0.0%) |
| 35 to 64 Years | 0 (0.0%) | 0 (0.0%) |
| 65 to 74 Years | 0 (0.0%) | 0 (0.0%) |
| 75 Years and over | 0 (0.0%) | 14 (70.0%) |
Disability Class: Cognitive Difficulty
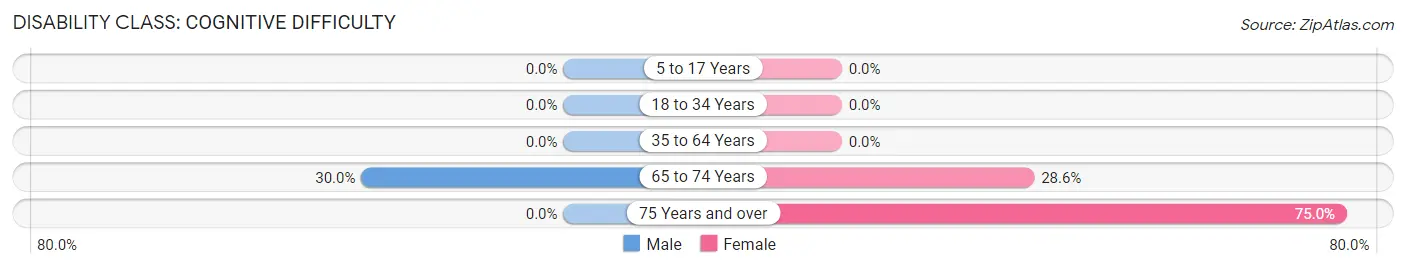
| Age Bracket | Male | Female |
| 5 to 17 Years | 0 (0.0%) | 0 (0.0%) |
| 18 to 34 Years | 0 (0.0%) | 0 (0.0%) |
| 35 to 64 Years | 0 (0.0%) | 0 (0.0%) |
| 65 to 74 Years | 3 (30.0%) | 2 (28.6%) |
| 75 Years and over | 0 (0.0%) | 15 (75.0%) |
Disability Class: Ambulatory Difficulty
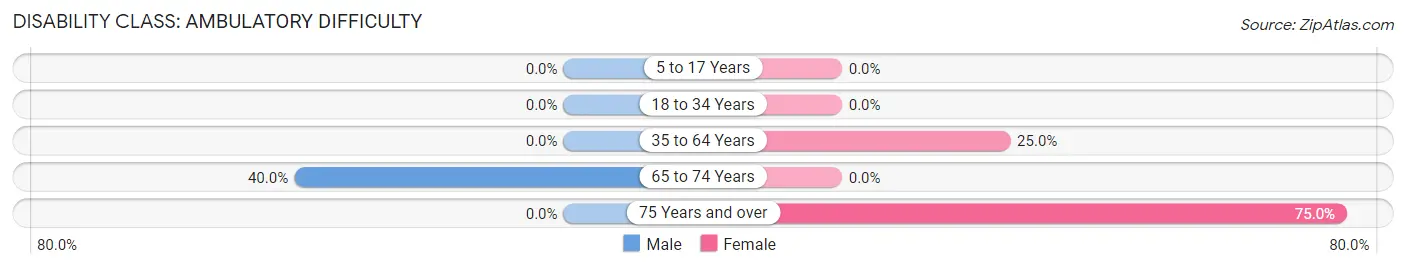
| Age Bracket | Male | Female |
| 5 to 17 Years | 0 (0.0%) | 0 (0.0%) |
| 18 to 34 Years | 0 (0.0%) | 0 (0.0%) |
| 35 to 64 Years | 0 (0.0%) | 2 (25.0%) |
| 65 to 74 Years | 4 (40.0%) | 0 (0.0%) |
| 75 Years and over | 0 (0.0%) | 15 (75.0%) |
Disability Class: Self-Care Difficulty
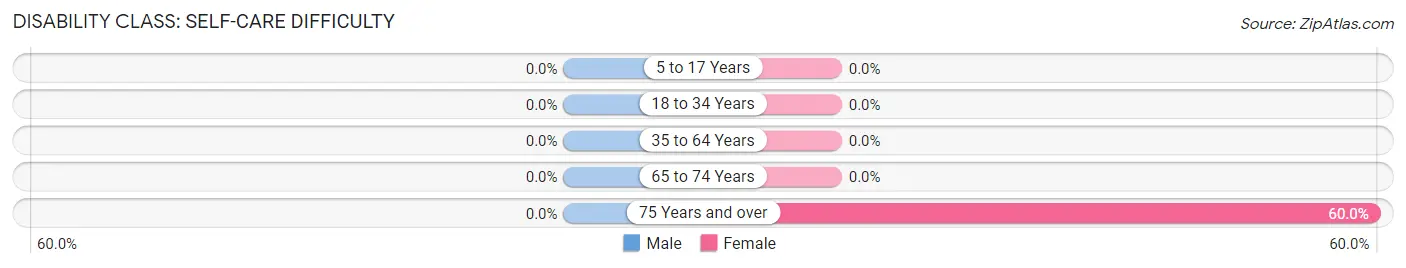
| Age Bracket | Male | Female |
| 5 to 17 Years | 0 (0.0%) | 0 (0.0%) |
| 18 to 34 Years | 0 (0.0%) | 0 (0.0%) |
| 35 to 64 Years | 0 (0.0%) | 0 (0.0%) |
| 65 to 74 Years | 0 (0.0%) | 0 (0.0%) |
| 75 Years and over | 0 (0.0%) | 12 (60.0%) |
Technology Access in Wiota
Computing Device Access in Wiota
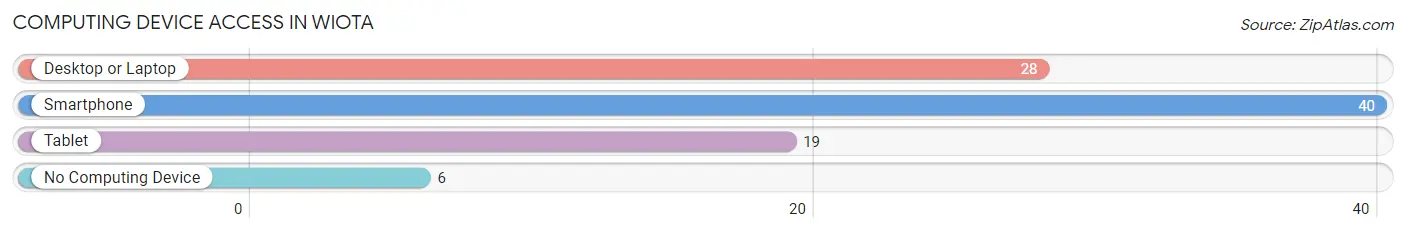
| Device Type | # Households | % Households |
| Desktop or Laptop | 28 | 57.1% |
| Smartphone | 40 | 81.6% |
| Tablet | 19 | 38.8% |
| No Computing Device | 6 | 12.2% |
| Total | 49 | 100.0% |
Internet Access in Wiota
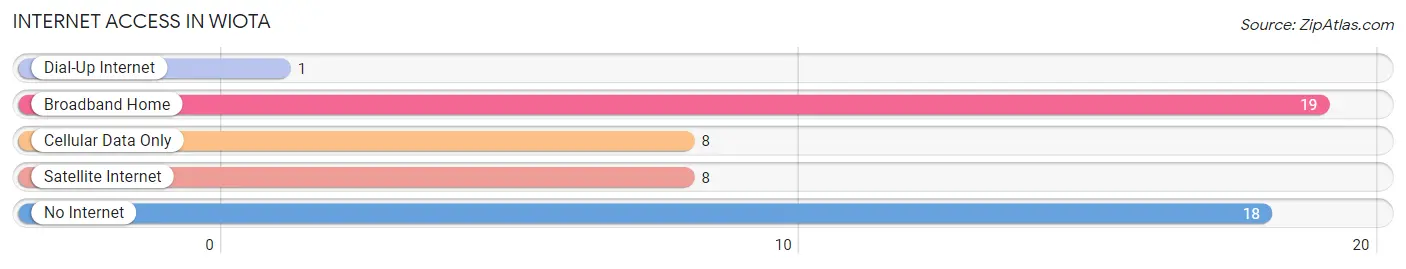
| Internet Type | # Households | % Households |
| Dial-Up Internet | 1 | 2.0% |
| Broadband Home | 19 | 38.8% |
| Cellular Data Only | 8 | 16.3% |
| Satellite Internet | 8 | 16.3% |
| No Internet | 18 | 36.7% |
| Total | 49 | 100.0% |
Wiota Summary
Wiota is a small unincorporated community located in Cass County, Iowa. It is situated in the rolling hills of the Loess Hills region, approximately 10 miles south of Atlantic and 25 miles east of Council Bluffs. Wiota is a rural community with a population of approximately 200 people.
History
Wiota was founded in 1856 by a group of settlers from Wisconsin. The town was named after the nearby Wiota Creek, which was named after the Winnebago Indian word for “prairie”. The town was originally a farming community, but in the late 19th century, it became a center for the lumber industry. The lumber industry was a major source of employment for the town until the early 20th century, when the industry began to decline.
In the early 20th century, Wiota began to transition from an agricultural and lumber-based economy to a more diversified economy. The town became a center for the production of farm equipment, and several factories were established in the area. In the 1950s, Wiota was home to a large egg-processing plant, which provided employment for many of the town’s residents.
Geography
Wiota is located in the rolling hills of the Loess Hills region of Iowa. The town is situated in the Loess Hills National Scenic Byway, which is a scenic drive that runs through the Loess Hills region. The town is located approximately 10 miles south of Atlantic and 25 miles east of Council Bluffs. Wiota is surrounded by farmland and is located near several small lakes and streams.
Economy
Wiota’s economy is largely based on agriculture and tourism. The town is home to several small businesses, including a grocery store, a hardware store, and a restaurant. The town is also home to several small farms, which produce a variety of crops, including corn, soybeans, and hay.
Wiota is also a popular tourist destination. The town is home to several historic sites, including the Wiota Cemetery, which is the final resting place of many of the town’s early settlers. The town is also home to several parks and recreational areas, including the Wiota Wildlife Area, which is a popular spot for bird watching and fishing.
Demographics
As of the 2010 census, Wiota had a population of 200 people. The racial makeup of the town was 97.5% White, 0.5% African American, 0.5% Native American, and 1.5% from two or more races. The median household income in Wiota was $45,000, and the median age was 44. The town had a poverty rate of 8.3%.
Wiota is a small, rural community with a strong sense of community and a rich history. The town is home to several small businesses and farms, and is a popular tourist destination. Wiota is a great place to live, work, and raise a family.
Common Questions
What is Per Capita Income in Wiota?
Per Capita income in Wiota is $42,870.
What is the Median Family Income in Wiota?
Median Family Income in Wiota is $74,063.
What is the Median Household income in Wiota?
Median Household Income in Wiota is $73,403.
What is Income or Wage Gap in Wiota?
Income or Wage Gap in Wiota is 50.9%.
Women in Wiota earn 49.1 cents for every dollar earned by a man.
What is Inequality or Gini Index in Wiota?
Inequality or Gini Index in Wiota is 0.29.
What is the Total Population of Wiota?
Total Population of Wiota is 84.
What is the Total Male Population of Wiota?
Total Male Population of Wiota is 44.
What is the Total Female Population of Wiota?
Total Female Population of Wiota is 40.
What is the Ratio of Males per 100 Females in Wiota?
There are 110.00 Males per 100 Females in Wiota.
What is the Ratio of Females per 100 Males in Wiota?
There are 90.91 Females per 100 Males in Wiota.
What is the Median Population Age in Wiota?
Median Population Age in Wiota is 70.0 Years.
What is the Average Family Size in Wiota
Average Family Size in Wiota is 2.1 People.
What is the Average Household Size in Wiota
Average Household Size in Wiota is 1.7 People.
How Large is the Labor Force in Wiota?
There are 34 People in the Labor Forcein in Wiota.
What is the Percentage of People in the Labor Force in Wiota?
40.5% of People are in the Labor Force in Wiota.