Farragut, IA Map & Demographics
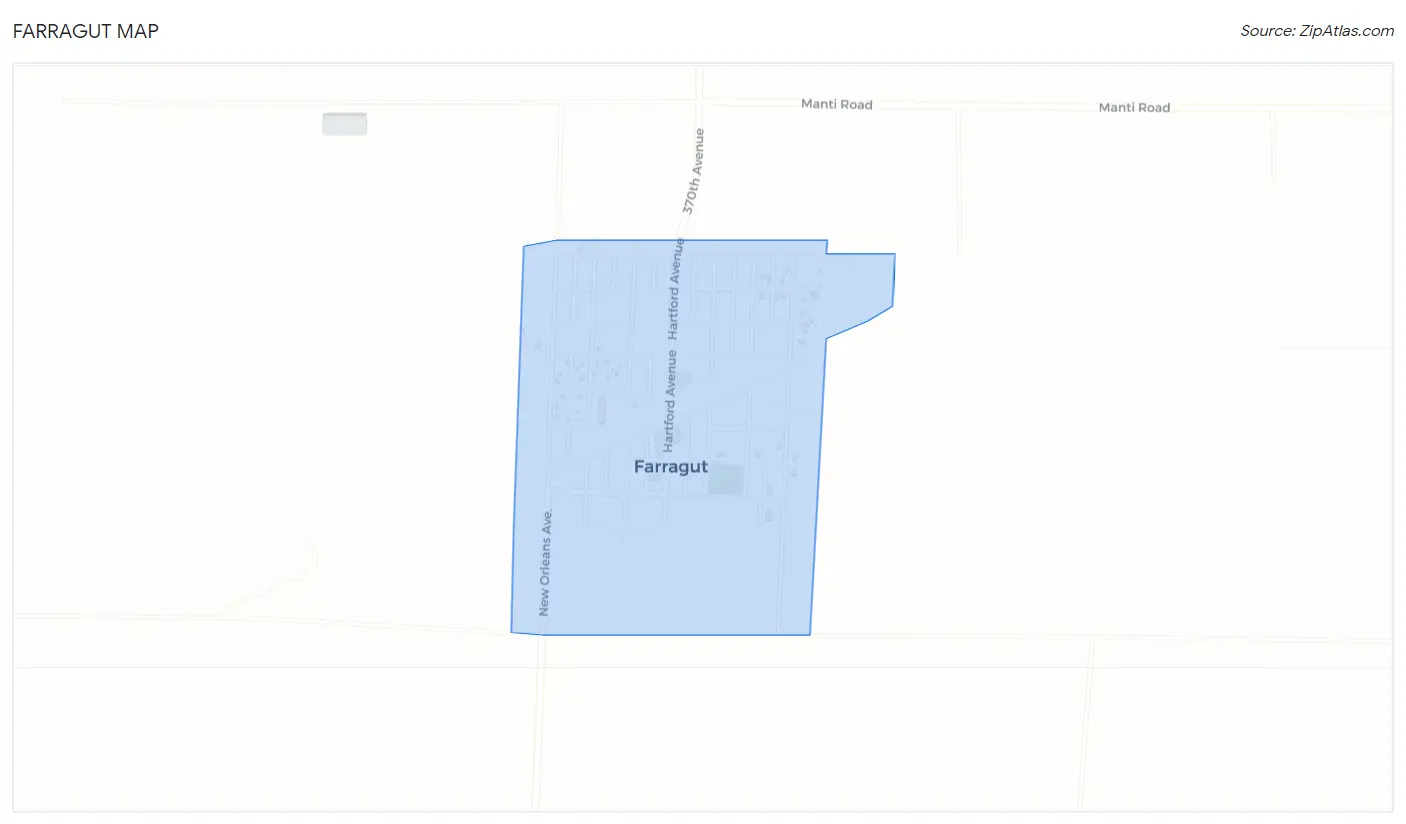
Farragut Map
Farragut Overview
$36,178
PER CAPITA INCOME
$79,375
AVG FAMILY INCOME
$47,500
AVG HOUSEHOLD INCOME
20.7%
WAGE / INCOME GAP [ % ]
79.3¢/ $1
WAGE / INCOME GAP [ $ ]
0.45
INEQUALITY / GINI INDEX
396
TOTAL POPULATION
216
MALE POPULATION
180
FEMALE POPULATION
120.00
MALES / 100 FEMALES
83.33
FEMALES / 100 MALES
46.2
MEDIAN AGE
2.5
AVG FAMILY SIZE
1.9
AVG HOUSEHOLD SIZE
208
LABOR FORCE [ PEOPLE ]
63.4%
PERCENT IN LABOR FORCE
Farragut Zip Codes
Farragut Area Codes
Income in Farragut
Income Overview in Farragut
Per Capita Income in Farragut is $36,178, while median incomes of families and households are $79,375 and $47,500 respectively.
| Characteristic | Number | Measure |
| Per Capita Income | 396 | $36,178 |
| Median Family Income | 112 | $79,375 |
| Mean Family Income | 112 | $91,156 |
| Median Household Income | 204 | $47,500 |
| Mean Household Income | 204 | $74,260 |
| Income Deficit | 112 | $0 |
| Wage / Income Gap (%) | 396 | 20.68% |
| Wage / Income Gap ($) | 396 | 79.32¢ per $1 |
| Gini / Inequality Index | 396 | 0.45 |
Earnings by Sex in Farragut
Average Earnings in Farragut are $40,972, $47,083 for men and $37,344 for women, a difference of 20.7%.
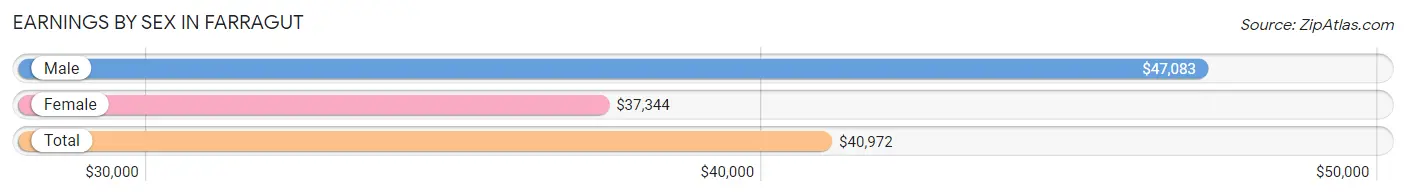
| Sex | Number | Average Earnings |
| Male | 110 (50.2%) | $47,083 |
| Female | 109 (49.8%) | $37,344 |
| Total | 219 (100.0%) | $40,972 |
Earnings by Sex by Income Bracket in Farragut
The most common earnings brackets in Farragut are $65,000 to $74,999 for men (23 | 20.9%) and $30,000 to $34,999 for women (18 | 16.5%).
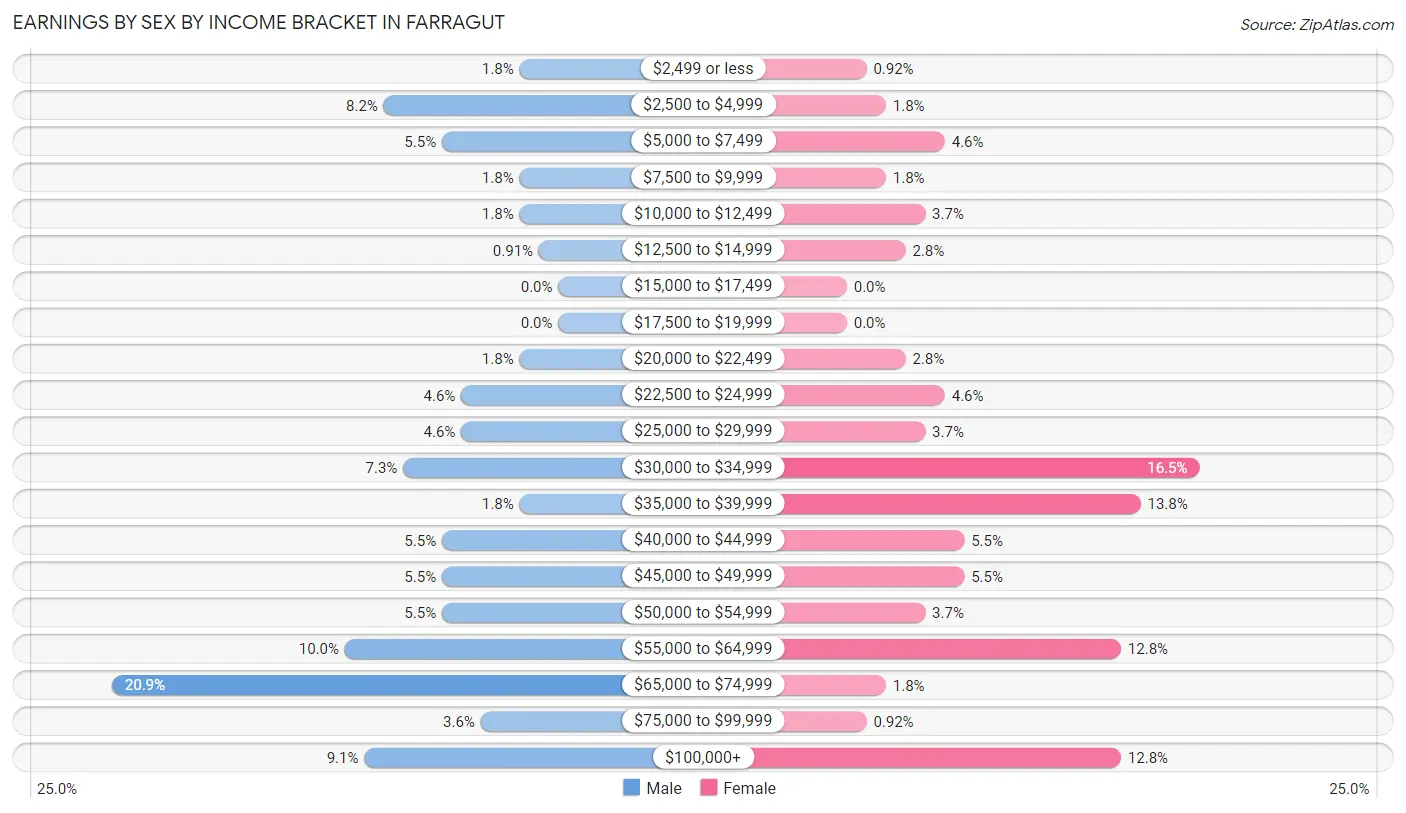
| Income | Male | Female |
| $2,499 or less | 2 (1.8%) | 1 (0.9%) |
| $2,500 to $4,999 | 9 (8.2%) | 2 (1.8%) |
| $5,000 to $7,499 | 6 (5.4%) | 5 (4.6%) |
| $7,500 to $9,999 | 2 (1.8%) | 2 (1.8%) |
| $10,000 to $12,499 | 2 (1.8%) | 4 (3.7%) |
| $12,500 to $14,999 | 1 (0.9%) | 3 (2.8%) |
| $15,000 to $17,499 | 0 (0.0%) | 0 (0.0%) |
| $17,500 to $19,999 | 0 (0.0%) | 0 (0.0%) |
| $20,000 to $22,499 | 2 (1.8%) | 3 (2.8%) |
| $22,500 to $24,999 | 5 (4.5%) | 5 (4.6%) |
| $25,000 to $29,999 | 5 (4.5%) | 4 (3.7%) |
| $30,000 to $34,999 | 8 (7.3%) | 18 (16.5%) |
| $35,000 to $39,999 | 2 (1.8%) | 15 (13.8%) |
| $40,000 to $44,999 | 6 (5.4%) | 6 (5.5%) |
| $45,000 to $49,999 | 6 (5.4%) | 6 (5.5%) |
| $50,000 to $54,999 | 6 (5.4%) | 4 (3.7%) |
| $55,000 to $64,999 | 11 (10.0%) | 14 (12.8%) |
| $65,000 to $74,999 | 23 (20.9%) | 2 (1.8%) |
| $75,000 to $99,999 | 4 (3.6%) | 1 (0.9%) |
| $100,000+ | 10 (9.1%) | 14 (12.8%) |
| Total | 110 (100.0%) | 109 (100.0%) |
Earnings by Sex by Educational Attainment in Farragut
Average earnings in Farragut are $50,833 for men and $37,031 for women, a difference of 27.2%. Men with an educational attainment of college or associate's degree enjoy the highest average annual earnings of $65,089, while those with high school diploma education earn the least with $41,667. Women with an educational attainment of bachelor's degree earn the most with the average annual earnings of $53,438, while those with high school diploma education have the smallest earnings of $31,250.
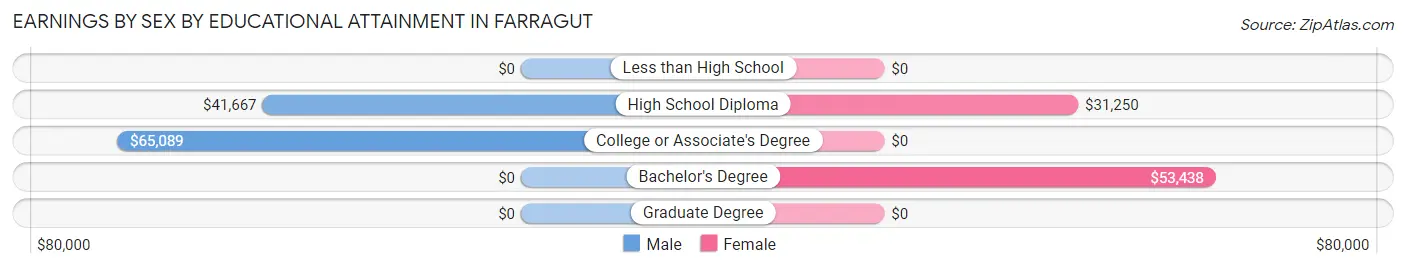
| Educational Attainment | Male Income | Female Income |
| Less than High School | - | - |
| High School Diploma | $41,667 | $31,250 |
| College or Associate's Degree | $65,089 | $0 |
| Bachelor's Degree | - | - |
| Graduate Degree | - | - |
| Total | $50,833 | $37,031 |
Family Income in Farragut
Family Income Brackets in Farragut
According to the Farragut family income data, there are 21 families falling into the $75,000 to $99,999 income range, which is the most common income bracket and makes up 18.8% of all families.
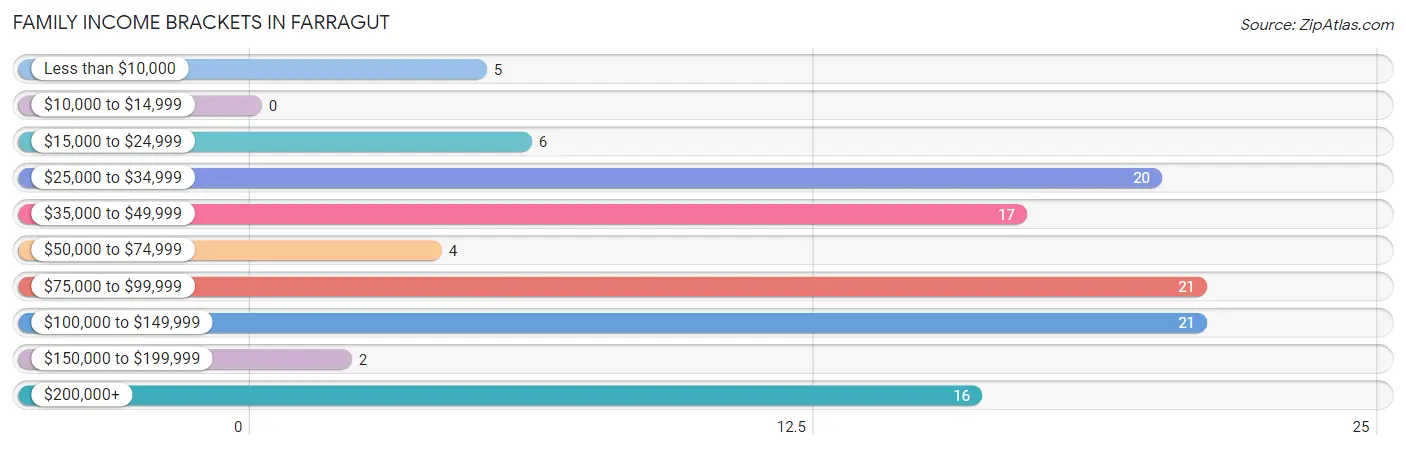
| Income Bracket | # Families | % Families |
| Less than $10,000 | 5 | 4.5% |
| $10,000 to $14,999 | 0 | 0.0% |
| $15,000 to $24,999 | 6 | 5.4% |
| $25,000 to $34,999 | 20 | 17.9% |
| $35,000 to $49,999 | 17 | 15.2% |
| $50,000 to $74,999 | 4 | 3.6% |
| $75,000 to $99,999 | 21 | 18.8% |
| $100,000 to $149,999 | 21 | 18.8% |
| $150,000 to $199,999 | 2 | 1.8% |
| $200,000+ | 16 | 14.3% |
Family Income by Famaliy Size in Farragut
4-person families (21 | 18.8%) account for the highest median family income in Farragut with $105,750 per family, while 2-person families (68 | 60.7%) have the highest median income of $26,875 per family member.
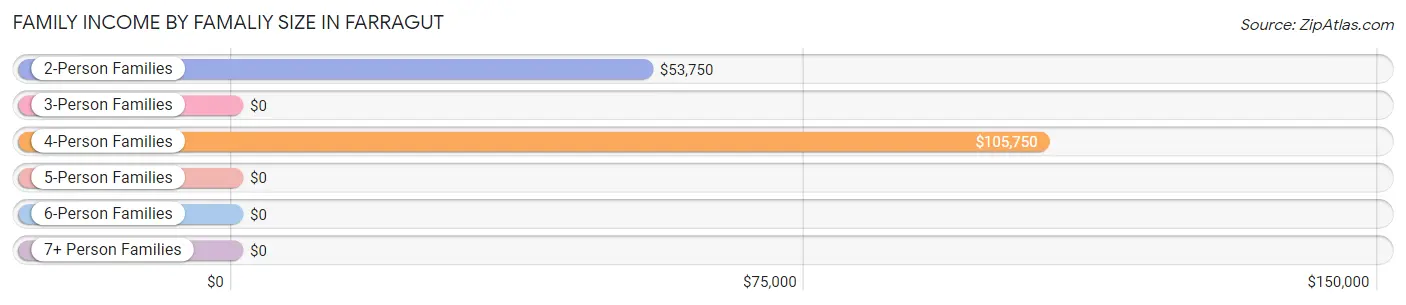
| Income Bracket | # Families | Median Income |
| 2-Person Families | 68 (60.7%) | $53,750 |
| 3-Person Families | 21 (18.8%) | $0 |
| 4-Person Families | 21 (18.8%) | $105,750 |
| 5-Person Families | 2 (1.8%) | $0 |
| 6-Person Families | 0 (0.0%) | $0 |
| 7+ Person Families | 0 (0.0%) | $0 |
| Total | 112 (100.0%) | $79,375 |
Family Income by Number of Earners in Farragut
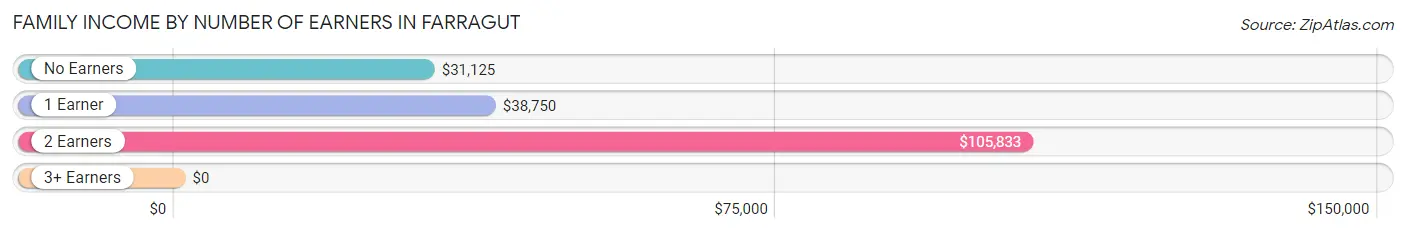
| Number of Earners | # Families | Median Income |
| No Earners | 27 (24.1%) | $31,125 |
| 1 Earner | 26 (23.2%) | $38,750 |
| 2 Earners | 58 (51.8%) | $105,833 |
| 3+ Earners | 1 (0.9%) | $0 |
| Total | 112 (100.0%) | $79,375 |
Household Income in Farragut
Household Income Brackets in Farragut
With 42 households falling in the category, the $100,000 to $149,999 income range is the most frequent in Farragut, accounting for 20.6% of all households. In contrast, only 2 households (1.0%) fall into the $150,000 to $199,999 income bracket, making it the least populous group.
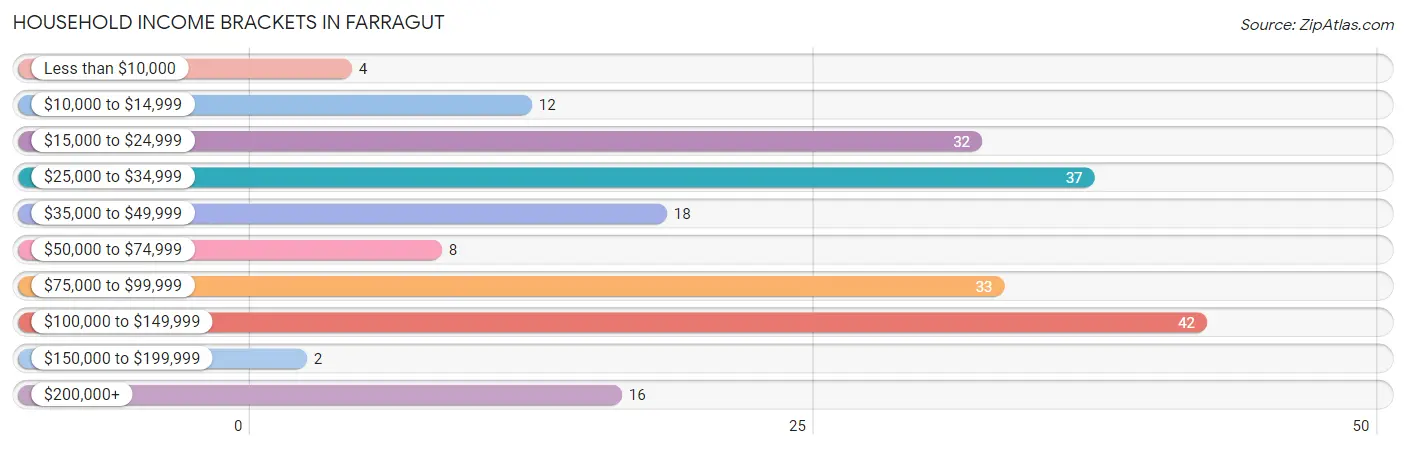
| Income Bracket | # Households | % Households |
| Less than $10,000 | 4 | 2.0% |
| $10,000 to $14,999 | 12 | 5.9% |
| $15,000 to $24,999 | 32 | 15.7% |
| $25,000 to $34,999 | 37 | 18.1% |
| $35,000 to $49,999 | 18 | 8.8% |
| $50,000 to $74,999 | 8 | 3.9% |
| $75,000 to $99,999 | 33 | 16.2% |
| $100,000 to $149,999 | 42 | 20.6% |
| $150,000 to $199,999 | 2 | 1.0% |
| $200,000+ | 16 | 7.8% |
Household Income by Householder Age in Farragut
The median household income in Farragut is $47,500, with the highest median household income of $87,500 found in the 45 to 64 years age bracket for the primary householder. A total of 80 households (39.2%) fall into this category. Meanwhile, the 15 to 24 years age bracket for the primary householder has the lowest median household income of $0, with 10 households (4.9%) in this group.
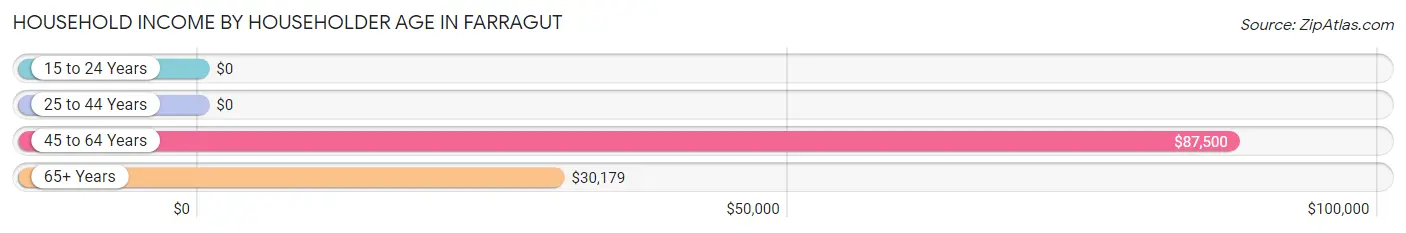
| Income Bracket | # Households | Median Income |
| 15 to 24 Years | 10 (4.9%) | $0 |
| 25 to 44 Years | 57 (27.9%) | $0 |
| 45 to 64 Years | 80 (39.2%) | $87,500 |
| 65+ Years | 57 (27.9%) | $30,179 |
| Total | 204 (100.0%) | $47,500 |
Poverty in Farragut
Income Below Poverty by Sex and Age in Farragut
With 6.5% poverty level for males and 14.4% for females among the residents of Farragut, 25 to 34 year old males and under 5 year old females are the most vulnerable to poverty, with 8 males (42.1%) and 6 females (54.5%) in their respective age groups living below the poverty level.
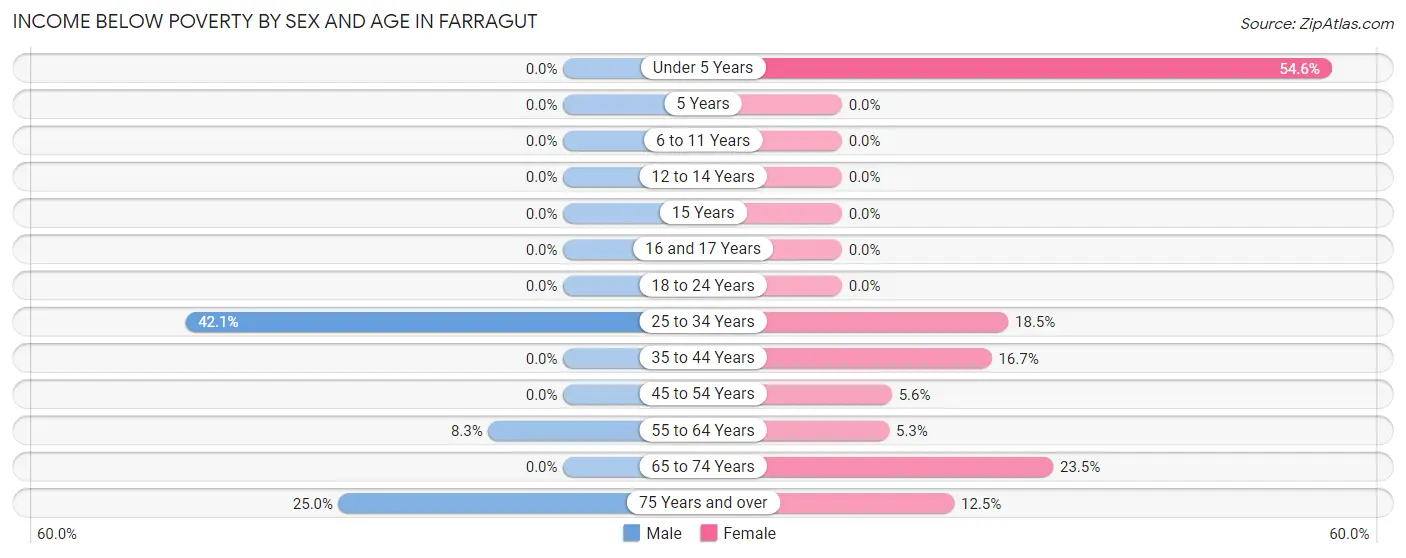
| Age Bracket | Male | Female |
| Under 5 Years | 0 (0.0%) | 6 (54.5%) |
| 5 Years | 0 (0.0%) | 0 (0.0%) |
| 6 to 11 Years | 0 (0.0%) | 0 (0.0%) |
| 12 to 14 Years | 0 (0.0%) | 0 (0.0%) |
| 15 Years | 0 (0.0%) | 0 (0.0%) |
| 16 and 17 Years | 0 (0.0%) | 0 (0.0%) |
| 18 to 24 Years | 0 (0.0%) | 0 (0.0%) |
| 25 to 34 Years | 8 (42.1%) | 5 (18.5%) |
| 35 to 44 Years | 0 (0.0%) | 4 (16.7%) |
| 45 to 54 Years | 0 (0.0%) | 1 (5.6%) |
| 55 to 64 Years | 2 (8.3%) | 2 (5.3%) |
| 65 to 74 Years | 0 (0.0%) | 4 (23.5%) |
| 75 Years and over | 4 (25.0%) | 4 (12.5%) |
| Total | 14 (6.5%) | 26 (14.4%) |
Income Above Poverty by Sex and Age in Farragut
According to the poverty statistics in Farragut, males aged under 5 years and females aged 6 to 11 years are the age groups that are most secure financially, with 100.0% of males and 100.0% of females in these age groups living above the poverty line.
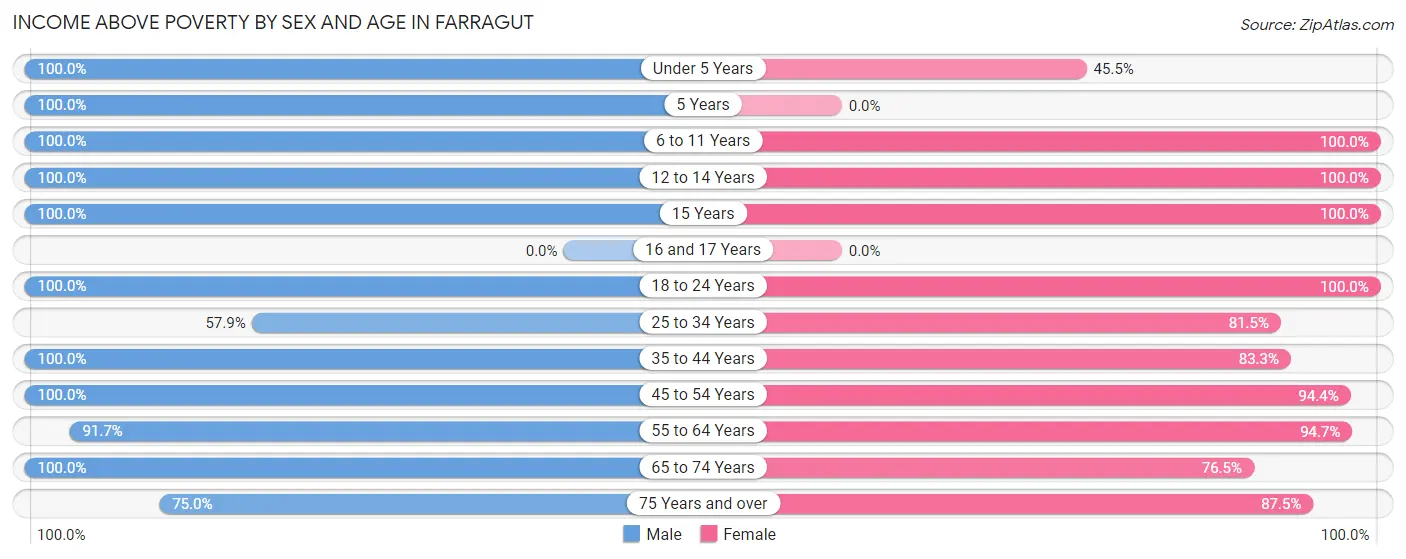
| Age Bracket | Male | Female |
| Under 5 Years | 3 (100.0%) | 5 (45.5%) |
| 5 Years | 6 (100.0%) | 0 (0.0%) |
| 6 to 11 Years | 8 (100.0%) | 5 (100.0%) |
| 12 to 14 Years | 27 (100.0%) | 3 (100.0%) |
| 15 Years | 4 (100.0%) | 1 (100.0%) |
| 16 and 17 Years | 0 (0.0%) | 0 (0.0%) |
| 18 to 24 Years | 10 (100.0%) | 4 (100.0%) |
| 25 to 34 Years | 11 (57.9%) | 22 (81.5%) |
| 35 to 44 Years | 38 (100.0%) | 20 (83.3%) |
| 45 to 54 Years | 36 (100.0%) | 17 (94.4%) |
| 55 to 64 Years | 22 (91.7%) | 36 (94.7%) |
| 65 to 74 Years | 25 (100.0%) | 13 (76.5%) |
| 75 Years and over | 12 (75.0%) | 28 (87.5%) |
| Total | 202 (93.5%) | 154 (85.6%) |
Income Below Poverty Among Married-Couple Families in Farragut
The poverty statistics for married-couple families in Farragut show that 4.9% or 4 of the total 82 families live below the poverty line. Families with no children have the highest poverty rate of 6.8%, comprising of 4 families. On the other hand, families with 1 or 2 children have the lowest poverty rate of 0.0%, which includes 0 families.
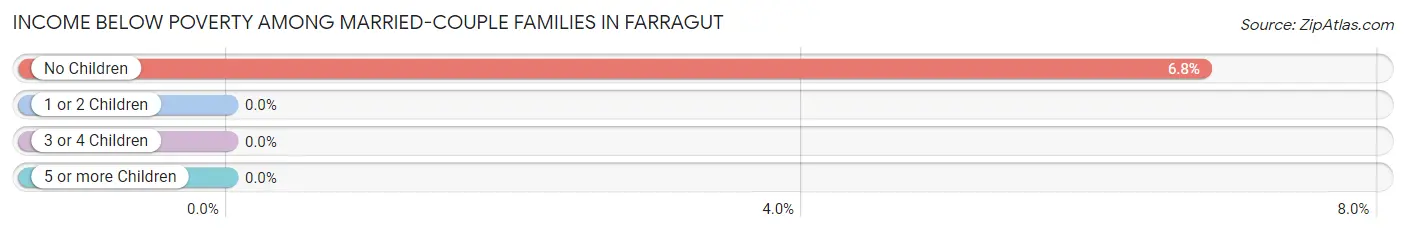
| Children | Above Poverty | Below Poverty |
| No Children | 55 (93.2%) | 4 (6.8%) |
| 1 or 2 Children | 21 (100.0%) | 0 (0.0%) |
| 3 or 4 Children | 2 (100.0%) | 0 (0.0%) |
| 5 or more Children | 0 (0.0%) | 0 (0.0%) |
| Total | 78 (95.1%) | 4 (4.9%) |
Income Below Poverty Among Single-Parent Households in Farragut
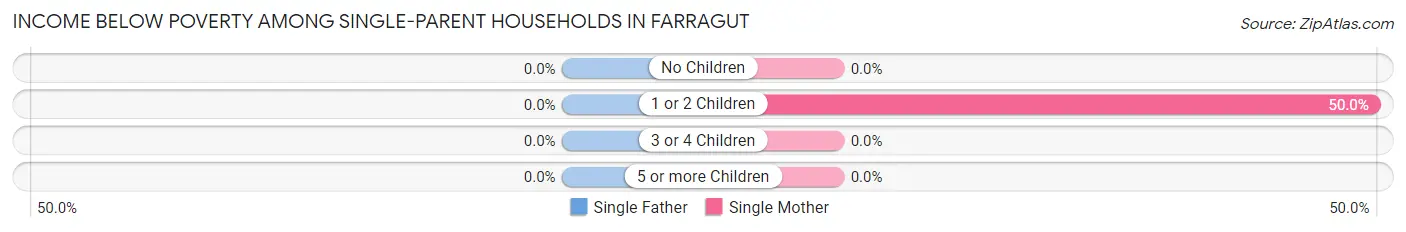
| Children | Single Father | Single Mother |
| No Children | 0 (0.0%) | 0 (0.0%) |
| 1 or 2 Children | 0 (0.0%) | 5 (50.0%) |
| 3 or 4 Children | 0 (0.0%) | 0 (0.0%) |
| 5 or more Children | 0 (0.0%) | 0 (0.0%) |
| Total | 0 (0.0%) | 5 (45.5%) |
Income Below Poverty Among Married-Couple vs Single-Parent Households in Farragut
The poverty data for Farragut shows that 4 of the married-couple family households (4.9%) and 5 of the single-parent households (16.7%) are living below the poverty level. Within the married-couple family households, those with no children have the highest poverty rate, with 4 households (6.8%) falling below the poverty line. Among the single-parent households, those with 1 or 2 children have the highest poverty rate, with 5 household (35.7%) living below poverty.
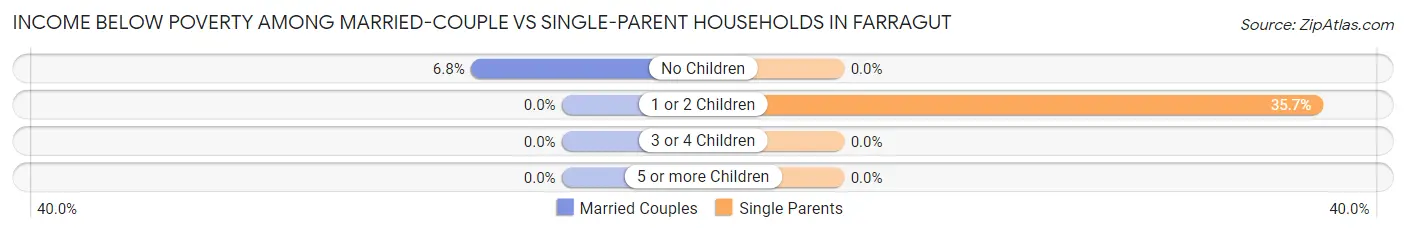
| Children | Married-Couple Families | Single-Parent Households |
| No Children | 4 (6.8%) | 0 (0.0%) |
| 1 or 2 Children | 0 (0.0%) | 5 (35.7%) |
| 3 or 4 Children | 0 (0.0%) | 0 (0.0%) |
| 5 or more Children | 0 (0.0%) | 0 (0.0%) |
| Total | 4 (4.9%) | 5 (16.7%) |
Race in Farragut
The most populous races in Farragut are White / Caucasian (369 | 93.2%), and Two or more Races (27 | 6.8%).
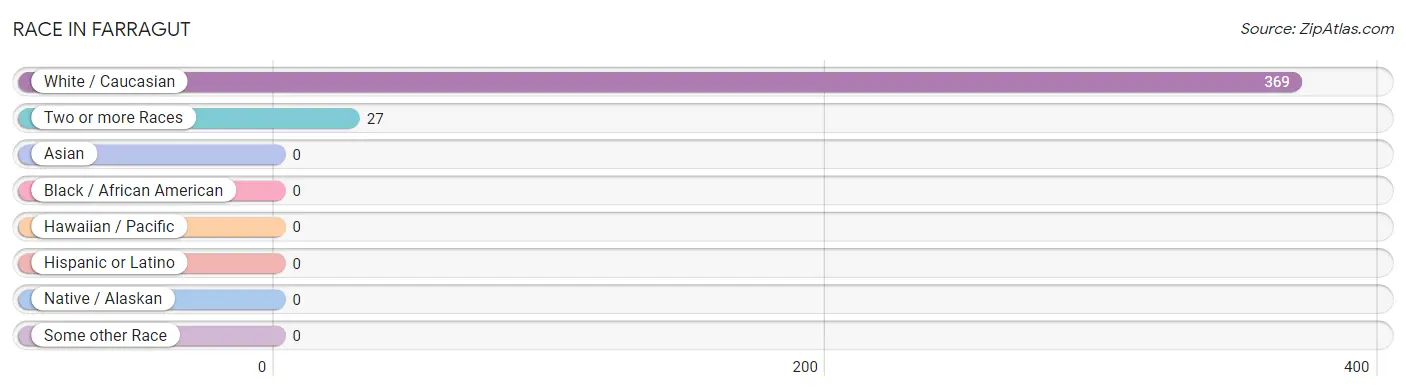
| Race | # Population | % Population |
| Asian | 0 | 0.0% |
| Black / African American | 0 | 0.0% |
| Hawaiian / Pacific | 0 | 0.0% |
| Hispanic or Latino | 0 | 0.0% |
| Native / Alaskan | 0 | 0.0% |
| White / Caucasian | 369 | 93.2% |
| Two or more Races | 27 | 6.8% |
| Some other Race | 0 | 0.0% |
| Total | 396 | 100.0% |
Ancestry in Farragut
The most populous ancestries reported in Farragut are German (157 | 39.7%), Irish (53 | 13.4%), English (35 | 8.8%), American (27 | 6.8%), and European (18 | 4.5%), together accounting for 73.2% of all Farragut residents.
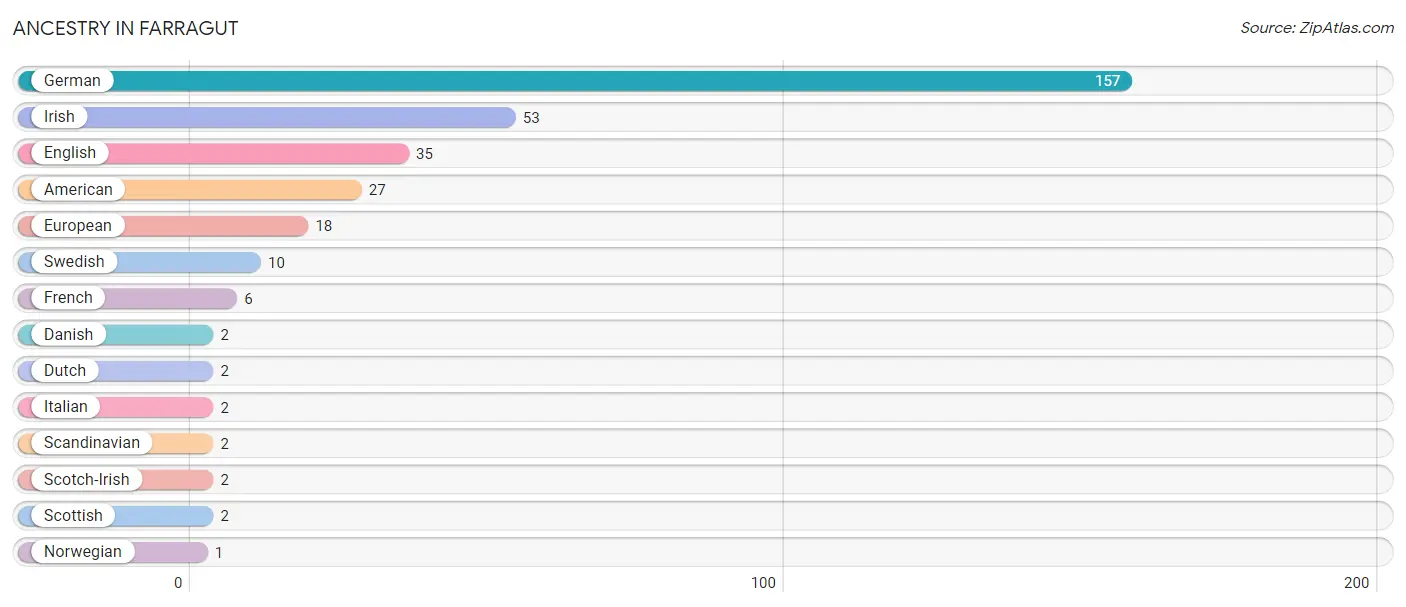
| Ancestry | # Population | % Population |
| American | 27 | 6.8% |
| Danish | 2 | 0.5% |
| Dutch | 2 | 0.5% |
| English | 35 | 8.8% |
| European | 18 | 4.5% |
| French | 6 | 1.5% |
| German | 157 | 39.7% |
| Irish | 53 | 13.4% |
| Italian | 2 | 0.5% |
| Norwegian | 1 | 0.3% |
| Scandinavian | 2 | 0.5% |
| Scotch-Irish | 2 | 0.5% |
| Scottish | 2 | 0.5% |
| Swedish | 10 | 2.5% | View All 14 Rows |
Immigrants in Farragut
The most numerous immigrant groups reported in Farragut came from , and Canada (2 | 0.5%), together accounting for 0.5% of all Farragut residents.

| Immigration Origin | # Population | % Population |
| Canada | 2 | 0.5% | View All 1 Rows |
Sex and Age in Farragut
Sex and Age in Farragut
The most populous age groups in Farragut are 10 to 14 Years (31 | 14.3%) for men and 60 to 64 Years (27 | 15.0%) for women.
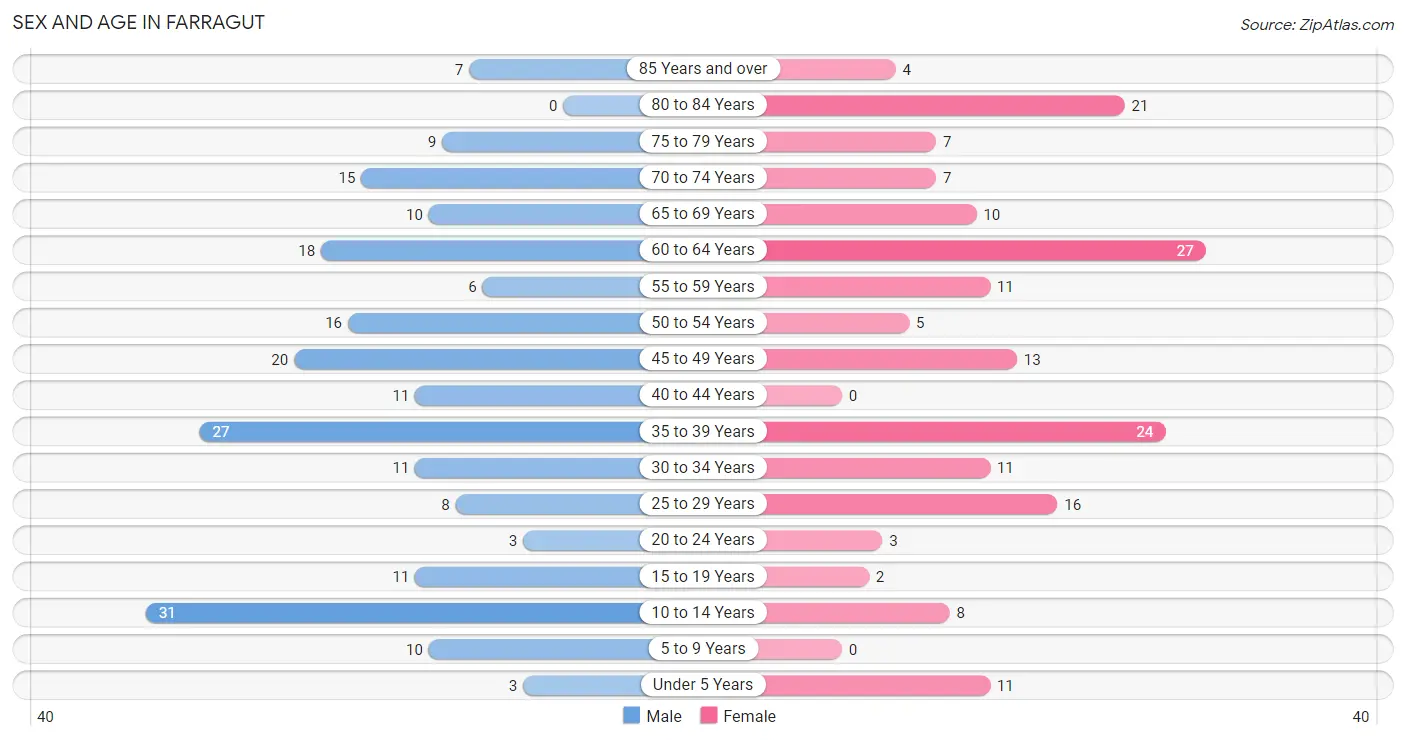
| Age Bracket | Male | Female |
| Under 5 Years | 3 (1.4%) | 11 (6.1%) |
| 5 to 9 Years | 10 (4.6%) | 0 (0.0%) |
| 10 to 14 Years | 31 (14.3%) | 8 (4.4%) |
| 15 to 19 Years | 11 (5.1%) | 2 (1.1%) |
| 20 to 24 Years | 3 (1.4%) | 3 (1.7%) |
| 25 to 29 Years | 8 (3.7%) | 16 (8.9%) |
| 30 to 34 Years | 11 (5.1%) | 11 (6.1%) |
| 35 to 39 Years | 27 (12.5%) | 24 (13.3%) |
| 40 to 44 Years | 11 (5.1%) | 0 (0.0%) |
| 45 to 49 Years | 20 (9.3%) | 13 (7.2%) |
| 50 to 54 Years | 16 (7.4%) | 5 (2.8%) |
| 55 to 59 Years | 6 (2.8%) | 11 (6.1%) |
| 60 to 64 Years | 18 (8.3%) | 27 (15.0%) |
| 65 to 69 Years | 10 (4.6%) | 10 (5.6%) |
| 70 to 74 Years | 15 (6.9%) | 7 (3.9%) |
| 75 to 79 Years | 9 (4.2%) | 7 (3.9%) |
| 80 to 84 Years | 0 (0.0%) | 21 (11.7%) |
| 85 Years and over | 7 (3.2%) | 4 (2.2%) |
| Total | 216 (100.0%) | 180 (100.0%) |
Families and Households in Farragut
Median Family Size in Farragut
The median family size in Farragut is 2.53 persons per family, with married-couple families (82 | 73.2%) accounting for the largest median family size of 2.59 persons per family. On the other hand, single male/father families (19 | 17.0%) represent the smallest median family size with 2.32 persons per family.
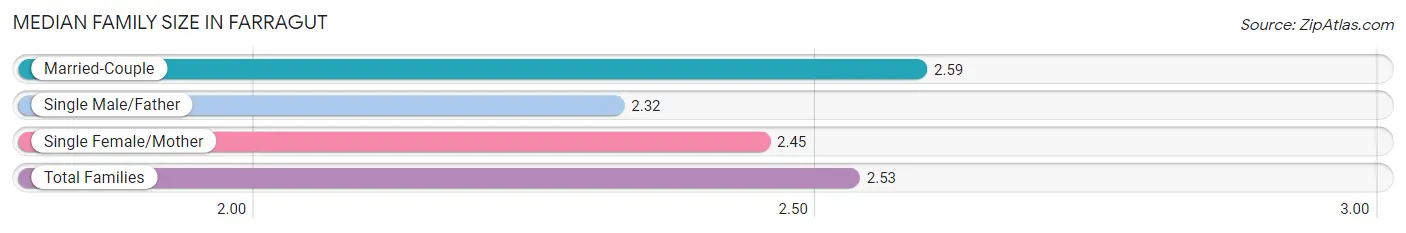
| Family Type | # Families | Family Size |
| Married-Couple | 82 (73.2%) | 2.59 |
| Single Male/Father | 19 (17.0%) | 2.32 |
| Single Female/Mother | 11 (9.8%) | 2.45 |
| Total Families | 112 (100.0%) | 2.53 |
Median Household Size in Farragut
The median household size in Farragut is 1.94 persons per household, with single female/mother households (11 | 5.4%) accounting for the largest median household size of 3 persons per household. non-family households (92 | 45.1%) represent the smallest median household size with 1.14 persons per household.
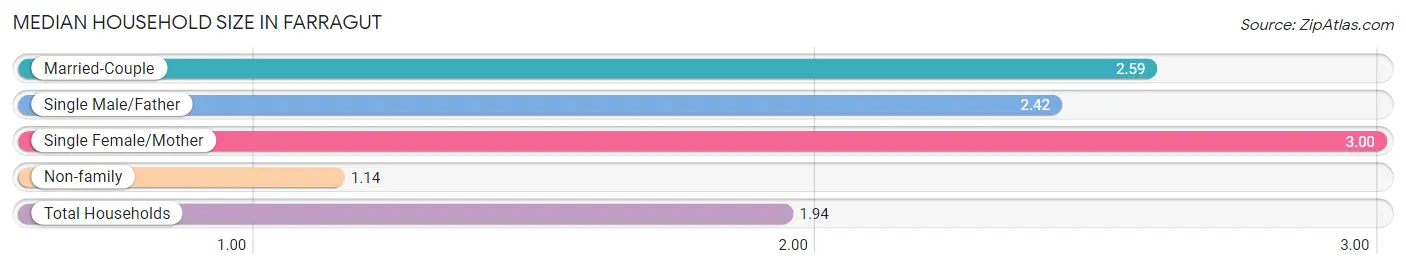
| Household Type | # Households | Household Size |
| Married-Couple | 82 (40.2%) | 2.59 |
| Single Male/Father | 19 (9.3%) | 2.42 |
| Single Female/Mother | 11 (5.4%) | 3.00 |
| Non-family | 92 (45.1%) | 1.14 |
| Total Households | 204 (100.0%) | 1.94 |
Household Size by Marriage Status in Farragut
Out of a total of 204 households in Farragut, 112 (54.9%) are family households, while 92 (45.1%) are nonfamily households. The most numerous type of family households are 2-person households, comprising 63, and the most common type of nonfamily households are 1-person households, comprising 77.
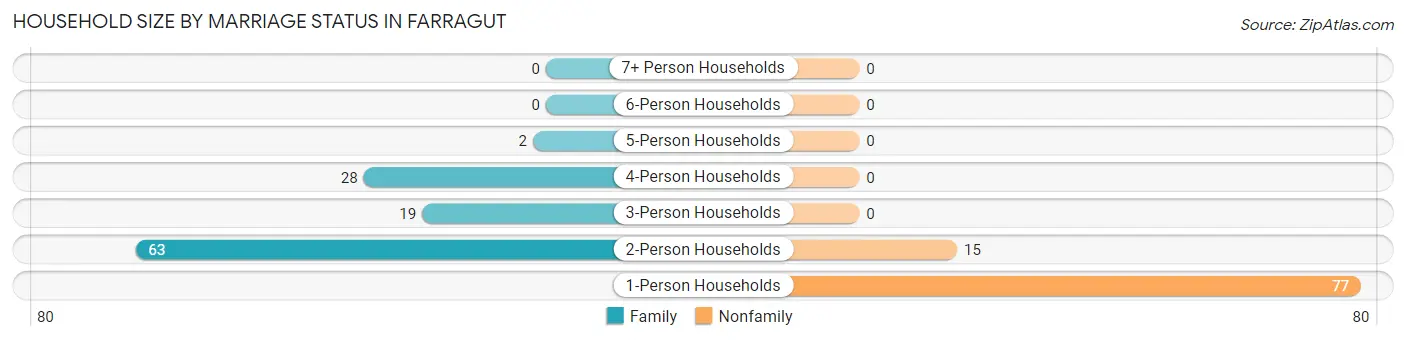
| Household Size | Family Households | Nonfamily Households |
| 1-Person Households | - | 77 (37.8%) |
| 2-Person Households | 63 (30.9%) | 15 (7.3%) |
| 3-Person Households | 19 (9.3%) | 0 (0.0%) |
| 4-Person Households | 28 (13.7%) | 0 (0.0%) |
| 5-Person Households | 2 (1.0%) | 0 (0.0%) |
| 6-Person Households | 0 (0.0%) | 0 (0.0%) |
| 7+ Person Households | 0 (0.0%) | 0 (0.0%) |
| Total | 112 (54.9%) | 92 (45.1%) |
Female Fertility in Farragut
Fertility by Age in Farragut
Average fertility rate in Farragut is 72.0 births per 1,000 women. Women in the age bracket of 20 to 34 years have the highest fertility rate with 167.0 births per 1,000 women. Women in the age bracket of 20 to 34 years acount for 100.0% of all women with births.
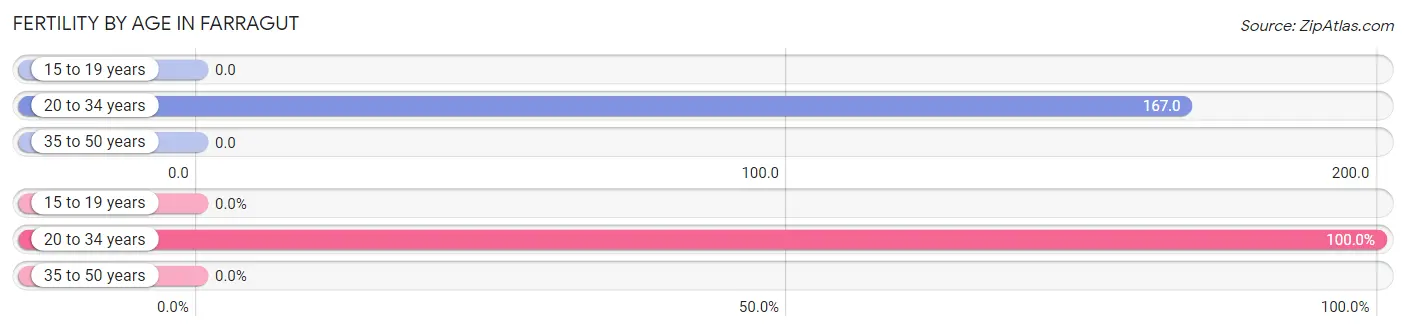
| Age Bracket | Women with Births | Births / 1,000 Women |
| 15 to 19 years | 0 (0.0%) | 0.0 |
| 20 to 34 years | 5 (100.0%) | 167.0 |
| 35 to 50 years | 0 (0.0%) | 0.0 |
| Total | 5 (100.0%) | 72.0 |
Fertility by Age by Marriage Status in Farragut
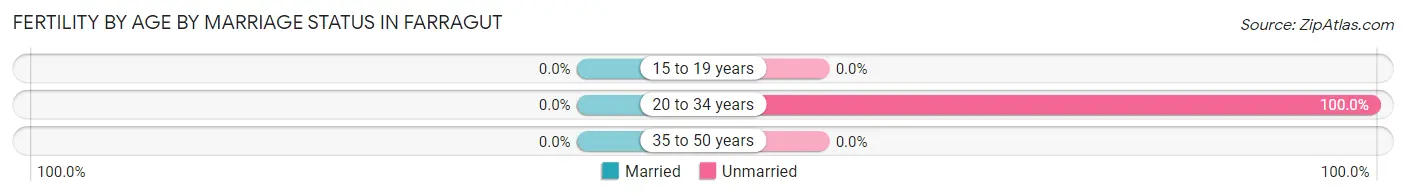
| Age Bracket | Married | Unmarried |
| 15 to 19 years | 0 (0.0%) | 0 (0.0%) |
| 20 to 34 years | 0 (0.0%) | 5 (100.0%) |
| 35 to 50 years | 0 (0.0%) | 0 (0.0%) |
| Total | 0 (0.0%) | 5 (100.0%) |
Fertility by Education in Farragut
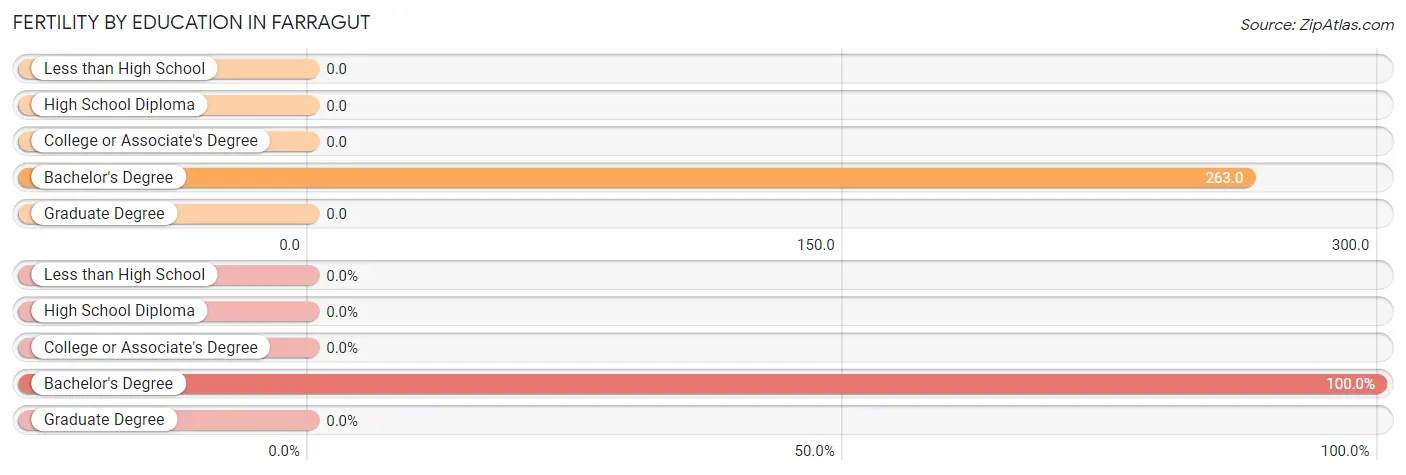
| Educational Attainment | Women with Births | Births / 1,000 Women |
| Less than High School | 0 (0.0%) | 0.0 |
| High School Diploma | 0 (0.0%) | 0.0 |
| College or Associate's Degree | 0 (0.0%) | 0.0 |
| Bachelor's Degree | 5 (100.0%) | 263.0 |
| Graduate Degree | 0 (0.0%) | 0.0 |
| Total | 5 (100.0%) | 72.0 |
Fertility by Education by Marriage Status in Farragut
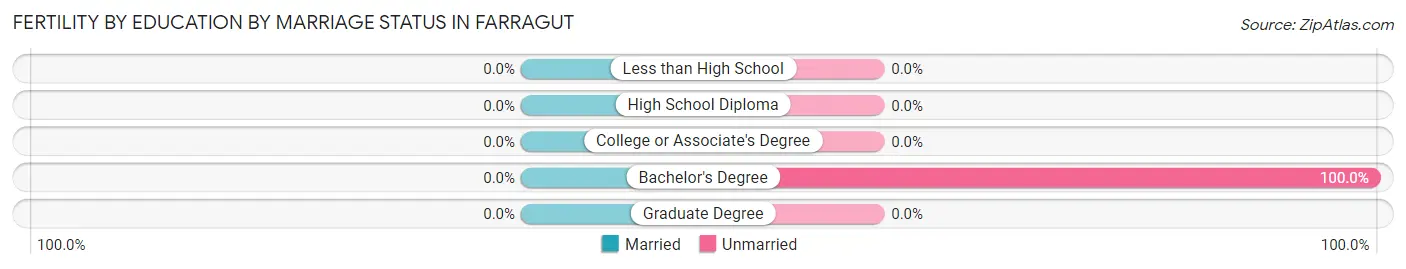
| Educational Attainment | Married | Unmarried |
| Less than High School | 0 (0.0%) | 0 (0.0%) |
| High School Diploma | 0 (0.0%) | 0 (0.0%) |
| College or Associate's Degree | 0 (0.0%) | 0 (0.0%) |
| Bachelor's Degree | 0 (0.0%) | 5 (100.0%) |
| Graduate Degree | 0 (0.0%) | 0 (0.0%) |
| Total | 0 (0.0%) | 5 (100.0%) |
Employment Characteristics in Farragut
Employment by Class of Employer in Farragut
Among the 207 employed individuals in Farragut, private company employees (142 | 68.6%), local government employees (34 | 16.4%), and self-employed (not incorporated) (19 | 9.2%) make up the most common classes of employment.
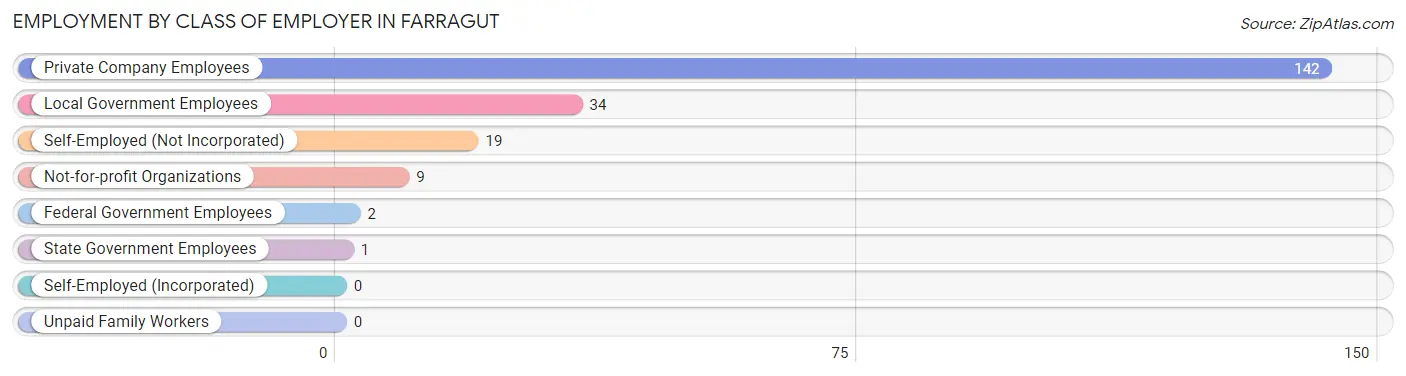
| Employer Class | # Employees | % Employees |
| Private Company Employees | 142 | 68.6% |
| Self-Employed (Incorporated) | 0 | 0.0% |
| Self-Employed (Not Incorporated) | 19 | 9.2% |
| Not-for-profit Organizations | 9 | 4.3% |
| Local Government Employees | 34 | 16.4% |
| State Government Employees | 1 | 0.5% |
| Federal Government Employees | 2 | 1.0% |
| Unpaid Family Workers | 0 | 0.0% |
| Total | 207 | 100.0% |
Employment Status by Age in Farragut
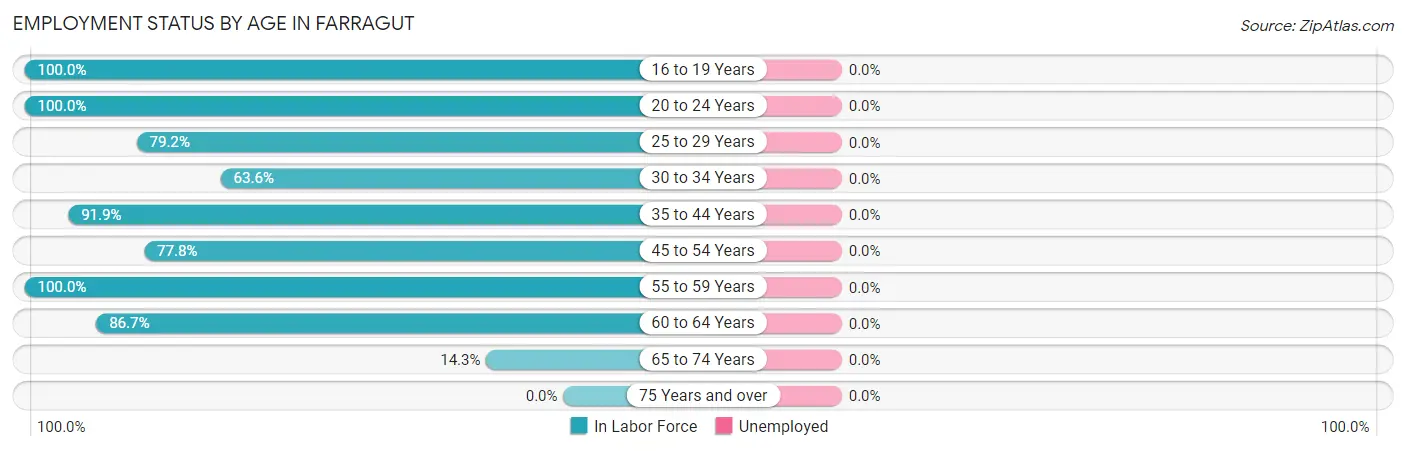
| Age Bracket | In Labor Force | Unemployed |
| 16 to 19 Years | 8 (100.0%) | 0 (0.0%) |
| 20 to 24 Years | 6 (100.0%) | 0 (0.0%) |
| 25 to 29 Years | 19 (79.2%) | 0 (0.0%) |
| 30 to 34 Years | 14 (63.6%) | 0 (0.0%) |
| 35 to 44 Years | 57 (91.9%) | 0 (0.0%) |
| 45 to 54 Years | 42 (77.8%) | 0 (0.0%) |
| 55 to 59 Years | 17 (100.0%) | 0 (0.0%) |
| 60 to 64 Years | 39 (86.7%) | 0 (0.0%) |
| 65 to 74 Years | 6 (14.3%) | 0 (0.0%) |
| 75 Years and over | 0 (0.0%) | 0 (0.0%) |
| Total | 208 (63.4%) | 0 (0.0%) |
Employment Status by Educational Attainment in Farragut
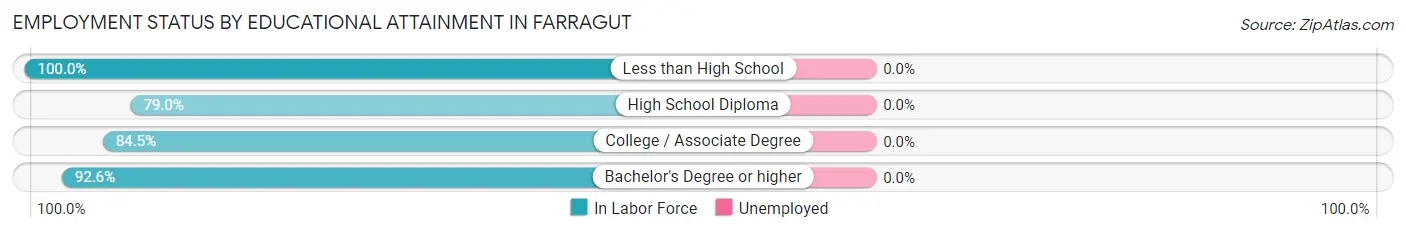
| Educational Attainment | In Labor Force | Unemployed |
| Less than High School | 6 (100.0%) | 0 (0.0%) |
| High School Diploma | 64 (79.0%) | 0 (0.0%) |
| College / Associate Degree | 93 (84.5%) | 0 (0.0%) |
| Bachelor's Degree or higher | 25 (92.6%) | 0 (0.0%) |
| Total | 188 (83.9%) | 0 (0.0%) |
Employment Occupations by Sex in Farragut
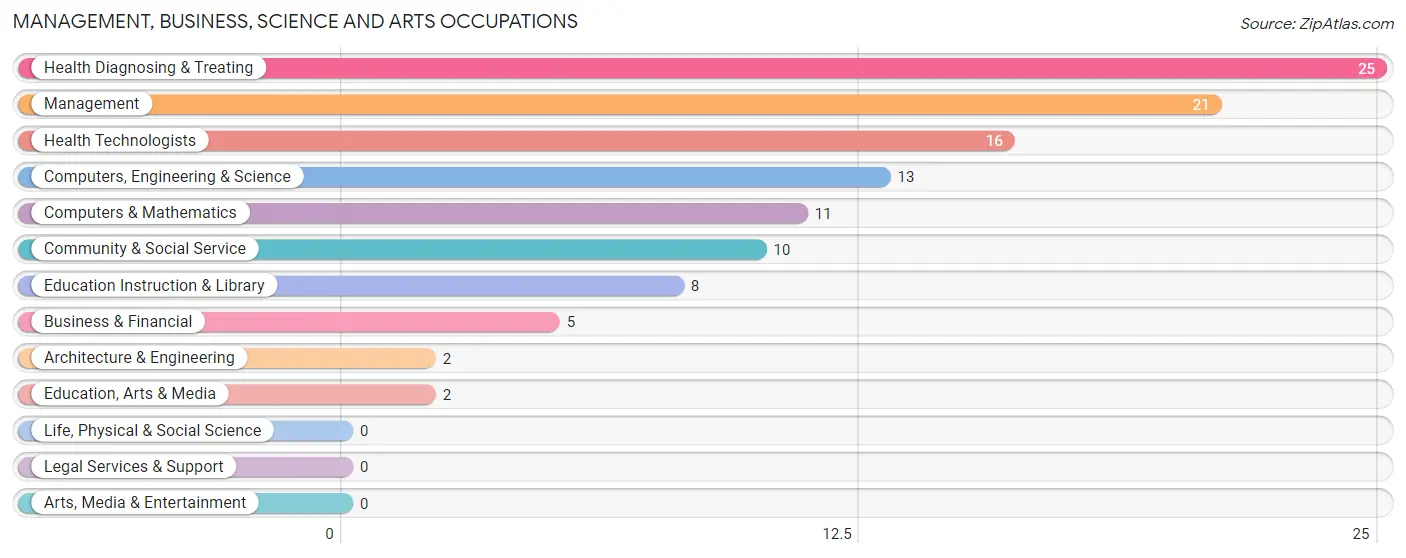
Management, Business, Science and Arts Occupations
The most common Management, Business, Science and Arts occupations in Farragut are Health Diagnosing & Treating (25 | 12.0%), Management (21 | 10.1%), Health Technologists (16 | 7.7%), Computers, Engineering & Science (13 | 6.2%), and Computers & Mathematics (11 | 5.3%).
Management, Business, Science and Arts Occupations by Sex
Within the Management, Business, Science and Arts occupations in Farragut, the most male-oriented occupations are Architecture & Engineering (100.0%), Management (95.2%), and Computers, Engineering & Science (92.3%), while the most female-oriented occupations are Business & Financial (100.0%), Education, Arts & Media (100.0%), and Health Technologists (100.0%).
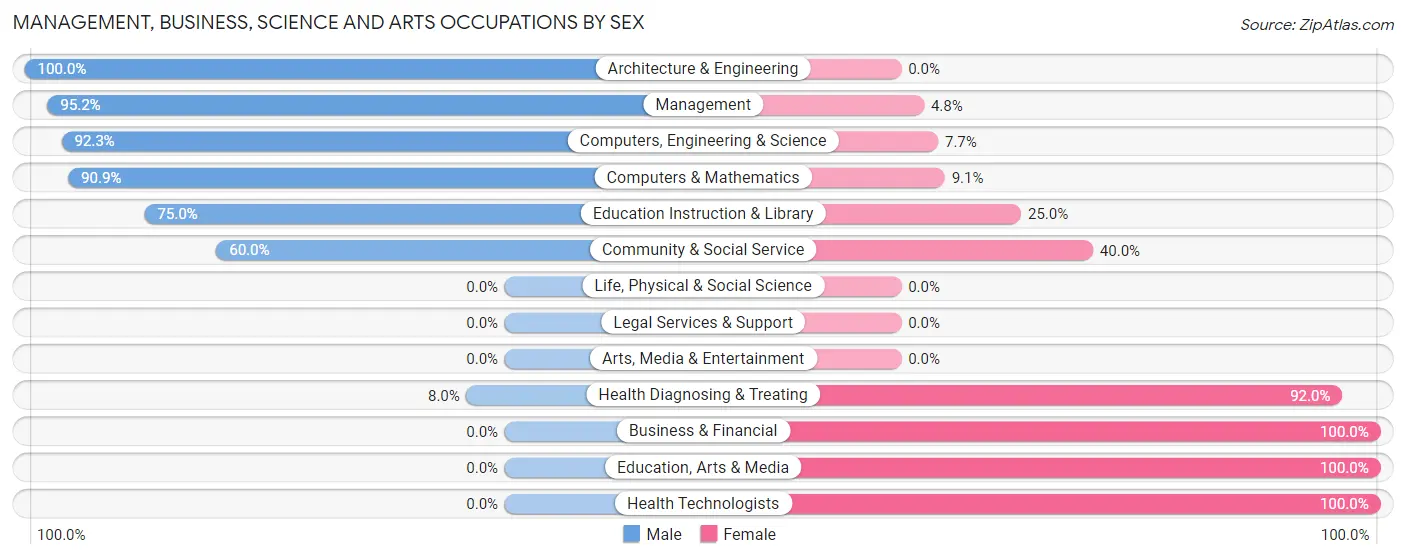
| Occupation | Male | Female |
| Management | 20 (95.2%) | 1 (4.8%) |
| Business & Financial | 0 (0.0%) | 5 (100.0%) |
| Computers, Engineering & Science | 12 (92.3%) | 1 (7.7%) |
| Computers & Mathematics | 10 (90.9%) | 1 (9.1%) |
| Architecture & Engineering | 2 (100.0%) | 0 (0.0%) |
| Life, Physical & Social Science | 0 (0.0%) | 0 (0.0%) |
| Community & Social Service | 6 (60.0%) | 4 (40.0%) |
| Education, Arts & Media | 0 (0.0%) | 2 (100.0%) |
| Legal Services & Support | 0 (0.0%) | 0 (0.0%) |
| Education Instruction & Library | 6 (75.0%) | 2 (25.0%) |
| Arts, Media & Entertainment | 0 (0.0%) | 0 (0.0%) |
| Health Diagnosing & Treating | 2 (8.0%) | 23 (92.0%) |
| Health Technologists | 0 (0.0%) | 16 (100.0%) |
| Total (Category) | 40 (54.0%) | 34 (46.0%) |
| Total (Overall) | 100 (48.1%) | 108 (51.9%) |
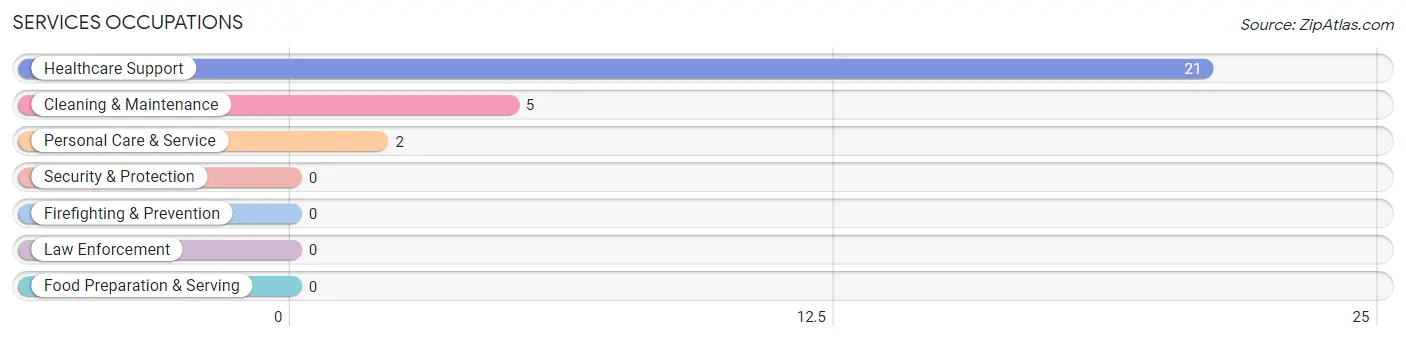
Services Occupations
The most common Services occupations in Farragut are Healthcare Support (21 | 10.1%), Cleaning & Maintenance (5 | 2.4%), and Personal Care & Service (2 | 1.0%).
Services Occupations by Sex
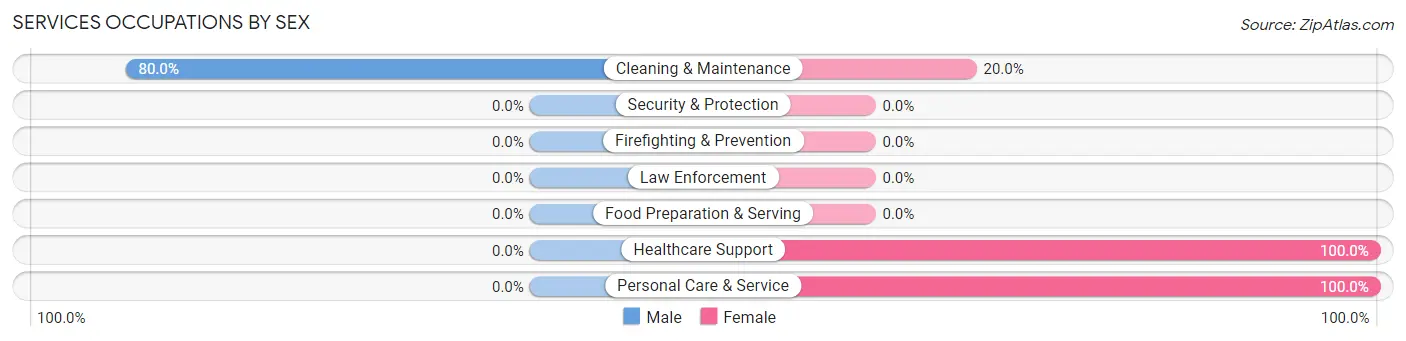
| Occupation | Male | Female |
| Healthcare Support | 0 (0.0%) | 21 (100.0%) |
| Security & Protection | 0 (0.0%) | 0 (0.0%) |
| Firefighting & Prevention | 0 (0.0%) | 0 (0.0%) |
| Law Enforcement | 0 (0.0%) | 0 (0.0%) |
| Food Preparation & Serving | 0 (0.0%) | 0 (0.0%) |
| Cleaning & Maintenance | 4 (80.0%) | 1 (20.0%) |
| Personal Care & Service | 0 (0.0%) | 2 (100.0%) |
| Total (Category) | 4 (14.3%) | 24 (85.7%) |
| Total (Overall) | 100 (48.1%) | 108 (51.9%) |
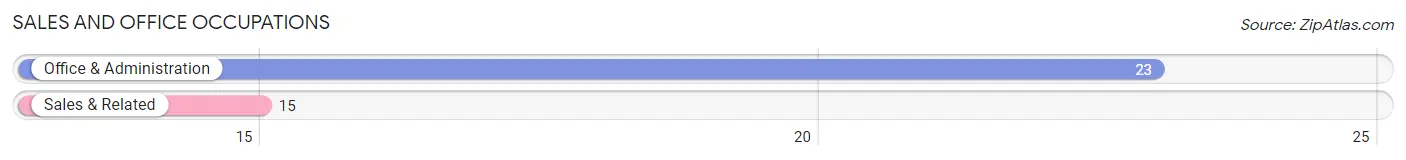
Sales and Office Occupations
The most common Sales and Office occupations in Farragut are Office & Administration (23 | 11.1%), and Sales & Related (15 | 7.2%).
Sales and Office Occupations by Sex
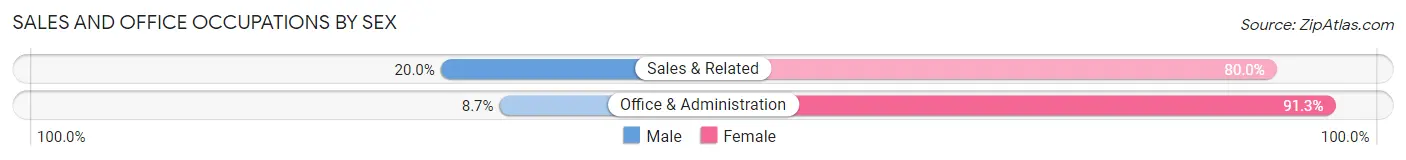
| Occupation | Male | Female |
| Sales & Related | 3 (20.0%) | 12 (80.0%) |
| Office & Administration | 2 (8.7%) | 21 (91.3%) |
| Total (Category) | 5 (13.2%) | 33 (86.8%) |
| Total (Overall) | 100 (48.1%) | 108 (51.9%) |
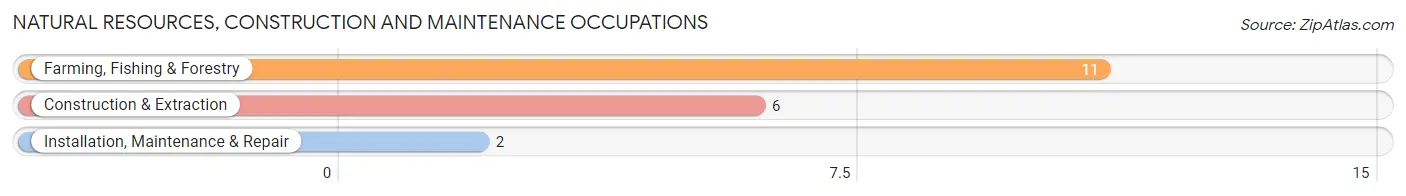
Natural Resources, Construction and Maintenance Occupations
The most common Natural Resources, Construction and Maintenance occupations in Farragut are Farming, Fishing & Forestry (11 | 5.3%), Construction & Extraction (6 | 2.9%), and Installation, Maintenance & Repair (2 | 1.0%).
Natural Resources, Construction and Maintenance Occupations by Sex
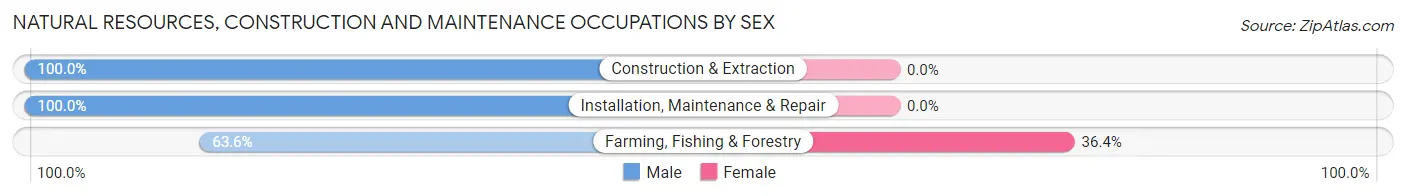
| Occupation | Male | Female |
| Farming, Fishing & Forestry | 7 (63.6%) | 4 (36.4%) |
| Construction & Extraction | 6 (100.0%) | 0 (0.0%) |
| Installation, Maintenance & Repair | 2 (100.0%) | 0 (0.0%) |
| Total (Category) | 15 (78.9%) | 4 (21.0%) |
| Total (Overall) | 100 (48.1%) | 108 (51.9%) |
Production, Transportation and Moving Occupations
The most common Production, Transportation and Moving occupations in Farragut are Production (28 | 13.5%), Material Moving (12 | 5.8%), and Transportation (9 | 4.3%).
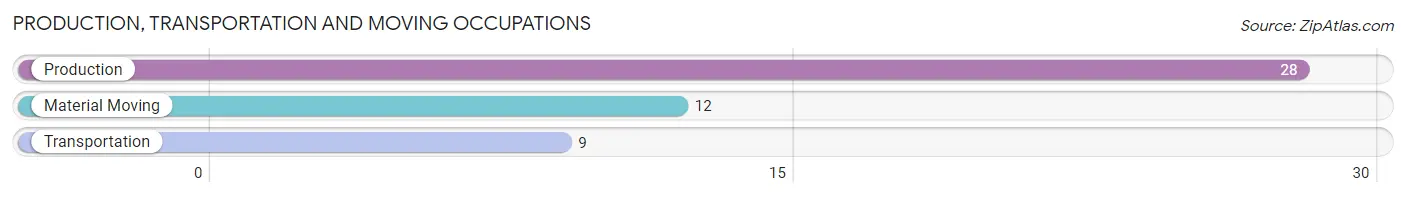
Production, Transportation and Moving Occupations by Sex
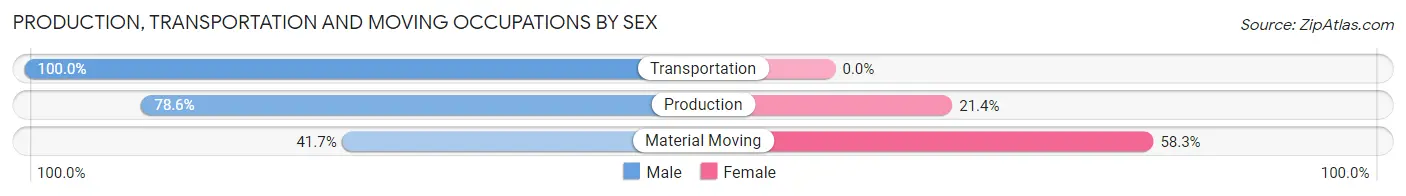
| Occupation | Male | Female |
| Production | 22 (78.6%) | 6 (21.4%) |
| Transportation | 9 (100.0%) | 0 (0.0%) |
| Material Moving | 5 (41.7%) | 7 (58.3%) |
| Total (Category) | 36 (73.5%) | 13 (26.5%) |
| Total (Overall) | 100 (48.1%) | 108 (51.9%) |
Employment Industries by Sex in Farragut
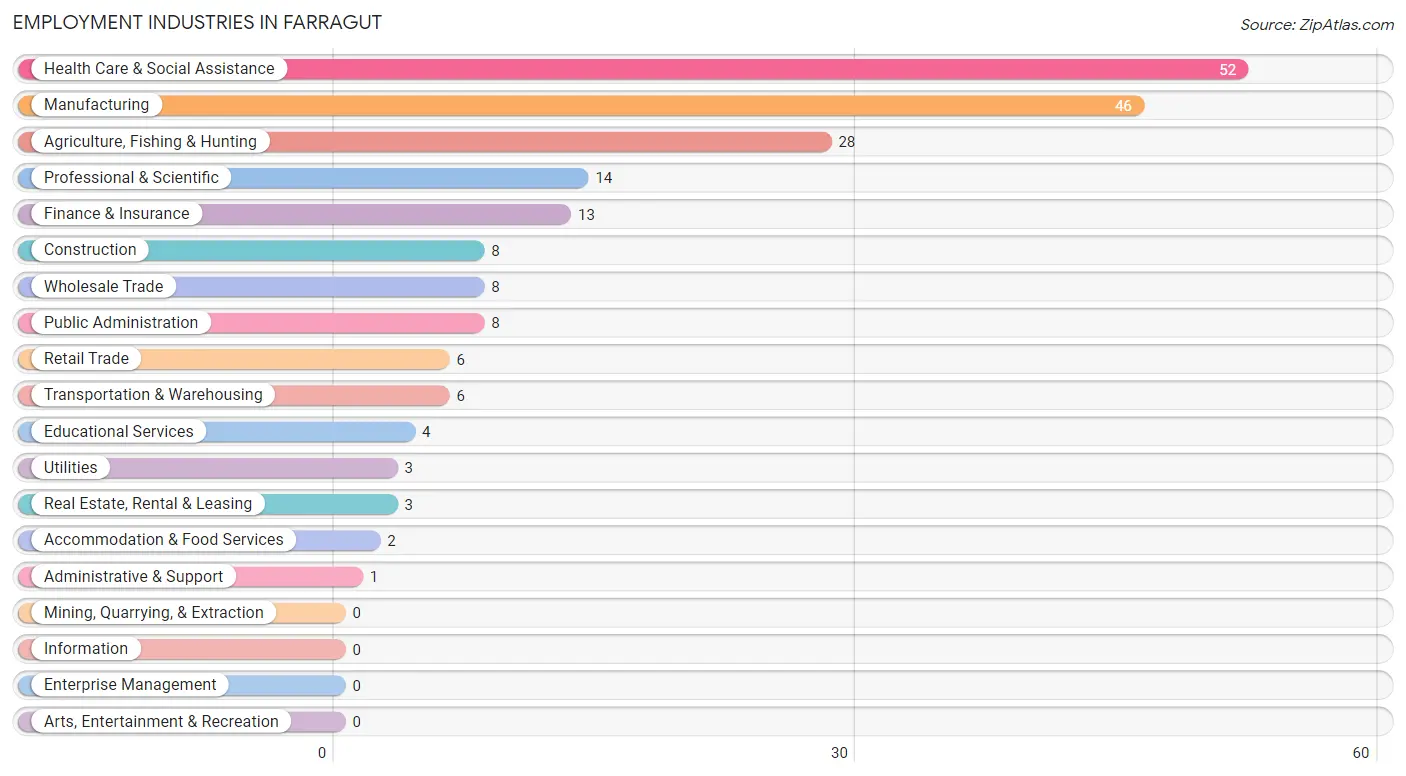
Employment Industries in Farragut
The major employment industries in Farragut include Health Care & Social Assistance (52 | 25.0%), Manufacturing (46 | 22.1%), Agriculture, Fishing & Hunting (28 | 13.5%), Professional & Scientific (14 | 6.7%), and Finance & Insurance (13 | 6.2%).
Employment Industries by Sex in Farragut
The Farragut industries that see more men than women are Construction (100.0%), Wholesale Trade (100.0%), and Transportation & Warehousing (100.0%), whereas the industries that tend to have a higher number of women are Retail Trade (100.0%), Finance & Insurance (100.0%), and Real Estate, Rental & Leasing (100.0%).
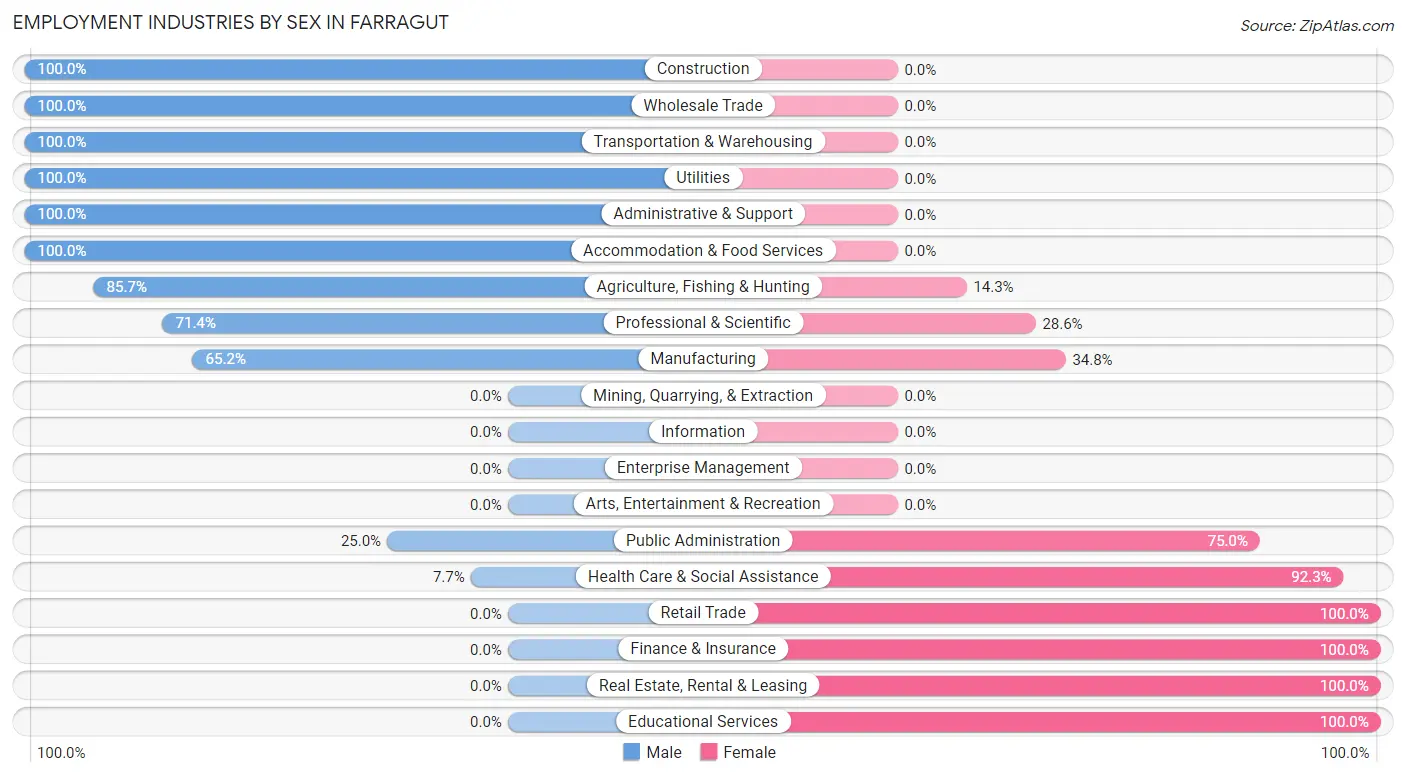
| Industry | Male | Female |
| Agriculture, Fishing & Hunting | 24 (85.7%) | 4 (14.3%) |
| Mining, Quarrying, & Extraction | 0 (0.0%) | 0 (0.0%) |
| Construction | 8 (100.0%) | 0 (0.0%) |
| Manufacturing | 30 (65.2%) | 16 (34.8%) |
| Wholesale Trade | 8 (100.0%) | 0 (0.0%) |
| Retail Trade | 0 (0.0%) | 6 (100.0%) |
| Transportation & Warehousing | 6 (100.0%) | 0 (0.0%) |
| Utilities | 3 (100.0%) | 0 (0.0%) |
| Information | 0 (0.0%) | 0 (0.0%) |
| Finance & Insurance | 0 (0.0%) | 13 (100.0%) |
| Real Estate, Rental & Leasing | 0 (0.0%) | 3 (100.0%) |
| Professional & Scientific | 10 (71.4%) | 4 (28.6%) |
| Enterprise Management | 0 (0.0%) | 0 (0.0%) |
| Administrative & Support | 1 (100.0%) | 0 (0.0%) |
| Educational Services | 0 (0.0%) | 4 (100.0%) |
| Health Care & Social Assistance | 4 (7.7%) | 48 (92.3%) |
| Arts, Entertainment & Recreation | 0 (0.0%) | 0 (0.0%) |
| Accommodation & Food Services | 2 (100.0%) | 0 (0.0%) |
| Public Administration | 2 (25.0%) | 6 (75.0%) |
| Total | 100 (48.1%) | 108 (51.9%) |
Education in Farragut
School Enrollment in Farragut
The most common levels of schooling among the 69 students in Farragut are middle school (34 | 49.3%), high school (12 | 17.4%), and elementary school (9 | 13.0%).
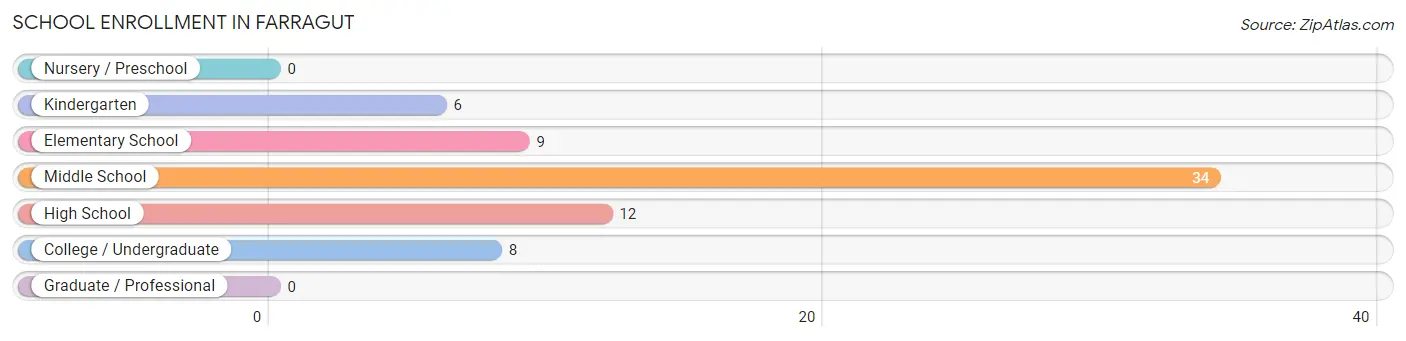
| School Level | # Students | % Students |
| Nursery / Preschool | 0 | 0.0% |
| Kindergarten | 6 | 8.7% |
| Elementary School | 9 | 13.0% |
| Middle School | 34 | 49.3% |
| High School | 12 | 17.4% |
| College / Undergraduate | 8 | 11.6% |
| Graduate / Professional | 0 | 0.0% |
| Total | 69 | 100.0% |
School Enrollment by Age by Funding Source in Farragut
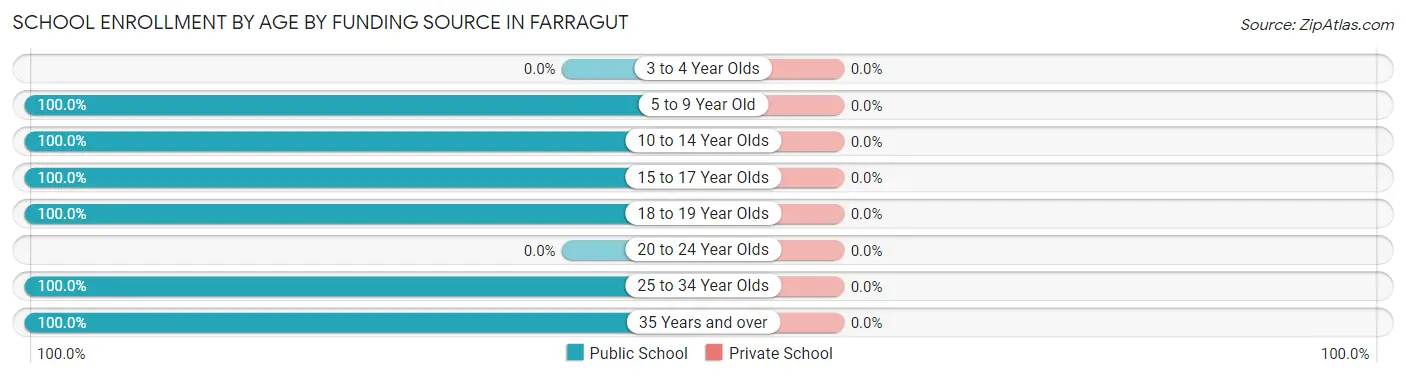
| Age Bracket | Public School | Private School |
| 3 to 4 Year Olds | 0 (0.0%) | 0 (0.0%) |
| 5 to 9 Year Old | 10 (100.0%) | 0 (0.0%) |
| 10 to 14 Year Olds | 39 (100.0%) | 0 (0.0%) |
| 15 to 17 Year Olds | 5 (100.0%) | 0 (0.0%) |
| 18 to 19 Year Olds | 7 (100.0%) | 0 (0.0%) |
| 20 to 24 Year Olds | 0 (0.0%) | 0 (0.0%) |
| 25 to 34 Year Olds | 6 (100.0%) | 0 (0.0%) |
| 35 Years and over | 2 (100.0%) | 0 (0.0%) |
| Total | 69 (100.0%) | 0 (0.0%) |
Educational Attainment by Field of Study in Farragut
Bio, nature & agricultural (15 | 25.0%), business (13 | 21.7%), education (8 | 13.3%), arts & humanities (7 | 11.7%), and liberal arts & history (6 | 10.0%) are the most common fields of study among 60 individuals in Farragut who have obtained a bachelor's degree or higher.
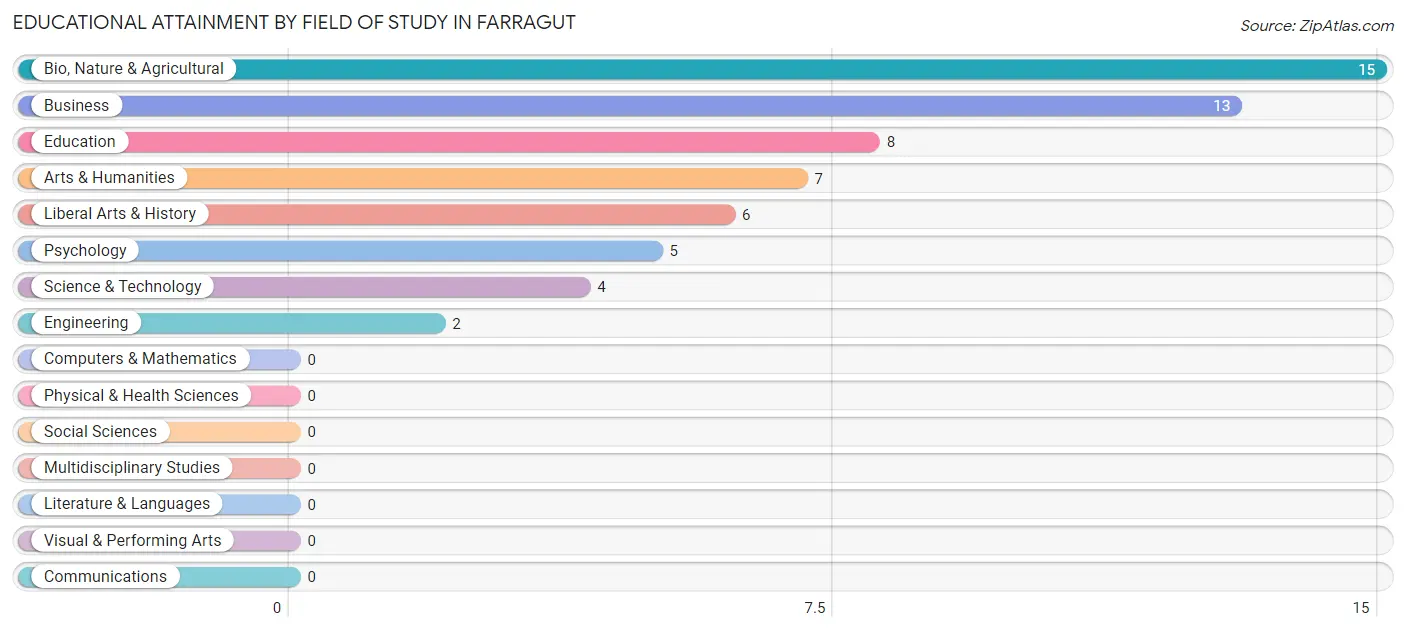
| Field of Study | # Graduates | % Graduates |
| Computers & Mathematics | 0 | 0.0% |
| Bio, Nature & Agricultural | 15 | 25.0% |
| Physical & Health Sciences | 0 | 0.0% |
| Psychology | 5 | 8.3% |
| Social Sciences | 0 | 0.0% |
| Engineering | 2 | 3.3% |
| Multidisciplinary Studies | 0 | 0.0% |
| Science & Technology | 4 | 6.7% |
| Business | 13 | 21.7% |
| Education | 8 | 13.3% |
| Literature & Languages | 0 | 0.0% |
| Liberal Arts & History | 6 | 10.0% |
| Visual & Performing Arts | 0 | 0.0% |
| Communications | 0 | 0.0% |
| Arts & Humanities | 7 | 11.7% |
| Total | 60 | 100.0% |
Transportation & Commute in Farragut
Vehicle Availability by Sex in Farragut
The most prevalent vehicle ownership categories in Farragut are males with 3 vehicles (58, accounting for 58.6%) and females with 3 vehicles (61, making up 53.7%).
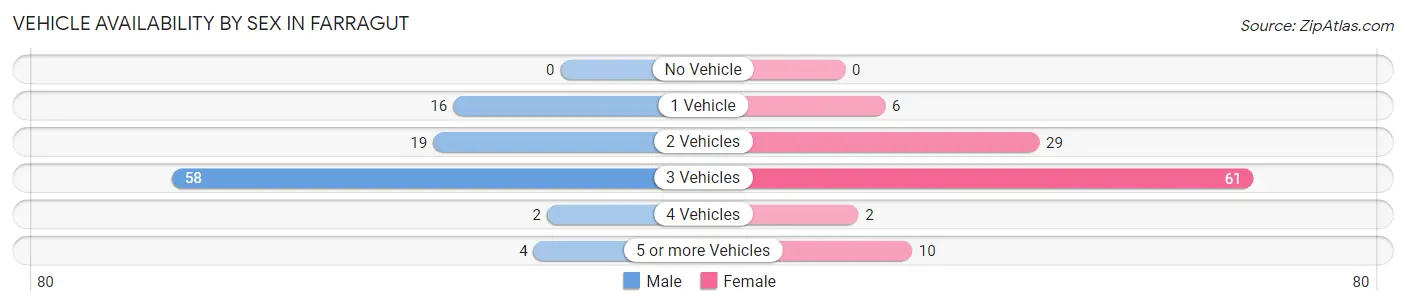
| Vehicles Available | Male | Female |
| No Vehicle | 0 (0.0%) | 0 (0.0%) |
| 1 Vehicle | 16 (16.2%) | 6 (5.6%) |
| 2 Vehicles | 19 (19.2%) | 29 (26.9%) |
| 3 Vehicles | 58 (58.6%) | 61 (56.5%) |
| 4 Vehicles | 2 (2.0%) | 2 (1.8%) |
| 5 or more Vehicles | 4 (4.0%) | 10 (9.3%) |
| Total | 99 (100.0%) | 108 (100.0%) |
Commute Time in Farragut
The most frequently occuring commute durations in Farragut are 15 to 19 minutes (56 commuters, 29.0%), 10 to 14 minutes (51 commuters, 26.4%), and 20 to 24 minutes (38 commuters, 19.7%).
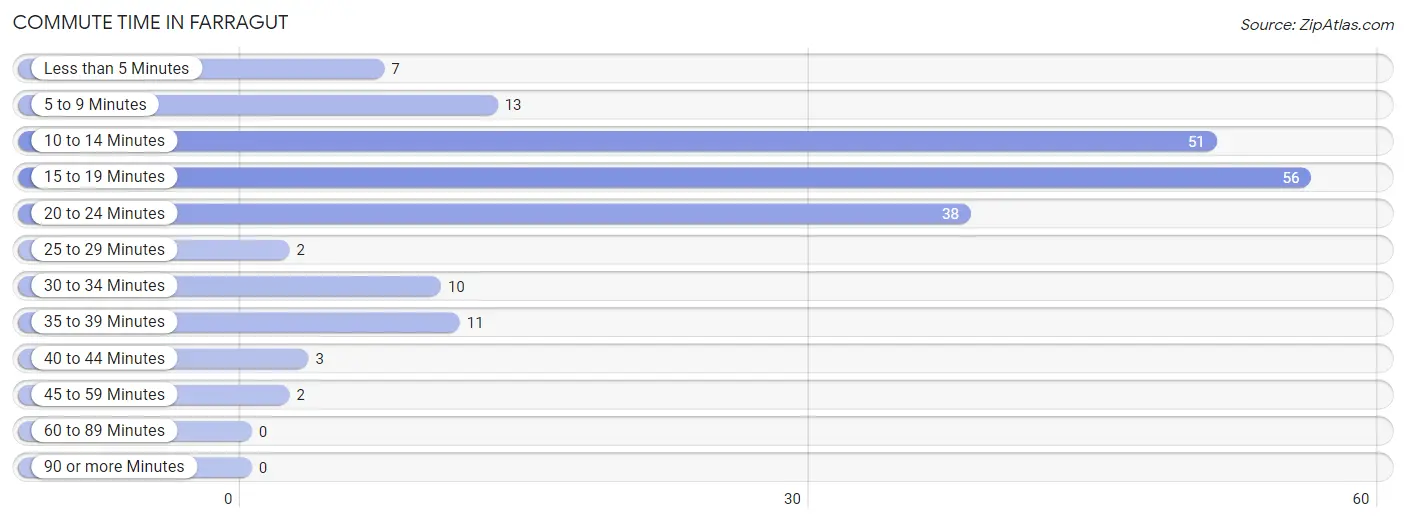
| Commute Time | # Commuters | % Commuters |
| Less than 5 Minutes | 7 | 3.6% |
| 5 to 9 Minutes | 13 | 6.7% |
| 10 to 14 Minutes | 51 | 26.4% |
| 15 to 19 Minutes | 56 | 29.0% |
| 20 to 24 Minutes | 38 | 19.7% |
| 25 to 29 Minutes | 2 | 1.0% |
| 30 to 34 Minutes | 10 | 5.2% |
| 35 to 39 Minutes | 11 | 5.7% |
| 40 to 44 Minutes | 3 | 1.5% |
| 45 to 59 Minutes | 2 | 1.0% |
| 60 to 89 Minutes | 0 | 0.0% |
| 90 or more Minutes | 0 | 0.0% |
Commute Time by Sex in Farragut
The most common commute times in Farragut are 10 to 14 minutes (27 commuters, 30.3%) for males and 15 to 19 minutes (46 commuters, 44.2%) for females.
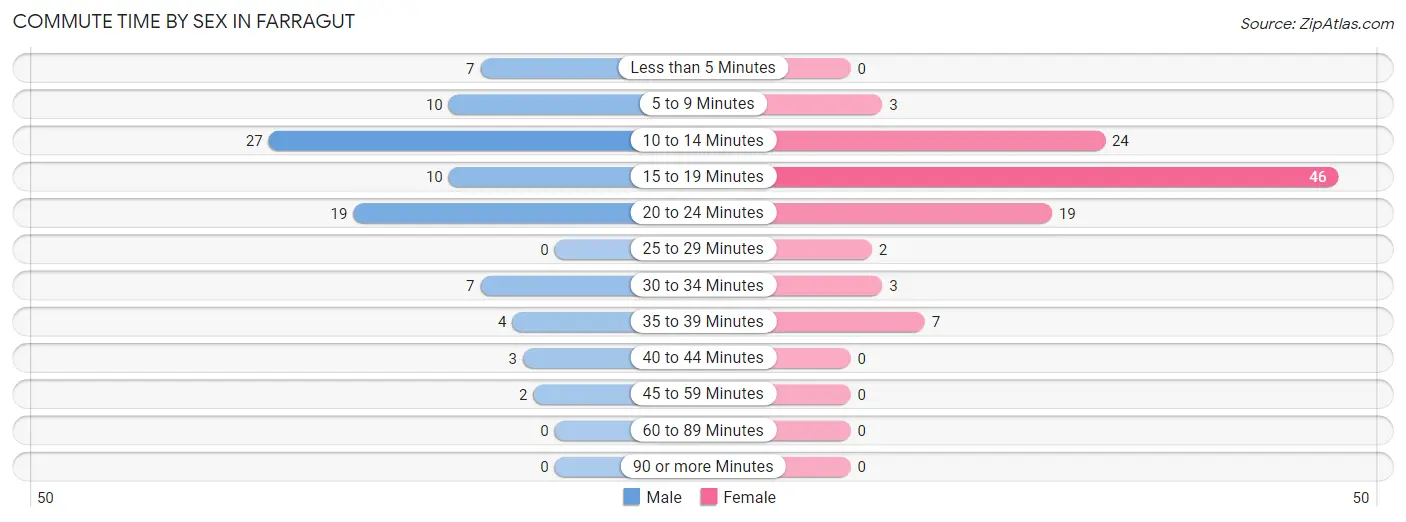
| Commute Time | Male | Female |
| Less than 5 Minutes | 7 (7.9%) | 0 (0.0%) |
| 5 to 9 Minutes | 10 (11.2%) | 3 (2.9%) |
| 10 to 14 Minutes | 27 (30.3%) | 24 (23.1%) |
| 15 to 19 Minutes | 10 (11.2%) | 46 (44.2%) |
| 20 to 24 Minutes | 19 (21.3%) | 19 (18.3%) |
| 25 to 29 Minutes | 0 (0.0%) | 2 (1.9%) |
| 30 to 34 Minutes | 7 (7.9%) | 3 (2.9%) |
| 35 to 39 Minutes | 4 (4.5%) | 7 (6.7%) |
| 40 to 44 Minutes | 3 (3.4%) | 0 (0.0%) |
| 45 to 59 Minutes | 2 (2.2%) | 0 (0.0%) |
| 60 to 89 Minutes | 0 (0.0%) | 0 (0.0%) |
| 90 or more Minutes | 0 (0.0%) | 0 (0.0%) |
Time of Departure to Work by Sex in Farragut
The most frequent times of departure to work in Farragut are 6:30 AM to 6:59 AM (23, 25.8%) for males and 4:00 PM to 11:59 PM (21, 20.2%) for females.
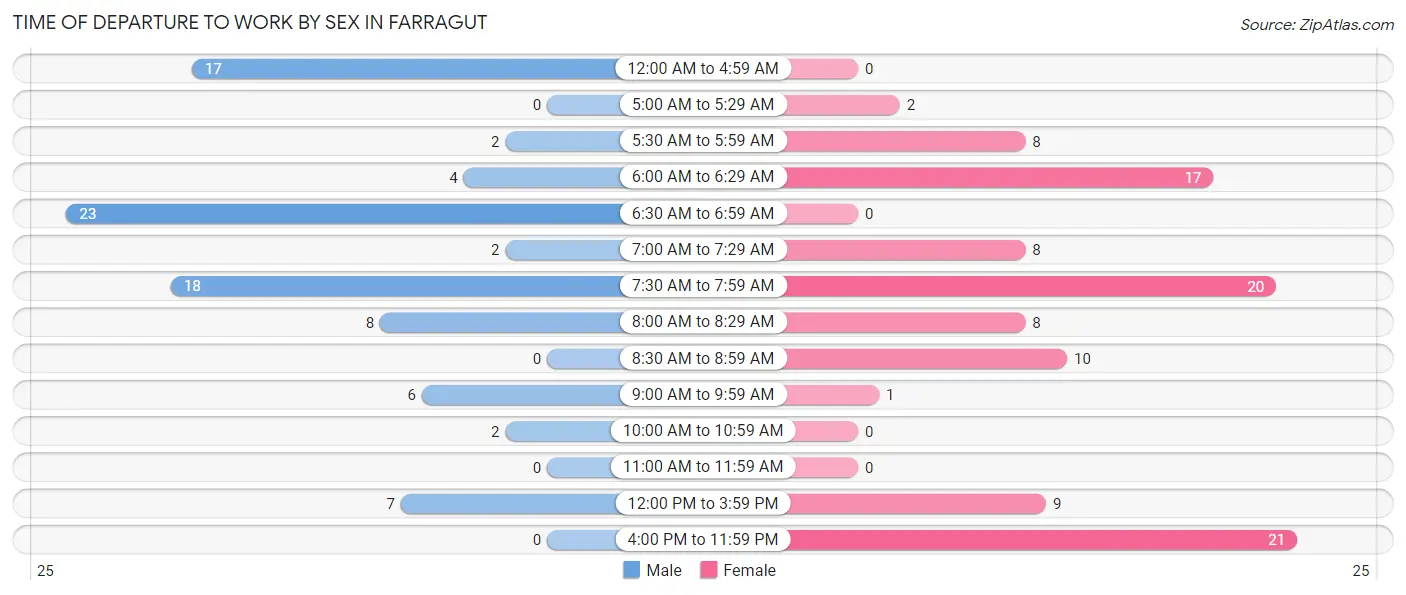
| Time of Departure | Male | Female |
| 12:00 AM to 4:59 AM | 17 (19.1%) | 0 (0.0%) |
| 5:00 AM to 5:29 AM | 0 (0.0%) | 2 (1.9%) |
| 5:30 AM to 5:59 AM | 2 (2.2%) | 8 (7.7%) |
| 6:00 AM to 6:29 AM | 4 (4.5%) | 17 (16.4%) |
| 6:30 AM to 6:59 AM | 23 (25.8%) | 0 (0.0%) |
| 7:00 AM to 7:29 AM | 2 (2.2%) | 8 (7.7%) |
| 7:30 AM to 7:59 AM | 18 (20.2%) | 20 (19.2%) |
| 8:00 AM to 8:29 AM | 8 (9.0%) | 8 (7.7%) |
| 8:30 AM to 8:59 AM | 0 (0.0%) | 10 (9.6%) |
| 9:00 AM to 9:59 AM | 6 (6.7%) | 1 (1.0%) |
| 10:00 AM to 10:59 AM | 2 (2.2%) | 0 (0.0%) |
| 11:00 AM to 11:59 AM | 0 (0.0%) | 0 (0.0%) |
| 12:00 PM to 3:59 PM | 7 (7.9%) | 9 (8.6%) |
| 4:00 PM to 11:59 PM | 0 (0.0%) | 21 (20.2%) |
| Total | 89 (100.0%) | 104 (100.0%) |
Housing Occupancy in Farragut
Occupancy by Ownership in Farragut
Of the total 204 dwellings in Farragut, owner-occupied units account for 139 (68.1%), while renter-occupied units make up 65 (31.9%).
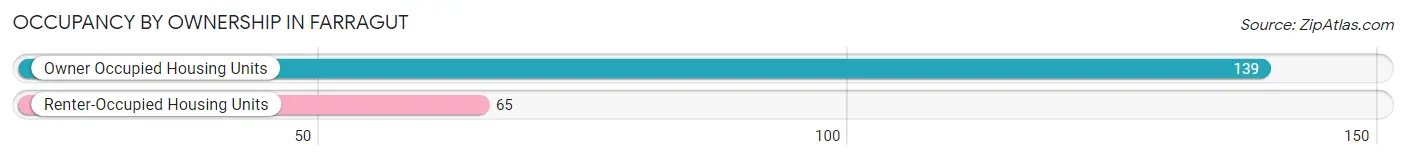
| Occupancy | # Housing Units | % Housing Units |
| Owner Occupied Housing Units | 139 | 68.1% |
| Renter-Occupied Housing Units | 65 | 31.9% |
| Total Occupied Housing Units | 204 | 100.0% |
Occupancy by Household Size in Farragut
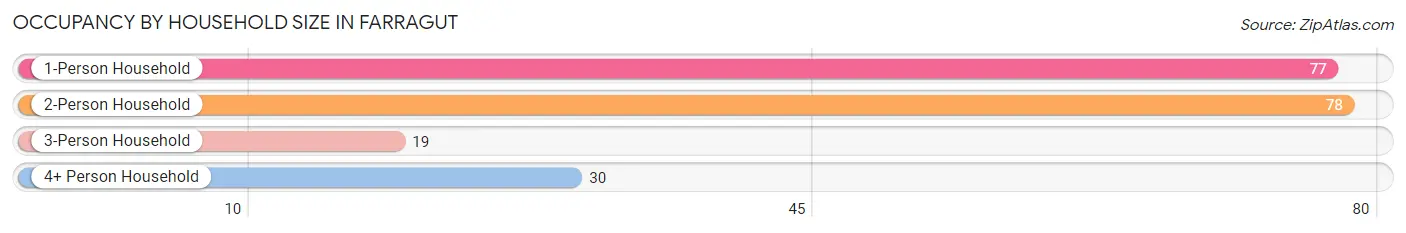
| Household Size | # Housing Units | % Housing Units |
| 1-Person Household | 77 | 37.8% |
| 2-Person Household | 78 | 38.2% |
| 3-Person Household | 19 | 9.3% |
| 4+ Person Household | 30 | 14.7% |
| Total Housing Units | 204 | 100.0% |
Occupancy by Ownership by Household Size in Farragut
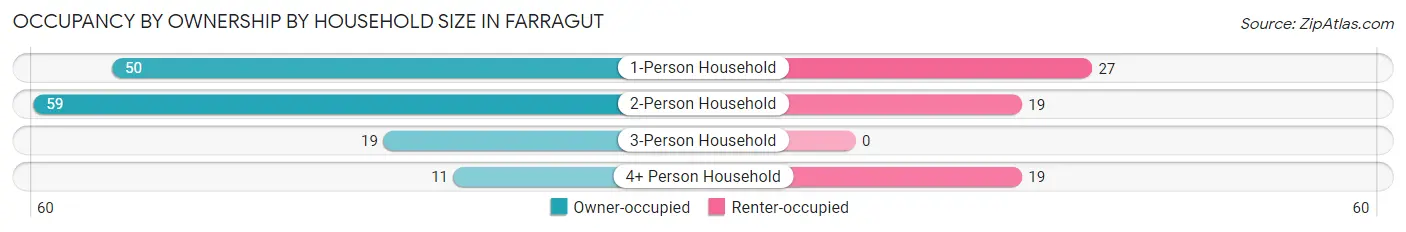
| Household Size | Owner-occupied | Renter-occupied |
| 1-Person Household | 50 (64.9%) | 27 (35.1%) |
| 2-Person Household | 59 (75.6%) | 19 (24.4%) |
| 3-Person Household | 19 (100.0%) | 0 (0.0%) |
| 4+ Person Household | 11 (36.7%) | 19 (63.3%) |
| Total Housing Units | 139 (68.1%) | 65 (31.9%) |
Occupancy by Educational Attainment in Farragut
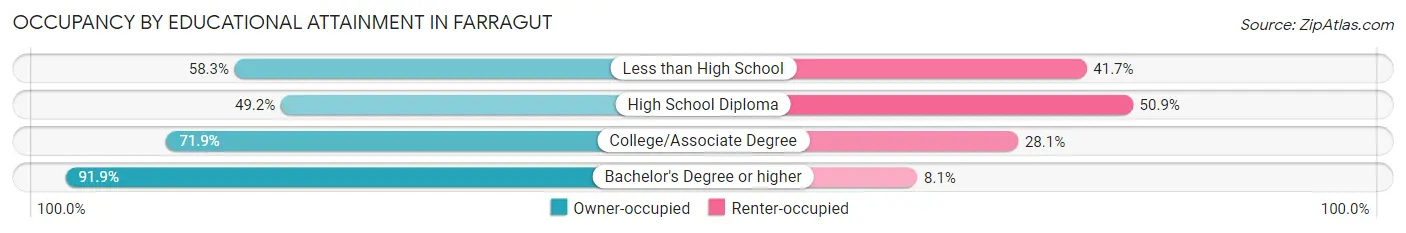
| Household Size | Owner-occupied | Renter-occupied |
| Less than High School | 7 (58.3%) | 5 (41.7%) |
| High School Diploma | 29 (49.1%) | 30 (50.8%) |
| College/Associate Degree | 69 (71.9%) | 27 (28.1%) |
| Bachelor's Degree or higher | 34 (91.9%) | 3 (8.1%) |
Occupancy by Age of Householder in Farragut
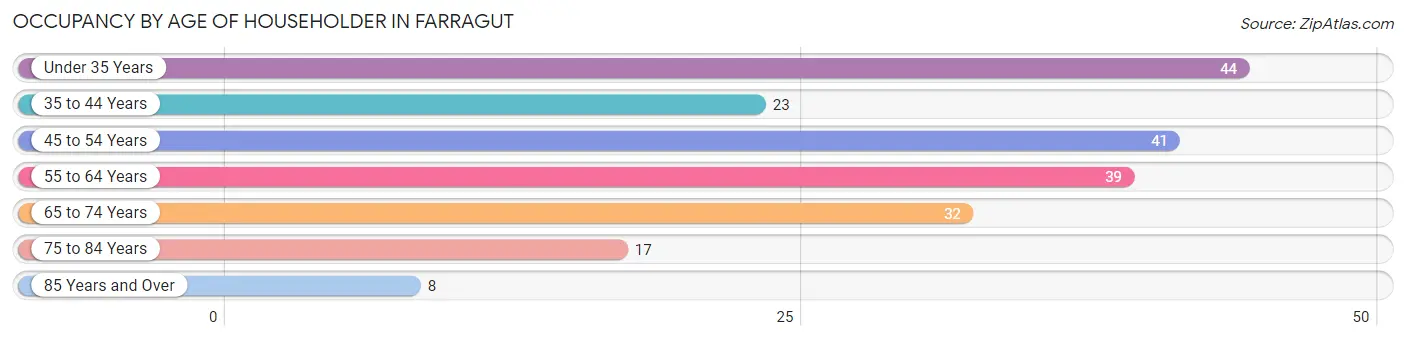
| Age Bracket | # Households | % Households |
| Under 35 Years | 44 | 21.6% |
| 35 to 44 Years | 23 | 11.3% |
| 45 to 54 Years | 41 | 20.1% |
| 55 to 64 Years | 39 | 19.1% |
| 65 to 74 Years | 32 | 15.7% |
| 75 to 84 Years | 17 | 8.3% |
| 85 Years and Over | 8 | 3.9% |
| Total | 204 | 100.0% |
Housing Finances in Farragut
Median Income by Occupancy in Farragut
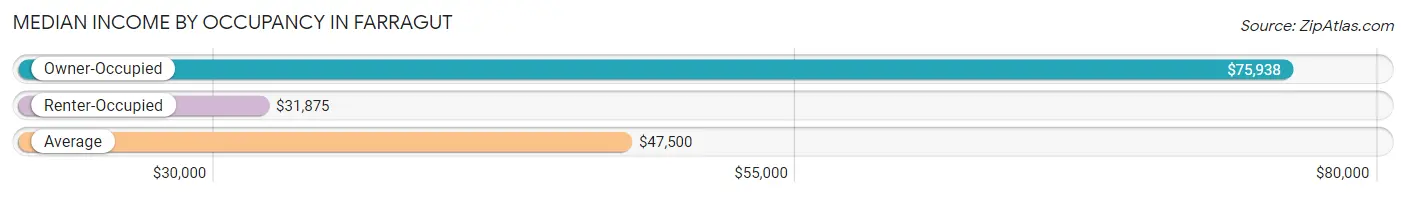
| Occupancy Type | # Households | Median Income |
| Owner-Occupied | 139 (68.1%) | $75,938 |
| Renter-Occupied | 65 (31.9%) | $31,875 |
| Average | 204 (100.0%) | $47,500 |
Occupancy by Householder Income Bracket in Farragut
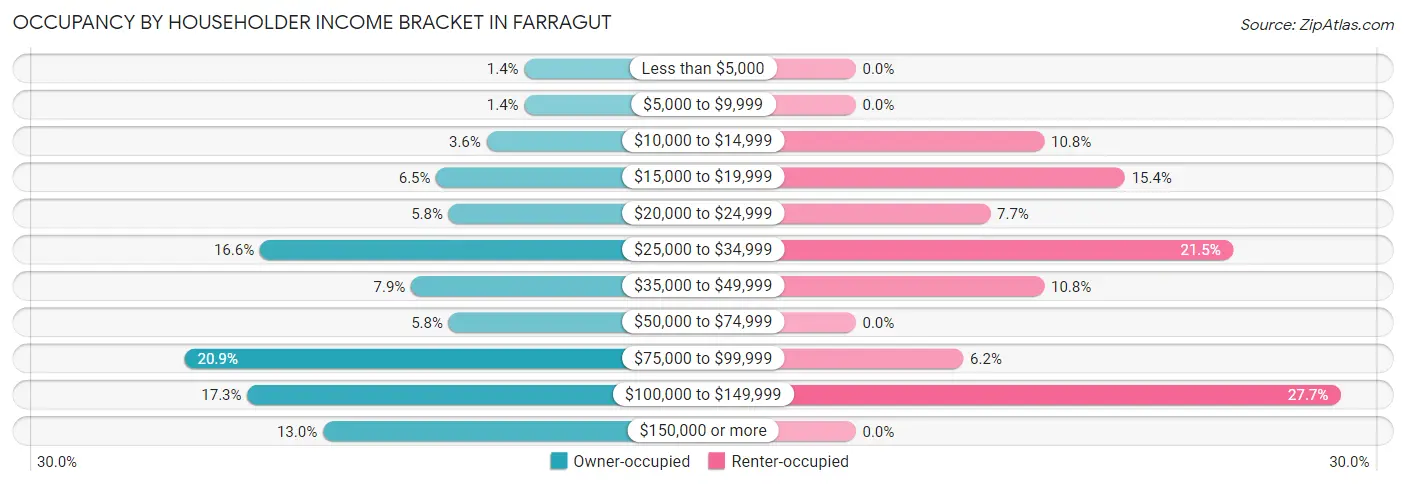
| Income Bracket | Owner-occupied | Renter-occupied |
| Less than $5,000 | 2 (1.4%) | 0 (0.0%) |
| $5,000 to $9,999 | 2 (1.4%) | 0 (0.0%) |
| $10,000 to $14,999 | 5 (3.6%) | 7 (10.8%) |
| $15,000 to $19,999 | 9 (6.5%) | 10 (15.4%) |
| $20,000 to $24,999 | 8 (5.8%) | 5 (7.7%) |
| $25,000 to $34,999 | 23 (16.6%) | 14 (21.5%) |
| $35,000 to $49,999 | 11 (7.9%) | 7 (10.8%) |
| $50,000 to $74,999 | 8 (5.8%) | 0 (0.0%) |
| $75,000 to $99,999 | 29 (20.9%) | 4 (6.1%) |
| $100,000 to $149,999 | 24 (17.3%) | 18 (27.7%) |
| $150,000 or more | 18 (13.0%) | 0 (0.0%) |
| Total | 139 (100.0%) | 65 (100.0%) |
Monthly Housing Cost Tiers in Farragut
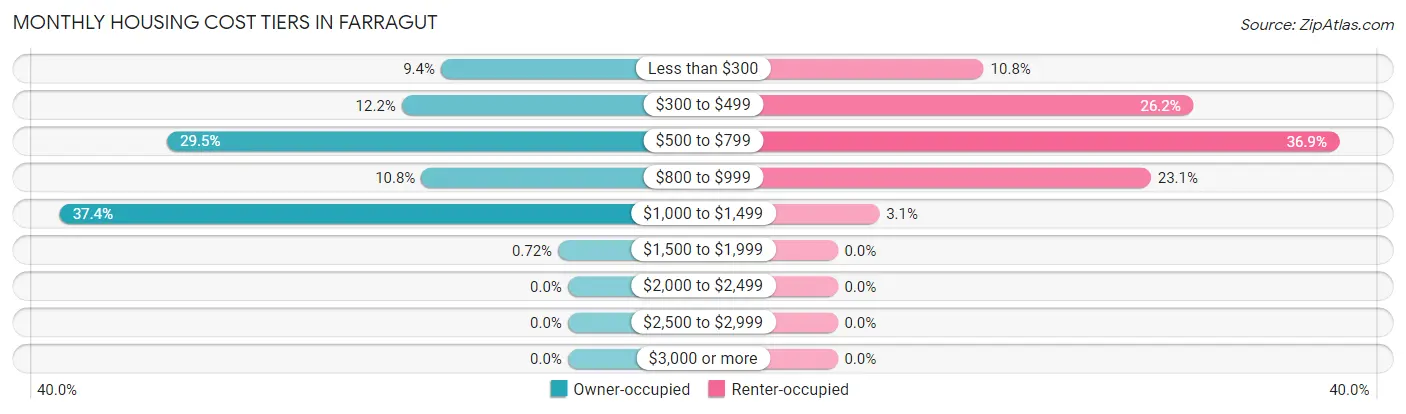
| Monthly Cost | Owner-occupied | Renter-occupied |
| Less than $300 | 13 (9.3%) | 7 (10.8%) |
| $300 to $499 | 17 (12.2%) | 17 (26.2%) |
| $500 to $799 | 41 (29.5%) | 24 (36.9%) |
| $800 to $999 | 15 (10.8%) | 15 (23.1%) |
| $1,000 to $1,499 | 52 (37.4%) | 2 (3.1%) |
| $1,500 to $1,999 | 1 (0.7%) | 0 (0.0%) |
| $2,000 to $2,499 | 0 (0.0%) | 0 (0.0%) |
| $2,500 to $2,999 | 0 (0.0%) | 0 (0.0%) |
| $3,000 or more | 0 (0.0%) | 0 (0.0%) |
| Total | 139 (100.0%) | 65 (100.0%) |
Physical Housing Characteristics in Farragut
Housing Structures in Farragut
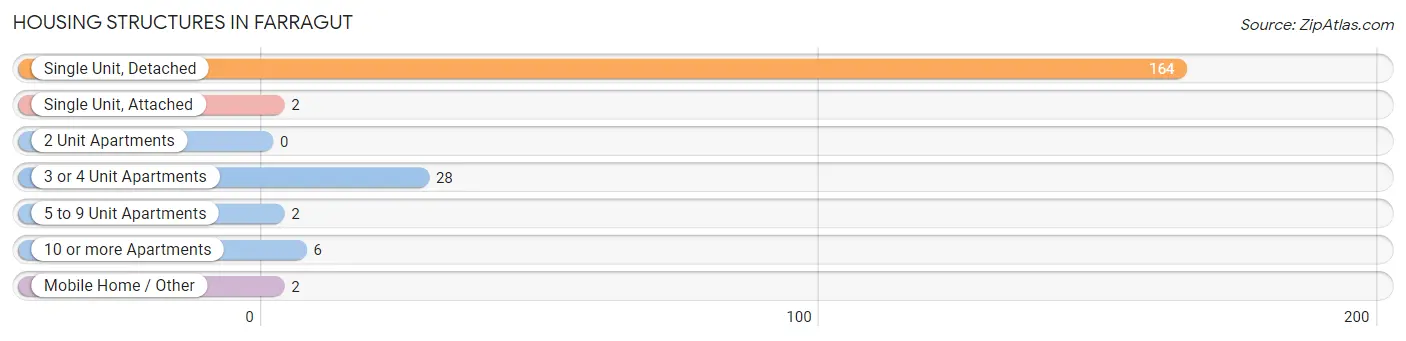
| Structure Type | # Housing Units | % Housing Units |
| Single Unit, Detached | 164 | 80.4% |
| Single Unit, Attached | 2 | 1.0% |
| 2 Unit Apartments | 0 | 0.0% |
| 3 or 4 Unit Apartments | 28 | 13.7% |
| 5 to 9 Unit Apartments | 2 | 1.0% |
| 10 or more Apartments | 6 | 2.9% |
| Mobile Home / Other | 2 | 1.0% |
| Total | 204 | 100.0% |
Housing Structures by Occupancy in Farragut
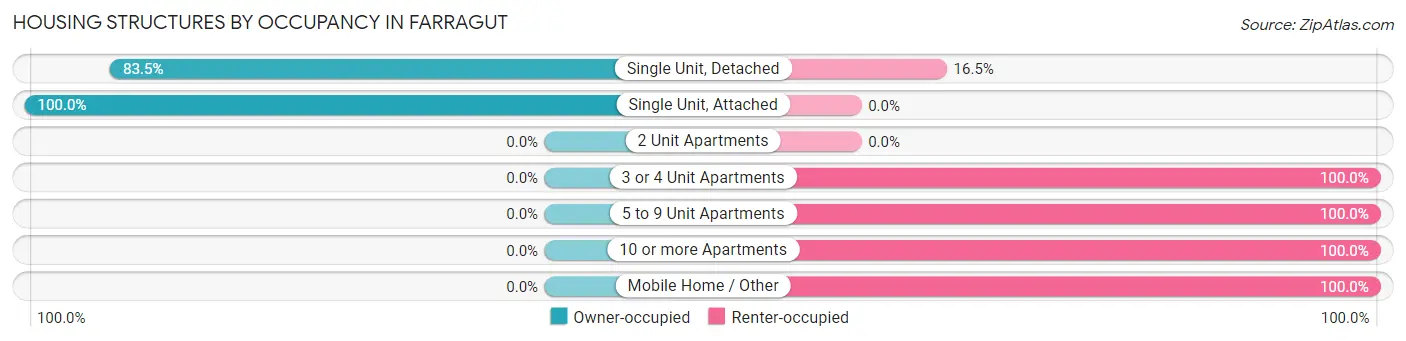
| Structure Type | Owner-occupied | Renter-occupied |
| Single Unit, Detached | 137 (83.5%) | 27 (16.5%) |
| Single Unit, Attached | 2 (100.0%) | 0 (0.0%) |
| 2 Unit Apartments | 0 (0.0%) | 0 (0.0%) |
| 3 or 4 Unit Apartments | 0 (0.0%) | 28 (100.0%) |
| 5 to 9 Unit Apartments | 0 (0.0%) | 2 (100.0%) |
| 10 or more Apartments | 0 (0.0%) | 6 (100.0%) |
| Mobile Home / Other | 0 (0.0%) | 2 (100.0%) |
| Total | 139 (68.1%) | 65 (31.9%) |
Housing Structures by Number of Rooms in Farragut
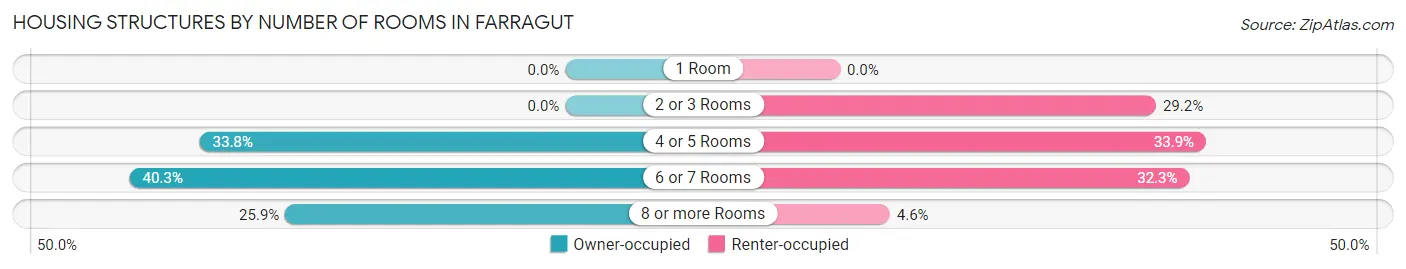
| Number of Rooms | Owner-occupied | Renter-occupied |
| 1 Room | 0 (0.0%) | 0 (0.0%) |
| 2 or 3 Rooms | 0 (0.0%) | 19 (29.2%) |
| 4 or 5 Rooms | 47 (33.8%) | 22 (33.9%) |
| 6 or 7 Rooms | 56 (40.3%) | 21 (32.3%) |
| 8 or more Rooms | 36 (25.9%) | 3 (4.6%) |
| Total | 139 (100.0%) | 65 (100.0%) |
Housing Structure by Heating Type in Farragut
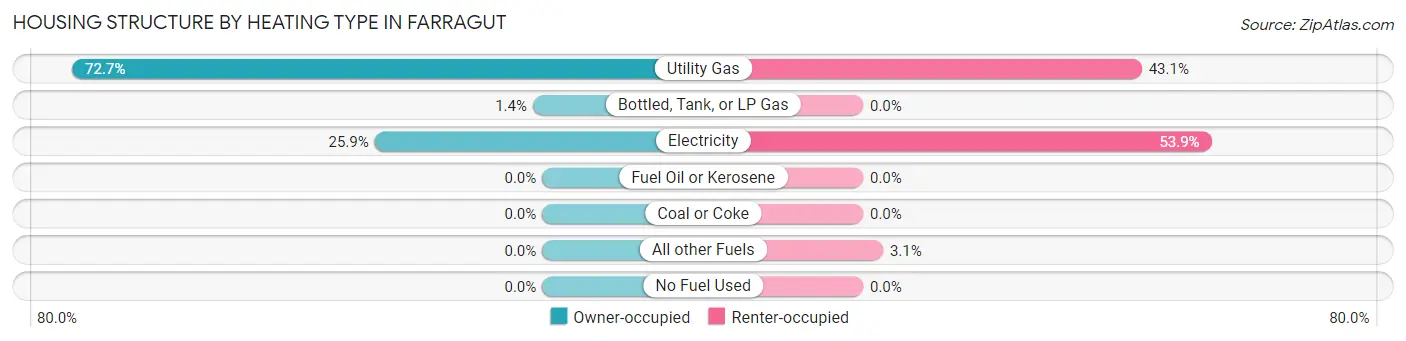
| Heating Type | Owner-occupied | Renter-occupied |
| Utility Gas | 101 (72.7%) | 28 (43.1%) |
| Bottled, Tank, or LP Gas | 2 (1.4%) | 0 (0.0%) |
| Electricity | 36 (25.9%) | 35 (53.8%) |
| Fuel Oil or Kerosene | 0 (0.0%) | 0 (0.0%) |
| Coal or Coke | 0 (0.0%) | 0 (0.0%) |
| All other Fuels | 0 (0.0%) | 2 (3.1%) |
| No Fuel Used | 0 (0.0%) | 0 (0.0%) |
| Total | 139 (100.0%) | 65 (100.0%) |
Household Vehicle Usage in Farragut
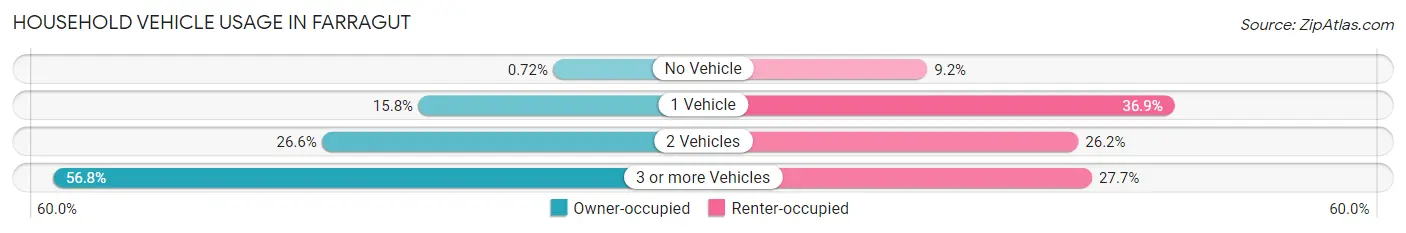
| Vehicles per Household | Owner-occupied | Renter-occupied |
| No Vehicle | 1 (0.7%) | 6 (9.2%) |
| 1 Vehicle | 22 (15.8%) | 24 (36.9%) |
| 2 Vehicles | 37 (26.6%) | 17 (26.2%) |
| 3 or more Vehicles | 79 (56.8%) | 18 (27.7%) |
| Total | 139 (100.0%) | 65 (100.0%) |
Real Estate & Mortgages in Farragut
Real Estate and Mortgage Overview in Farragut
| Characteristic | Without Mortgage | With Mortgage |
| Housing Units | 53 | 86 |
| Median Property Value | $89,300 | $105,900 |
| Median Household Income | - | - |
| Monthly Housing Costs | $465 | $0 |
| Real Estate Taxes | $1,771 | $2 |
Property Value by Mortgage Status in Farragut
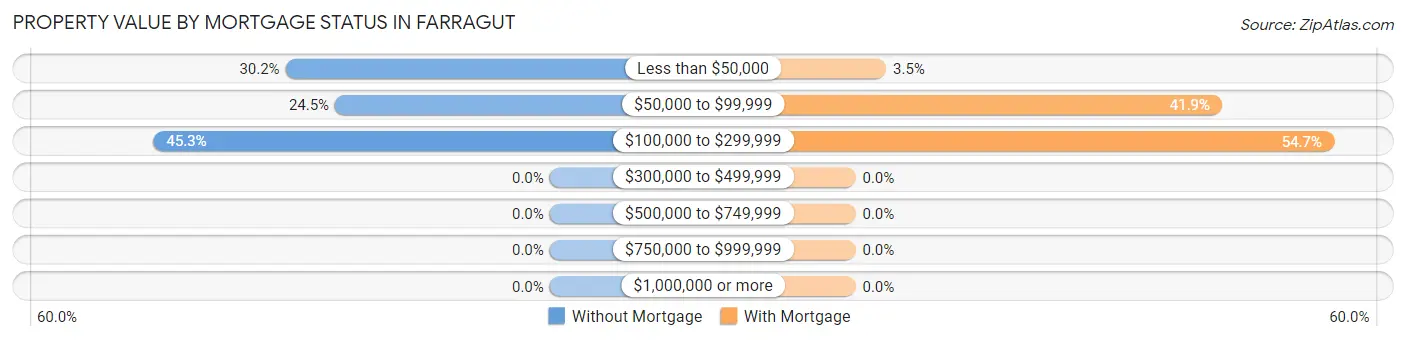
| Property Value | Without Mortgage | With Mortgage |
| Less than $50,000 | 16 (30.2%) | 3 (3.5%) |
| $50,000 to $99,999 | 13 (24.5%) | 36 (41.9%) |
| $100,000 to $299,999 | 24 (45.3%) | 47 (54.6%) |
| $300,000 to $499,999 | 0 (0.0%) | 0 (0.0%) |
| $500,000 to $749,999 | 0 (0.0%) | 0 (0.0%) |
| $750,000 to $999,999 | 0 (0.0%) | 0 (0.0%) |
| $1,000,000 or more | 0 (0.0%) | 0 (0.0%) |
| Total | 53 (100.0%) | 86 (100.0%) |
Household Income by Mortgage Status in Farragut
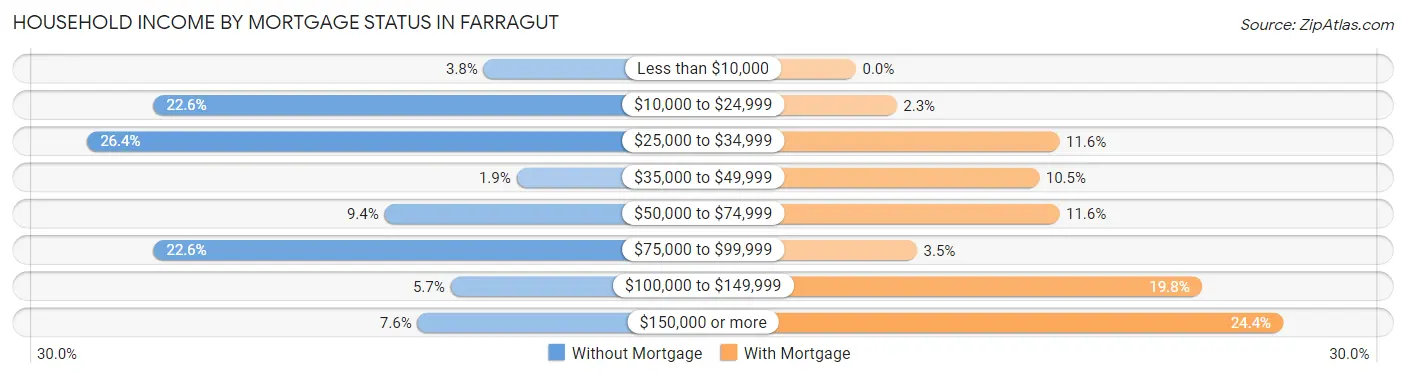
| Household Income | Without Mortgage | With Mortgage |
| Less than $10,000 | 2 (3.8%) | 0 (0.0%) |
| $10,000 to $24,999 | 12 (22.6%) | 2 (2.3%) |
| $25,000 to $34,999 | 14 (26.4%) | 10 (11.6%) |
| $35,000 to $49,999 | 1 (1.9%) | 9 (10.5%) |
| $50,000 to $74,999 | 5 (9.4%) | 10 (11.6%) |
| $75,000 to $99,999 | 12 (22.6%) | 3 (3.5%) |
| $100,000 to $149,999 | 3 (5.7%) | 17 (19.8%) |
| $150,000 or more | 4 (7.5%) | 21 (24.4%) |
| Total | 53 (100.0%) | 86 (100.0%) |
Property Value to Household Income Ratio in Farragut
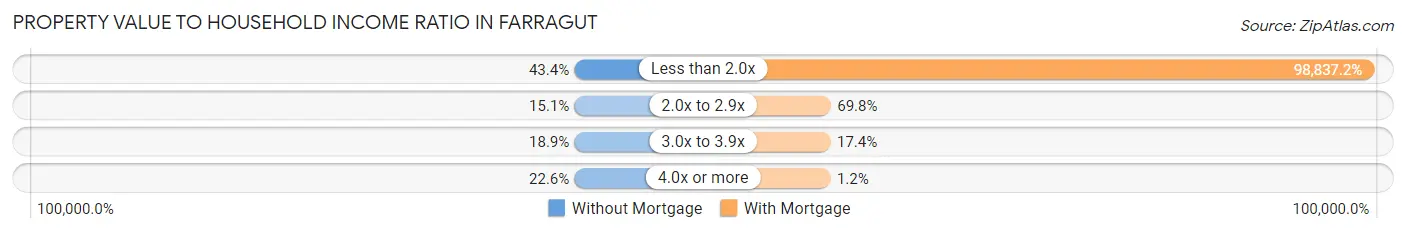
| Value-to-Income Ratio | Without Mortgage | With Mortgage |
| Less than 2.0x | 23 (43.4%) | 85,000 (98,837.2%) |
| 2.0x to 2.9x | 8 (15.1%) | 60 (69.8%) |
| 3.0x to 3.9x | 10 (18.9%) | 15 (17.4%) |
| 4.0x or more | 12 (22.6%) | 1 (1.2%) |
| Total | 53 (100.0%) | 86 (100.0%) |
Real Estate Taxes by Mortgage Status in Farragut
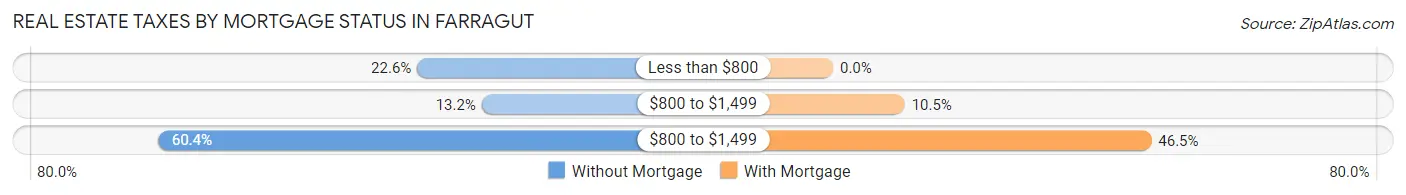
| Property Taxes | Without Mortgage | With Mortgage |
| Less than $800 | 12 (22.6%) | 0 (0.0%) |
| $800 to $1,499 | 7 (13.2%) | 9 (10.5%) |
| $800 to $1,499 | 32 (60.4%) | 40 (46.5%) |
| Total | 53 (100.0%) | 86 (100.0%) |
Health & Disability in Farragut
Health Insurance Coverage by Age in Farragut
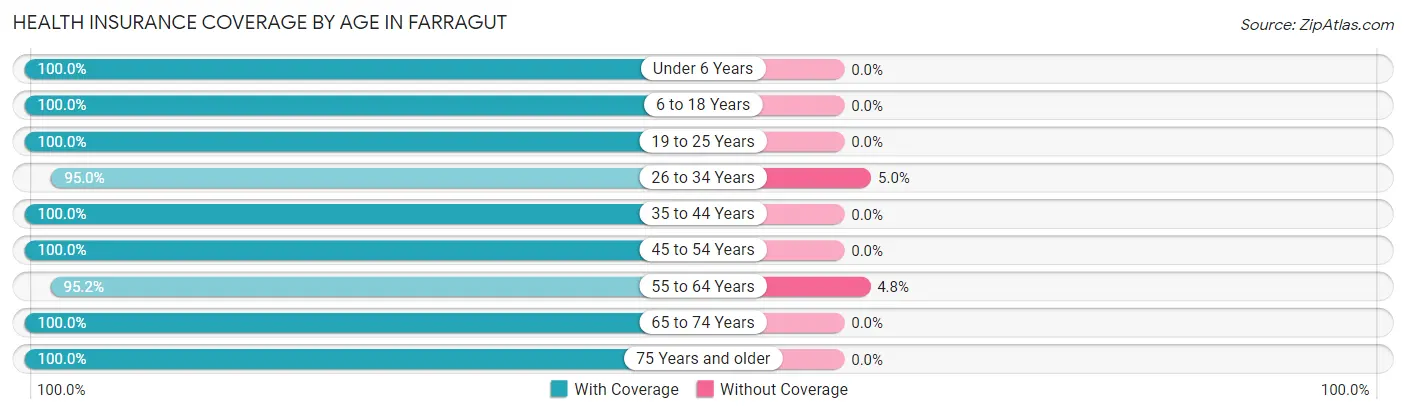
| Age Bracket | With Coverage | Without Coverage |
| Under 6 Years | 20 (100.0%) | 0 (0.0%) |
| 6 to 18 Years | 56 (100.0%) | 0 (0.0%) |
| 19 to 25 Years | 12 (100.0%) | 0 (0.0%) |
| 26 to 34 Years | 38 (95.0%) | 2 (5.0%) |
| 35 to 44 Years | 62 (100.0%) | 0 (0.0%) |
| 45 to 54 Years | 54 (100.0%) | 0 (0.0%) |
| 55 to 64 Years | 59 (95.2%) | 3 (4.8%) |
| 65 to 74 Years | 42 (100.0%) | 0 (0.0%) |
| 75 Years and older | 48 (100.0%) | 0 (0.0%) |
| Total | 391 (98.7%) | 5 (1.3%) |
Health Insurance Coverage by Citizenship Status in Farragut
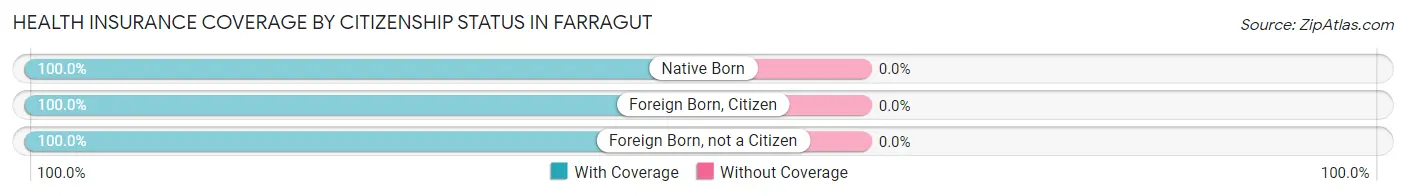
| Citizenship Status | With Coverage | Without Coverage |
| Native Born | 20 (100.0%) | 0 (0.0%) |
| Foreign Born, Citizen | 56 (100.0%) | 0 (0.0%) |
| Foreign Born, not a Citizen | 12 (100.0%) | 0 (0.0%) |
Health Insurance Coverage by Household Income in Farragut
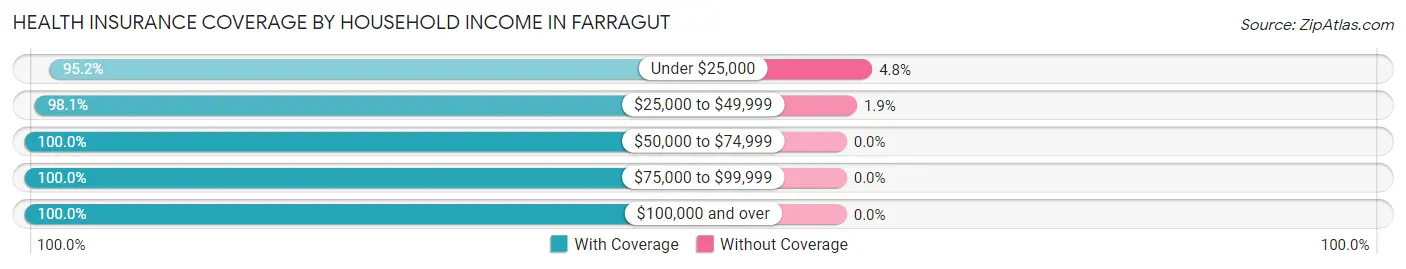
| Household Income | With Coverage | Without Coverage |
| Under $25,000 | 60 (95.2%) | 3 (4.8%) |
| $25,000 to $49,999 | 103 (98.1%) | 2 (1.9%) |
| $50,000 to $74,999 | 13 (100.0%) | 0 (0.0%) |
| $75,000 to $99,999 | 84 (100.0%) | 0 (0.0%) |
| $100,000 and over | 131 (100.0%) | 0 (0.0%) |
Public vs Private Health Insurance Coverage by Age in Farragut
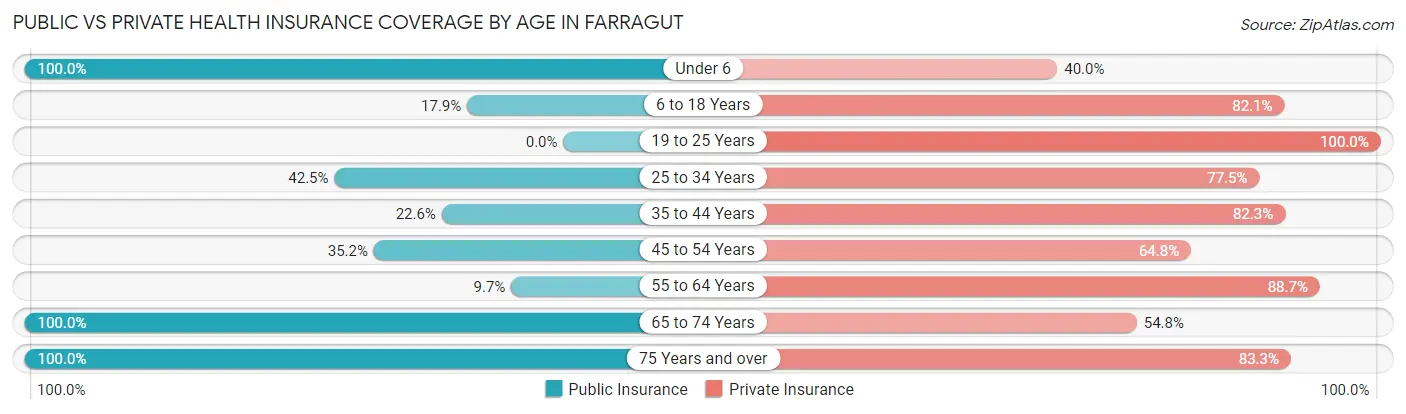
| Age Bracket | Public Insurance | Private Insurance |
| Under 6 | 20 (100.0%) | 8 (40.0%) |
| 6 to 18 Years | 10 (17.9%) | 46 (82.1%) |
| 19 to 25 Years | 0 (0.0%) | 12 (100.0%) |
| 25 to 34 Years | 17 (42.5%) | 31 (77.5%) |
| 35 to 44 Years | 14 (22.6%) | 51 (82.3%) |
| 45 to 54 Years | 19 (35.2%) | 35 (64.8%) |
| 55 to 64 Years | 6 (9.7%) | 55 (88.7%) |
| 65 to 74 Years | 42 (100.0%) | 23 (54.8%) |
| 75 Years and over | 48 (100.0%) | 40 (83.3%) |
| Total | 176 (44.4%) | 301 (76.0%) |
Disability Status by Sex by Age in Farragut
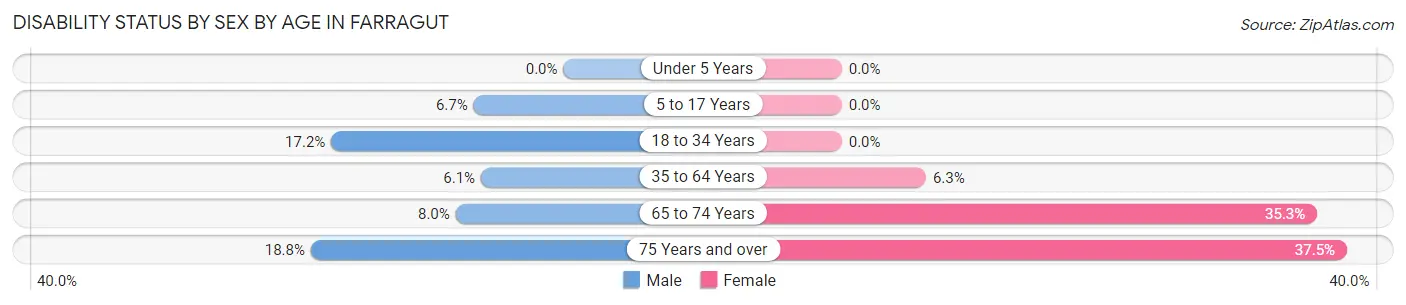
| Age Bracket | Male | Female |
| Under 5 Years | 0 (0.0%) | 0 (0.0%) |
| 5 to 17 Years | 3 (6.7%) | 0 (0.0%) |
| 18 to 34 Years | 5 (17.2%) | 0 (0.0%) |
| 35 to 64 Years | 6 (6.1%) | 5 (6.2%) |
| 65 to 74 Years | 2 (8.0%) | 6 (35.3%) |
| 75 Years and over | 3 (18.8%) | 12 (37.5%) |
Disability Class by Sex by Age in Farragut
Disability Class: Hearing Difficulty
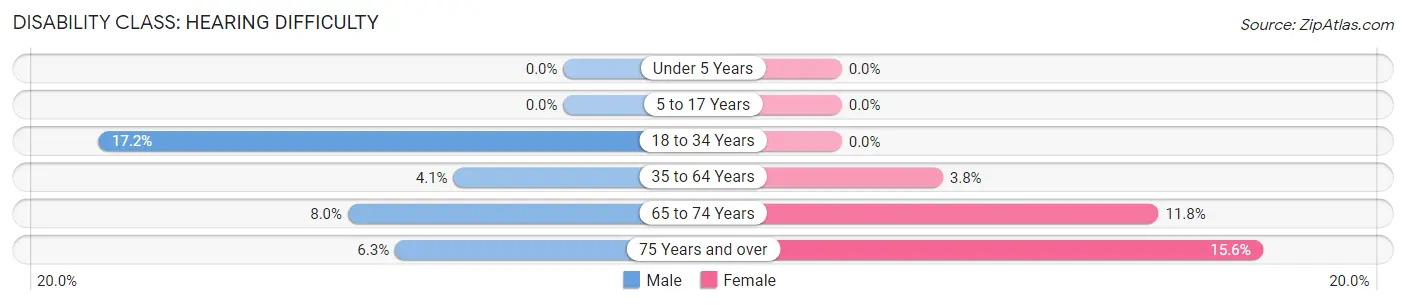
| Age Bracket | Male | Female |
| Under 5 Years | 0 (0.0%) | 0 (0.0%) |
| 5 to 17 Years | 0 (0.0%) | 0 (0.0%) |
| 18 to 34 Years | 5 (17.2%) | 0 (0.0%) |
| 35 to 64 Years | 4 (4.1%) | 3 (3.7%) |
| 65 to 74 Years | 2 (8.0%) | 2 (11.8%) |
| 75 Years and over | 1 (6.2%) | 5 (15.6%) |
Disability Class: Vision Difficulty
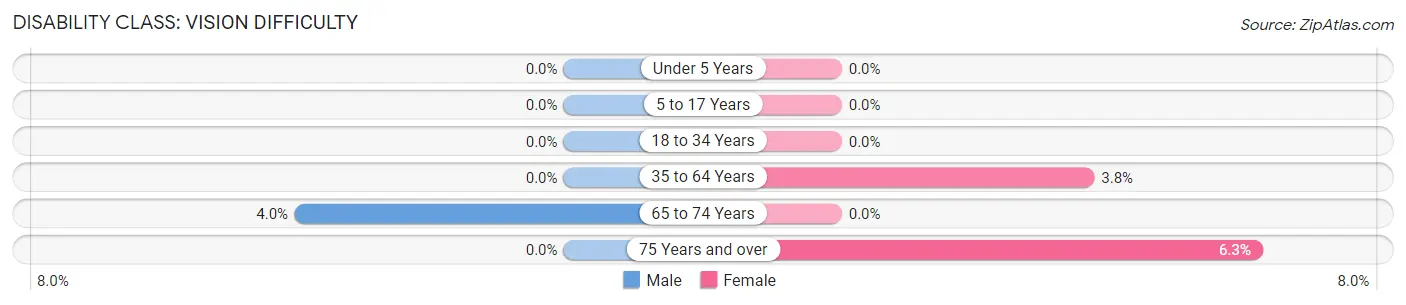
| Age Bracket | Male | Female |
| Under 5 Years | 0 (0.0%) | 0 (0.0%) |
| 5 to 17 Years | 0 (0.0%) | 0 (0.0%) |
| 18 to 34 Years | 0 (0.0%) | 0 (0.0%) |
| 35 to 64 Years | 0 (0.0%) | 3 (3.7%) |
| 65 to 74 Years | 1 (4.0%) | 0 (0.0%) |
| 75 Years and over | 0 (0.0%) | 2 (6.2%) |
Disability Class: Cognitive Difficulty
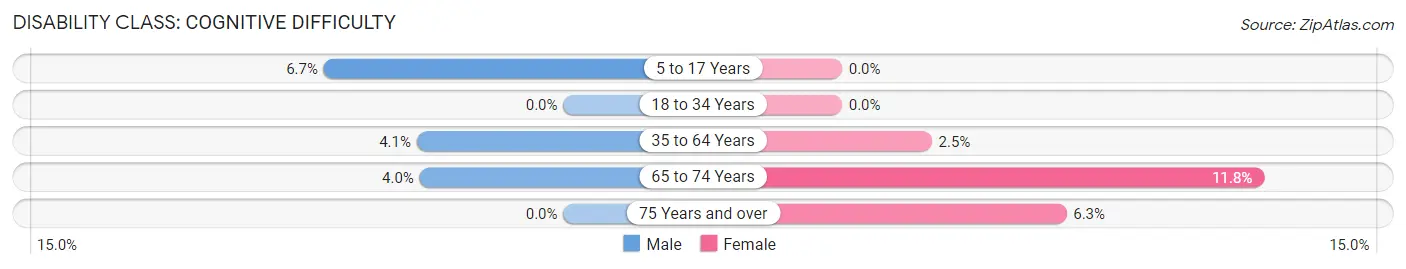
| Age Bracket | Male | Female |
| 5 to 17 Years | 3 (6.7%) | 0 (0.0%) |
| 18 to 34 Years | 0 (0.0%) | 0 (0.0%) |
| 35 to 64 Years | 4 (4.1%) | 2 (2.5%) |
| 65 to 74 Years | 1 (4.0%) | 2 (11.8%) |
| 75 Years and over | 0 (0.0%) | 2 (6.2%) |
Disability Class: Ambulatory Difficulty
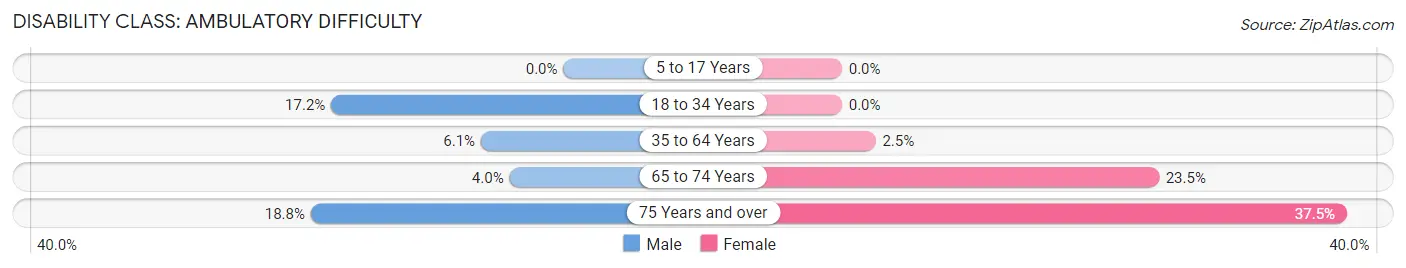
| Age Bracket | Male | Female |
| 5 to 17 Years | 0 (0.0%) | 0 (0.0%) |
| 18 to 34 Years | 5 (17.2%) | 0 (0.0%) |
| 35 to 64 Years | 6 (6.1%) | 2 (2.5%) |
| 65 to 74 Years | 1 (4.0%) | 4 (23.5%) |
| 75 Years and over | 3 (18.8%) | 12 (37.5%) |
Disability Class: Self-Care Difficulty
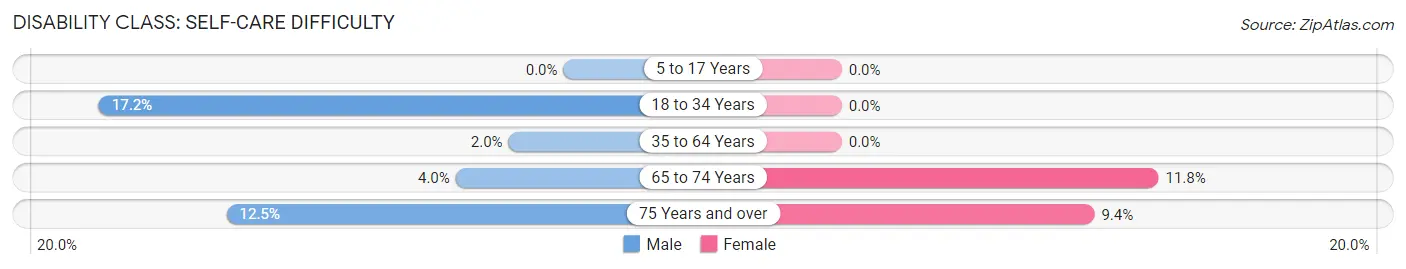
| Age Bracket | Male | Female |
| 5 to 17 Years | 0 (0.0%) | 0 (0.0%) |
| 18 to 34 Years | 5 (17.2%) | 0 (0.0%) |
| 35 to 64 Years | 2 (2.0%) | 0 (0.0%) |
| 65 to 74 Years | 1 (4.0%) | 2 (11.8%) |
| 75 Years and over | 2 (12.5%) | 3 (9.4%) |
Technology Access in Farragut
Computing Device Access in Farragut
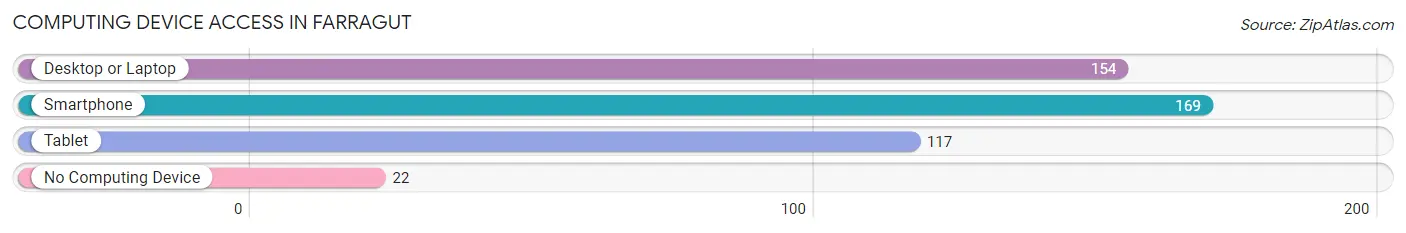
| Device Type | # Households | % Households |
| Desktop or Laptop | 154 | 75.5% |
| Smartphone | 169 | 82.8% |
| Tablet | 117 | 57.4% |
| No Computing Device | 22 | 10.8% |
| Total | 204 | 100.0% |
Internet Access in Farragut
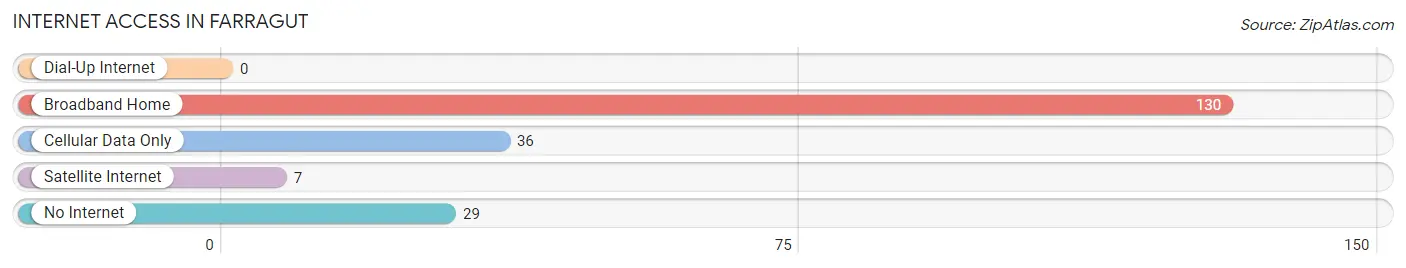
| Internet Type | # Households | % Households |
| Dial-Up Internet | 0 | 0.0% |
| Broadband Home | 130 | 63.7% |
| Cellular Data Only | 36 | 17.6% |
| Satellite Internet | 7 | 3.4% |
| No Internet | 29 | 14.2% |
| Total | 204 | 100.0% |
Farragut Summary
Farragut is a small town located in the southwestern corner of Iowa, in the United States. It is situated in the county of Fremont, and is part of the Omaha-Council Bluffs metropolitan area. The town has a population of approximately 1,000 people, and is located on the banks of the Missouri River.
History
Farragut was founded in 1856 by a group of settlers from the nearby town of Council Bluffs. The town was named after Admiral David Farragut, a Civil War hero. The town was originally a farming community, and the main crops grown were corn, wheat, and oats. In the late 19th century, the town began to grow and develop, and by the early 20th century, it had become a thriving community.
In the early 1900s, the town was home to a number of businesses, including a flour mill, a creamery, a blacksmith shop, and a general store. The town also had a school, a post office, and a bank. In the 1920s, the town was connected to the rest of the state by a railroad line, which allowed for the transportation of goods and people.
Geography
Farragut is located in the southwestern corner of Iowa, in the county of Fremont. It is situated on the banks of the Missouri River, and is part of the Omaha-Council Bluffs metropolitan area. The town is located at an elevation of 1,068 feet above sea level. The town is surrounded by rolling hills and farmland, and is located approximately 30 miles from the state capital of Des Moines.
Economy
Farragut’s economy is largely based on agriculture. The town is home to a number of farms, which produce corn, wheat, oats, and other crops. The town also has a number of businesses, including a grocery store, a hardware store, and a restaurant. The town is also home to a number of small manufacturing companies, which produce a variety of products, including furniture, clothing, and electronics.
Demographics
As of the 2010 census, the population of Farragut was 1,000 people. The town is predominantly white, with approximately 95% of the population being of Caucasian descent. The town also has a small Hispanic population, with approximately 4% of the population being of Hispanic or Latino origin. The median household income in Farragut is $45,000, and the median home value is $125,000. The town has a low unemployment rate, with only 3.5% of the population being unemployed.
Farragut is a small town with a rich history and a vibrant economy. The town is home to a number of businesses, and is surrounded by rolling hills and farmland. The town has a population of approximately 1,000 people, and is predominantly white. The town has a low unemployment rate, and the median household income is $45,000. Farragut is a great place to live and work, and is a great example of small-town America.
Common Questions
What is Per Capita Income in Farragut?
Per Capita income in Farragut is $36,178.
What is the Median Family Income in Farragut?
Median Family Income in Farragut is $79,375.
What is the Median Household income in Farragut?
Median Household Income in Farragut is $47,500.
What is Income or Wage Gap in Farragut?
Income or Wage Gap in Farragut is 20.7%.
Women in Farragut earn 79.3 cents for every dollar earned by a man.
What is Inequality or Gini Index in Farragut?
Inequality or Gini Index in Farragut is 0.45.
What is the Total Population of Farragut?
Total Population of Farragut is 396.
What is the Total Male Population of Farragut?
Total Male Population of Farragut is 216.
What is the Total Female Population of Farragut?
Total Female Population of Farragut is 180.
What is the Ratio of Males per 100 Females in Farragut?
There are 120.00 Males per 100 Females in Farragut.
What is the Ratio of Females per 100 Males in Farragut?
There are 83.33 Females per 100 Males in Farragut.
What is the Median Population Age in Farragut?
Median Population Age in Farragut is 46.2 Years.
What is the Average Family Size in Farragut
Average Family Size in Farragut is 2.5 People.
What is the Average Household Size in Farragut
Average Household Size in Farragut is 1.9 People.
How Large is the Labor Force in Farragut?
There are 208 People in the Labor Forcein in Farragut.
What is the Percentage of People in the Labor Force in Farragut?
63.4% of People are in the Labor Force in Farragut.