Iranian vs Immigrants from Ghana Married-couple Households
COMPARE
Iranian
Immigrants from Ghana
Married-couple Households
Married-couple Households Comparison
Iranians
Immigrants from Ghana
49.0%
MARRIED-COUPLE HOUSEHOLDS
99.7/ 100
METRIC RATING
36th/ 347
METRIC RANK
41.8%
MARRIED-COUPLE HOUSEHOLDS
0.0/ 100
METRIC RATING
299th/ 347
METRIC RANK
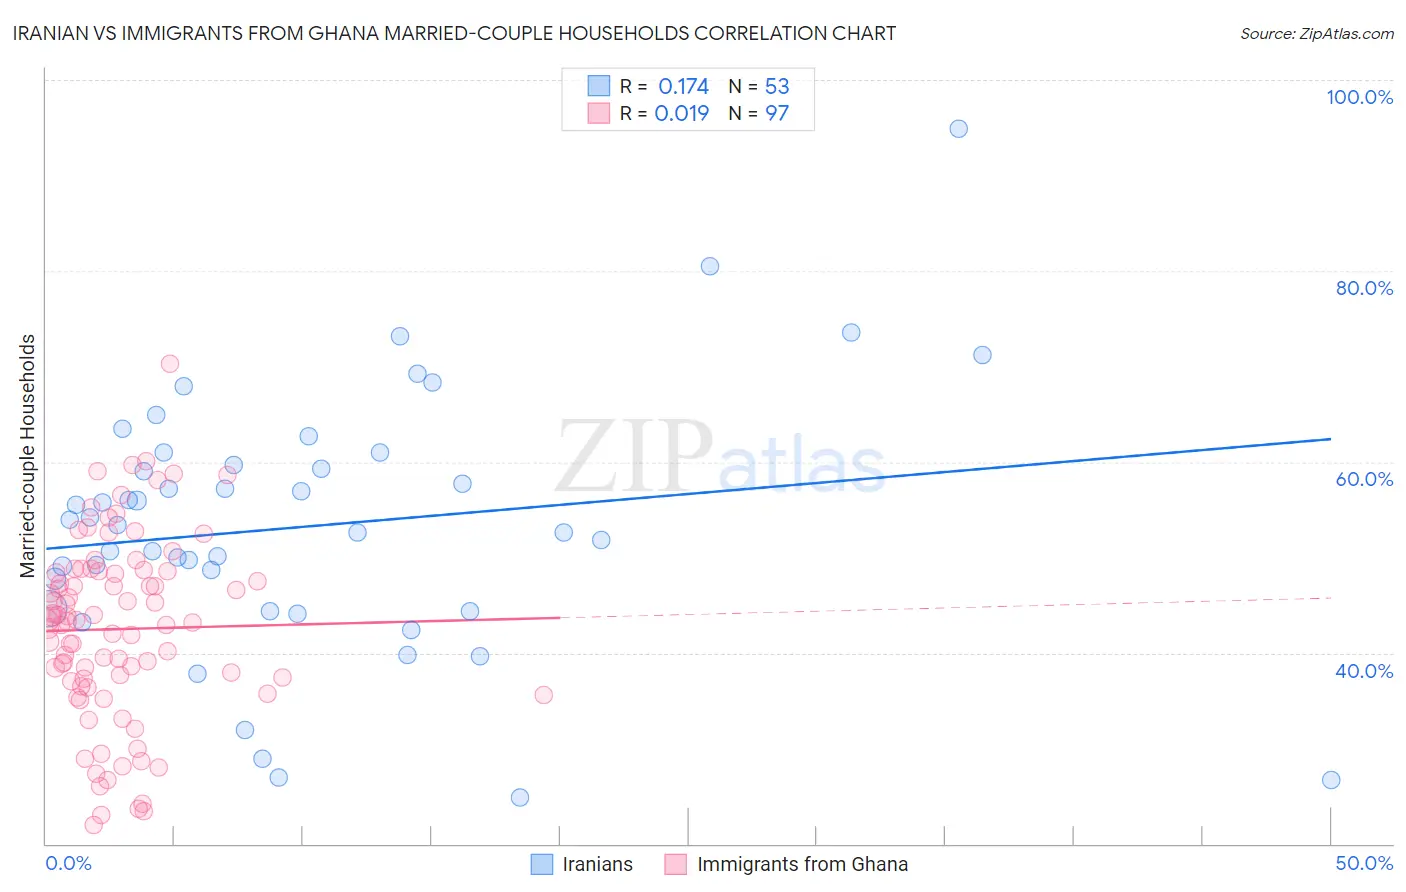
Iranian vs Immigrants from Ghana Married-couple Households Correlation Chart
The statistical analysis conducted on geographies consisting of 316,648,263 people shows a poor positive correlation between the proportion of Iranians and percentage of married-couple family households in the United States with a correlation coefficient (R) of 0.174 and weighted average of 49.0%. Similarly, the statistical analysis conducted on geographies consisting of 199,796,188 people shows no correlation between the proportion of Immigrants from Ghana and percentage of married-couple family households in the United States with a correlation coefficient (R) of 0.019 and weighted average of 41.8%, a difference of 17.2%.
Married-couple Households Correlation Summary
| Measurement | Iranian | Immigrants from Ghana |
| Minimum | 24.8% | 22.0% |
| Maximum | 94.9% | 70.3% |
| Range | 70.0% | 48.3% |
| Mean | 53.3% | 42.5% |
| Median | 53.4% | 43.2% |
| Interquartile 25% (IQ1) | 44.5% | 36.8% |
| Interquartile 75% (IQ3) | 60.3% | 48.6% |
| Interquartile Range (IQR) | 15.8% | 11.8% |
| Standard Deviation (Sample) | 13.5% | 9.6% |
| Standard Deviation (Population) | 13.4% | 9.6% |
Similar Demographics by Married-couple Households
Demographics Similar to Iranians by Married-couple Households
In terms of married-couple households, the demographic groups most similar to Iranians are Sri Lankan (49.0%, a difference of 0.0%), Scottish (49.0%, a difference of 0.090%), Greek (48.9%, a difference of 0.10%), Italian (49.0%, a difference of 0.11%), and Lithuanian (48.9%, a difference of 0.18%).
| Demographics | Rating | Rank | Married-couple Households |
| Maltese | 99.8 /100 | #29 | Exceptional 49.2% |
| Bolivians | 99.8 /100 | #30 | Exceptional 49.2% |
| Native Hawaiians | 99.8 /100 | #31 | Exceptional 49.1% |
| Hungarians | 99.8 /100 | #32 | Exceptional 49.1% |
| Immigrants | Asia | 99.7 /100 | #33 | Exceptional 49.1% |
| Italians | 99.7 /100 | #34 | Exceptional 49.0% |
| Scottish | 99.7 /100 | #35 | Exceptional 49.0% |
| Iranians | 99.7 /100 | #36 | Exceptional 49.0% |
| Sri Lankans | 99.7 /100 | #37 | Exceptional 49.0% |
| Greeks | 99.7 /100 | #38 | Exceptional 48.9% |
| Lithuanians | 99.6 /100 | #39 | Exceptional 48.9% |
| Immigrants | Bolivia | 99.6 /100 | #40 | Exceptional 48.9% |
| Immigrants | Lebanon | 99.6 /100 | #41 | Exceptional 48.9% |
| Immigrants | Vietnam | 99.6 /100 | #42 | Exceptional 48.8% |
| Immigrants | Iran | 99.6 /100 | #43 | Exceptional 48.8% |
Demographics Similar to Immigrants from Ghana by Married-couple Households
In terms of married-couple households, the demographic groups most similar to Immigrants from Ghana are Immigrants from Belize (41.8%, a difference of 0.020%), Immigrants from Middle Africa (41.8%, a difference of 0.080%), Arapaho (41.8%, a difference of 0.11%), Immigrants from Bahamas (41.7%, a difference of 0.23%), and Immigrants from Honduras (41.6%, a difference of 0.40%).
| Demographics | Rating | Rank | Married-couple Households |
| Indonesians | 0.0 /100 | #292 | Tragic 42.0% |
| Menominee | 0.0 /100 | #293 | Tragic 42.0% |
| Immigrants | Yemen | 0.0 /100 | #294 | Tragic 42.0% |
| Kiowa | 0.0 /100 | #295 | Tragic 42.0% |
| Immigrants | Sudan | 0.0 /100 | #296 | Tragic 41.9% |
| Arapaho | 0.0 /100 | #297 | Tragic 41.8% |
| Immigrants | Middle Africa | 0.0 /100 | #298 | Tragic 41.8% |
| Immigrants | Ghana | 0.0 /100 | #299 | Tragic 41.8% |
| Immigrants | Belize | 0.0 /100 | #300 | Tragic 41.8% |
| Immigrants | Bahamas | 0.0 /100 | #301 | Tragic 41.7% |
| Immigrants | Honduras | 0.0 /100 | #302 | Tragic 41.6% |
| Sub-Saharan Africans | 0.0 /100 | #303 | Tragic 41.6% |
| Immigrants | Guyana | 0.0 /100 | #304 | Tragic 41.6% |
| Sioux | 0.0 /100 | #305 | Tragic 41.5% |
| Guyanese | 0.0 /100 | #306 | Tragic 41.4% |