Iranian vs Cree Married-couple Households
COMPARE
Iranian
Cree
Married-couple Households
Married-couple Households Comparison
Iranians
Cree
49.0%
MARRIED-COUPLE HOUSEHOLDS
99.7/ 100
METRIC RATING
36th/ 347
METRIC RANK
43.6%
MARRIED-COUPLE HOUSEHOLDS
0.1/ 100
METRIC RATING
263rd/ 347
METRIC RANK
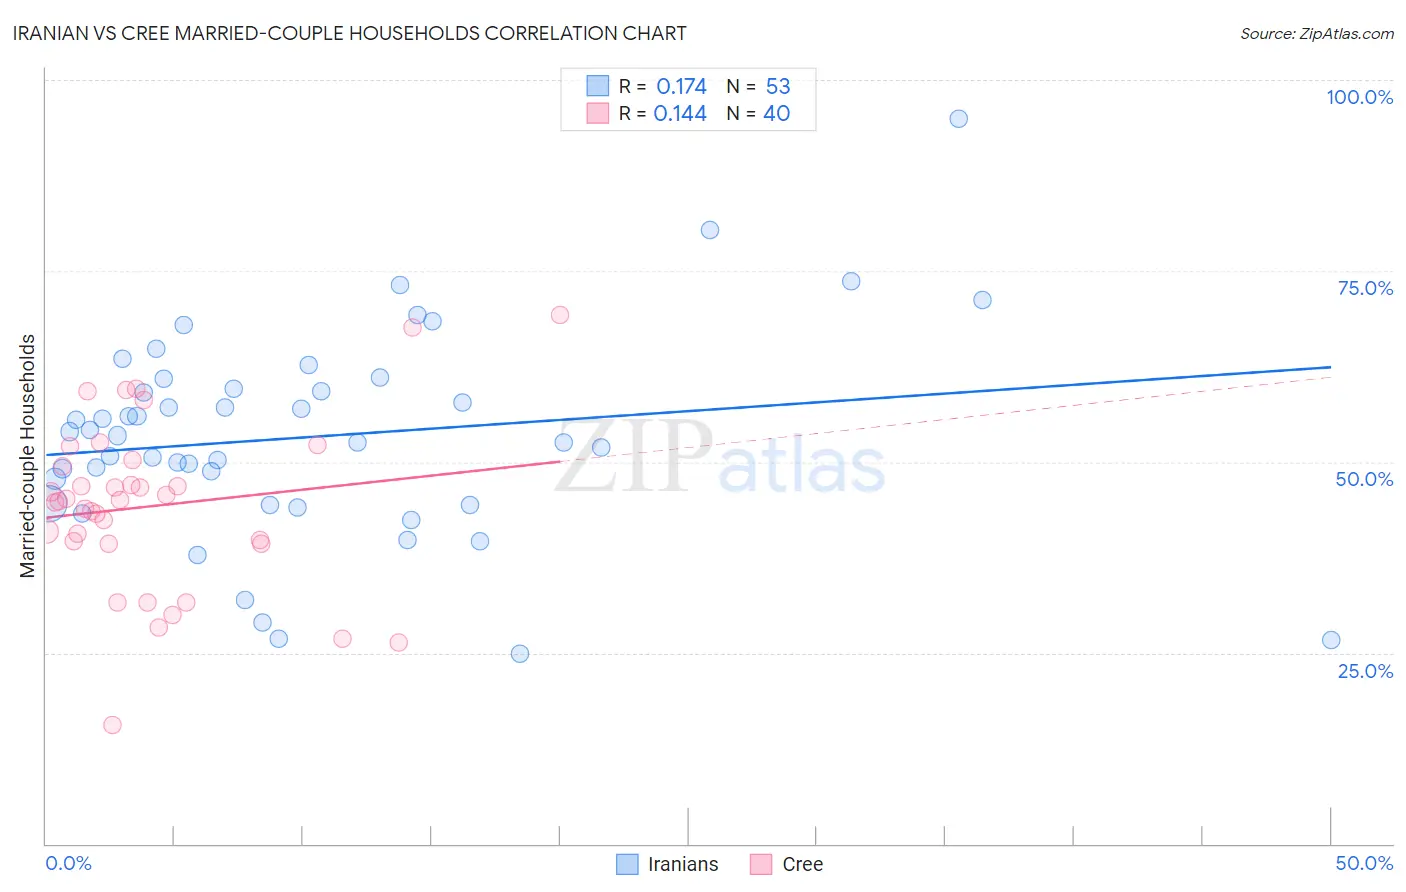
Iranian vs Cree Married-couple Households Correlation Chart
The statistical analysis conducted on geographies consisting of 316,648,263 people shows a poor positive correlation between the proportion of Iranians and percentage of married-couple family households in the United States with a correlation coefficient (R) of 0.174 and weighted average of 49.0%. Similarly, the statistical analysis conducted on geographies consisting of 76,210,632 people shows a poor positive correlation between the proportion of Cree and percentage of married-couple family households in the United States with a correlation coefficient (R) of 0.144 and weighted average of 43.6%, a difference of 12.4%.
Married-couple Households Correlation Summary
| Measurement | Iranian | Cree |
| Minimum | 24.8% | 15.6% |
| Maximum | 94.9% | 69.2% |
| Range | 70.0% | 53.7% |
| Mean | 53.3% | 44.2% |
| Median | 53.4% | 44.9% |
| Interquartile 25% (IQ1) | 44.5% | 39.4% |
| Interquartile 75% (IQ3) | 60.3% | 49.8% |
| Interquartile Range (IQR) | 15.8% | 10.4% |
| Standard Deviation (Sample) | 13.5% | 11.2% |
| Standard Deviation (Population) | 13.4% | 11.0% |
Similar Demographics by Married-couple Households
Demographics Similar to Iranians by Married-couple Households
In terms of married-couple households, the demographic groups most similar to Iranians are Sri Lankan (49.0%, a difference of 0.0%), Scottish (49.0%, a difference of 0.090%), Greek (48.9%, a difference of 0.10%), Italian (49.0%, a difference of 0.11%), and Lithuanian (48.9%, a difference of 0.18%).
| Demographics | Rating | Rank | Married-couple Households |
| Maltese | 99.8 /100 | #29 | Exceptional 49.2% |
| Bolivians | 99.8 /100 | #30 | Exceptional 49.2% |
| Native Hawaiians | 99.8 /100 | #31 | Exceptional 49.1% |
| Hungarians | 99.8 /100 | #32 | Exceptional 49.1% |
| Immigrants | Asia | 99.7 /100 | #33 | Exceptional 49.1% |
| Italians | 99.7 /100 | #34 | Exceptional 49.0% |
| Scottish | 99.7 /100 | #35 | Exceptional 49.0% |
| Iranians | 99.7 /100 | #36 | Exceptional 49.0% |
| Sri Lankans | 99.7 /100 | #37 | Exceptional 49.0% |
| Greeks | 99.7 /100 | #38 | Exceptional 48.9% |
| Lithuanians | 99.6 /100 | #39 | Exceptional 48.9% |
| Immigrants | Bolivia | 99.6 /100 | #40 | Exceptional 48.9% |
| Immigrants | Lebanon | 99.6 /100 | #41 | Exceptional 48.9% |
| Immigrants | Vietnam | 99.6 /100 | #42 | Exceptional 48.8% |
| Immigrants | Iran | 99.6 /100 | #43 | Exceptional 48.8% |
Demographics Similar to Cree by Married-couple Households
In terms of married-couple households, the demographic groups most similar to Cree are Vietnamese (43.6%, a difference of 0.11%), Bangladeshi (43.5%, a difference of 0.11%), Alaskan Athabascan (43.6%, a difference of 0.17%), Moroccan (43.5%, a difference of 0.19%), and Ecuadorian (43.5%, a difference of 0.23%).
| Demographics | Rating | Rank | Married-couple Households |
| Ugandans | 0.3 /100 | #256 | Tragic 43.8% |
| Blackfeet | 0.2 /100 | #257 | Tragic 43.8% |
| Central American Indians | 0.2 /100 | #258 | Tragic 43.8% |
| Iroquois | 0.2 /100 | #259 | Tragic 43.7% |
| Immigrants | Cameroon | 0.2 /100 | #260 | Tragic 43.7% |
| Alaskan Athabascans | 0.2 /100 | #261 | Tragic 43.6% |
| Vietnamese | 0.2 /100 | #262 | Tragic 43.6% |
| Cree | 0.1 /100 | #263 | Tragic 43.6% |
| Bangladeshis | 0.1 /100 | #264 | Tragic 43.5% |
| Moroccans | 0.1 /100 | #265 | Tragic 43.5% |
| Ecuadorians | 0.1 /100 | #266 | Tragic 43.5% |
| Natives/Alaskans | 0.1 /100 | #267 | Tragic 43.5% |
| Immigrants | Burma/Myanmar | 0.1 /100 | #268 | Tragic 43.4% |
| Immigrants | Sierra Leone | 0.1 /100 | #269 | Tragic 43.3% |
| Yuman | 0.1 /100 | #270 | Tragic 43.3% |