Taiwanese Disability
COMPARE
Taiwanese
Select to Compare
Disability
Taiwanese Disability
10.8%
DISABILITY
99.9/ 100
METRIC RATING
47th/ 347
METRIC RANK
Taiwanese Disability Correlation Chart
The statistical analysis conducted on geographies consisting of 31,724,936 people shows a moderate positive correlation between the proportion of Taiwanese and percentage of population with a disability in the United States with a correlation coefficient (R) of 0.468 and weighted average of 10.8%. On average, for every 1% (one percent) increase in Taiwanese within a typical geography, there is an increase of 4.4% in percentage of population with a disability.
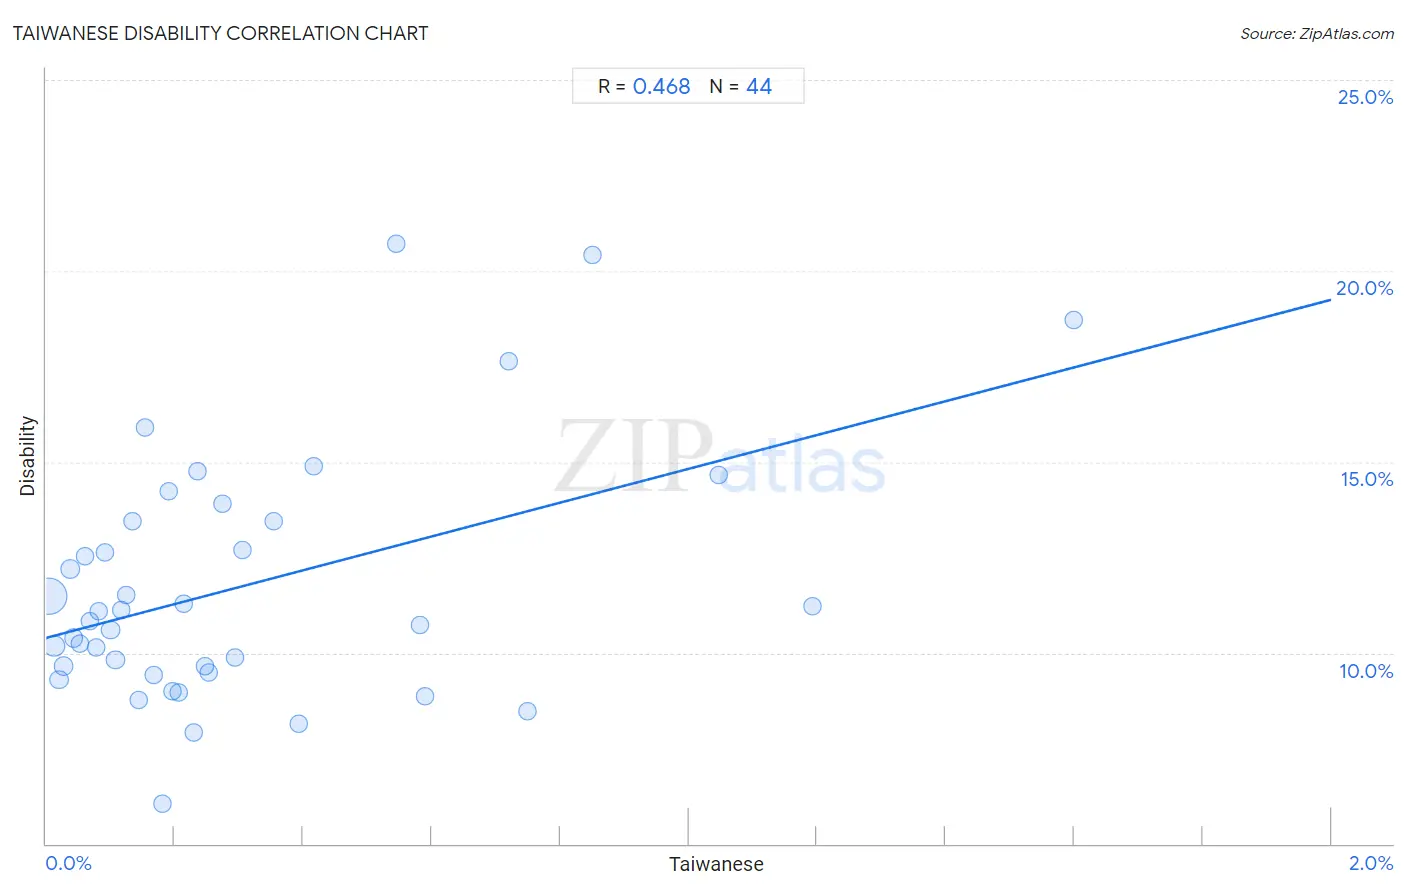
It is essential to understand that the correlation between the percentage of Taiwanese and percentage of population with a disability does not imply a direct cause-and-effect relationship. It remains uncertain whether the presence of Taiwanese influences an upward or downward trend in the level of percentage of population with a disability within an area, or if Taiwanese simply ended up residing in those areas with higher or lower levels of percentage of population with a disability due to other factors.
Demographics Similar to Taiwanese by Disability
In terms of disability, the demographic groups most similar to Taiwanese are Tongan (10.8%, a difference of 0.010%), Immigrants from Peru (10.8%, a difference of 0.020%), Soviet Union (10.9%, a difference of 0.19%), Vietnamese (10.9%, a difference of 0.25%), and Immigrants from Saudi Arabia (10.9%, a difference of 0.25%).
| Demographics | Rating | Rank | Disability |
| Mongolians | 99.9 /100 | #40 | Exceptional 10.8% |
| Immigrants from Australia | 99.9 /100 | #41 | Exceptional 10.8% |
| Immigrants from Nepal | 99.9 /100 | #42 | Exceptional 10.8% |
| Israelis | 99.9 /100 | #43 | Exceptional 10.8% |
| Immigrants from Japan | 99.9 /100 | #44 | Exceptional 10.8% |
| Immigrants from Peru | 99.9 /100 | #45 | Exceptional 10.8% |
| Tongans | 99.9 /100 | #46 | Exceptional 10.8% |
| Taiwanese | 99.9 /100 | #47 | Exceptional 10.8% |
| Soviet Union | 99.9 /100 | #48 | Exceptional 10.9% |
| Vietnamese | 99.9 /100 | #49 | Exceptional 10.9% |
| Immigrants from Saudi Arabia | 99.9 /100 | #50 | Exceptional 10.9% |
| Peruvians | 99.8 /100 | #51 | Exceptional 10.9% |
| South Americans | 99.8 /100 | #52 | Exceptional 10.9% |
| Immigrants from Spain | 99.8 /100 | #53 | Exceptional 10.9% |
| Jordanians | 99.8 /100 | #54 | Exceptional 10.9% |
Taiwanese Disability Correlation Summary
| Measurement | Taiwanese Data | Disability Data |
| Minimum | 0.0036% | 6.1% |
| Maximum | 1.6% | 20.7% |
| Range | 1.6% | 14.7% |
| Mean | 0.31% | 11.7% |
| Median | 0.19% | 11.0% |
| Interquartile 25% (IQ1) | 0.087% | 9.6% |
| Interquartile 75% (IQ3) | 0.37% | 13.4% |
| Interquartile Range (IQR) | 0.29% | 3.9% |
| Standard Deviation (Sample) | 0.34% | 3.2% |
| Standard Deviation (Population) | 0.34% | 3.2% |
Correlation Details
| Taiwanese Percentile | Sample Size | Disability |
[ 0.0% - 0.5% ] 0.0036% | 22,155,783 | 11.5% |
[ 0.0% - 0.5% ] 0.012% | 3,425,756 | 10.2% |
[ 0.0% - 0.5% ] 0.020% | 720,519 | 9.3% |
[ 0.0% - 0.5% ] 0.027% | 1,852,207 | 9.6% |
[ 0.0% - 0.5% ] 0.037% | 874,999 | 12.2% |
[ 0.0% - 0.5% ] 0.043% | 240,264 | 10.4% |
[ 0.0% - 0.5% ] 0.052% | 257,610 | 10.2% |
[ 0.0% - 0.5% ] 0.060% | 80,643 | 12.5% |
[ 0.0% - 0.5% ] 0.068% | 303,351 | 10.8% |
[ 0.0% - 0.5% ] 0.077% | 135,550 | 10.1% |
[ 0.0% - 0.5% ] 0.082% | 93,688 | 11.1% |
[ 0.0% - 0.5% ] 0.091% | 204,048 | 12.6% |
[ 0.0% - 0.5% ] 0.10% | 93,917 | 10.6% |
[ 0.0% - 0.5% ] 0.11% | 335,510 | 9.8% |
[ 0.0% - 0.5% ] 0.12% | 66,658 | 11.1% |
[ 0.0% - 0.5% ] 0.12% | 37,047 | 11.5% |
[ 0.0% - 0.5% ] 0.13% | 85,525 | 13.5% |
[ 0.0% - 0.5% ] 0.14% | 47,549 | 8.8% |
[ 0.0% - 0.5% ] 0.15% | 33,890 | 15.9% |
[ 0.0% - 0.5% ] 0.17% | 33,297 | 9.4% |
[ 0.0% - 0.5% ] 0.18% | 77,868 | 6.1% |
[ 0.0% - 0.5% ] 0.19% | 63,422 | 14.2% |
[ 0.0% - 0.5% ] 0.20% | 36,806 | 9.0% |
[ 0.0% - 0.5% ] 0.21% | 61,757 | 9.0% |
[ 0.0% - 0.5% ] 0.21% | 17,808 | 11.3% |
[ 0.0% - 0.5% ] 0.23% | 42,116 | 7.9% |
[ 0.0% - 0.5% ] 0.23% | 21,712 | 14.7% |
[ 0.0% - 0.5% ] 0.25% | 40,064 | 9.7% |
[ 0.0% - 0.5% ] 0.25% | 30,509 | 9.5% |
[ 0.0% - 0.5% ] 0.28% | 18,536 | 13.9% |
[ 0.0% - 0.5% ] 0.29% | 7,471 | 9.9% |
[ 0.0% - 0.5% ] 0.31% | 654 | 12.7% |
[ 0.0% - 0.5% ] 0.35% | 83,401 | 13.4% |
[ 0.0% - 0.5% ] 0.39% | 7,626 | 8.1% |
[ 0.0% - 0.5% ] 0.42% | 32,665 | 14.9% |
[ 0.5% - 1.0% ] 0.54% | 1,471 | 20.7% |
[ 0.5% - 1.0% ] 0.58% | 23,689 | 10.7% |
[ 0.5% - 1.0% ] 0.59% | 3,051 | 8.8% |
[ 0.5% - 1.0% ] 0.72% | 278 | 17.6% |
[ 0.5% - 1.0% ] 0.75% | 66,249 | 8.5% |
[ 0.5% - 1.0% ] 0.85% | 470 | 20.4% |
[ 1.0% - 1.5% ] 1.05% | 4,487 | 14.6% |
[ 1.0% - 1.5% ] 1.19% | 2,515 | 11.2% |
[ 1.5% - 2.0% ] 1.60% | 2,500 | 18.7% |