Immigrants from Kazakhstan Disability
COMPARE
Immigrants from Kazakhstan
Select to Compare
Disability
Immigrants from Kazakhstan Disability
11.3%
DISABILITY
96.4/ 100
METRIC RATING
105th/ 347
METRIC RANK
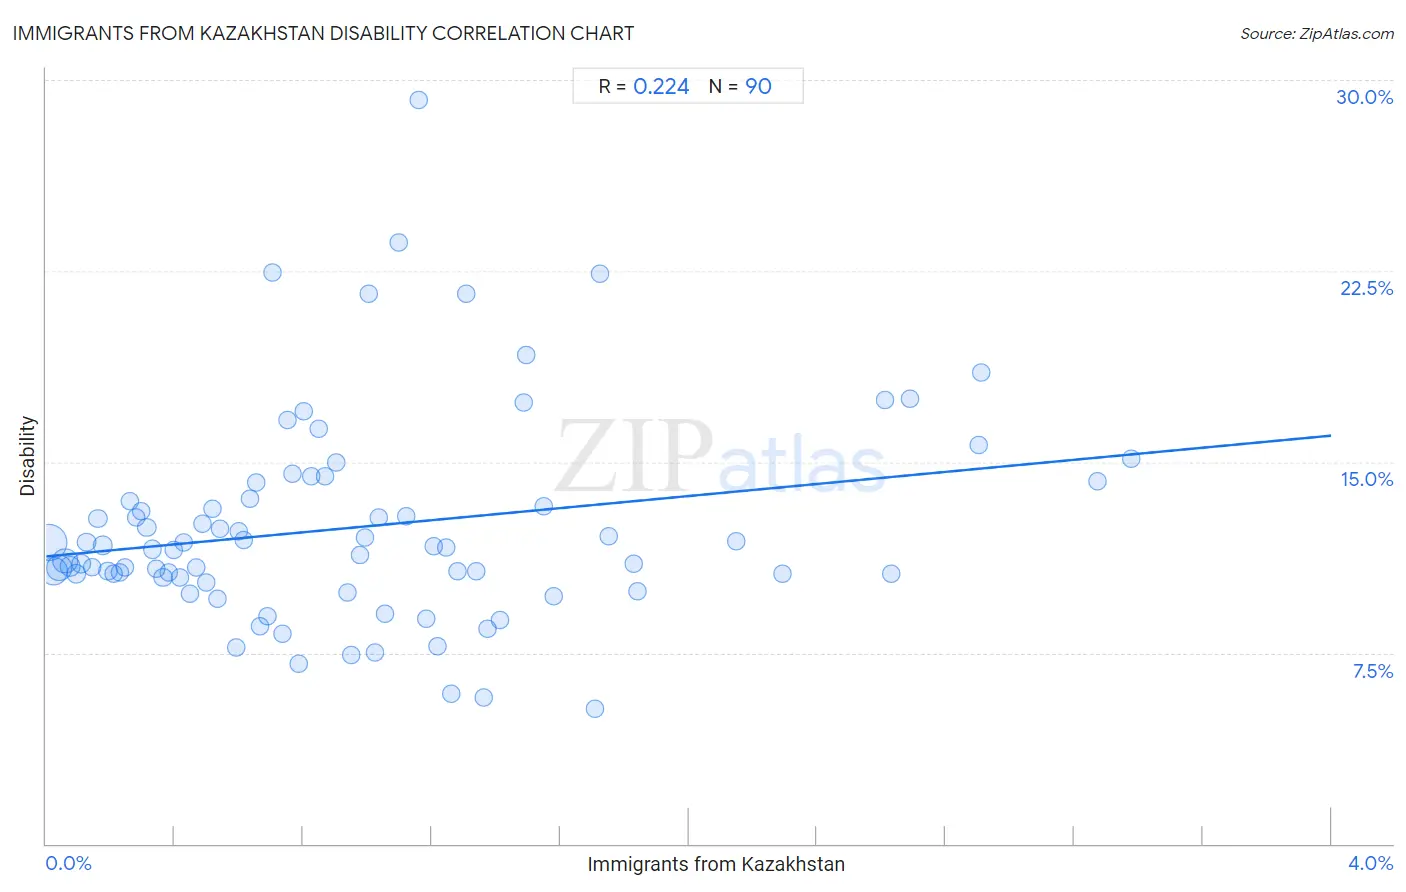
Immigrants from Kazakhstan Disability Correlation Chart
The statistical analysis conducted on geographies consisting of 124,443,289 people shows a weak positive correlation between the proportion of Immigrants from Kazakhstan and percentage of population with a disability in the United States with a correlation coefficient (R) of 0.224 and weighted average of 11.3%. On average, for every 1% (one percent) increase in Immigrants from Kazakhstan within a typical geography, there is an increase of 1.2% in percentage of population with a disability.
It is essential to understand that the correlation between the percentage of Immigrants from Kazakhstan and percentage of population with a disability does not imply a direct cause-and-effect relationship. It remains uncertain whether the presence of Immigrants from Kazakhstan influences an upward or downward trend in the level of percentage of population with a disability within an area, or if Immigrants from Kazakhstan simply ended up residing in those areas with higher or lower levels of percentage of population with a disability due to other factors.
Demographics Similar to Immigrants from Kazakhstan by Disability
In terms of disability, the demographic groups most similar to Immigrants from Kazakhstan are Immigrants (11.3%, a difference of 0.010%), Immigrants from Uruguay (11.3%, a difference of 0.020%), Immigrants from Eastern Europe (11.3%, a difference of 0.030%), Nicaraguan (11.3%, a difference of 0.050%), and Immigrants from Eastern Africa (11.3%, a difference of 0.090%).
| Demographics | Rating | Rank | Disability |
| Uruguayans | 97.4 /100 | #98 | Exceptional 11.2% |
| Immigrants from Czechoslovakia | 97.4 /100 | #99 | Exceptional 11.2% |
| Immigrants from Greece | 96.9 /100 | #100 | Exceptional 11.3% |
| Immigrants from Nicaragua | 96.8 /100 | #101 | Exceptional 11.3% |
| Immigrants from Eastern Africa | 96.7 /100 | #102 | Exceptional 11.3% |
| Immigrants from Uruguay | 96.4 /100 | #103 | Exceptional 11.3% |
| Immigrants | 96.4 /100 | #104 | Exceptional 11.3% |
| Immigrants from Kazakhstan | 96.4 /100 | #105 | Exceptional 11.3% |
| Immigrants from Eastern Europe | 96.3 /100 | #106 | Exceptional 11.3% |
| Nicaraguans | 96.2 /100 | #107 | Exceptional 11.3% |
| Immigrants from Nigeria | 96.0 /100 | #108 | Exceptional 11.3% |
| Immigrants from Uganda | 95.7 /100 | #109 | Exceptional 11.3% |
| Immigrants from Denmark | 95.6 /100 | #110 | Exceptional 11.3% |
| Immigrants from South Eastern Asia | 95.4 /100 | #111 | Exceptional 11.3% |
| Immigrants from Uzbekistan | 94.9 /100 | #112 | Exceptional 11.3% |
Immigrants from Kazakhstan Disability Correlation Summary
| Measurement | Immigrants from Kazakhstan Data | Disability Data |
| Minimum | 0.0085% | 5.3% |
| Maximum | 3.4% | 29.2% |
| Range | 3.4% | 23.9% |
| Mean | 0.97% | 12.4% |
| Median | 0.79% | 11.6% |
| Interquartile 25% (IQ1) | 0.38% | 10.5% |
| Interquartile 75% (IQ3) | 1.3% | 13.6% |
| Interquartile Range (IQR) | 0.93% | 3.1% |
| Standard Deviation (Sample) | 0.78% | 4.1% |
| Standard Deviation (Population) | 0.77% | 4.1% |
Correlation Details
| Immigrants from Kazakhstan Percentile | Sample Size | Disability |
[ 0.0% - 0.5% ] 0.0085% | 44,549,186 | 11.8% |
[ 0.0% - 0.5% ] 0.024% | 24,146,891 | 10.7% |
[ 0.0% - 0.5% ] 0.041% | 15,574,964 | 10.8% |
[ 0.0% - 0.5% ] 0.058% | 16,738,616 | 11.1% |
[ 0.0% - 0.5% ] 0.075% | 5,387,266 | 10.9% |
[ 0.0% - 0.5% ] 0.093% | 2,927,688 | 10.6% |
[ 0.0% - 0.5% ] 0.11% | 3,257,380 | 11.0% |
[ 0.0% - 0.5% ] 0.13% | 1,522,056 | 11.9% |
[ 0.0% - 0.5% ] 0.14% | 1,522,347 | 10.9% |
[ 0.0% - 0.5% ] 0.16% | 1,022,316 | 12.8% |
[ 0.0% - 0.5% ] 0.18% | 1,470,864 | 11.7% |
[ 0.0% - 0.5% ] 0.19% | 688,596 | 10.7% |
[ 0.0% - 0.5% ] 0.21% | 511,577 | 10.6% |
[ 0.0% - 0.5% ] 0.23% | 603,347 | 10.6% |
[ 0.0% - 0.5% ] 0.24% | 430,066 | 10.9% |
[ 0.0% - 0.5% ] 0.26% | 419,489 | 13.5% |
[ 0.0% - 0.5% ] 0.28% | 371,115 | 12.8% |
[ 0.0% - 0.5% ] 0.29% | 308,814 | 13.0% |
[ 0.0% - 0.5% ] 0.31% | 240,585 | 12.4% |
[ 0.0% - 0.5% ] 0.33% | 362,414 | 11.6% |
[ 0.0% - 0.5% ] 0.34% | 45,663 | 10.8% |
[ 0.0% - 0.5% ] 0.36% | 122,602 | 10.5% |
[ 0.0% - 0.5% ] 0.38% | 233,312 | 10.7% |
[ 0.0% - 0.5% ] 0.40% | 213,842 | 11.5% |
[ 0.0% - 0.5% ] 0.41% | 158,717 | 10.4% |
[ 0.0% - 0.5% ] 0.43% | 176,461 | 11.8% |
[ 0.0% - 0.5% ] 0.45% | 167,453 | 9.8% |
[ 0.0% - 0.5% ] 0.47% | 110,922 | 10.9% |
[ 0.0% - 0.5% ] 0.49% | 133,795 | 12.6% |
[ 0.0% - 0.5% ] 0.50% | 21,892 | 10.3% |
[ 0.5% - 1.0% ] 0.52% | 28,846 | 13.2% |
[ 0.5% - 1.0% ] 0.53% | 51,951 | 9.6% |
[ 0.5% - 1.0% ] 0.54% | 56,767 | 12.4% |
[ 0.5% - 1.0% ] 0.59% | 63,599 | 7.7% |
[ 0.5% - 1.0% ] 0.60% | 6,664 | 12.3% |
[ 0.5% - 1.0% ] 0.61% | 1,466 | 12.0% |
[ 0.5% - 1.0% ] 0.63% | 60,252 | 13.6% |
[ 0.5% - 1.0% ] 0.65% | 134,010 | 14.2% |
[ 0.5% - 1.0% ] 0.67% | 15,893 | 8.6% |
[ 0.5% - 1.0% ] 0.69% | 49,263 | 8.9% |
[ 0.5% - 1.0% ] 0.71% | 3,827 | 22.5% |
[ 0.5% - 1.0% ] 0.73% | 13,210 | 8.2% |
[ 0.5% - 1.0% ] 0.75% | 9,046 | 16.6% |
[ 0.5% - 1.0% ] 0.77% | 28,083 | 14.6% |
[ 0.5% - 1.0% ] 0.79% | 18,675 | 7.0% |
[ 0.5% - 1.0% ] 0.80% | 29,673 | 17.0% |
[ 0.5% - 1.0% ] 0.83% | 969 | 14.4% |
[ 0.5% - 1.0% ] 0.85% | 4,602 | 16.3% |
[ 0.5% - 1.0% ] 0.87% | 4,383 | 14.4% |
[ 0.5% - 1.0% ] 0.90% | 85,377 | 15.0% |
[ 0.5% - 1.0% ] 0.94% | 24,174 | 9.9% |
[ 0.5% - 1.0% ] 0.95% | 6,952 | 7.4% |
[ 0.5% - 1.0% ] 0.98% | 41,667 | 11.4% |
[ 0.5% - 1.0% ] 0.99% | 10,583 | 12.0% |
[ 1.0% - 1.5% ] 1.01% | 199 | 21.6% |
[ 1.0% - 1.5% ] 1.02% | 30,108 | 7.5% |
[ 1.0% - 1.5% ] 1.04% | 14,291 | 12.8% |
[ 1.0% - 1.5% ] 1.06% | 14,216 | 9.1% |
[ 1.0% - 1.5% ] 1.10% | 2,096 | 23.6% |
[ 1.0% - 1.5% ] 1.12% | 12,863 | 12.9% |
[ 1.0% - 1.5% ] 1.16% | 691 | 29.2% |
[ 1.0% - 1.5% ] 1.18% | 6,592 | 8.8% |
[ 1.0% - 1.5% ] 1.20% | 13,778 | 11.7% |
[ 1.0% - 1.5% ] 1.22% | 6,648 | 7.8% |
[ 1.0% - 1.5% ] 1.24% | 6,914 | 11.6% |
[ 1.0% - 1.5% ] 1.26% | 2,540 | 5.9% |
[ 1.0% - 1.5% ] 1.28% | 38,430 | 10.7% |
[ 1.0% - 1.5% ] 1.31% | 611 | 21.6% |
[ 1.0% - 1.5% ] 1.34% | 597 | 10.7% |
[ 1.0% - 1.5% ] 1.36% | 8,962 | 5.8% |
[ 1.0% - 1.5% ] 1.38% | 5,162 | 8.4% |
[ 1.0% - 1.5% ] 1.41% | 8,065 | 8.8% |
[ 1.0% - 1.5% ] 1.49% | 202 | 17.3% |
[ 1.0% - 1.5% ] 1.49% | 3,014 | 19.2% |
[ 1.5% - 2.0% ] 1.55% | 3,424 | 13.3% |
[ 1.5% - 2.0% ] 1.58% | 25,729 | 9.7% |
[ 1.5% - 2.0% ] 1.71% | 13,696 | 5.3% |
[ 1.5% - 2.0% ] 1.72% | 116 | 22.4% |
[ 1.5% - 2.0% ] 1.75% | 15,130 | 12.1% |
[ 1.5% - 2.0% ] 1.83% | 3,224 | 11.0% |
[ 1.5% - 2.0% ] 1.84% | 543 | 9.9% |
[ 2.0% - 2.5% ] 2.15% | 2,280 | 11.9% |
[ 2.0% - 2.5% ] 2.29% | 1,397 | 10.6% |
[ 2.5% - 3.0% ] 2.61% | 7,662 | 17.4% |
[ 2.5% - 3.0% ] 2.63% | 1,216 | 10.6% |
[ 2.5% - 3.0% ] 2.69% | 446 | 17.5% |
[ 2.5% - 3.0% ] 2.90% | 792 | 15.7% |
[ 2.5% - 3.0% ] 2.91% | 378 | 18.5% |
[ 3.0% - 3.5% ] 3.27% | 428 | 14.3% |
[ 3.0% - 3.5% ] 3.38% | 681 | 15.1% |