Kenyan vs Immigrants from Netherlands Disability
COMPARE
Kenyan
Immigrants from Netherlands
Disability
Disability Comparison
Kenyans
Immigrants from Netherlands
11.5%
DISABILITY
87.1/ 100
METRIC RATING
137th/ 347
METRIC RANK
11.6%
DISABILITY
69.8/ 100
METRIC RATING
155th/ 347
METRIC RANK
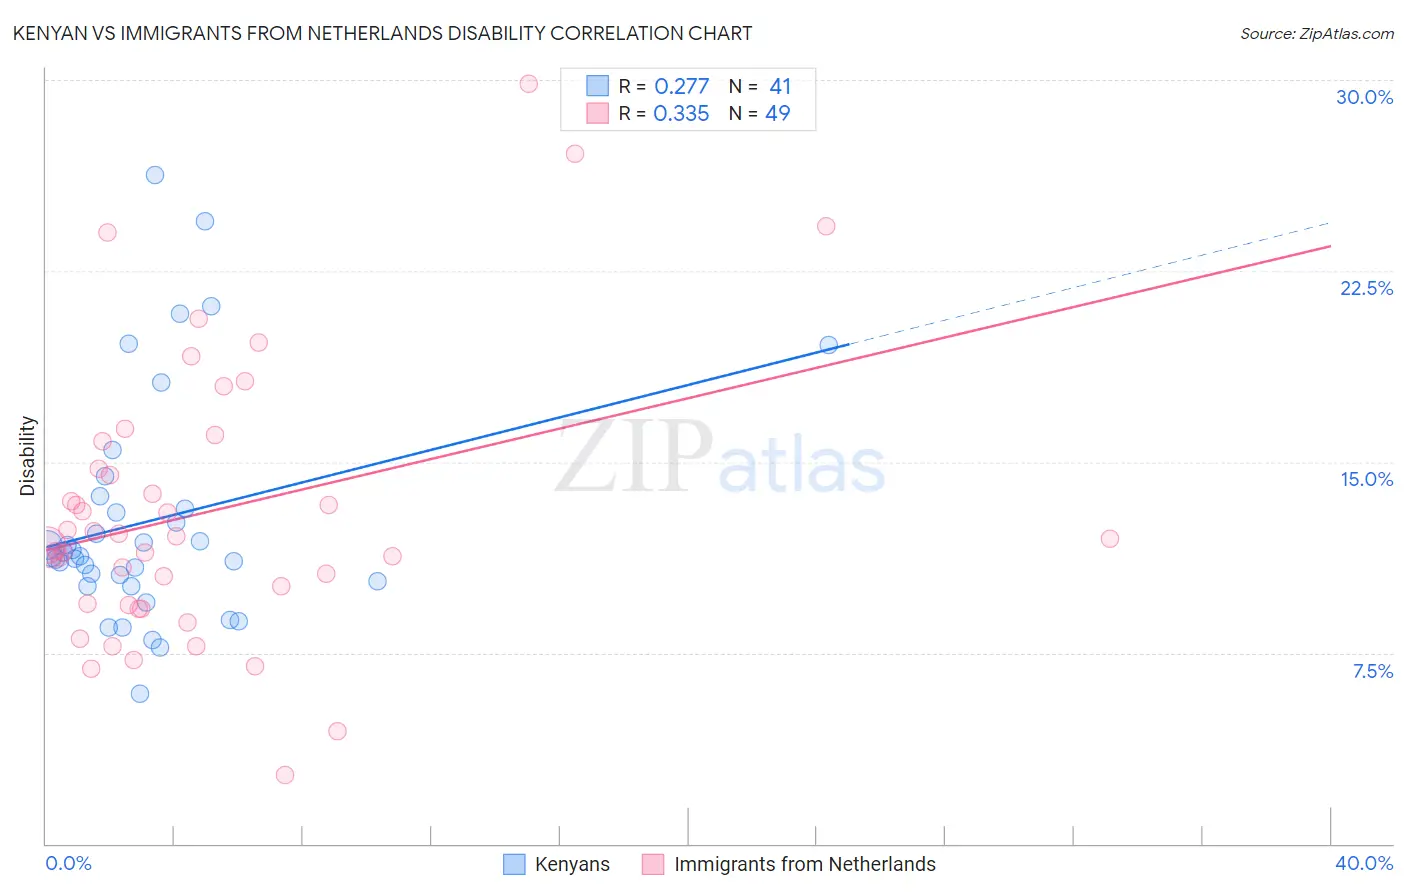
Kenyan vs Immigrants from Netherlands Disability Correlation Chart
The statistical analysis conducted on geographies consisting of 168,214,038 people shows a weak positive correlation between the proportion of Kenyans and percentage of population with a disability in the United States with a correlation coefficient (R) of 0.277 and weighted average of 11.5%. Similarly, the statistical analysis conducted on geographies consisting of 237,881,665 people shows a mild positive correlation between the proportion of Immigrants from Netherlands and percentage of population with a disability in the United States with a correlation coefficient (R) of 0.335 and weighted average of 11.6%, a difference of 1.2%.
Disability Correlation Summary
| Measurement | Kenyan | Immigrants from Netherlands |
| Minimum | 5.9% | 2.7% |
| Maximum | 26.2% | 29.8% |
| Range | 20.3% | 27.1% |
| Mean | 12.7% | 13.0% |
| Median | 11.3% | 12.0% |
| Interquartile 25% (IQ1) | 10.2% | 9.4% |
| Interquartile 75% (IQ3) | 13.4% | 15.3% |
| Interquartile Range (IQR) | 3.2% | 5.9% |
| Standard Deviation (Sample) | 4.5% | 5.5% |
| Standard Deviation (Population) | 4.5% | 5.4% |
Demographics Similar to Kenyans and Immigrants from Netherlands by Disability
In terms of disability, the demographic groups most similar to Kenyans are New Zealander (11.5%, a difference of 0.010%), Ghanaian (11.5%, a difference of 0.010%), Russian (11.5%, a difference of 0.030%), Immigrants from St. Vincent and the Grenadines (11.4%, a difference of 0.070%), and Immigrants from Grenada (11.5%, a difference of 0.10%). Similarly, the demographic groups most similar to Immigrants from Netherlands are Immigrants from Fiji (11.6%, a difference of 0.010%), Immigrants from Guatemala (11.6%, a difference of 0.070%), Immigrants from Ghana (11.6%, a difference of 0.080%), Immigrants from Moldova (11.6%, a difference of 0.12%), and Immigrants from Kenya (11.6%, a difference of 0.13%).
| Demographics | Rating | Rank | Disability |
| Immigrants | St. Vincent and the Grenadines | 87.8 /100 | #136 | Excellent 11.4% |
| Kenyans | 87.1 /100 | #137 | Excellent 11.5% |
| New Zealanders | 87.0 /100 | #138 | Excellent 11.5% |
| Ghanaians | 87.0 /100 | #139 | Excellent 11.5% |
| Russians | 86.8 /100 | #140 | Excellent 11.5% |
| Immigrants | Grenada | 86.1 /100 | #141 | Excellent 11.5% |
| Immigrants | Sudan | 85.3 /100 | #142 | Excellent 11.5% |
| Moroccans | 83.3 /100 | #143 | Excellent 11.5% |
| Australians | 82.5 /100 | #144 | Excellent 11.5% |
| Nigerians | 81.3 /100 | #145 | Excellent 11.5% |
| Immigrants | Hungary | 79.0 /100 | #146 | Good 11.5% |
| Immigrants | Ukraine | 77.6 /100 | #147 | Good 11.5% |
| Sudanese | 77.1 /100 | #148 | Good 11.5% |
| Immigrants | Norway | 73.2 /100 | #149 | Good 11.6% |
| Romanians | 72.7 /100 | #150 | Good 11.6% |
| Immigrants | Kenya | 72.1 /100 | #151 | Good 11.6% |
| Immigrants | Moldova | 72.0 /100 | #152 | Good 11.6% |
| Immigrants | Ghana | 71.2 /100 | #153 | Good 11.6% |
| Immigrants | Guatemala | 71.1 /100 | #154 | Good 11.6% |
| Immigrants | Netherlands | 69.8 /100 | #155 | Good 11.6% |
| Immigrants | Fiji | 69.5 /100 | #156 | Good 11.6% |