Cypriot Disability

COMPARE

Cypriot
Race
Ancestry
AfghanAfricanAlaska NativeAlaskan AthabascanAlbanianAleutAlsatianAmericanApacheArabArapahoArgentineanArmenianAssyrian/Chaldean/SyriacAustralianAustrianBahamianBangladeshiBarbadianBasqueBelgianBelizeanBermudanBhutaneseBlackfeetBolivianBrazilianBritishBritish West IndianBulgarianBurmeseCajunCambodianCanadianCape VerdeanCarpatho RusynCelticCentral AmericanCentral American IndianCherokeeCheyenneChickasawChileanChineseChippewaChoctawColombianColvilleComancheCosta RicanCreeCreekCroatianCrowCubanCypriotCzechCzechoslovakianDanishDelawareDominicanDutchDutch West IndianEastern EuropeanEcuadorianEgyptianEnglishEstonianEthiopianEuropeanFijianFilipinoFinnishFrenchFrench American IndianFrench CanadianGermanGerman RussianGhanaianGreekGuamanian/ChamorroGuatemalanGuyaneseHaitianHmongHonduranHopiHoumaHungarianIcelanderIndian (Asian)IndonesianInupiatIranianIraqiIrishIroquoisIsraeliItalianJamaicanJapaneseJordanianKenyanKiowaKoreanLaotianLatvianLebaneseLiberianLithuanianLumbeeLuxembourgerMacedonianMalaysianMalteseMarshalleseMenomineeMexicanMexican American IndianMongolianMoroccanNative HawaiianNavajoNepaleseNew ZealanderNicaraguanNigerianNorthern EuropeanNorwegianOkinawanOsageOttawaPaiutePakistaniPalestinianPanamanianParaguayanPennsylvania GermanPeruvianPimaPolishPortuguesePotawatomiPuebloPuerto RicanPuget Sound SalishRomanianRussianSalvadoranSamoanScandinavianScotch-IrishScottishSeminoleSenegaleseSerbianShoshoneSierra LeoneanSiouxSlavicSlovakSloveneSomaliSouth AfricanSouth AmericanSouth American IndianSoviet UnionSpaniardSpanishSpanish AmericanSpanish American IndianSri LankanSubsaharan AfricanSudaneseSwedishSwissSyrianTaiwaneseThaiTlingit-HaidaTohono O'OdhamTonganTrinidadian and TobagonianTsimshianTurkishU.S. Virgin IslanderUgandanUkrainianUruguayanUteVenezuelanVietnameseWelshWest IndianYakamaYaquiYugoslavianYumanYup'ikZimbabwean
Immigration
NonimmigrantsImmigrantsAfghanistanAfricaAlbaniaArgentinaArmeniaAsiaAustraliaAustriaBahamasBangladeshBarbadosBelarusBelgiumBelizeBoliviaBosnia and HerzegovinaBrazilBulgariaBurma/MyanmarCabo VerdeCambodiaCameroonCanadaCaribbeanCentral AmericaChileChinaColombiaCongoCosta RicaCroatiaCubaCzechoslovakiaDenmarkDominicaDominican RepublicEastern AfricaEastern AsiaEastern EuropeEcuadorEgyptEl SalvadorEnglandEritreaEthiopiaEuropeFijiFranceGermanyGhanaGreeceGrenadaGuatemalaGuyanaHaitiHondurasHong KongHungaryIndiaIndonesiaIranIraqIrelandIsraelItalyJamaicaJapanJordanKazakhstanKenyaKoreaKuwaitLaosLatin AmericaLatviaLebanonLiberiaLithuaniaMalaysiaMexicoMicronesiaMiddle AfricaMoldovaMoroccoNepalNetherlandsNicaraguaNigeriaNorth AmericaNorth MacedoniaNorthern AfricaNorthern EuropeNorwayOceaniaPakistanPanamaPeruPhilippinesPolandPortugalRomaniaRussiaSaudi ArabiaScotlandSenegalSerbiaSierra LeoneSingaporeSomaliaSouth AfricaSouth AmericaSouth Central AsiaSouth Eastern AsiaSouthern EuropeSpainSri LankaSt. Vincent and the GrenadinesSudanSwedenSwitzerlandSyriaTaiwanThailandTrinidad and TobagoTurkeyUgandaUkraineUruguayUzbekistanVenezuelaVietnamWest IndiesWestern AfricaWestern AsiaWestern EuropeYemenZaireZimbabweAzores
Select to Compare
Race
Ancestry
AfghanAfricanAlaska NativeAlaskan AthabascanAlbanianAleutAlsatianAmericanApacheArabArapahoArgentineanArmenianAssyrian/Chaldean/SyriacAustralianAustrianBahamianBangladeshiBarbadianBasqueBelgianBelizeanBermudanBhutaneseBlackfeetBolivianBrazilianBritishBritish West IndianBulgarianBurmeseCajunCambodianCanadianCape VerdeanCarpatho RusynCelticCentral AmericanCentral American IndianCherokeeCheyenneChickasawChileanChineseChippewaChoctawColombianColvilleComancheCosta RicanCreeCreekCroatianCrowCubanCzechCzechoslovakianDanishDelawareDominicanDutchDutch West IndianEastern EuropeanEcuadorianEgyptianEnglishEstonianEthiopianEuropeanFijianFilipinoFinnishFrenchFrench American IndianFrench CanadianGermanGerman RussianGhanaianGreekGuamanian/ChamorroGuatemalanGuyaneseHaitianHmongHonduranHopiHoumaHungarianIcelanderIndian (Asian)IndonesianInupiatIranianIraqiIrishIroquoisIsraeliItalianJamaicanJapaneseJordanianKenyanKiowaKoreanLaotianLatvianLebaneseLiberianLithuanianLumbeeLuxembourgerMacedonianMalaysianMalteseMarshalleseMenomineeMexicanMexican American IndianMongolianMoroccanNative HawaiianNavajoNepaleseNew ZealanderNicaraguanNigerianNorthern EuropeanNorwegianOkinawanOsageOttawaPaiutePakistaniPalestinianPanamanianParaguayanPennsylvania GermanPeruvianPimaPolishPortuguesePotawatomiPuebloPuerto RicanPuget Sound SalishRomanianRussianSalvadoranSamoanScandinavianScotch-IrishScottishSeminoleSenegaleseSerbianShoshoneSierra LeoneanSiouxSlavicSlovakSloveneSomaliSouth AfricanSouth AmericanSouth American IndianSoviet UnionSpaniardSpanishSpanish AmericanSpanish American IndianSri LankanSubsaharan AfricanSudaneseSwedishSwissSyrianTaiwaneseThaiTlingit-HaidaTohono O'OdhamTonganTrinidadian and TobagonianTsimshianTurkishU.S. Virgin IslanderUgandanUkrainianUruguayanUteVenezuelanVietnameseWelshWest IndianYakamaYaquiYugoslavianYumanYup'ikZimbabwean
Immigration
NonimmigrantsImmigrantsAfghanistanAfricaAlbaniaArgentinaArmeniaAsiaAustraliaAustriaBahamasBangladeshBarbadosBelarusBelgiumBelizeBoliviaBosnia and HerzegovinaBrazilBulgariaBurma/MyanmarCabo VerdeCambodiaCameroonCanadaCaribbeanCentral AmericaChileChinaColombiaCongoCosta RicaCroatiaCubaCzechoslovakiaDenmarkDominicaDominican RepublicEastern AfricaEastern AsiaEastern EuropeEcuadorEgyptEl SalvadorEnglandEritreaEthiopiaEuropeFijiFranceGermanyGhanaGreeceGrenadaGuatemalaGuyanaHaitiHondurasHong KongHungaryIndiaIndonesiaIranIraqIrelandIsraelItalyJamaicaJapanJordanKazakhstanKenyaKoreaKuwaitLaosLatin AmericaLatviaLebanonLiberiaLithuaniaMalaysiaMexicoMicronesiaMiddle AfricaMoldovaMoroccoNepalNetherlandsNicaraguaNigeriaNorth AmericaNorth MacedoniaNorthern AfricaNorthern EuropeNorwayOceaniaPakistanPanamaPeruPhilippinesPolandPortugalRomaniaRussiaSaudi ArabiaScotlandSenegalSerbiaSierra LeoneSingaporeSomaliaSouth AfricaSouth AmericaSouth Central AsiaSouth Eastern AsiaSouthern EuropeSpainSri LankaSt. Vincent and the GrenadinesSudanSwedenSwitzerlandSyriaTaiwanThailandTrinidad and TobagoTurkeyUgandaUkraineUruguayUzbekistanVenezuelaVietnamWest IndiesWestern AfricaWestern AsiaWestern EuropeYemenZaireZimbabweAzores
Disability
Income
Poverty
Unemployment
Labor Participation
Family Structure
Vehicle Availability
Education Level
Disability

Cypriot Disability
Exceptional

10.6%
DISABILITY
100.0/ 100
METRIC RATING
27th/ 347
METRIC RANK

Cypriot Disability Correlation Chart

The statistical analysis conducted on geographies consisting of 61,867,698 people shows a poor positive correlation between the proportion of Cypriots and percentage of population with a disability in the United States with a correlation coefficient (R) of 0.113 and weighted average of 10.6%. On average, for every 1% (one percent) increase in Cypriots within a typical geography, there is an increase of 0.51% in percentage of population with a disability.
Cypriot Disability
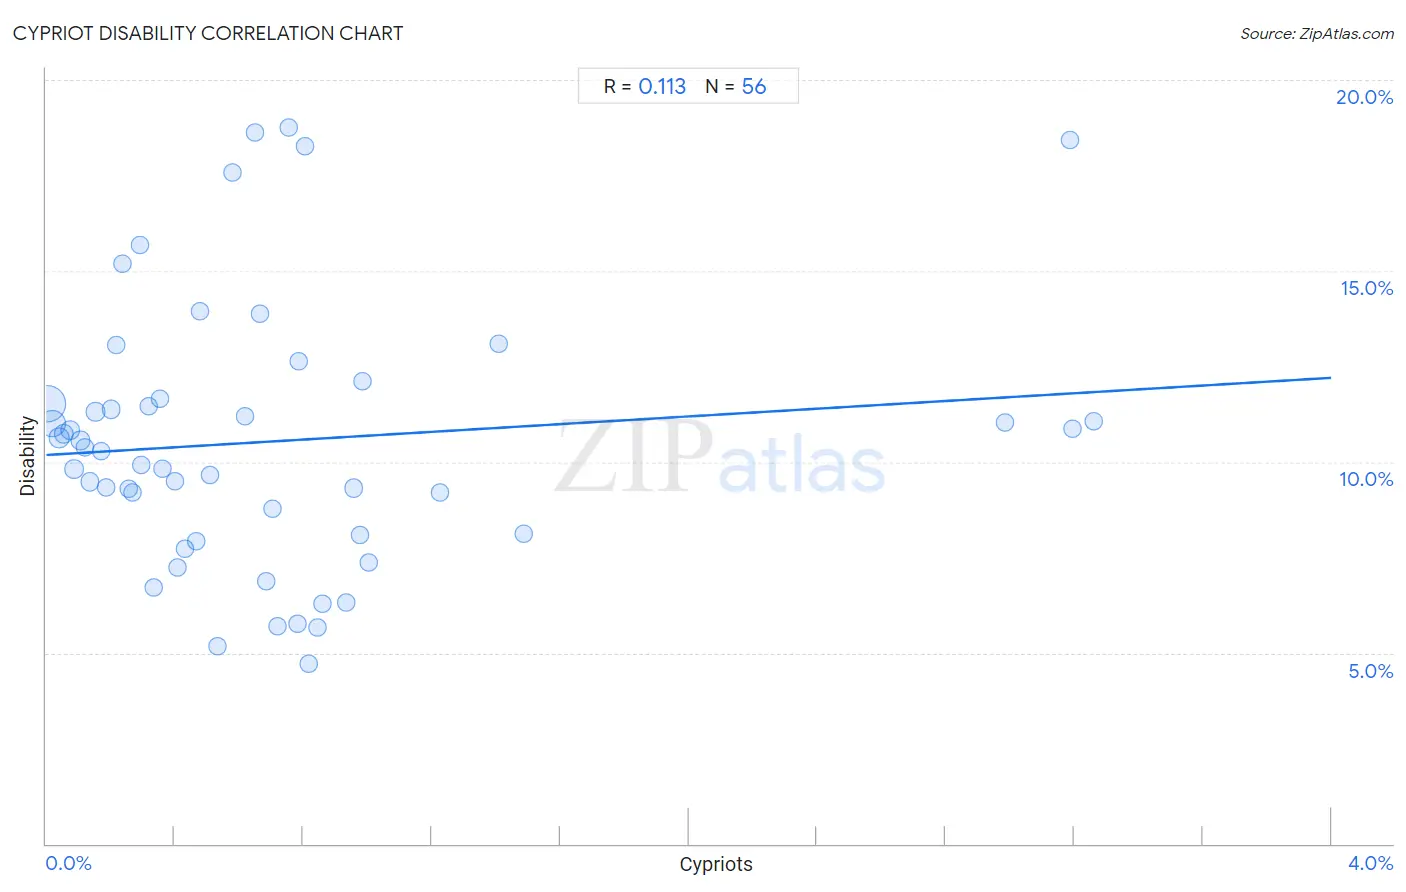
It is essential to understand that the correlation between the percentage of Cypriots and percentage of population with a disability does not imply a direct cause-and-effect relationship. It remains uncertain whether the presence of Cypriots influences an upward or downward trend in the level of percentage of population with a disability within an area, or if Cypriots simply ended up residing in those areas with higher or lower levels of percentage of population with a disability due to other factors.

Demographics Similar to Cypriots by Disability

In terms of disability, the demographic groups most similar to Cypriots are Argentinean (10.6%, a difference of 0.010%), Immigrants from Malaysia (10.6%, a difference of 0.060%), Egyptian (10.6%, a difference of 0.13%), Immigrants from Argentina (10.6%, a difference of 0.26%), and Immigrants from Turkey (10.6%, a difference of 0.41%).
DemographicsRating | RankDisability
Immigrants from Venezuela
100.0
/100
|
#20
Exceptional
10.4%
Asians
100.0
/100
|
#21
Exceptional
10.4%
Immigrants from Sri Lanka
100.0
/100
|
#22
Exceptional
10.5%
Immigrants from Asia
100.0
/100
|
#23
Exceptional
10.5%
Venezuelans
100.0
/100
|
#24
Exceptional
10.5%
Immigrants from Malaysia
100.0
/100
|
#25
Exceptional
10.6%
Argentineans
100.0
/100
|
#26
Exceptional
10.6%
Cypriots
100.0
/100
|
#27
Exceptional
10.6%
Egyptians
100.0
/100
|
#28
Exceptional
10.6%
Immigrants from Argentina
100.0
/100
|
#29
Exceptional
10.6%
Immigrants from Turkey
100.0
/100
|
#30
Exceptional
10.6%
Immigrants from Egypt
100.0
/100
|
#31
Exceptional
10.6%
Paraguayans
100.0
/100
|
#32
Exceptional
10.6%
Immigrants from Kuwait
100.0
/100
|
#33
Exceptional
10.7%
Immigrants from Ethiopia
100.0
/100
|
#34
Exceptional
10.7%

Cypriot Disability Correlation Summary

MeasurementCypriot DataDisability Data
Minimum0.0054%4.7%
Maximum3.3%18.7%
Range3.3%14.0%
Mean0.70%10.5%
Median0.49%10.3%
Interquartile 25% (IQ1)0.23%8.1%
Interquartile 75% (IQ3)0.83%11.6%
Interquartile Range (IQR)0.60%3.5%
Standard Deviation (Sample)0.77%3.5%
Standard Deviation (Population)0.77%3.4%

Correlation Details

Cypriot PercentileSample SizeDisability
[
0.0%
-
0.5%
]
0.0054%
33,992,20011.5%
[
0.0%
-
0.5%
]
0.020%
16,345,50911.0%
[
0.0%
-
0.5%
]
0.040%
3,122,89910.6%
[
0.0%
-
0.5%
]
0.056%
2,025,94910.7%
[
0.0%
-
0.5%
]
0.073%
1,660,90010.8%
[
0.0%
-
0.5%
]
0.087%
948,5169.8%
[
0.0%
-
0.5%
]
0.11%
605,70010.6%
[
0.0%
-
0.5%
]
0.12%
475,90610.4%
[
0.0%
-
0.5%
]
0.14%
338,1369.5%
[
0.0%
-
0.5%
]
0.15%
323,40211.3%
[
0.0%
-
0.5%
]
0.17%
297,25810.3%
[
0.0%
-
0.5%
]
0.19%
252,8019.3%
[
0.0%
-
0.5%
]
0.20%
237,75211.4%
[
0.0%
-
0.5%
]
0.22%
66,98413.1%
[
0.0%
-
0.5%
]
0.24%
114,97715.2%
[
0.0%
-
0.5%
]
0.26%
52,2849.3%
[
0.0%
-
0.5%
]
0.27%
88,7139.2%
[
0.0%
-
0.5%
]
0.29%
30,77315.7%
[
0.0%
-
0.5%
]
0.30%
138,3349.9%
[
0.0%
-
0.5%
]
0.32%
75,90311.5%
[
0.0%
-
0.5%
]
0.34%
27,0396.7%
[
0.0%
-
0.5%
]
0.35%
82,29011.7%
[
0.0%
-
0.5%
]
0.36%
31,4469.8%
[
0.0%
-
0.5%
]
0.40%
74,3199.5%
[
0.0%
-
0.5%
]
0.41%
16,8187.2%
[
0.0%
-
0.5%
]
0.43%
36,9147.7%
[
0.0%
-
0.5%
]
0.47%
23,0857.9%
[
0.0%
-
0.5%
]
0.48%
71,90113.9%
[
0.5%
-
1.0%
]
0.51%
22,5109.7%
[
0.5%
-
1.0%
]
0.53%
1,3125.2%
[
0.5%
-
1.0%
]
0.58%
3,62617.6%
[
0.5%
-
1.0%
]
0.62%
13,06411.2%
[
0.5%
-
1.0%
]
0.65%
9,23418.6%
[
0.5%
-
1.0%
]
0.67%
6,44413.9%
[
0.5%
-
1.0%
]
0.68%
2,3376.9%
[
0.5%
-
1.0%
]
0.71%
36,0288.8%
[
0.5%
-
1.0%
]
0.72%
5,1405.7%
[
0.5%
-
1.0%
]
0.76%
3,04018.7%
[
0.5%
-
1.0%
]
0.78%
2,0505.8%
[
0.5%
-
1.0%
]
0.79%
12,18612.6%
[
0.5%
-
1.0%
]
0.80%
7,45818.3%
[
0.5%
-
1.0%
]
0.82%
8,0964.7%
[
0.5%
-
1.0%
]
0.84%
18,7485.7%
[
0.5%
-
1.0%
]
0.86%
10,6946.3%
[
0.5%
-
1.0%
]
0.93%
9,4136.3%
[
0.5%
-
1.0%
]
0.96%
36,8429.3%
[
0.5%
-
1.0%
]
0.98%
7168.1%
[
0.5%
-
1.0%
]
0.98%
4,26812.1%
[
1.0%
-
1.5%
]
1.00%
57,0467.4%
[
1.0%
-
1.5%
]
1.23%
1639.2%
[
1.0%
-
1.5%
]
1.41%
3,12813.1%
[
1.0%
-
1.5%
]
1.48%
17,1108.1%
[
2.5%
-
3.0%
]
2.99%
11,78811.0%
[
3.0%
-
3.5%
]
3.19%
91018.4%
[
3.0%
-
3.5%
]
3.20%
2,84710.9%
[
3.0%
-
3.5%
]
3.26%
2,79211.1%