Zip Codes with the Highest Percentage of Population with a Degree in Visual and Performing Arts in Parker, CO
RELATED REPORTS & OPTIONS
Visual and Performing Arts
Parker
Compare Zip Codes
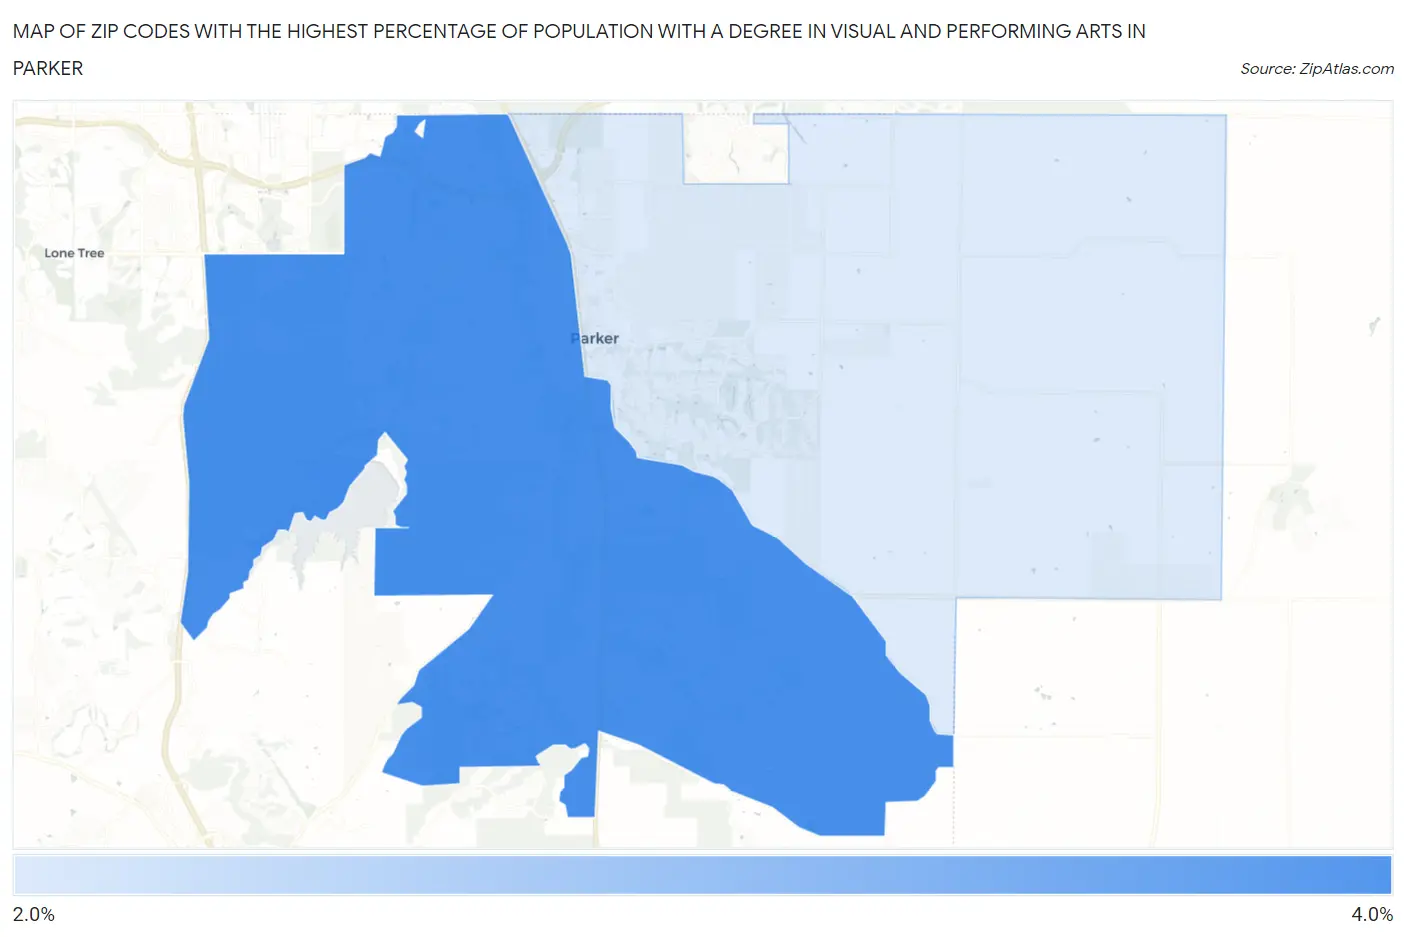
Map of Zip Codes with the Highest Percentage of Population with a Degree in Visual and Performing Arts in Parker
2.3%
3.3%
Zip Codes with the Highest Percentage of Population with a Degree in Visual and Performing Arts in Parker, CO
| Zip Code | % Graduates | vs State | vs National | |
| 1. | 80134 | 3.3% | 4.3%(-0.989)#222 | 4.3%(-0.914)#11,463 |
| 2. | 80138 | 2.3% | 4.3%(-1.99)#281 | 4.3%(-1.92)#15,230 |
1
Common Questions
What are the Top Zip Codes with the Highest Percentage of Population with a Degree in Visual and Performing Arts in Parker, CO?
Top Zip Codes with the Highest Percentage of Population with a Degree in Visual and Performing Arts in Parker, CO are:
What zip code has the Highest Percentage of Population with a Degree in Visual and Performing Arts in Parker, CO?
80134 has the Highest Percentage of Population with a Degree in Visual and Performing Arts in Parker, CO with 3.3%.
What is the Percentage of Population with a Degree in Visual and Performing Arts in Parker, CO?
Percentage of Population with a Degree in Visual and Performing Arts in Parker is 2.9%.
What is the Percentage of Population with a Degree in Visual and Performing Arts in Colorado?
Percentage of Population with a Degree in Visual and Performing Arts in Colorado is 4.3%.
What is the Percentage of Population with a Degree in Visual and Performing Arts in the United States?
Percentage of Population with a Degree in Visual and Performing Arts in the United States is 4.3%.