Zip Codes with the Highest Percentage of Population Employed in Health Diagnosing & Treating in Parker, CO
RELATED REPORTS & OPTIONS
Health Diagnosing & Treating
Parker
Compare Zip Codes
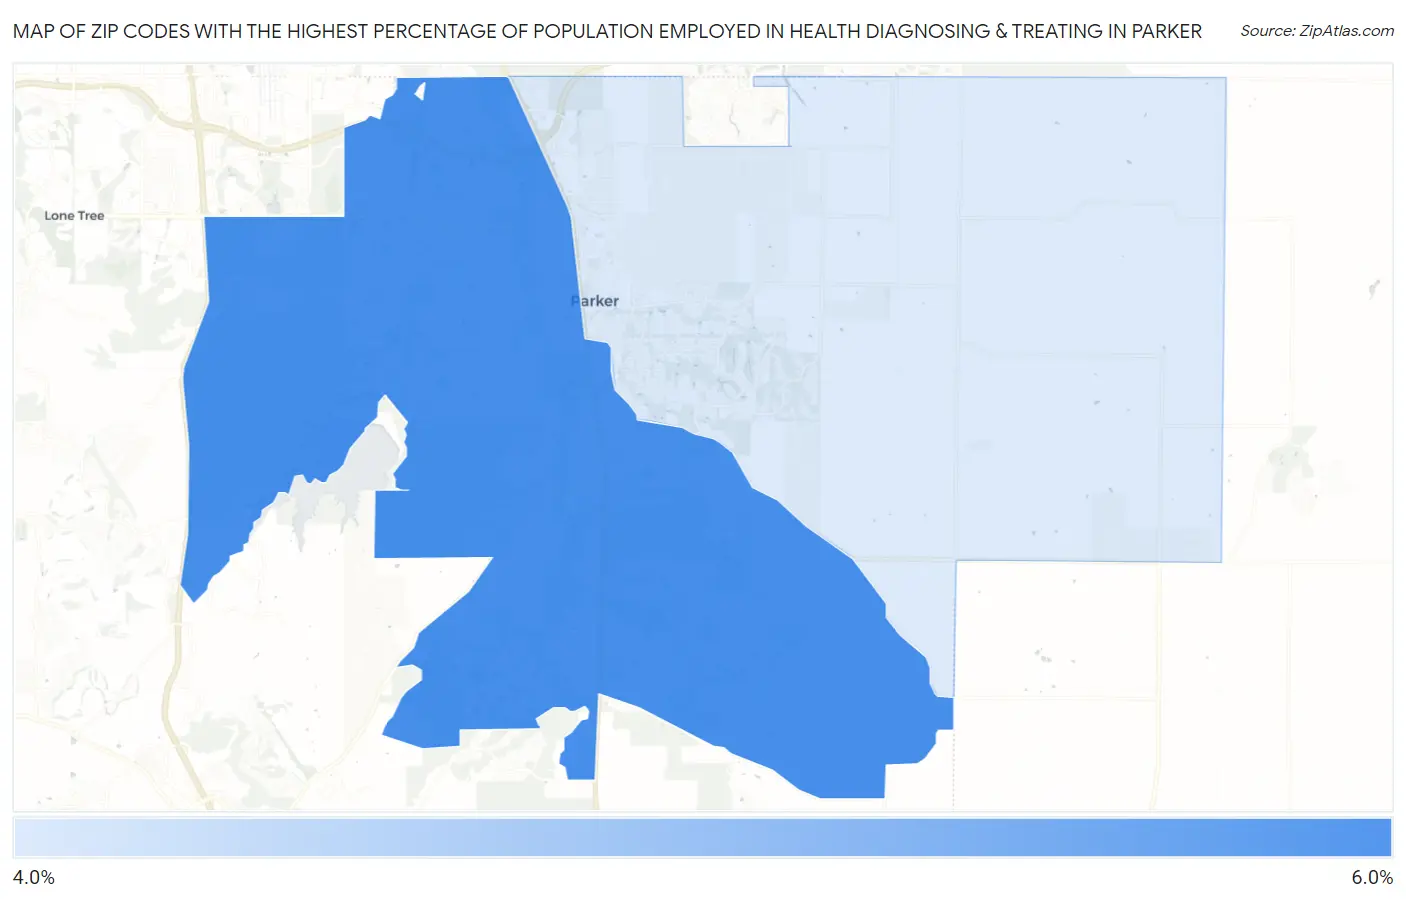
Map of Zip Codes with the Highest Percentage of Population Employed in Health Diagnosing & Treating in Parker
4.8%
5.5%
Zip Codes with the Highest Percentage of Population Employed in Health Diagnosing & Treating in Parker, CO
| Zip Code | % Employed | vs State | vs National | |
| 1. | 80134 | 5.5% | 5.8%(-0.277)#217 | 6.2%(-0.714)#15,672 |
| 2. | 80138 | 4.8% | 5.8%(-0.960)#260 | 6.2%(-1.40)#18,302 |
1
Common Questions
What are the Top Zip Codes with the Highest Percentage of Population Employed in Health Diagnosing & Treating in Parker, CO?
Top Zip Codes with the Highest Percentage of Population Employed in Health Diagnosing & Treating in Parker, CO are:
What zip code has the Highest Percentage of Population Employed in Health Diagnosing & Treating in Parker, CO?
80134 has the Highest Percentage of Population Employed in Health Diagnosing & Treating in Parker, CO with 5.5%.
What is the Percentage of Population Employed in Health Diagnosing & Treating in Parker, CO?
Percentage of Population Employed in Health Diagnosing & Treating in Parker is 5.2%.
What is the Percentage of Population Employed in Health Diagnosing & Treating in Colorado?
Percentage of Population Employed in Health Diagnosing & Treating in Colorado is 5.8%.
What is the Percentage of Population Employed in Health Diagnosing & Treating in the United States?
Percentage of Population Employed in Health Diagnosing & Treating in the United States is 6.2%.