Zip Codes with the Highest Percentage of Population Employed in Installation, Maintenance & Repair in Parker, CO
RELATED REPORTS & OPTIONS
Installation, Maintenance & Repair
Parker
Compare Zip Codes
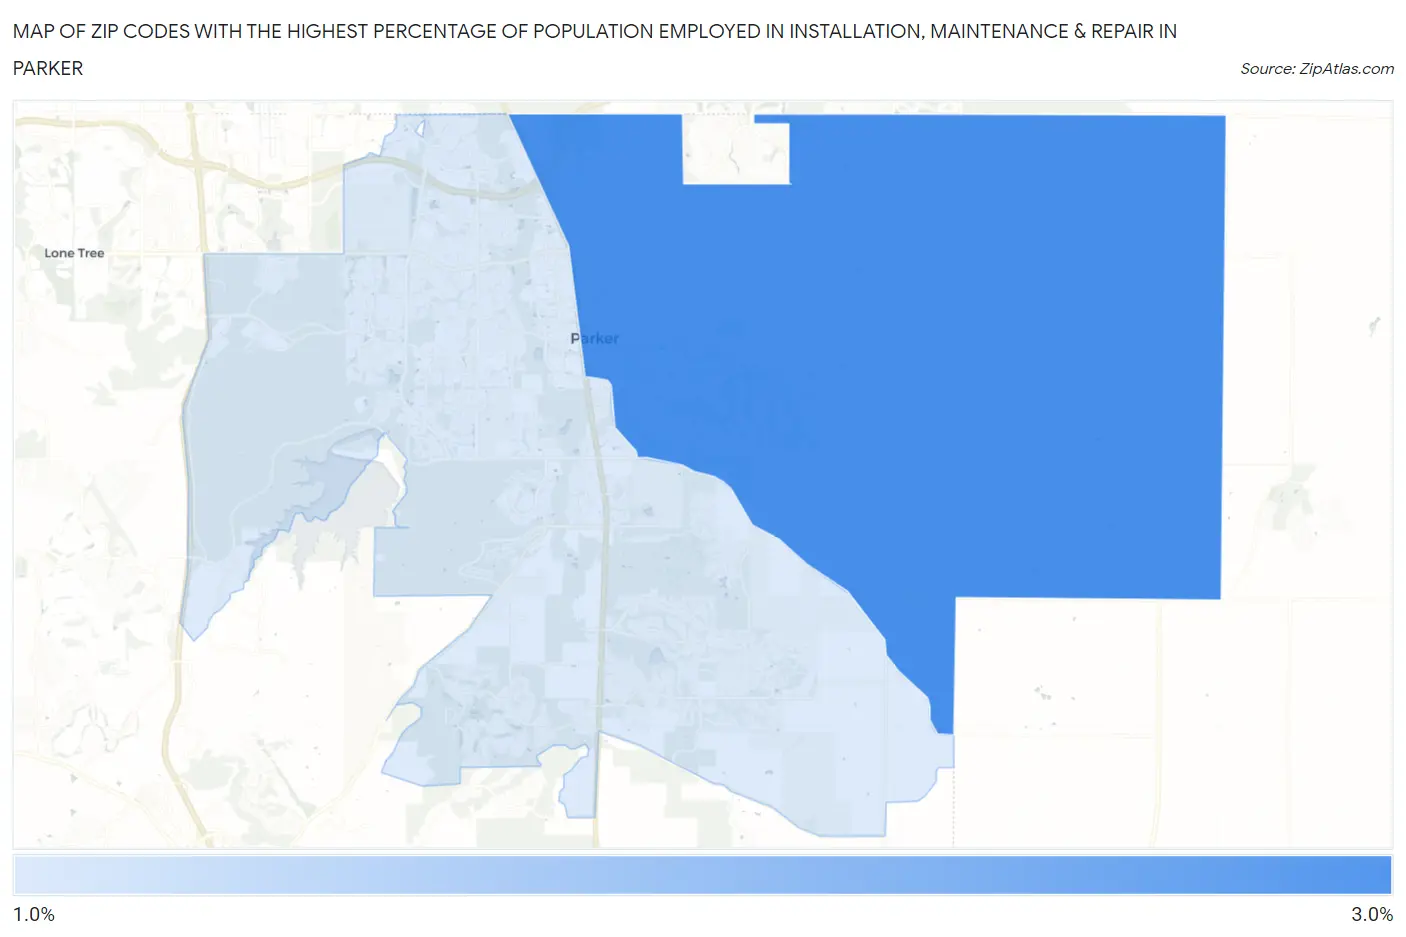
Map of Zip Codes with the Highest Percentage of Population Employed in Installation, Maintenance & Repair in Parker
1.8%
3.0%
Zip Codes with the Highest Percentage of Population Employed in Installation, Maintenance & Repair in Parker, CO
| Zip Code | % Employed | vs State | vs National | |
| 1. | 80138 | 3.0% | 2.8%(+0.147)#226 | 3.1%(-0.099)#17,145 |
| 2. | 80134 | 1.8% | 2.8%(-1.03)#320 | 3.1%(-1.27)#22,914 |
1
Common Questions
What are the Top Zip Codes with the Highest Percentage of Population Employed in Installation, Maintenance & Repair in Parker, CO?
Top Zip Codes with the Highest Percentage of Population Employed in Installation, Maintenance & Repair in Parker, CO are:
What zip code has the Highest Percentage of Population Employed in Installation, Maintenance & Repair in Parker, CO?
80138 has the Highest Percentage of Population Employed in Installation, Maintenance & Repair in Parker, CO with 3.0%.
What is the Percentage of Population Employed in Installation, Maintenance & Repair in Parker, CO?
Percentage of Population Employed in Installation, Maintenance & Repair in Parker is 1.9%.
What is the Percentage of Population Employed in Installation, Maintenance & Repair in Colorado?
Percentage of Population Employed in Installation, Maintenance & Repair in Colorado is 2.8%.
What is the Percentage of Population Employed in Installation, Maintenance & Repair in the United States?
Percentage of Population Employed in Installation, Maintenance & Repair in the United States is 3.1%.