Zip Codes with the Highest Percentage of Population Employed in Security & Protection in Parker, CO
RELATED REPORTS & OPTIONS
Security & Protection
Parker
Compare Zip Codes
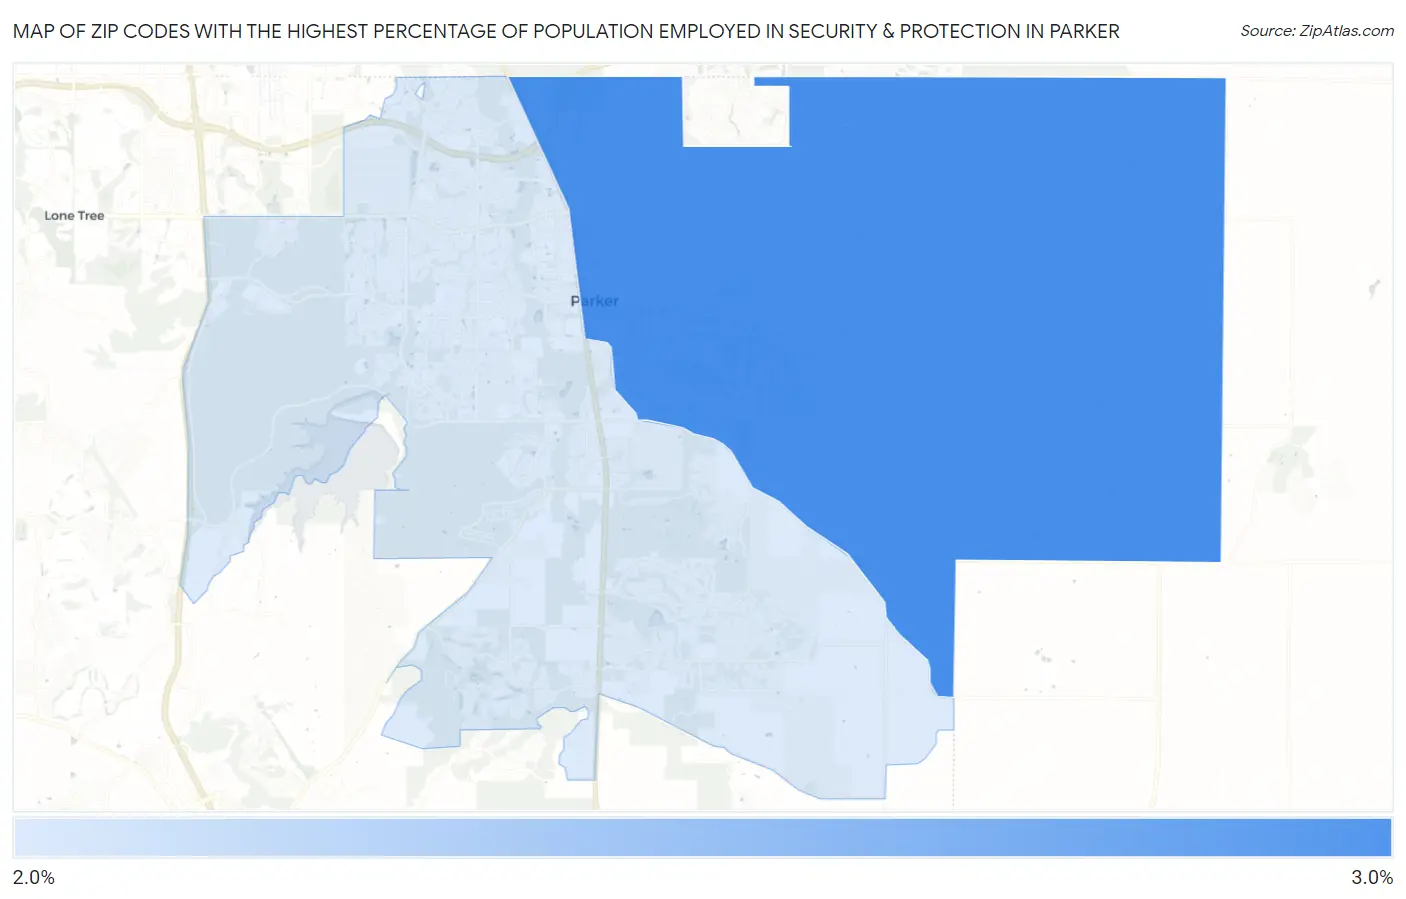
Map of Zip Codes with the Highest Percentage of Population Employed in Security & Protection in Parker
2.6%
2.6%
Zip Codes with the Highest Percentage of Population Employed in Security & Protection in Parker, CO
| Zip Code | % Employed | vs State | vs National | |
| 1. | 80138 | 2.6% | 2.0%(+0.619)#133 | 2.1%(+0.476)#8,901 |
| 2. | 80134 | 2.6% | 2.0%(+0.562)#141 | 2.1%(+0.418)#9,175 |
1
Common Questions
What are the Top Zip Codes with the Highest Percentage of Population Employed in Security & Protection in Parker, CO?
Top Zip Codes with the Highest Percentage of Population Employed in Security & Protection in Parker, CO are:
What zip code has the Highest Percentage of Population Employed in Security & Protection in Parker, CO?
80138 has the Highest Percentage of Population Employed in Security & Protection in Parker, CO with 2.6%.
What is the Percentage of Population Employed in Security & Protection in Parker, CO?
Percentage of Population Employed in Security & Protection in Parker is 3.1%.
What is the Percentage of Population Employed in Security & Protection in Colorado?
Percentage of Population Employed in Security & Protection in Colorado is 2.0%.
What is the Percentage of Population Employed in Security & Protection in the United States?
Percentage of Population Employed in Security & Protection in the United States is 2.1%.