Zip Codes with the Highest Percentage of Population Employed in Food Preparation & Serving in Parker, CO
RELATED REPORTS & OPTIONS
Food Preparation & Serving
Parker
Compare Zip Codes
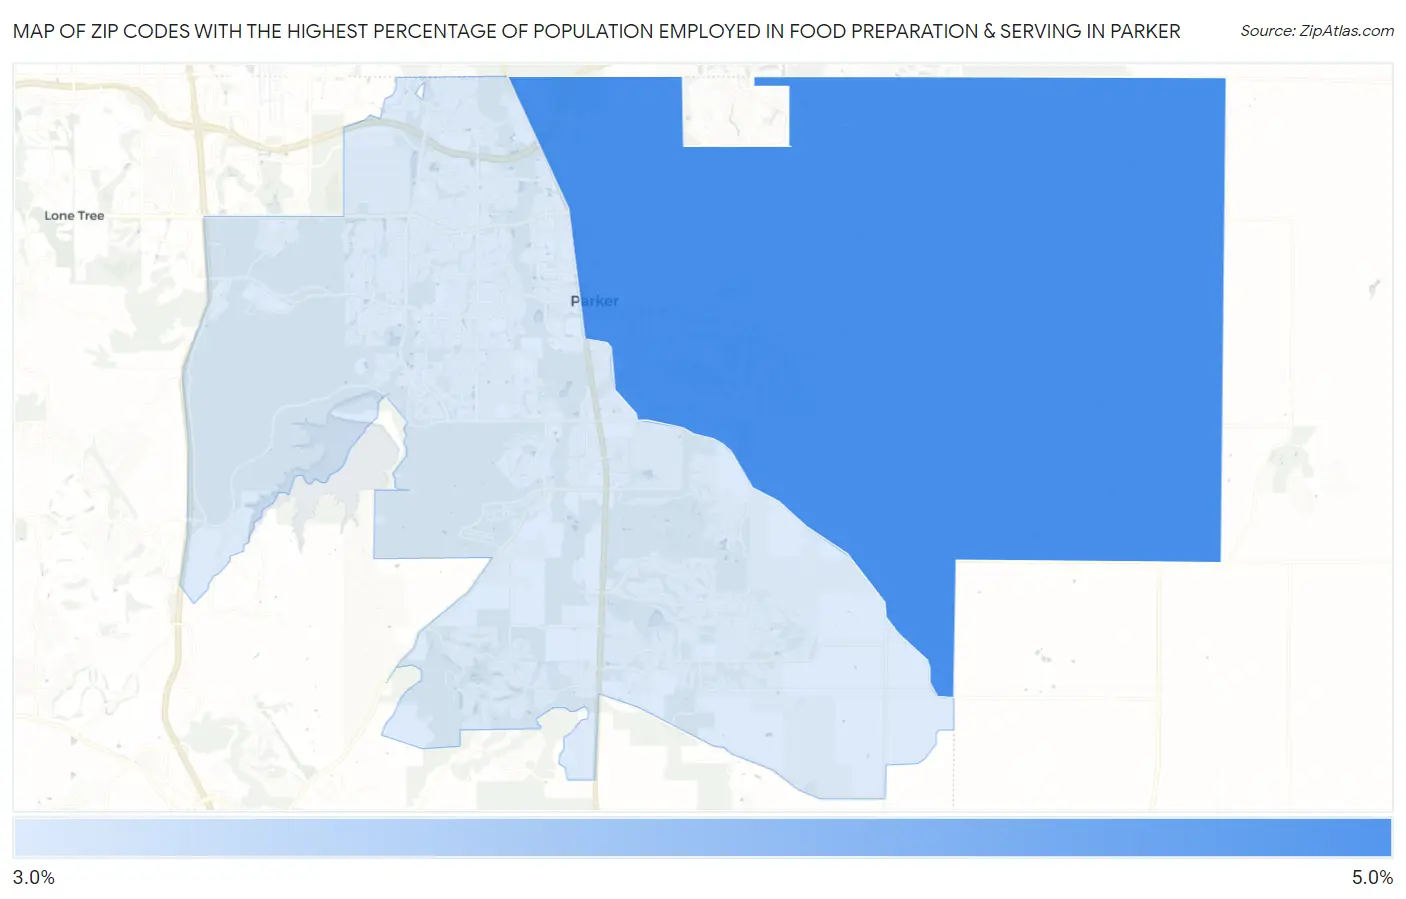
Map of Zip Codes with the Highest Percentage of Population Employed in Food Preparation & Serving in Parker
3.3%
4.9%
Zip Codes with the Highest Percentage of Population Employed in Food Preparation & Serving in Parker, CO
| Zip Code | % Employed | vs State | vs National | |
| 1. | 80138 | 4.9% | 5.2%(-0.289)#202 | 5.3%(-0.393)#13,385 |
| 2. | 80134 | 3.3% | 5.2%(-1.86)#298 | 5.3%(-1.96)#19,958 |
1
Common Questions
What are the Top Zip Codes with the Highest Percentage of Population Employed in Food Preparation & Serving in Parker, CO?
Top Zip Codes with the Highest Percentage of Population Employed in Food Preparation & Serving in Parker, CO are:
What zip code has the Highest Percentage of Population Employed in Food Preparation & Serving in Parker, CO?
80138 has the Highest Percentage of Population Employed in Food Preparation & Serving in Parker, CO with 4.9%.
What is the Percentage of Population Employed in Food Preparation & Serving in Parker, CO?
Percentage of Population Employed in Food Preparation & Serving in Parker is 4.2%.
What is the Percentage of Population Employed in Food Preparation & Serving in Colorado?
Percentage of Population Employed in Food Preparation & Serving in Colorado is 5.2%.
What is the Percentage of Population Employed in Food Preparation & Serving in the United States?
Percentage of Population Employed in Food Preparation & Serving in the United States is 5.3%.