Zip Codes with the Highest Percentage of Population with a Degree in Psychology in Parker, CO
RELATED REPORTS & OPTIONS
Psychology
Parker
Compare Zip Codes
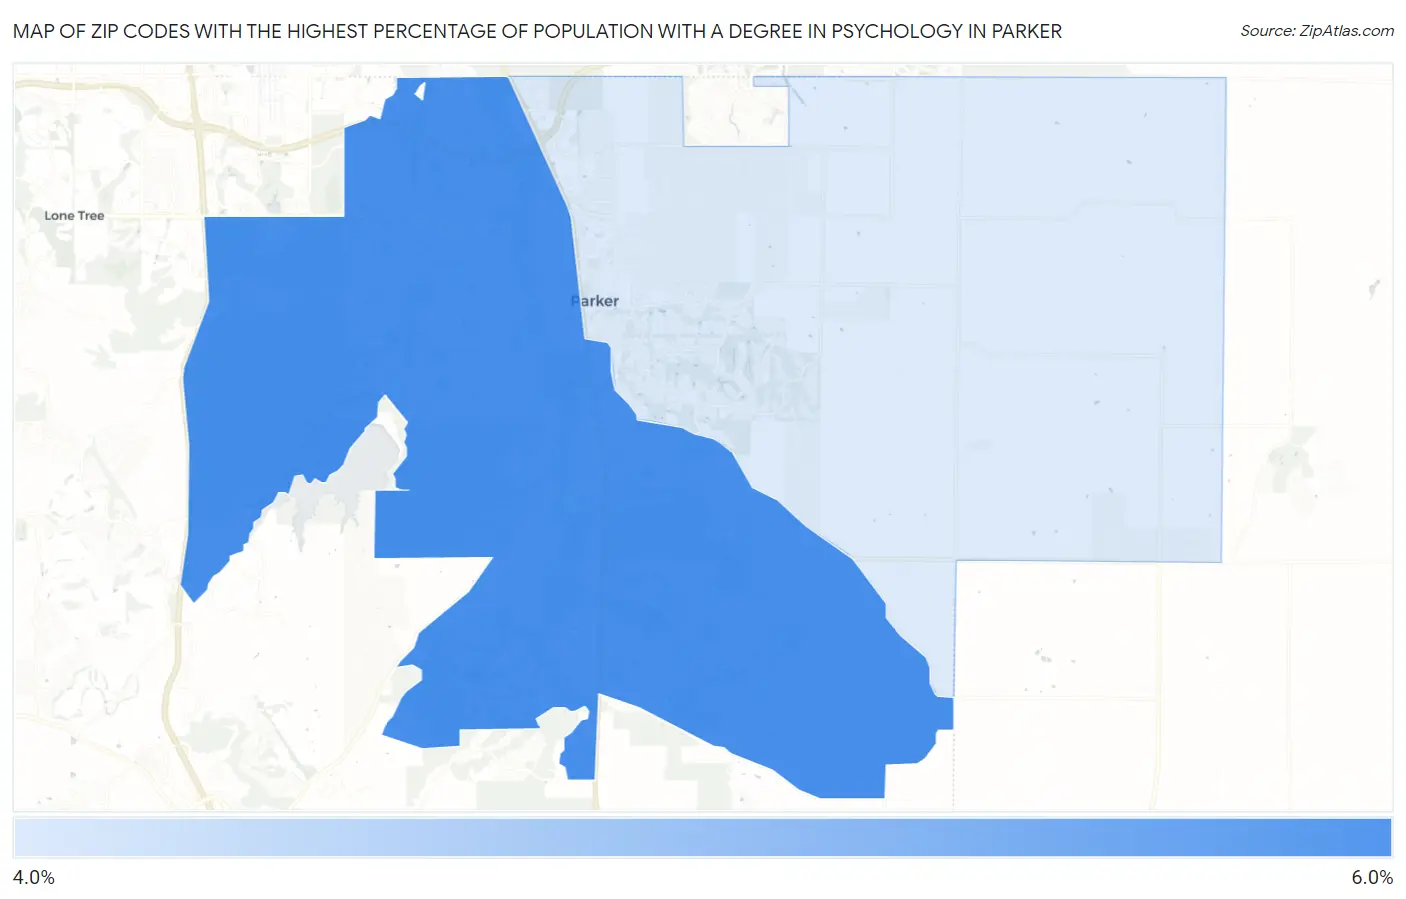
Map of Zip Codes with the Highest Percentage of Population with a Degree in Psychology in Parker
4.6%
5.3%
Zip Codes with the Highest Percentage of Population with a Degree in Psychology in Parker, CO
| Zip Code | % Graduates | vs State | vs National | |
| 1. | 80134 | 5.3% | 5.6%(-0.246)#209 | 5.1%(+0.271)#10,090 |
| 2. | 80138 | 4.6% | 5.6%(-0.983)#253 | 5.1%(-0.466)#12,780 |
1
Common Questions
What are the Top Zip Codes with the Highest Percentage of Population with a Degree in Psychology in Parker, CO?
Top Zip Codes with the Highest Percentage of Population with a Degree in Psychology in Parker, CO are:
What zip code has the Highest Percentage of Population with a Degree in Psychology in Parker, CO?
80134 has the Highest Percentage of Population with a Degree in Psychology in Parker, CO with 5.3%.
What is the Percentage of Population with a Degree in Psychology in Parker, CO?
Percentage of Population with a Degree in Psychology in Parker is 4.7%.
What is the Percentage of Population with a Degree in Psychology in Colorado?
Percentage of Population with a Degree in Psychology in Colorado is 5.6%.
What is the Percentage of Population with a Degree in Psychology in the United States?
Percentage of Population with a Degree in Psychology in the United States is 5.1%.