Zip Codes with the Highest Percentage of Population Employed in Office & Administration in Parker, CO
RELATED REPORTS & OPTIONS
Office & Administration
Parker
Compare Zip Codes
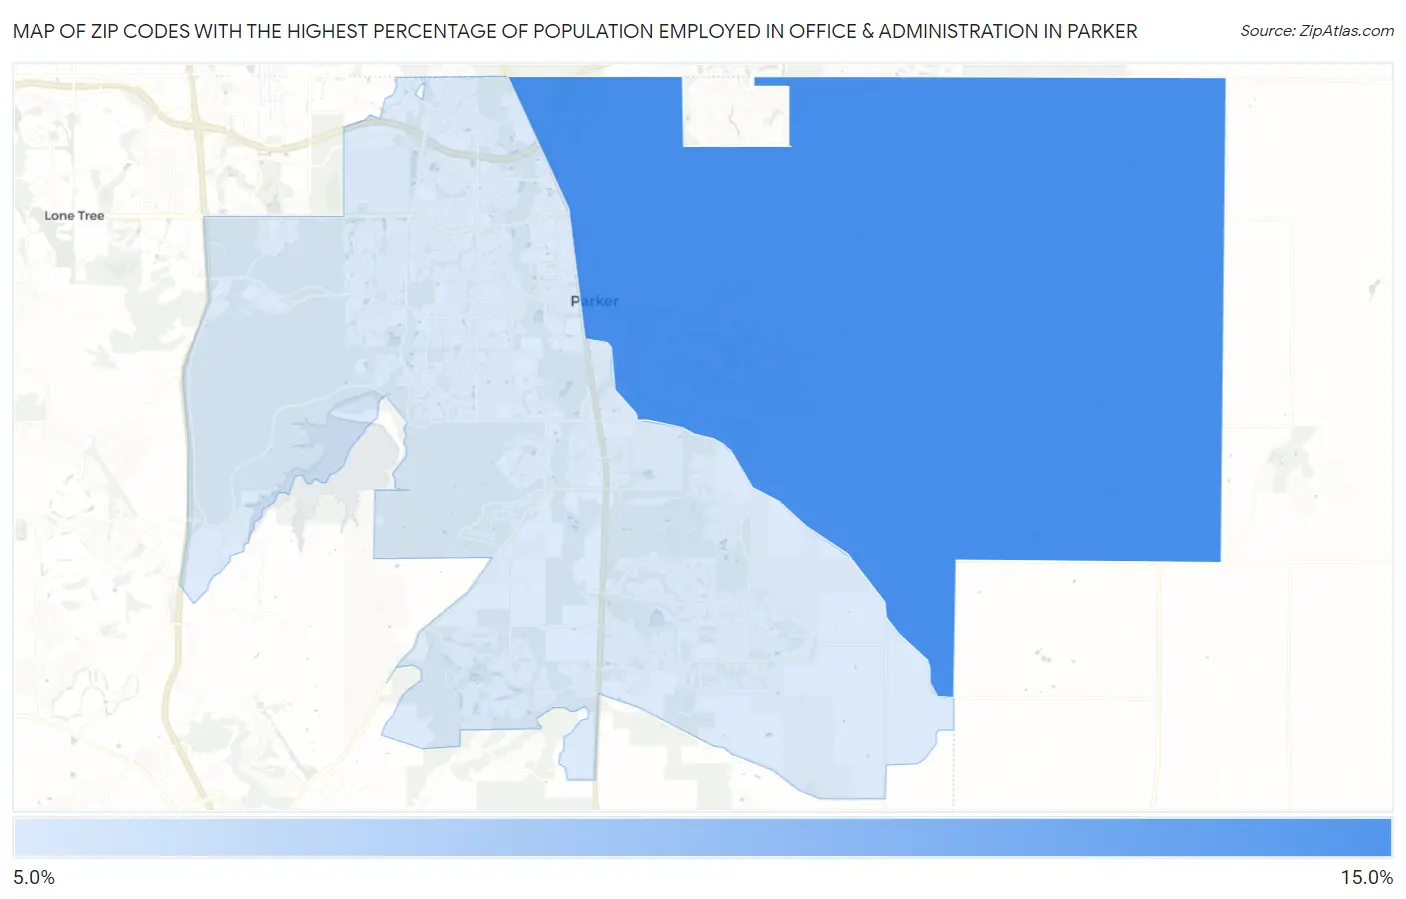
Map of Zip Codes with the Highest Percentage of Population Employed in Office & Administration in Parker
10.5%
14.0%
Zip Codes with the Highest Percentage of Population Employed in Office & Administration in Parker, CO
| Zip Code | % Employed | vs State | vs National | |
| 1. | 80138 | 14.0% | 10.1%(+3.85)#81 | 10.9%(+3.12)#6,049 |
| 2. | 80134 | 10.5% | 10.1%(+0.389)#192 | 10.9%(-0.337)#15,405 |
1
Common Questions
What are the Top Zip Codes with the Highest Percentage of Population Employed in Office & Administration in Parker, CO?
Top Zip Codes with the Highest Percentage of Population Employed in Office & Administration in Parker, CO are:
What zip code has the Highest Percentage of Population Employed in Office & Administration in Parker, CO?
80138 has the Highest Percentage of Population Employed in Office & Administration in Parker, CO with 14.0%.
What is the Percentage of Population Employed in Office & Administration in Parker, CO?
Percentage of Population Employed in Office & Administration in Parker is 11.9%.
What is the Percentage of Population Employed in Office & Administration in Colorado?
Percentage of Population Employed in Office & Administration in Colorado is 10.1%.
What is the Percentage of Population Employed in Office & Administration in the United States?
Percentage of Population Employed in Office & Administration in the United States is 10.9%.