Zip Codes with the Highest Percentage of Households Without a Vehicle in Kansas City, KS
RELATED REPORTS & OPTIONS
Households without a Cars
Kansas City
Compare Zip Codes
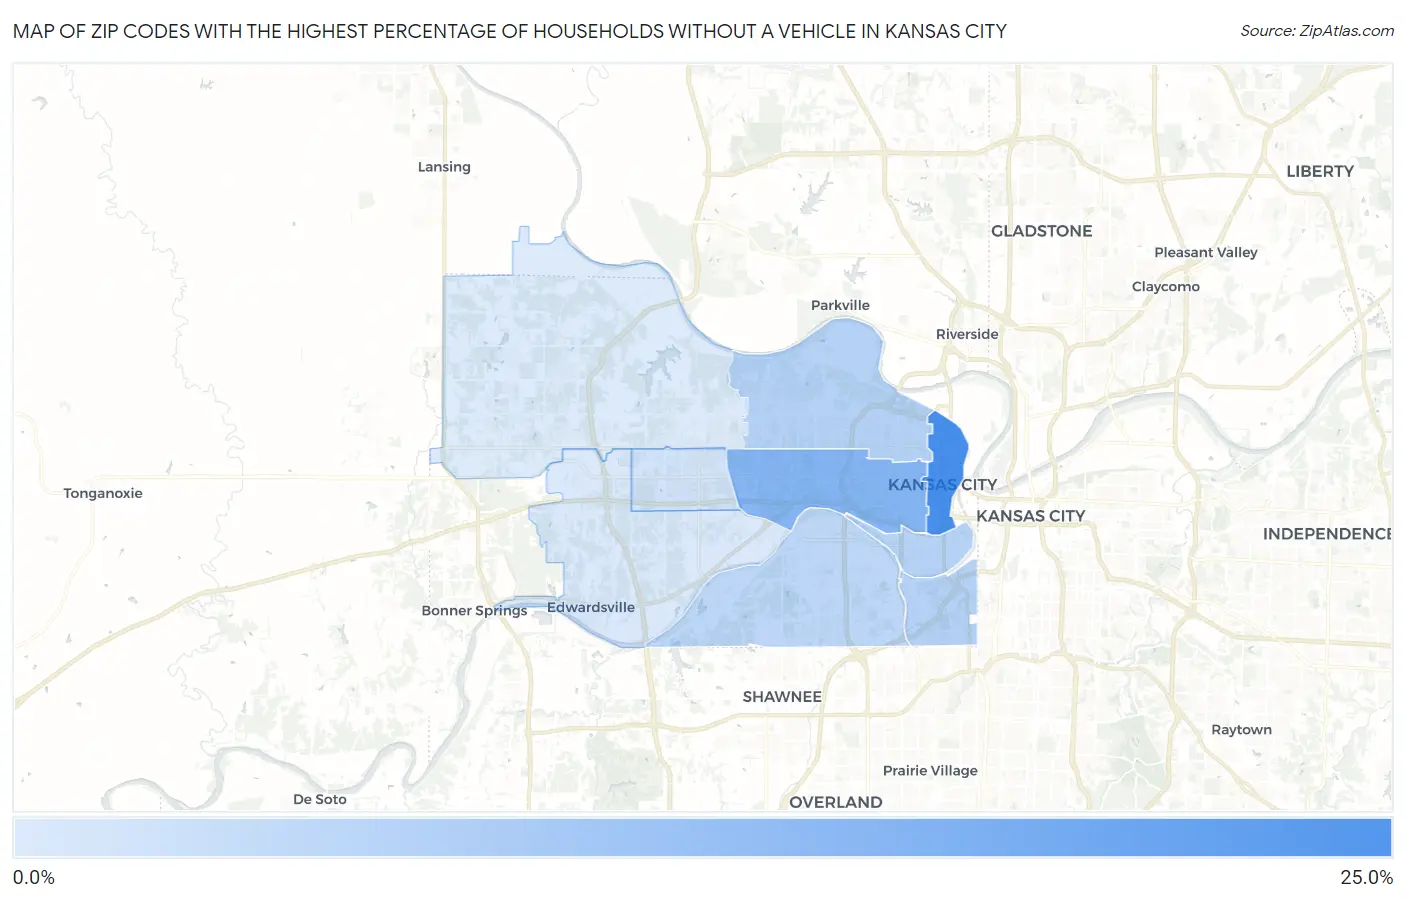
Map of Zip Codes with the Highest Percentage of Households Without a Vehicle in Kansas City
3.2%
20.6%
Zip Codes with the Highest Percentage of Households Without a Vehicle in Kansas City, KS
| Zip Code | Housholds Without a Car | vs State | vs National | |
| 1. | 66101 | 20.6% | 5.1%(+15.5)#9 | 8.3%(+12.3)#1,430 |
| 2. | 66102 | 13.0% | 5.1%(+7.90)#18 | 8.3%(+4.70)#3,089 |
| 3. | 66104 | 7.6% | 5.1%(+2.50)#80 | 8.3%(-0.700)#7,550 |
| 4. | 66103 | 7.5% | 5.1%(+2.40)#85 | 8.3%(-0.800)#7,735 |
| 5. | 66105 | 7.5% | 5.1%(+2.40)#87 | 8.3%(-0.800)#7,797 |
| 6. | 66106 | 6.7% | 5.1%(+1.60)#109 | 8.3%(-1.60)#9,037 |
| 7. | 66112 | 4.5% | 5.1%(-0.600)#211 | 8.3%(-3.80)#14,247 |
| 8. | 66111 | 3.4% | 5.1%(-1.70)#275 | 8.3%(-4.90)#17,707 |
| 9. | 66109 | 3.2% | 5.1%(-1.90)#288 | 8.3%(-5.10)#18,351 |
1
Common Questions
What are the Top 5 Zip Codes with the Highest Percentage of Households Without a Vehicle in Kansas City, KS?
Top 5 Zip Codes with the Highest Percentage of Households Without a Vehicle in Kansas City, KS are:
What zip code has the Highest Percentage of Households Without a Vehicle in Kansas City, KS?
66101 has the Highest Percentage of Households Without a Vehicle in Kansas City, KS with 20.6%.
What is the Percentage of Households Without a Vehicle in Kansas City, KS?
Percentage of Households Without a Vehicle in Kansas City is 8.3%.
What is the Percentage of Households Without a Vehicle in Kansas?
Percentage of Households Without a Vehicle in Kansas is 5.1%.
What is the Percentage of Households Without a Vehicle in the United States?
Percentage of Households Without a Vehicle in the United States is 8.3%.