Zip Codes with the Highest Percentage of Households Without a Vehicle in Hutchinson, KS
RELATED REPORTS & OPTIONS
Households without a Cars
Hutchinson
Compare Zip Codes
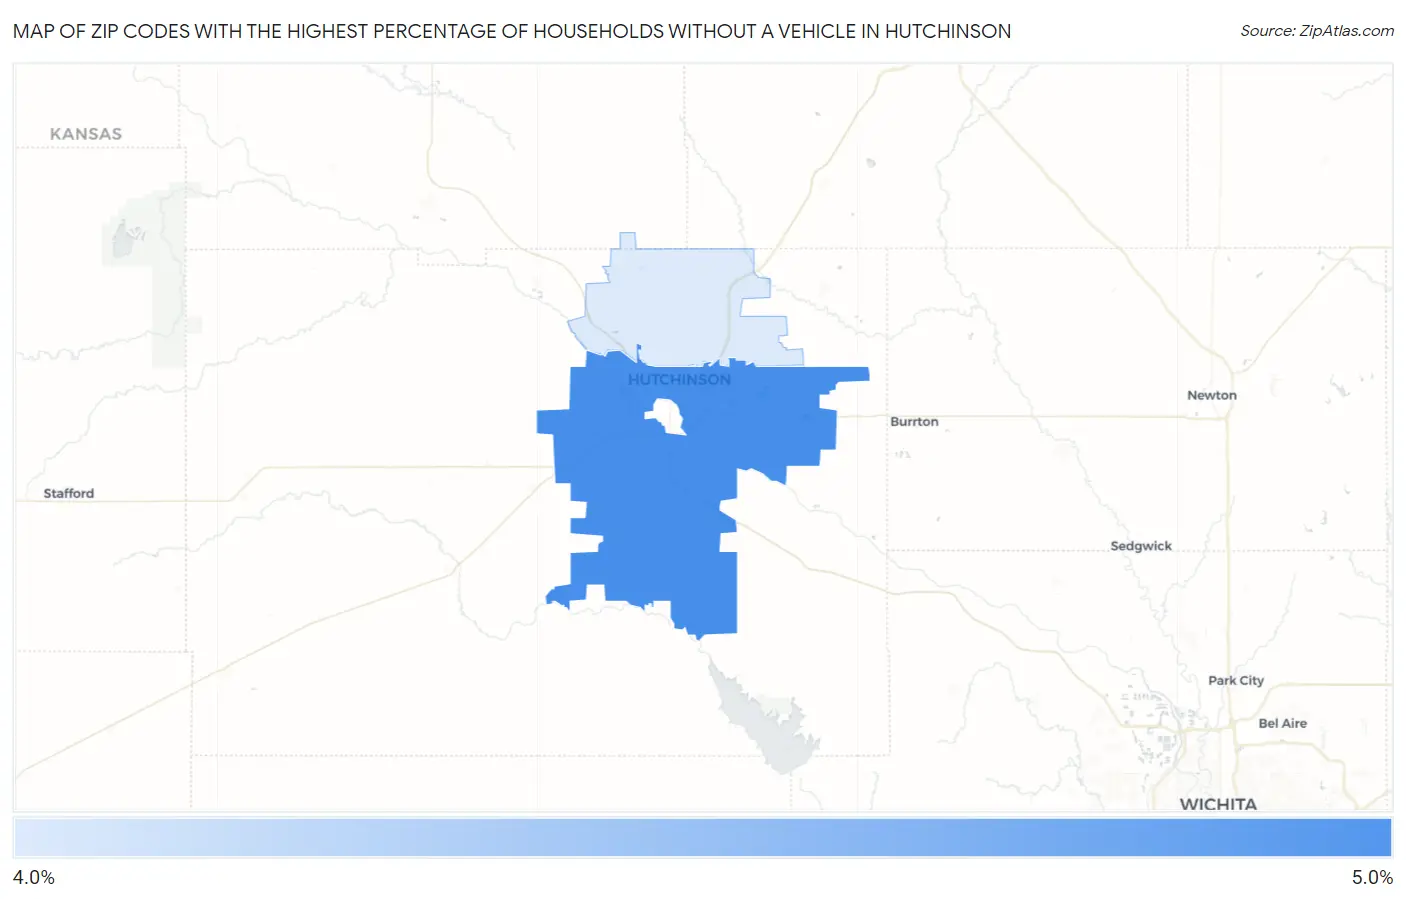
Map of Zip Codes with the Highest Percentage of Households Without a Vehicle in Hutchinson
4.2%
5.0%
Zip Codes with the Highest Percentage of Households Without a Vehicle in Hutchinson, KS
| Zip Code | Housholds Without a Car | vs State | vs National | |
| 1. | 67501 | 5.0% | 5.1%(-0.100)#184 | 8.3%(-3.30)#12,865 |
| 2. | 67502 | 4.2% | 5.1%(-0.900)#233 | 8.3%(-4.10)#15,140 |
1
Common Questions
What are the Top Zip Codes with the Highest Percentage of Households Without a Vehicle in Hutchinson, KS?
Top Zip Codes with the Highest Percentage of Households Without a Vehicle in Hutchinson, KS are:
What zip code has the Highest Percentage of Households Without a Vehicle in Hutchinson, KS?
67501 has the Highest Percentage of Households Without a Vehicle in Hutchinson, KS with 5.0%.
What is the Percentage of Households Without a Vehicle in Hutchinson, KS?
Percentage of Households Without a Vehicle in Hutchinson is 5.0%.
What is the Percentage of Households Without a Vehicle in Kansas?
Percentage of Households Without a Vehicle in Kansas is 5.1%.
What is the Percentage of Households Without a Vehicle in the United States?
Percentage of Households Without a Vehicle in the United States is 8.3%.